
ABSTRACT
The intestine of parasitic nematodes has proven an important target for therapies aimed at prevention and treatment of diseases caused by these pathogens in humans, animals and plants. We have developed a unique research model with the intestine of Ascaris suum, the large round worm of swine and humans, that will enhance biological research on this tissue. To expand utility of this model, we quantitatively compared expression of 15,382 coding RNAs and 277 noncoding, micro RNAs (miRNAs) among 3 contiguous regions of the adult A. suum intestine. Differentially expressed transcripts were identified among regions, with the largest number expressed at significantly higher levels in the anterior region, identifying this region as the most functionally unique compared to middle and posterior regions. We further identified 64 exon splice variants (from 47 genes) that are differentially expressed among these regions. A total of 2,063 intestinal mRNA transcripts were predicted to be targeted by intestinal miRNA, and negative correlation coefficients for miRNA:mRNA abundances predicted 22 likely influential miRNAs and 503 likely associated miRNA:mRNA pairs. A. suum intestinal miRNAs were identified that are conserved with intestinal miRNAs from C. elegans (10 mature sequences and 13 seed sequences conserved), and prospective intestinal miRNAs from the murine gastrointestinal nematode, Heligmosomoides polygyrus (5 mature and 11 seeds). Most of the conserved intestinal miRNAs were also high abundance miRNAs. The data provide the most comprehensive compilation of constitutively and differentially expressed genes along the length of the intestine for any nematode species. The information will guide prospective development of many hypotheses on nematode intestinal functions encoded by mRNAs, miRNAs and interactions between these RNA populations.
Introduction
The intestine of parasitic nematodes appears to carry out many essential functions related to nutrient acquisition, reproduction, and host-parasite interactions, inclusive of synthesising molecules with potential for influencing the host immune responses during infections.Citation1-3 Biological characteristics apparently unique to the intestine of the parasite have also proven effective targets for therapeutic intervention of nematode infections in humans, food animals and plants. For instance, digestive peptidases have received much attention as vaccine candidates, especially for haematophagous parasites, such as Haemonchus contortus in small ruminantsCitation4-6 and hookworms of humans and animals.Citation7 Benzimidazole anthelmintics induce cellular damage to intestinal cells of parasitic nematodes.Citation8-10 The intestinal damage is most pronounced in cells located in the anterior intestinal region of H. contortus, an effect postulated to reflect drug-induced displacement of digestive hydrolases to the cytoplasm of these intestinal cells.Citation10 In addition, crystal protein toxins of Bacillus thuringiensis have proven to have potential as novel anthelmintics against a broad range of parasitic nematodes. The apparent mechanism of these pore forming toxins involves disruption of apical intestinal membrane integrity.Citation11 In each case mentioned, characteristics that are unique to intestinal cells (e.g. production and secretion of digestive hydrolases, or accessibility to the apical intestinal membrane by ingested toxins) appear to explain the effects of the anthelmintic therapy. However, rigorous investigations to resolve mechanisms responsible for these effects have been hampered by the paucity of molecular and cellular details on intestinal cell functions in parasitic nematodes and limitations of experimental models. These obstacles also impede efforts to identify new intestinal cell targets of value toward treatment and control of parasitic nematode infections. The preferential destruction induced by fenbendazole treatment in the anterior region of the H. contortus intestineCitation10 suggests a differentiation of functions along regions of the nematode intestine and holds significance relative to anthelmintic approaches. Numerous observations document differential expression of genes among intestinal cells of the non-parasitic Caenorhabditis elegans.Citation12,13 However, systematic investigation on differentiation along the intestinal tract has not yet been accomplished for any nematode.
In this context, the Ascaris suum intestine has become recognized as a valuable research model, given the large size of the parasite (∼30 cm adult female), which provides experimental capabilities that are relatively unapproachable among the smaller parasitic species (most of them <1cm). For instance, transcriptomes have been compared among whole adult A. suum tissues,Citation14 which clarified genes and predicted proteins that are constitutively expressed among tissues, or preferentially expressed in the intestinal tissue. A. suum intestinal proteins were identified by liquid chromatography-tandem mass spectrometry (LC-MS/MS), inclusive of apparent peptidases and other hydrolases that are located in the intestinal lumen, on the apical intestinal membrane, or those presumptively secreted into the pseudocoelomic fluid of the body cavity.Citation15,16 Many of these proteins are expected to have specialized functions restricted to the intestine, and many showed preferential or exclusive expression in A. suum intestinal cells as compared to other tissues.Citation14 This information along with broader intestinal proteomics analysis has laid a solid foundation to investigate differential expression of the intestinal transcriptome along the length of the A. suum intestine.
In the research reported here, we compared gene expression among longitudinal thirds of the adult A. suum intestine using mRNA deep sequencing. Small RNA libraries were also generated and analyzed to detect microRNAs (miRNAs). miRNAs are important regulatory elements of gene expressionCitation17 that typically, but not exclusively,Citation17-19 inhibit gene expression by complementary-base pairing with the 3’ ends of mRNA targets (miRNA:mRNA), leading to transcript degradation within the RNA-induced silencing complex (RISCCitation20). Intestinal miRNA expression and their effect on target transcripts has been investigated in adult C. elegans.Citation21 However, similar to intestinal mRNAs, systematic analysis of differential miRNA expression among intestinal regions has not been accomplished for any nematode species. Nevertheless, miRNAs expressed during gametogenesis and early developmental stages of A. suum indicate that regulation of miRNA expression occurs during A. suum development.Citation22 Hence, miRNAs represent, along with other more conventional transcription factors, important elements likely to influence differential expression of genes among tissues and in variable physiological contexts of parasitic nematodes. More recently, it was suggested that miRNAs derived from the intestine of the murine intestinal nematode Heligmosomoides polygyrus modify host cellular responses during infection.Citation3 This observation, coupled with evidence of filarid miRNAs in host blood,Citation23 makes clarifying details of intestinal miRNAs from parasitic nematodes ever more important.
Our results provide a detailed accounting of intestinal transcripts (both protein-coding and micro-RNAs) that are constitutively or differentially expressed among longitudinal regions of the A. suum intestine, at an anatomical resolution not previously obtained for any nematode species. Likely influential miRNAs (LIMs) were predicted based on a correlation model with predicted gene transcript targets. The correlation model was also used to predict most likely associated miRNA-mRNA pairs (LAMPs). The results provide support that A. suum intestinal miRNAs are involved in regulating gene expression and diverse biological processes in intestinal cells. Collectively, the results clarify functions of the A. suum intestine that are constitutively expressed among regions or localized to a specific region(s) of the A. suum intestine. The data has application in deciphering functions of basic or specialized nature among intestinal cells and disrupting intestinal cell functions that are essential for the survival of A. suum and possibly other parasitic nematodes.
Results
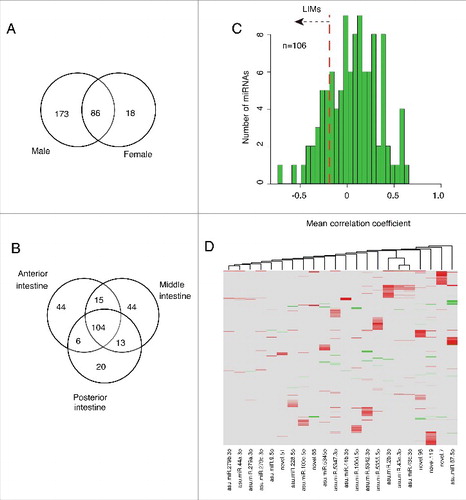
Samples of A. suum intestine were collected from contiguous longitudinal regions (anterior, middle, and posterior thirds of the whole intestine) and whole intestine of male and female A. suum (). Genome-wide gene expression profiles generated for each of 16 intestinal samples (8 female and 8 male) produced a total of ∼1.2 billion, 100 bp reads resulting in an average of 50 million clean reads per sample after analytical processing (). Total RNA from the same samples was used to generate 28.2 million, 36 bp sncRNA reads (on average 2.3 million reads per sample, ).
Figure 1. A. suum intestinal dissection and gender based comparison. (A) Schematic showing of the dissection scheme used to obtain intestinal sections for analysis. (B) Distribution of male and female intestinal genes. Detection was defined as having >50% breadth of coverage, regardless of the expression level. A large majority of genes was detected in both genders. (C) Female-exclusive genes tend to have comparatively lower expression level in the female as compared to genes shared with the male.
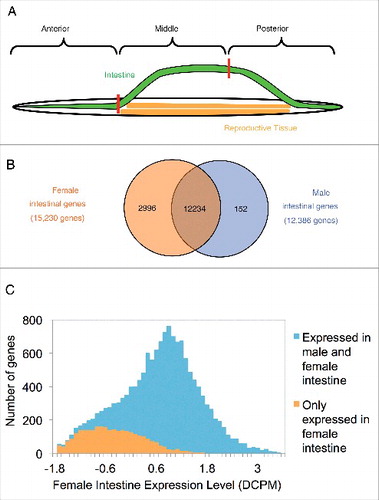
Table 1. Sample metadata and sequencing statistics.
Identification of previously unrecognized A. suum intestinal genes
A recent study on gene-expression among 10 different A. suum tissues identified 11,691 intestinal genes.Citation14 In the current study, transcript data from the intestinal regions and whole intestine confirmed intestinal expression of 10,004 of those genes in female and 10,696 in male, and further increased the number of detected intestinal genes to 15,230 and 12,386 from female and male intestines, respectively (). In total, 15,382 adult A. suum intestinal genes were detected from both sexes (83% of the whole A. suum predicted genesetCitation24) (Table S1 and Table S2). A majority of those genes (80%, 12,234/15,382) were expressed in the intestines of both genders (). The higher number of genes detected in the intestine in the current study (15,382 compared to 11,691) most likely reflects the increased transcript sequencing depth per sample (50 million versus 17.4 million in ref. 14) and higher anatomical resolution obtained by sampling multiple regions from the same organ.
The female samples showed characteristics that were distinct from the male samples. The number of genes detected only in female was significantly higher than that detected only in the male intestine (2,996 vs. 152, p < 0.0001, by χ2 test). Additionally, the expression level of the genes exclusively detected in the female intestine was significantly lower compared with all genes expressed in female intestine (p < 0.0001 for log (DCPM), by z test; ). This result could reflect in part the higher coverage of the female samples (average 58 million reads per sample vs. 40 million reads for male samples, ), resulting in greater sensitivity for detecting low abundance gene transcripts. Indeed, the 3 highest depth female samples detected 47% of the female specific genes, compared to 28% that were detected by the 3 lowest depth female samples. Nevertheless, predicted proteins encoded by the female exclusive gene transcripts identified 31 over-represented GO terms (Table S3). Among the pathways with highest statistical significance were G-protein coupled receptor signaling pathway (GO:0007186) and ion transport (GO:0006811).
To determine consistency among replicates and samples (Fig. S1), correlations of transcript expression levels were examined among all 16 A. suum intestinal samples using hierarchical clustering analysis and normalized expression values. Correlation coefficients among male replicates were high (ranged from 0.79 - 0.97) suggesting that statistical comparisons of gene expression among these samples are likely to be robust. In contrast, correlation coefficients among female replicates were low (ranged from 0.14 to 0.55), which introduced reservations on using these samples for such statistical comparisons. The low correlation coefficients among female replicate samples might be explained in part by collection of worm replicates from different host swine (Fig. S2), despite collection at similar times post-infection. Consequently, our analyses of differential expression were limited to male samples. Nevertheless, since transcripts for 80% of the intestinal genes were detected in both female and male A. suum adult worm intestines (), results obtained on differential expression of the intestinal transcriptome in the male intestine are expected to have application to the female A. suum intestine.
General features of male A. suum intestinal transcriptome
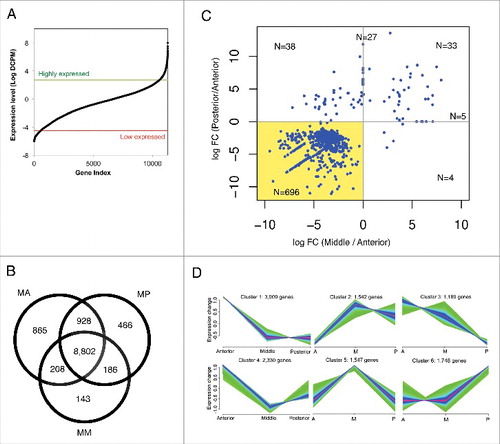
The normalized expression levels for male A. suum gene transcripts ranged from 0.002 to 2971.5 DCPMs, with the general abundances showing a distinct inflection point at log (DCPM) of approximately 2.7 (equivalent to the DCPM value of 15) (). Genes with expression levels below this point accounted for ∼93.5% (11,591/12,386) of the total detected genes, and the remaining 795 were considered to represent highly abundant gene transcripts in the present study (Fig. S3). Functional association of proteins encoded by these highly abundant gene transcripts identified 259 different GO terms for “biological process," 81 for “cellular component," and 374 for “molecular function." Functional enrichment analysis identified 33 enriched GO categories, of which 24 related to nutrient uptake/energy metabolism, 7 related to protein synthesis, and the rest related to binding function (protein binding and lipid binding; Table S3). Nine of these GO terms overlapped with previously reported GO terms significantly enriched (p < =0.01) among genes overexpressed in the intestine compared to other non-reproductive tissues.Citation14 The most statistically significant GO terms for molecular functions and cellular components included serine-type carboxypeptidase activity (GO:0004185) and proton-transporting ATPase activity, rotational mechanism (GO:0046961) along with the proton-transporting 2-sector ATPase complex, proton transporting domain (GO:0033177). In contrast, transcripts for 620 genes at the lowest expression end (5% of the total male intestine expressed genes; ) ranged in DCPM from 0.002 to 0.01, and predicted proteins were enriched for only 2 cellular component GOs: sarcoglycan complex (GO:0016012) and membrane (GO:0016020). The low number of enriched GO terms might be explained in part by the lower number of proteins that could be annotated with IPR domains for intestinal genes expressed at relatively low compared to high levels (43% vs. 73%, respectively).
Figure 2. General features of the expressed genes in the male A. suum intestines. (A) Distribution of expression level (DCPM) in male intestine. The thresholds for determining the high expression and low expression genesets are indicated with green and red lines respectively. (B) Distribution of intestinal expressed genes among the 3 regions of the male intestine. The numbers represent presence/absence of the transcripts, irrespective of the observed abundance. (C) Fold differences between intestinal regions, of the expression level of differentially expressed genes. Each dot corresponds to a differentially expressed gene. x-axis represents the log fold differences of posterior intestine over anterior intestine. y-axis represents the log fold differences of the middle intestine over anterior intestine. Numbers of the genes were labeled in each quadrant and on the division lines. The shaded area represents DE genes with higher anterior intestine expression as compared to both middle and posterior intestine. (D) The male intestinal genes were divided into 6 clusters based on their expression profiles using fuzzy clustering. The relative difference in expression level is plotted on the Y-axis. Green and light blue colors represent genes with low membership values; whereas purple and red colors represent genes with higher membership values. This data is independent of differential expression analysis (shown in panel C) and contains transcripts that vary in abundance among intestinal regions, even though some of these may not have attained the significance level required for classification as differentially expressed.
Differential transcript expression among contiguous, longitudinal intestinal regions of adult male A. suum
Qualitative differences
The vast majority of genes were expressed in at least 2 regions (87%), with only 1,474 genes exclusively expressed in a single region (). Proteins encoded by the 865 anterior-unique genes appeared to be mainly associated with signal transduction processes, as 18 out of 23 enriched GO terms were related to “ion channel” or “ion transport” (Table S3). The 4 enriched GO terms associated with proteins encoded by 466 posterior-unique genes were also related to the ion channel activities. Proteins encoded by genes unique to the middle region were not associated with significant enrichment of any GO terms. Although potentially identifying functions unique to individual intestinal regions, the expression levels of the region-specific genes were generally on the low end of expression compared to that of all genes in the male intestine (p < 0.0001 for log (DCPM), by z test). Thus, the significance of these findings will require further investigation.
Quantitative differences
Relative gene transcript abundances were quantitatively compared among male intestinal regions to determine functions that distinguish the 3 regions. Differentially expressed genes were identified using EdgeR (p < 0.05) and the highest proportion of these genes (n = 696) was overexpressed in the anterior region of the intestine (shaded region in ). This result supports that different regions of the adult male A. suum intestine contribute distinct functions to the intestinal tract, which will be addressed in the following sections. Analysis based on GO enrichment of functions for the 696 proteins only identified hydrolase activity, acting on glycosyl bonds (GO:0016798) and myosin complex (GO:0016459) (Table S4). Hence, more detailed quantitative comparisons are presented in the following sections and include 1) identifying patterns of gene expression using a fuzzy k-means clustering (FKM) algorithm, and 2), comparing regions in a pairwise manner and 3) carrying out statistical comparisons of individual genes among the 3 regions (Table S5).
Fuzzy clustering
FKM clustering identified 6 prominent gene expression patterns among the intestinal regions (), demonstrating that transcript expression varies in complex ways among the 3 intestinal regions. Functions related to these clusters were analyzed using enrichment tests (GO enrichment is presented in and IPR enrichment in Table S6). GO functional enrichment associated with FKM_cluster1 emphasized functions related to signal transduction, as 16 out of 19 enriched GO categories are related to phosphorylation, dephosphorylation and/or membrane dynamics; FKM_Cluster3 and Cluster4, also emphasized membrane dynamics and ATP binding, ATPase and/or GTPase activities; FKM_Cluster2 and Cluster5 were associated with functions involved in protein synthesis and energy transfer; whereas FKM_Cluster6 was not associated with any overrepresented GO categories.
Table 2. Functional enrichment based on GO annotation of genes in clusters based on FKM clustering.
These FKM cluster results characterize differentiation among intestinal regions relative to broad functional categories e.g., regulatory or metabolic processes. Regulatory processes inclusive of membrane receptors and signal transduction suggest elements that regulate intestinal cell physiology. Much of what is known about intestinal cell responses in nematodes comes from perturbations induced by exogenous treatments in C. elegans such as pathogenic bacteria and toxins.Citation25,26 Far less is known about ongoing homeostatic regulation of intestinal cell functions, which may have importance for disrupting parasite survival. Hence, regulatory proteins identified here may have value for investigating homeostatic functions of this kind. Metabolic processes associated with protein synthesis and energy transfer were most emphasized by FKM clusters showing increased expression levels in the middle intestinal region, which may reflect a larger role of this region in biosynthetic functions.
Individual gene comparisons
Fuzzy clustering resolved collections of genes that have common patterns of gene transcript abundances across regions, irrespective of the magnitude of differences in transcript abundances. In contrast, relatively high abundance transcripts and proteins provide alternative indicators of functions that may underlie the major roles of individual intestinal regions. Consequently, genes contained in FKM clusters were further investigated using additional criteria, such as 1) requiring transcript abundance to show statistically significant differences in 3-way (differentially expressed in any of the 3 regions) or 2-way comparisons (differentially expressed between any 2 regions) (p < 0.05, EdgeR method), and 2) detection of the predicted protein by liquid chromatography-tandem mass spectrometry (LC-MS/MS) from a recent study.Citation15,16 The LC-MS/MS study identified a total of 1,048 proteins from the whole intestinal protein preparations of adult males and females, and fractions from the female intestinal lumen, membrane enriched preparations, or pseudocoelomic fluid.Citation16 Based on these 2 additional requirements, 67 genes from FKM cluster 1 (anterior region high; ) were identified that had significantly higher transcripts compared with other intestinal regions (p < 0.05), and were supported by detection of encoded proteins (LC-MS/MS data). Proteins encoded by the 20 most abundant gene transcripts (out of the 67) included 9 predicted peptidases (M1, 13, S10) or glycoside hydrolases (e.g., family 31), all but 2 of which were detected in lumen perfusates of adult female A. suum intestine.Citation15,16 The peptidases and glycoside hydrolases are expected to perform basic digestive functions in the intestinal lumen, and proteins from each general category have been recognized as potential vaccine candidates in A. suum and other parasitic nematodes.Citation27,28 An additional 22 of the 67 proteins were detected in perfusates of the intestinal lumen, many of which likely function in the lumen or in the apical intestinal membrane. Regardless of detection in LC-MS/MS data, it is anticipated that many proteins represented by the FKM cluster 1 have functions that support specialization in the anterior region (e.g. regulation, transport). Also, among the 20 most abundant gene transcripts in the anterior region were genes with mean abundance differences of up to 30 fold higher as compared to middle and posterior regions. The anterior region of the intestine is the first to encounter nutrients and may have specialized functions in initiating digestion. These results provide the first accounting of this magnitude, for any nematode, regarding specific genes that confer specialized functions to cells in this intestinal region.
Similar analysis of clusters with high gene transcript expression in middle or posterior regions (FKM clusters 5 and 6, respectively; ) identified functions attributable to these regions, although noticeably fewer for the posterior region. None of the FKM cluster 5 transcripts in this group were expressed at significantly different levels compared to anterior and posterior in the 3-way analysis, whereas by 2-way analysis transcripts for 34 genes were significantly higher (p < 0.05) in the middle vs. anterior region. Only one apparent peptidase (S33) was represented in the 34 predicted proteins, and 5 genes encode proteins that represent translational machinery. This result may reflect a relatively higher level of protein synthesis in the middle region, which is consistent with the FKM cluster analysis. In contrast to the anterior region, the maximum difference in transcript abundance was about 4-fold in the middle region versus other regions. In the posterior region, only 5 gene transcripts were identified as differentially expressed and encoding proteins detected by LC-MS/MS. These 5 included 2 transthyretins, which facilitate transport of hormones in mammals,Citation29 2 trypsin-like protease inhibitors (I08 and I33), and one unannotated protein. Fold differences in mean transcript abundances in posterior compared to anterior and middle regions was over 700 for one protease inhibitor and 2000 for the unannotated protein, thus providing clear candidates as differentiation markers for the posterior region.
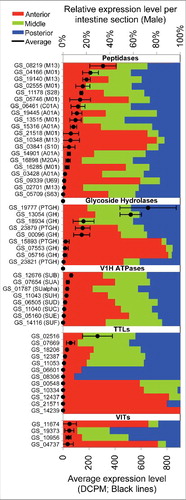
Compared to all genes expressed in the intestine, the number of differentially expressed genes was actually relatively small. This observation was true for hydrolases also, despite finding that several peptidases and glycosidases are preferentially expressed in the anterior region of the intestine (). For instance, other hydrolases distinct from these peptidases and glycosidases were previously documented in intestinal perfusates by LC-MS/MS, and show diverse expression patterns of coding transcripts, with many genes expressed to some extent in all regions of the intestine. In addition, several predicted vacuolar ATPase (VHA) subunits were detected in 4M urea perfusates of the intestinal lumen and are postulated to regulate pH of the lumen, which would likely affect digestive hydrolase activity.Citation16 Likewise transcripts that encode the VHA subunits are not differentially expressed among intestinal regions (). Thus, in contrast to differentially expressed genes, genes encoding many proteins of related functions are nevertheless expressed in multiple intestinal regions.
Figure 3. Relative expression levels among A. suum intestinal regions for transcripts that encode selected proteins. Top scale: colored bars display the percentage of transcripts detected in intestinal region, for each protein listed in the left column. Bottom scale: mean transcript expression in DCPM (across all samples, black dot) and standard deviation (error bars) is displayed within the histogram for each protein. Protein family designations are indicated in parentheses for Peptidases, Glycoside Hydrolases, Hydrogen ion pumps (V1/V0H ATPases), Transthyretin-like proteins (TTLs) and Vitellogenins (VIT).
Differential expression of intestinal genes that encode pseudocoelomic fluid proteins
The nematode intestine also synthesizes proteins destined for secretion into the pseudocoelomic (also known as perienteric) fluid (PF). However, the extent to which different intestinal regions contribute PF proteins is not well known. Mass spectrometry data of adult A. suum PF proteins, when integrated with intestinal transcript data, showed that the intestine is a likely source of a number of PF proteins.Citation16,30 Results obtained here show that each of the 3 intestinal regions investigated express transcripts that encode PF proteins, but expression patterns vary among intestinal regions for different transcripts. Lipid binding proteins, such as the well-known vitellogenins (VITs), exemplify this observation. These yolk proteins have some of the highest counts of mass spectra for A. suum PF proteins.Citation16 VITs are known to be synthesized in C. elegans intestinal cells, followed by transport to the ovary.Citation31 Keeping in mind that the regional transcript data was derived from male A. suum, transcripts encoding VIT protein GS_10956 are numerically, but not significantly, higher in middle and posterior compared to the anterior intestinal region (p > 0.05), whereas transcripts encoding VIT protein GS_11674 are higher in the anterior region (p < 0.05), and those encoding VIT protein GS_19373 are higher in the posterior region (p < 0.05) ().
The transthyretin-like (TTL) proteins are another group of PF proteins, and the TTL domain was one of the most enriched IPR domains for A. suum PF proteins.Citation16 Expression of intestinal transcripts encoding the TTLs also varied markedly among the 12 different TTLs and among intestinal regions for individual TTLs (). While functions of the PF TTL proteins remain obscure, mammalian TTLs transport thyroid hormonesCitation29 and one TTL functions as an intercellular receptor connected to C. elegans programmed cell death.Citation32
Notably, C-type lectins are PF proteins represented by the most abundant intestinal transcripts. These proteins are carbohydrate binding proteins, some of which are implicated in defense against bacterial pathogens.Citation33,34 While all regions express transcripts encoding the C-type lectin, GS_08343, at high levels (DPCM from about 1900 to 4900), the highest expression was associated with the middle region (p < 0.05).
From these results, it appears that distinct intestinal regions contribute differentially to production of PF proteins.
Differential exon usage in intestinal regions
Another important determinant of tissue specific functions involves differential expression of gene isoforms. We studied this using an analysis of differential exon usage among intestinal regions. To this end, transcriptomes were assembled for each individual sample in the presence of the reference genome.Citation35 Then, individual transcriptomes were merged, and filtered to exclude possible pre-mRNA fragments and polymerase run-on transcripts. Transcript data were then analyzed for putative open reading frames, and differential usage of exons among the 3 intestinal regions was determined
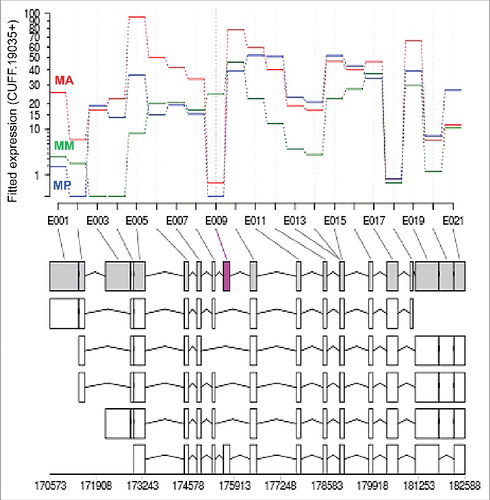
A total of 64 exons from 47 genes were differentially detected in transcripts (example presented in ; Table S7) among the 3 intestinal regions. Only 6 of the protein domains encoded by differentially expressed exons were annotated by GO/IPR annotation, whereas 37 of the proteins encoded by the entire gene were annotated. Several genes had multiple exons (range 2 to 5) that were differentially expressed. The most abundant of these exons occur in coding sequences for a predicted M1 metallopeptidase (GS_09307) (5 exons), and a predicted Acyl CoA ligase coupled receptor (GS_12367) (4 exons). Transcripts for GS_09307 are preferentially expressed in the anterior region and the encoded protein was detected in the lumen by LC-MS/MSCitation16 suggesting that the differentially expressed exons confer diversity in functions of a digestive enzyme. In contrast, transcripts for GS_12367 are expressed at equivalent levels in all 3 intestinal regions, while the differentially expressed exons are most prominently expressed in the anterior intestinal region (Table S7). No additional information is available on the cellular location where this protein and its isoforms may function. Overall, the proteins encoded by differential exon usage represent a wide range of functions with diverse patterns of expression. The results indicate that while differential exon usage exists, it occurs in a modest number of A. suum intestinal genes. The functional significance of these splice variants will most likely require evaluation on an individual gene/protein level.
Figure 4. Example of the alternative exon usage of gene GS_05680 (cufflinks ID: CUFF.19035) along the A. suum intestinal axis. The purple colored exon (E009) highlighted in the gray isoform is the differentially expressed exon. X-axis represents the individual exonic regions. Y-axis represents the counts of transcripts for the corresponding exonic regions modeled by the DEXseq package. The line for each intestinal region designates the transcript counts for each exonic sequence in that intestinal region: MA, male anterior intestine; MM, male middle intestine; MP, male posterior intestine. Gene model and all the assembled transcript isoforms are diagrammed below the chart with the corresponding genomic loci indicated.
A. suum intestinal miRNAs
A. suum miRNAs have been described previously,Citation36,37 with the sequence of 99 miRNAs made publicly available.Citation22 However, miRNAs specific to the intestinal tissue, or in the context of genes that are differentially expressed in various intestinal regions, have not been studied. Hence, the multiple roles intestinal miRNAs may play in regulating gene expression within the parasite and the host make it important to better define intestinal miRNA transcripts of nematodes. Using 12 intestinal samples (), we detected 277 distinct mature miRNA sequences (Table S8), representing a substantial expansion in the set of known A. suum miRNAs. 82 out of the 99 A. suum miRNAs present in miRBaseCitation22,38 were detected among these 277 intestinal miRNA sequences, including sequences that differ in length from A. suum intestinal miRNAs by up to 2 nucleotides at the 3’ end (hence likely to be the same miRNAs with slightly different mature sequence predictions). Seventeen of these mature miRNA sequences are encoded twice in the genome, with 11 of the duplicates tandemly encoded on the same assembly scaffolds, with 8-27 base pairs separating the copies. It is likely that these 11 tandem repeat pairs are miRNA-miRNA* partners (i.e. guide strand sequence - passenger strand sequence (*) of the duplexCitation39). However, we report them as separate miRNAs because all 22 examples were determined to represent the mature miRNA sequence in at least one of the RNA samples. The 277 miRNA sequences belong to 237 different seed families (based on bases 2-8 of predicted miRNA sequences). This includes 57 novel seeds (i.e., no miRNA in miRBase v21 has any of these seed sequences). We also report the first detection of miR-21 in nematodes. miR-21 is one of the first miRNAs discovered in mammals and one of the first identified as an oncomir with many known tumor suppressor genes among its targets.Citation40 Twenty-five of the novel A. suum miRNAs share seeds with other nematode miRNAs in miRBase.
Only 18 miRNAs were exclusively detected in female worms, as compared to 173 exclusive to the male samples (, Table S9), leaving 86 detected miRNAs that are common between both sexes. These findings suggest gender specific differences in miRNA-based intestinal gene regulation. The differences in the number of male- and female-specific miRNAs we observed in our dataset may reflect, in part, the differences in the total depth of coverage for samples from each of the 2 genders (Fig. S4). Notably, a whole worm based comparison had previously shown no difference in the number of A. suum gender-specific miRNAs.Citation36
Figure 5. Intestinal miRNAs in A. suum and their predicted mRNA targets. (A) Distribution of miRNAs between genders; (B) miRNAs detected in each intestinal region in male worms. (C) Correlation between miRNA abundance and expression levels of predicted mRNA targets. Mean expression levels of all the predicted targets of each miRNA were calculated. The figure shows a histogram for all miRNAs that were detected in at least 4 different samples (106 miRNAs), resulting in robust correlation coefficients with the target genes. The red line indicates the threshold for the lowest quintile which was used to identify LIMs. (D) LIMs-target mRNA abundance correlations. Clustering of both groups was done based on correlation coefficients.
Analysis of intestinal miRNA target transcripts
In order to predict mRNA transcript targets for miRNAs, mRNA sequences 3’ to coding regions are usually required. Although a large database of intestinal A. suum mRNAs was established, we estimated that 3’ sequence sufficient for miRNA target predictions is available for only 5,955 genes, and these were used in our analysis. Despite availability of multiple methods,Citation41-44 predictions of target sequences can be inexact (49). Both predicted and actual miRNA:mRNA target relationships can be highly promiscuousCitation45-47 with many-to-many interactions among miRNA and target mRNA populations. With these challenges in mind, we took several approaches for predicting intestinal mRNA transcripts that are regulated by intestinal miRNAs. First, we predicted putative intestinal mRNA target sets for each miRNA by using miRandaCitation42 (Table S8). Quantitative expression data of the intestinal mRNA and miRNA transcripts were used to generate correlation coefficients of abundance between a given miRNA and mRNA transcript(s). A negative correlation of abundances could reflect a regulatory relationship between an miRNA and the predicted target mRNA. For this analysis, we considered the set of correlations among all target mRNAs for a given miRNA and identified miRNAs with a mean correlation for all predicted targets in the lowest quintile (negative correlation) as Likely Influential miRNAs (LIMs). Alternatively, individual miRNA:mRNA target pairs with correlation coefficients within the lowest quintiles could reflect real miRNA-target associations. These miRNA:mRNA target pairs were designated Likely Associated miRNA-mRNA target Pairs (LAMPs). Finally, we considered relative abundances of miRNAs, because there is support that the most abundant miRNAs tend to have the most influence on mRNA target abundances.Citation48 The interest in all the mRNA target analyses is to resolve miRNA:mRNA target relationships that may warrant high priority for investigating regulatory relationships. Unfiltered target mRNAs, LIMs, LAMPs and relative intestinal miRNA abundances were each used in the analyses described below.
An average of 25 different transcript targets were predicted per miRNA (Fig. S5A). The 2,063 unique miRNA-targeted transcripts represent 35% of all the transcripts analyzed in this study (see Methods), indicating that miRNAs play an important role in regulation of intestinal transcript expression. On the other hand, 1,095 (53%) of the target transcripts are predicted to be targeted by more than one miRNA (Fig. S5B), with a mean of 5.5 targeting miRNAs for each of the multiply-targeted transcripts. These observations identify many-to-many potential relationships among intestinal miRNAs and mRNA targets.
In attempt to sort through the many to many relationships we first evaluated LAMP associations. The 503 LAMPs identified consist of 347 distinct mRNA targets that were collectively associated with 92 distinct miRNAs. Some 267 (77%) of the distinct mRNA targets were represented only once in the LAMP set, while 23 miRNAs (25%) were represented only once in the LAMP set. Hence, consideration of LAMPs considerably reduced the complexity of the many to many relationships implied from the whole data set. Although there is no a priori reason to expect a common theme underlying the functions of the entire population of mRNA transcripts delineated as LAMP targets, we evaluated enrichment of GO terms for proteins collectively encoded by this population. This analysis showed that LAMP targets encode proteins with predicted functions enriched (p < 0.05) for GO categories including cell cycle, cation homeostasis and cell adhesion (Table S10). In addition, among the mRNAs with the highest number of LAMPs associations is a putative AGC kinase (GS_07649, contributed to 11 LAMPs i.e. high negative correlation with 11 different miRNAs). AGC kinases perform a signaling intermediary role in cells,Citation40 with multiple potential downstream targets. Interestingly GS_07649 encodes one of the largest proteins in the A. suum inferred proteome and likely encodes the giant muscle-related kinase titin (known as twitchin in nematodes). It is possible that the convergence of multiple miRNAs on this transcript reflects a dampening of titin expression in intestinal cells, transcripts for which were detected only at low levels (Table S1).
While LAMPs identify individual miRNA:mRNA target pairs in the lowest quintile of correlation coefficients for abundance, LIMs identify miRNAs with the mean correlation for all predicted targets in the lowest quintile. The distribution of the mean correlation coefficients for predicted targets of individual miRNAs () is broad and may indicate that different miRNAs influence the abundance of their predicted targets to different extents. Twenty-two miRNAs were classified as LIMs in this analysis (located left of red line in ). The negative correlation coefficients of LIMs are not artifacts of having a small number of predicted targets, as there was a mean of 25.6 targets per LIM (Fig. S5A). All of the LIMs were detected in all intestinal regions, except for 2 LIMs, with one each that was not detected in the anterior or posterior regions (Table S9).
Because mRNA targets associated with each LIM might reflect individual or a collection of functional themes related to translated proteins, we evaluated functions of proteins encoded by LIM target mRNAs, by analyzing subpopulations of mRNAs that cluster together based on abundance correlations of LIMs-target mRNAs (). A range of functions were significantly enriched (Table S11), which suggests potential miRNA-dependent regulation of these functions. Enrichment of this kind is not necessarily expected and may indicate functional themes that are regulated by these LIMs.
As a final consideration of likely miRNA:mRNA target associations, relative abundances of miRNAs were evaluated, because low abundance miRNAs may lack significant regulatory roles in cells.Citation48 The relative abundance of intestinal miRNA with DCPM >1 ranged over 5 orders of magnitude (Table S9). Aside from variation among samples, sex or intestinal region, miRNAs were classified as having abundances >1000 (31 miRNAs), <1000>100 (30 miRNAs), <100>10 (50 miRNAs) <10>1 (118 miRNAs) DCPMs in any of the 12 samples analyzed. Abundance of 3 of the LIMs was >1000, and most LIMs (11) were in the range of <100 >10. Consequently, abundances of LIMs were generally in the moderate range, with the low abundance miRNAs significantly excluded from the LIMs sets (p < 2e-4) compared to other intestinal miRNAs. In contrast, miRNAs that form LAMPs show overrepresentation of both the high abundance (>100 ; p < 4e-5) and low abundance (<10 ; p < 2e-17) miRNAs. Collectively, the LIM, LAMP and relative abundance analyses provide statistical support that may be used in prioritizing subsets of miRNA:mRNA target populations for experimental determination of functional relationships.
Differentially expressed miRNAs in intestinal regions and functions associated with their target mRNAs
miRNAs were evaluated for qualitative and quantitative differences in expression among intestinal regions. Out of the 246 miRNAs detected in the regions from male intestinal tissue (i.e., excluding the 13 that were detected exclusively in the whole male intestinal sample), 42% were present in all intestinal regions (i.e. anterior, middle, posterior and whole intestine) and 44% were exclusively detected in samples from only a single intestinal region (anterior, middle or posterior) (). Although these qualitative differences possibly reflect a region-specific function, the miRNAs exclusively detected in single regions were low abundance transcripts that lack statistical support (p > 0.05) for differential expression among intestinal regions. Hence, these miRNAs are not categorized, nor further analyzed, as differentially expressed in this study.
In contrast, 11 miRNAs did have statistical support (p < 0.05) as differentially expressed (DE) among intestinal regions. Although none of the 11 was identified as a LIM (Table S9), 7 were ineligible to be annotated as LIMs according to our criteria (see Methods). Analysis of functions that may be regulated by these 11 DE miRNAs identified enrichment of cell cycle arrest, pH regulation, regulation of transcription and translation, transport of calcium ion, phosphate ion, water and cholesterol (Table S12).
Among the proteins encoded by the target genes of LAMP miRNAs that are DE (Table S10), are GS_12822 (Lactate/malate dehydrogenase) and GS_14543 (Ribosomal protein L10e/L16p), transcripts for both of which are targeted by asu-miR-1822-3p. This miRNA had significantly higher abundance in the anterior intestine (p < 0.05, Table S9), and transcripts for both GS_12822 and GS_14543 are expressed at relatively lower levels in the anterior compared to other intestinal regions (FKM_cluster2 in , Table S1), thus suggesting a potential for regulation by this miRNA.
Analyses of the kind summarized here provide specific examples for which functions of DE miRNA can be investigated in intestinal cells.
A. suum intestinal miRNAs conserved among nematode species
Actual or presumptive intestinal miRNAs have been described from other nematodes, and it is of interest to determine if intestinal miRNAs are conserved among nematode species. Currently, information on intestinal miRNAs, although limited, exists for C. elegansCitation21 and a set of prospective intestinal miRNAs collected from the excretory-secretory products of the rodent gastrointestinal nematode, Heligmosomoides polygyrus.Citation3 Out of 432 unique C. elegans miRNA sequences in miRBase v21, 10 are detected in the A. suum intestine ( and Table S8). These include miR-44/45 and miR-72 that were previously reported to be enriched in C. elegans intestinal tissue.Citation21 Eight out of the 10 conserved miRNA sequences are predicted to target intestine-associated pathogen response genes in C. elegans. Collectively, this set of conserved C. elegans miRNAs are predicted to target 8 out of the 11 intestinal pathogen response genes previously predicted to be targets of C. elegans miRNAs.Citation21 This relationship with pathogen response genes may indicate a similar role for the corresponding intestinal miRNAs conserved in A. suum. However, transcripts encoding only 3 A. suum homologs of the C. elegans pathogen response genes were detected in the A. suum intestine, and only 1 of them was predicted as a target of an A. suum intestinal miRNA. It is possible that a different set of pathogen response genes would be targeted by these miRNAs in A. suum, or that the A. suum miRNAs have acquired an unrelated set of target intestinal transcripts. A better assessment of relationships of this kind will come in the future when a more comprehensive data set of A. suum intestinal 3’ UTR sequences becomes available.
Figure 6. Conservation of A. suum mature miRNA and their seed sequences with miRNAs from other nematodes. (A) Mature miRNA sequences that are conserved among H. polygyrus putative intestinal, A. suum intestinal and all C. elegans miRNAs in miRBase. (B) Conservation of seed sequences from experimentally determined or putative intestinal miRNAs from each of the 3 worm species. (C) Restricted comparison of miRNAs from panel B to only the miRNAs with high abundance in all 3 A. suum intestinal regions. 78 miRNAs with >=2 mean abundance (no bracket) and 31 miRNAs with >=100 mean abundance (inside bracket).
miRNAs reported from H. polygyrus Citation3 were associated with fractions of excretory-secretory products containing exosomes of predicted intestinal origin, which suggested an intestinal origin of those miRNAs. Among the 31 mature miRNA sequences reported to be abundant in secreted miRNAs from H. polygyrus, 5 are conserved with miRNAs from the A. suum intestine (Table S8). Moreover, 16 of the 19 unique 7-mer seeds that constitute the putative intestinal miRNAs from H. polygyrus are conserved in A. suum intestinal miRNAs, showing significant enrichment as compared to randomly selected seeds (p < 10−16). Thus, identity conveyed by mature miRNA and seed sequences with A. suum intestinal miRNAs supports the possible intestinal origin of the H. polygyrus miRNAs. Extending intestinal seed sequence comparisons to include those conserved between C. elegans and A. suum also shows a significant enrichment of the 15 seed families found to be abundant in C. elegans intestinal miRNAs (based on ref. Twenty-one) among those conserved with A. suum intestinal miRNAs ().
Limiting comparisons to the most abundant A. suum intestinal miRNAs shows that most of the conserved seeds come from abundant intestinal miRNAs of A. suum and C. elegans (); 9 out of the 15 most abundant C. elegans intestinal miRNA seeds are conserved among the 31 most abundant intestinal miRNAs in A. suum (with mean abundance in each region >100). There is also conservation of a set of 9 seed families found among the putative intestinal miRNAs of H. polygyrus and abundant miRNAs from C. elegans and A. suum intestines (). These highly conserved and abundant intestinal miRNAs include well-studied miRNA families, e.g., miR-10/100 and lin-4 families. miR-10/100 is an ancient, highly conserved miRNA family, reported to be localized and coexpressed with Hox gene, bringing about developmental regulation through modulation of Hox expression.Citation49 lin-4 was the first miRNA to be discovered,Citation50 and is primarily involved in regulating the developmental events of the larval stages in C. elegans.Citation50,51 On the other hand, there are also families like miR-81 which seems to be a nematode specific family previously reported only from Caenorhabditis spp and Pristionchus pacificus.Citation52 Another abundant and conserved miRNA belongs to the family miR-71, which has been reported to affect C. elegans longevity through regulation of DAF-16 activity in the intestine.Citation53
Analysis of A. suum LAMPs identified 5 intestinal miRNAs that are also conserved with C. elegans at the mature sequence level (these include 2 that are also conserved with H. polygyrus), and 40 that are conserved at the seed sequence level with 56 C. elegans miRNAs (including 22 that have conserved seeds with 22 H. polygyrus miRNAs). In contrast, miR-44a-3p was the only A. suum LIM identified to have the mature miRNA sequence conserved with these other species. However, 12 out of the 22 A. suum LIMs have their seed sequences conserved with 17 C. elegans miRNAs. These include 7 with seed sequences that are also conserved with 9 H. polygyrus miRNAs.
Overall, The data provide compelling support that intestinal miRNAs are conserved among phylogenetically and biologically diverse nematode species.
Discussion
A. suum offers an important model for experimental investigations of intestinal cell functions relevant to control and treatment of parasitic nematodes. Its large size, experimental tractability, and relative importance as a model for one the most globally prevalent parasitic nematodes of humans, A. lumbricoides, highlights the value of the A. suum model. Recent publications have explored intestinal cell biology by comparative transcriptomics among tissues of adult A. suum,Citation14 proteomic analysis of proteins in multiple A. suum intestinal cell/tissue compartmentsCitation15,16 and evolutionary perspectives on conserved intestinal genes and proteins in a pan-Nematoda context,Citation54 inclusive of A. suum and many other nematode pathogens of humans and animals. The current research adds to this expanding knowledge by providing the most comprehensive information on genes for coding and non-coding RNAs that are constitutively or differentially expressed among regions of the intestine in any nematode species to date. Quantitative data from these distinct RNA transcript populations were further integrated to predict regulatory relationships that can now be investigated. Extensive conservation of intestinal miRNAs among parasitic and non-parasitic nematode species at the mature and seed sequence levels was established. This information supported the potential intestinal origin of H. polygyrus miRNAs found in excretory-secretory products of this parasite.
Several caveats influenced analysis of data presented here. Preliminary results indicated acceptable replicability of RNAseq data from male samples for the purpose of quantitative comparisons among intestinal regions, but not female samples. The variability observed among female intestinal regions may reflect a host effect as, for technical reasons, the worms from which we obtained female intestinal regions originated from different host swine. This was not the case for male worms. While the variability among samples of female worms is important to note, male A. suum were relied on for quantitative comparisons of expression among intestinal regions. We have shown that the preponderance of A. suum intestinal genes are expressed by both sexes (ref. Fourteen and data presented here), and hence, many quantitative differences observed among male intestinal regions will likely apply to female A. suum. Another caveat was that transcripts for a relatively large number of genes were detected only in female intestinal RNA. Although possibly reflecting contamination by other tissues, this explanation seems highly unlikely given the clear separation of intestinal tissue in the body cavity, relative ease of dissection of this large tissue, and trimming of anterior and posterior ends of intestinal samples. Deeper sampling, hence greater sensitivity, afforded by several female samples is a more likely explanation for detecting low abundance transcripts not detected in male samples. As one other general caveat, the importance of low abundance transcripts was raised in multiple analyses. The high sensitivity of RNAseq may detect expression that results from leaky transcription of genes otherwise biologically irrelevant to this tissue context. Thus, results related to very low abundance transcripts warrant additional scrutiny.
These caveats aside, the results indicate that differentiation exists among cells along contiguous regions of the A. suum intestinal tract and identify functions and specific proteins that can be used in investigations to derive mechanisms that regulate this differentiation. By comparison to other regions, the anterior region displays marked specialization based on the relatively high number of genes that are differentially expressed and the general magnitude of differences in the expression values for this region. For example, a compelling case is provided by apparent hydrolases detected in the intestinal lumen using LC-MS/MSCitation15 and encoded by transcripts expressed at significantly higher levels in the anterior intestinal cells. This connection makes biological sense with the initiation of nutrient digestion expected to occur in the anterior region. In addition, transcripts encoding many proteins with diverse functional annotation are preferentially expressed in the anterior region, some of which are likely to support processes that mediate secretion or regulate expression of digestive enzymes. Functional distinctions of the kind elucidated here may have practical applications, given that anterior intestinal cells of H. contortus are hypersensitive to fenbendazole,Citation10 which was one stimulus to document regional intestinal differences. Although the results do not explain the effect in H. contortus, A. suum intestinal cells are also highly sensitive to benzimidazole anthelmintics,Citation8 and the gene expression database established here may help to resolve mechanistic explanations for these findings.
In contrast to differentially expressed transcripts, other transcripts displayed more consistent expression among intestinal regions, and also encode numerous secreted or membrane proteins (inclusive of hydrolases) that localize to the lumen, peripheral-apical intestinal membrane or other membranes.Citation15,16 Hence, high-level expression of digestive hydrolases in the anterior intestinal cells may work in concert with digestive hydrolases that are constitutively expressed throughout the length of the intestine. A cooperative system of this kind is reminiscent of the intestinal peptidase cascade proposed for digestion of hemoglobin by hookworms, wherein aspartic and cysteine peptidases hydrolases initiates digestion of hemoglobin, followed by metallopeptidase digestion.Citation55 A difference is that our results address relationships in a tissue and spatial context. Because intestinal peptidases have proven value as candidate vaccines against parasitic nematodes,Citation4-7 peptidases that function as initiators of digestion may warrant priority for testing in vaccine trials.
Our results also indicate that intestinal regions vary in expression of transcripts that encode proteins detected in pseudocoelomic fluid. It is well recognized that nematode PF can function as a medium for transportation of yolk proteins destined for reproductive organs,Citation31 and possibly detoxification.Citation56 Nevertheless, deep analysis of the diversity of proteins contained in PF of nematodes was only recently accomplished with A. suum.Citation16,30 Intestinal transcriptomic analyses reported here and elsewhere clarify the extent to which the intestinal cells and intestinal regions likely contribute to protein constituents of the PF. As one example, VIT proteins encoded by the intestine are translocated to reproductive tissue (ovaries) in C. elegans. In A. suum intestinal cells, transcripts encoding PF-VIT proteins are differentially expressed among intestinal regions, and in some cases higher in the anterior region of the intestine, which is distal to reproductive tissue. Likewise, transcripts encoding the PF C-type lectins and TTLs were expressed at markedly different levels among intestinal regions. The purpose of this differential expression is unknown. It could create PF domains enriched in components that serve tissues proximal to intestinal regions with high expression; e.g. anterior intestinal region may serve specific needs of tissues in the anterior region of the worm (head, esophagus, muscle, hypodermis). An alternative, but not exclusive, view is that once secreted into the PF, distribution of PF constituents may rapidly equilibrate in this circulatory fluid. In this scenario the demands of synthesising abundant PF proteins would be distributed among intestinal cells and regions, while relying on circulation within PF to distribute components more evenly among tissues. Identification of specific proteins will enable experiments to differentiate among these possibilities.
The combined data from transcript and protein mass spectrometry presents a complex picture of gene regulation among cells and regions of the A. suum intestine, with fuzzy clustering indicating a minimum of 6 general patterns of gene expression. Regulation of intestinal gene expression has been intensively studied in C. elegans and ELT-2 is a major transcription factor for intestinal genes, including vit genes.Citation12,13 Transcripts for the best A. suum ELT-2 match, GS_05212, were not differentially expressed among regions (p > 0.05). Hence, other regulatory proteins are likely to contribute here, and a large number of candidates to investigate exist in our databases.
Intestinal miRNAs represent another important regulatory determinant of gene expression. Inasmuch as the intestine of parasitic nematodes is a compelling target for anthelmintic development approaches, miRNAs offer important tools to investigate molecular and cellular functions with this application in mind. Use of miRNAs for the purpose of anthelmintics has also been proposed, and if achievable parasite uptake across the apical intestinal membrane will likely be required. Accordingly, we have established the first comprehensive database of miRNA and corresponding target mRNA transcriptomes for any tissue in any nematode. Tissue level resolution is an important refinement in accurately predicting miRNA:mRNA relationships from genome or transcriptome databases, as absence of one or the other in a tissue obviates a simple intracellular relationship.
Both novel and previously reported miRNAs were detected in the A. suum intestine, some of which displayed differential expression among intestinal regions. A large number of target transcripts were predicted, which along with functional annotation of these targets leads to the expectation that miRNAs have significant roles in regulating A. suum intestinal cell functions. Because of the many (miRNA) to many (mRNA target) relationships predicted based on conventional methods, we sought an approach to prioritize the predicted relationships for analysis. One approach involved correlational analysis, made possible by the large number of intestinal samples investigated. This analysis identified 2 subpopulations, LIMs and LAMPs, that distinguish populations of mRNAs, or individual mRNAs, respectively, with negative correlation of abundances to miRNAs. Although this novel approach has not been experimentally tested, LIMs and LAMPs represent priority populations of miRNA:mRNA that can now be used to investigate miRNA-based regulation in A. suum intestinal cells. A second level of filtering was done in evaluating relative abundances of miRNA. Relative abundances of miRNAs varied over several orders of magnitude and while not absolute, more abundant miRNAs have a higher likelihood of documentable biological significance in regulating mRNAs.Citation48 Some of the higher abundance miRNAs also included LIMs and LAMPs, which can be incorporated into priority schemes to deduce biologically relevant intestinal miRNA:mRNA target relationships.
In line with research to identify pan-Nematoda conserved functions, we show that A. suum intestinal miRNAs have conservation with mature and seed sequences of intestinal miRNAs from C. elegans. A similar relationship was observed with presumptive intestinal miRNAs from H. polygyrus. A. suum is a Clade III species, whereas both C. elegans and H. polygyrus are Clade V species in the Nematoda.Citation57 Hence, these results provide clear evidence of conservation of intestinal miRNAs among diverse nematode species. Many of the A. suum conserved intestinal miRNAs occurred in the abundant category of miRNAs and some of these were also identified as LIMs and LAMPs. Again, integration of this information sets a stage for prioritizing miRNA:mRNA relationships for experimental investigation. Nevertheless, divergence in predicted target mRNAs for given intestinal miRNAs that are conserved between A. suum and C. elegans may reflect plasticity in miRNA functions, which has been reported for other miRNAs.Citation58,59 Hence, diversity of this kind must be taken into account when considering conservation of intestinal miRNA functions among nematodes.
The sequence homology among A. suum and C. elegans intestinal miRNAs and presumptive intestinal miRNAs from H. polygyrus supports an intestinal origin of the latter. This is important because the H. polygyrus miRNAs were detected in excretory-secretory products of this parasite and have been implicated in modulating host/parasite interactions.Citation3 In this context, the conservation among parasitic and non-parasitic nematodes is certainly intriguing. It will be interesting to learn if these conserved miRNAs have functions in intestinal cells of parasitic and non-parasitic nematodes, and if localization in excretory-secretory products reflects an additional function acquired by the parasitic nematode(s).
We also found that a small number of A. suum miRNAs are conserved in the host S. scrofa (5 miRNAs; these miRNAs belong to the known miRNA families miR-1, miR-7, miR-9, miR-124 and miR-10/100; Table S8, column E), indicating some level of conservation among worm and host miRNAs. Most of the predicted targets of these miRNAs in A. suum have orthologs in S. scrofa (90 out of 112). This number is much higher than that expected by chance (p < 10−28), however any significance to functional conservation of miRNAs between the host and parasite will need to be followed upon later, since a more extensive set of S. scrofa UTRs is needed than it is currently available.
In summary, this analysis of coding and non-coding A. suum intestinal RNAs adds a significant dimension to the multi-omics foundationCitation1,14-16, Citation54 that has been built to facilitate research on nematode intestinal functions with application to nematode species from across the phylum. A. suum is an emerging research model, which due to its large size supports experiments of many kinds to determine functions of nematode molecules, cells and tissues. Data presented here identifies many relationships among transcripts, proteins, intestinal regions and worm compartments that can be prioritized for investigation. Capabilities, such as direct pseudocoelomic or intestinal delivery of dsRNA and chemical treatments, provide important tools to investigate these relationships. Hence, the numerous resources now in place are expected to guide research on the intestine of parasitic nematodes that was previously unapproachable.
Materials and methods
Ethical statement. The research involving use of swine was reviewed and approved by the Washington State University Institutional Animal Care and Use Committee, protocol #04097, approved from 12/2010 to present. Guidelines are provided by the Federal Animal Welfare Act, USA.
Parasite materials and RNA preparation
Adult male and female A. suum were collected from pigs infected as described previously.Citation15 Infected pigs were euthanized and necropsied at Washington State University (Pullman, WA) at 60 to 65 d post infection. Live adult A. suum were collected, placed into ice cold phosphate buffered saline (PBS, pH 7.4) and dissected immediately. Parasite intestinal samples were obtained after opening the body wall of A. suum and then removing approximately 1 cm from the anterior and posterior ends of the intestine. The dissected intestines was collected whole, or partitioned into 3 regions (anterior, middle and posterior) of equal length (). Individual samples contained tissue from at least 3 worms. All the intestinal samples were then stored at -80°C.
Individual intestinal samples taken from storage were directly placed into a pestle cooled by liquid nitrogen, ground with a mortar, and placed in TRIzol reagent (Invitrogen/Life Technologies, Carlsbad, CA) for total RNA extraction according to the manufacturer’s instructions. Ethanol pellets of isolated RNA were shipped to Washington University for further processing and sequencing. Purified RNA was then treated with Ambion Turbo DNase (Ambion/Applied Biosystems, Austin, TX). RNA quality was assessed by Agilent 2100 Bioanalyzer (Agilent Technologies, Cedar Creek, Texas), with a minimum RIN of 6.8 observed across all samples. The yield was determined by NanoDrop ND-1000 (NanoDrop Technologies, Wilmington, DE). The purified RNA was subject to polyA selection using MicroPoly(A)Purist™ Kit (Ambion/Applied Biosystems, Austin, TX) according to the manufacturer’s instructions to isolate mRNA. The resultant mRNA was converted to cDNA using Ovation® RNA-Seq V2 kit (NuGen Technologies, Inc., San Carlos, CA) in the presence of both random and polyA primers. For sncRNA library construction total RNA was fractionated and sncRNA was isolated.
mRNA- and miRNA-sequencing and analyses
For coding gene transcript expression analysis, multiplexed Illumina sequencing libraries were constructed according to the manufacturer’s instructions (Illumina Inc., San Diego, CA). Briefly, 1μg cDNA was sheared using Covaris S220 DNA Sonicator (Covaris Inc., Woburn, MA) into fragments with a size range of 200-400bp, followed by addition of the SPIA adapters and 4 rounds of PCR amplification. The concentration of the amplified libraries was accurately determined by qPCR according to the manufacturer’s instructions (Kapa Biosystems Inc., Woburn, MA). Libraries were then loaded into the flow cells of the HiSeq2000 sequencer to generate paired end reads of 100 bp in length.
A total of 12 small RNA sequencing libraries were constructed from 4 female worm samples (anterior middle, and posterior regions and whole intestine) and 8 male worm samples (2 each anterior, middle and posterior regions and whole intestine) using the NEBNext Multiplex Small RNA Library Prep Set for Illumina (New England Biolabs, Beverly, MA). The obtained libraries were size-fractionated with the Caliper XT (Perkin Elmer, Hopkinton, MA) 750bp chip using a collection setting of 141bp +/− 5% or BluePippin system (Sage Sciences, Inc., Beverly, MA) 3% Dye Free cassette with internal maker Q2. Collection targeted 120-160bp, so that the small RNAs up to 35 bp were acquired. Each library was diluted to 2nM and then pooled by adding equal volumes. Pooled libraries were loaded into the flow cells of the Illumina MiSeq sequencer to generate single end reads up to 50 bases long, with only the reads with post-trimming length >16nt used for mapping.
mRNA-seq reads from each individual sequenced library were processed using in-house Perl scripts to remove adapter sequences, reads with low complexity, and reads derived from non-target organisms (pig genome Sscrofa9.2, GCA_000003025.2, and bacterial genome GBBCT, were both downloaded from GenBankCitation60). After the analytical processing the reads were aligned to the A. suum genomeCitation61 using Tophat 2.0.0 with the parameter mate-inner-dist set to 300.Citation62 To investigate the overall female or male A. suum intestinal transcriptomes, all the female/male alignment files were separately merged to obtain the pooled alignments. Read counts and gene breadth of coverage for each individual library and all the merged alignments were summarized using script Refcov version 0.3 (http://gmt.genome.wustl.edu/gmt-refcov). Genes with at least 50% breadth of coverage were considered to be “expressed” in a specific sample. The corresponding DCPM values, which represented the library-size normalized gene expression levels, were calculated.Citation63 The reproducibility of gene expression in the sample replicates was examined by hierarchical clustering of the samples based on the gene DCPM values.
Identification of differentially expressed transcripts and exons in multiple intestinal regions
Differentially expressed gene transcripts were called with the general linear model likelihood ratio test or exact binomial model test in Bioconductor package EdgeR on the basis of gene counts.Citation64 P-values for each gene transcript were adjusted for multiple testing and a corrected false discovery rate (FDR) cutoff of 0.05 was used. Table S1 presents the data in a comprehensive way that allows evaluation of the results in many ways by parsing it using different filters.
The depth of intestinal transcript sequence data supported reevaluation of transcribed regions of the A. suum genome. This enabled us to enhance definitions of transcribed genes and to detect differentially expressed exons. de novo A. suum intestinal transcriptome assembly was carried out using Cufflinks V1.2.1Citation35 resulting in 52,085 transcripts, allowing the discovery of novel junctions for each genome alignment file. The produced GTF files were merged and compared with the published gene model with Cuffmerge and Cuffcompare utilities of the Cufflinks package. The assembled transcripts were generated using Gffread utility of the cufflinks package. Open reading frames (ORF) were inferred with prot4EST V3.0.1b.Citation65 The combined GTF file was parsed to contain only the transcripts containing the predicted ORFs. The transcripts with class code “j” were considered to be new isoforms, and the transcripts with class code “u” were considered to be derived from the new transcribed regions.
Differential exon usage was analyzed using Bioconductor package DEXSeq.Citation66 Prior to this exon usage analysis, the non-overlapped exonic regions derived from each transcript were created and the corresponding read counts were obtained using scripts provided with the DEXSeq package. An FDR cutoff of 0.1 was applied to define the significant alternative exon expression.
Detection of miRNA and abundance calculation
The adapter-trimmed sncRNA-seq reads and the A. suum draft genome assemblyCitation61 were used as inputs to the miRDeep2 software packageCitation67,68 to detect the miRNA expression. Mature miRNA and hairpin sequences were downloaded from miRBaseCitation38 and provided to miRDeep2 to identify known A. suum miRNAs in our data and the shared seeds between novel miRNAs discovered in the present study and known nematode miRNAs in miRBase v21 (2,574 miRNAs from 10 nematode species). The resulting set of mature miRNA loci was collapsed to 277 unique miRNAs using the following method: i) merge loci that overlap, treating the 2 strands separately; ii) for every merged locus, add all the read counts reported by miRDeep2 for all different constituent start loci (ignoring differences in end loci, which do not impact the seed sequence); iii) ignore all start loci with < 3 total reads after adding; iv) if no start locus is left after this, the merged locus was ignored; v) if only 1 start locus is left after this, the locus was reported starting at this position, and vi) if more than 1 start locus is left, those loci that have >2*min were reported, where min is the minimum count for a start locus left after step 3. If there is only one such case (of >2 *min), then this was reported as an unambiguous start locus, otherwise all were reported as separate miRNAs.
miRNA abundances were calculated as the read counts reported by miRDeep2 per million library reads that were input to miRDeep2.
Identifying miRNA targets
A set of 5,955 genes with a 3’ UTR longer than 8 bases were identified by mapping cufflinks generated transcripts to coding sequences from gene models using WU-BLAST (W. Gish, unpublished, available from http://blast.wustl.edu). All cufflinks transcript sequences have been deposited to Nematode.net.Citation69 The miRNA target prediction algorithm miRandaCitation42 was used with ‘-strict’ option to force strict seed pairing and obtain relatively robust target predictions. An energy threshold of -20 and a score threshold of 150 was used for identifying targets.Citation70
Identifying likely influential miRNAs (LIMs) and Likely associated miRNA:mRNA pairs (LAMPs)
miRNA that were likely to have relatively large influence on the expression of their predicted targets were ascertained by using the Pearson correlation coefficients for abundances of miRNAs and each of the predicted target genes of that miRNA, from the samples where both the miRNA and the target were detected. Correlation coefficients were calculated using the cor() function of R statistical software package.Citation71 Cases in which transcripts were detected in less than 4 samples (out of the 12) were excluded from correlation coefficient analysis. The LIMs were defined as the miRNAs with their mean miRNA-target gene correlation coefficient values in the lowest quintile. This threshold value was -0.19. Similarly, by analysis of correlation coefficients of miRNA-mRNA pairs based on abundance in at least 4 samples, we defined LAMPs as the pairs with correlations coefficient in the lowest quintile (threshold value -0.33).
Differentially expressed miRNAs among male intestinal regions
The EdgeRCitation64 package (FDR cut-off threshold 0.05) was used to analyze the raw reads of miRNA transcripts and identify miRNAs that are differentially expressed miRNAs among anterior, middle and posterior intestinal regions. Only the 5,955 genes with 3’ UTRs longer than 8 bases were used as the background for enrichment comparison. Manual examination resulted in identification of 7 miRNAs (asu-miR-5365a-3p, asu-miR-79-3p, asu-miR-87b-3p, novel-71, novel-79, novel-84 and novel-85) that have been included in the downstream analysis but likely require further validation due to their inconsistent expression among replicates. To identify prospective intestinal functions that are regulated by differentially expressed miRNAs, we analyzed functions encoded by predicted transcript targets and comparative abundances of those transcripts among intestinal regions.
Expression-based clustering and Gene Ontology (GO) analysis
The averaged gene DCPM values for each male intestinal region were clustered using MfuzzCitation72 from the Bioconductor package. Number of the clusters was first varied between 2 and 30, and then empirically determined by visual inspection of the obtained clustering patterns so that each pattern was distinct. Mfuzz was used for soft clustering and each gene was assigned to a specific cluster according to its membership values. Those values indicated how well a gene was represented by the corresponding cluster.
InterProCitation73 associations were done using InterProScan v4.8 with default parameters.Citation74 Complete GO mapping data were extracted using in-house PERL scripts. Hypergeometric Gene Ontology (GO) tests using FUNCCitation75 were performed to find the overrepresented GO categories (restricted to the GO terms associated with at least 10 genes). GO terms with raw P-value <0.01 and FDR <0.05 were considered to be significant.
Data access
All the raw sequence reads generated for this work have been submitted to the NCBI SRA database under the accession numbers SRX278110, SRX278114, SRX278121, SRX278123, SRX278125, SRX278126, SRX278128, SRX278129, SRX278130, SRX278134, SRX278135, SRX278151, SRX278152, SRX278154, SRX278163, SRX278166, SRX1036135, and SRX1013923 to SRX1013930. The corresponding samples can be identified using Table S13.
Disclosure of potential conflicts of interest
No potential conflicts of interest were disclosed.
Author contributions
M.M. and D.P.J. jointly conceived, designed and supervised the research. D.P.J. performed the experiments and provided the material. V.M. and A.L. generated the libraries and the data. X.G. and R.T. analyzed the data and prepared the figures and tables. X.G., R.T., D.P.J. and M.M. wrote the manuscript.
Supplemental_data.zip
Download Zip (3.8 MB)Acknowledgment
The authors would like to thank Bruce Rosa for technical assistance with the figure generation, McDonnell Genome Institute staff and faculty for their technical assistance related to data generation and Susan Smart (Washington State University) for excellent technical support in generating RNA samples.
Funding
This study was supported by the National Institute of General Medical Sciences Grant R01GM097435 to M.M and by Agriculture and Food Research Initiative Competitive Grant no. (2013-67015-21230) from the USDA National Institute of Food and Agriculture.
Related Research Data
References
- Yin Y, Martin J, Abubucker S, Scott AL, McCarter JP, Wilson RK, Jasmer DP, Mitreva M. Intestinal transcriptomes of nematodes: comparison of the parasites Ascaris suum and Haemonchus contortus with the free-living Caenorhabditis elegans. PLoS Negl Trop Dis 2008; 2:e269; PMID:18682827; https://doi.org/10.1371/journal.pntd.0000269
- Jasmer DP, Lahmers KK, Brown WC. Haemonchus contortus intestine: a prominent source of mucosal antigens. Parasite immunology 2007; 29:139-51; PMID:17266741; https://doi.org/10.1111/j.1365-3024.2006.00928.x
- Buck AH, Coakley G, Simbari F, McSorley HJ, Quintana JF, Le Bihan T, Kumar S, Abreu-Goodger C, Lear M, Harcus Y, et al. Exosomes secreted by nematode parasites transfer small RNAs to mammalian cells and modulate innate immunity. Nat Commun 2014; 5:5488; PMID:25421927; https://doi.org/10.1038/ncomms6488
- Jasmer DP, Perryman LE, Conder GA, Crow S, McGuire T. Protective immunity to Haemonchus contortus induced by immunoaffinity isolated antigens that share a phylogenetically conserved carbohydrate gut surface epitope. J Immunol 1993; 151:5450-60; PMID:7693812
- Smith WD. Protection in lambs immunised with Haemonchus contortus gut membrane proteins. Res Vet Sci 1993; 54:94-101; PMID:8434155; https://doi.org/10.1016/0034-5288(93)90017-A
- Smith TS, Munn EA, Graham M, Tavernor AS, Greenwood CA. Purification and evaluation of the integral membrane protein H11 as a protective antigen against Haemonchus contortus. Int J Parasitol 1993; 23:271-80; PMID:8496010; https://doi.org/10.1016/0020-7519(93)90150-W
- Hotez PJ, Bethony JM, Diemert DJ, Pearson M, Loukas A. Developing vaccines to combat hookworm infection and intestinal schistosomiasis. Nat Rev Microbiol 2010; 8:814-26; PMID:20948553; https://doi.org/10.1038/nrmicro2438
- Borgers M, De Nollin S. Ultrastructural changes in Ascaris suum intestine after mebendazole treatment in vivo. J Parasitol 1975; 61:110-22; PMID:1117352; https://doi.org/10.2307/3279120
- Borgers M, De Nollin S, De Brabander M, Thienpont D. Influence of the anthelmintic mebendazole on microtubules and intracellular organelle movement in nematode intestinal cells. Am J Vet Res 1975; 36:1153-66; PMID:1171646
- Jasmer DP, Yao C, Rehman A, Johnson S. Multiple lethal effects induced by a benzimidazole anthelmintic in the anterior intestine of the nematode Haemonchus contortus. Mol Biochem Parasitol 2000; 105:81-90; PMID:10613701; https://doi.org/10.1016/S0166-6851(99)00169-3
- Hu Y, Aroian RV. Bacterial pore-forming proteins as anthelmintics. Invert Neurosci 2012; 12:37-41; PMID:22562659; https://doi.org/10.1007/s10158-012-0135-8
- Fukushige T, Goszczynski B, Yan J, McGhee JD. Transcriptional control and patterning of the pho-1 gene, an essential acid phosphatase expressed in the C. elegans intestine. Dev Biol 2005; 279:446-61; PMID:15733671; https://doi.org/10.1016/j.ydbio.2004.12.012
- McGhee JD. The Caenorhabditis elegans intestine. Wiley Interdiscip Rev Dev Biol 2013; 2:347-67; PMID:23799580; https://doi.org/10.1002/wdev.93
- Rosa BA, Jasmer DP, Mitreva M. Genome-wide tissue-specific gene expression, co-expression and regulation of co-expressed genes in adult nematode Ascaris suum. PLoS Negl Trop Dis 2014; 8:e2678; PMID:24516681; https://doi.org/10.1371/journal.pntd.0002678
- Jasmer DP, Rosa BA, Mitreva M. Peptidases compartmentalized to the Ascaris suum intestinal lumen and apical intestinal membrane. PLoS Negl Trop Dis 2015; 9:e3375; PMID:25569475; https://doi.org/10.1371/journal.pntd.0003375
- Rosa BA, Townsend R, Jasmer DP, Mitreva M. Functional and phylogenetic characterization of proteins detected in various nematode intestinal compartments. Mol Cell Proteomics 2015; 14:812-27; PMID:25609831; https://doi.org/10.1074/mcp.M114.046227
- Pasquinelli AE. MicroRNAs and their targets: recognition, regulation and an emerging reciprocal relationship. Nat Rev Genet 2012; 13:271-82; PMID:22411466; https://doi.org/10.1038/nrg3162
- Tay Y, Zhang J, Thomson AM, Lim B, Rigoutsos I. MicroRNAs to Nanog, Oct4 and Sox2 coding regions modulate embryonic stem cell differentiation. Nature 2008; 455:1124-8; PMID:18806776; https://doi.org/10.1038/nature07299
- Cloonan N. Re-thinking miRNA-mRNA interactions: intertwining issues confound target discovery. Bioessays 2015; 37:379-88; PMID:25683051; https://doi.org/10.1002/bies.201400191
- Kim Y, Kim VN. MicroRNA factory: RISC assembly from precursor microRNAs. Mol Cell 2012; 46:384-6; PMID:22633486; https://doi.org/10.1016/j.molcel.2012.05.012
- Kudlow BA, Zhang L, Han M. Systematic analysis of tissue-restricted miRISCs reveals a broad role for microRNAs in suppressing basal activity of the C. elegans pathogen response. Mol Cell 2012; 46:530-41; PMID:22503424; https://doi.org/10.1016/j.molcel.2012.03.011
- Wang J, Czech B, Crunk A, Wallace A, Mitreva M, Hannon GJ, Davis RE. Deep small RNA sequencing from the nematode Ascaris reveals conservation, functional diversification, and novel developmental profiles. Genome Res 2011; 21:1462-77; PMID:21685128; https://doi.org/10.1101/gr.121426.111
- Tritten L, Burkman E, Moorhead A, Satti M, Geary J, Mackenzie C, Geary T. Detection of circulating parasite-derived microRNAs in filarial infections. PLoS Negl Trop Dis 2014; 8:e2971; PMID:25033073; https://doi.org/10.1371/journal.pntd.0002971
- Jex AR, Liu S, Li B, Young ND, Hall RS, Li Y, Yang L, Zeng N, Xu X, Xiong Z, et al. Ascaris suum draft genome. Nature 2011; 479:529-33; PMID:22031327; https://doi.org/10.1038/nature10553
- Pukkila-Worley R, Ausubel FM. Immune defense mechanisms in the Caenorhabditis elegans intestinal epithelium. Curr Opin Immunol 2012; 24:3-9; PMID:22236697; https://doi.org/10.1016/j.coi.2011.10.004
- Los FC, Randis TM, Aroian RV, Ratner AJ. Role of pore-forming toxins in bacterial infectious diseases. Microbiol Mol Biol Rev 2013; 77:173-207; PMID:23699254; https://doi.org/10.1128/MMBR.00052-12
- Gentner HW, Castro GA. Effect of antiserum on maltase from intestinal microvillous membranes of Ascaris suum. J Parasitol 1974; 60:110-6; PMID:4205468; https://doi.org/10.2307/3278687
- Williamson AL, Brindley PJ, Knox DP, Hotez PJ, Loukas A. Digestive proteases of blood-feeding nematodes. Trends Parasitol 2003; 19:417-23; PMID:12957519; https://doi.org/10.1016/S1471-4922(03)00189-2
- Richardson SJ. Cell and molecular biology of transthyretin and thyroid hormones. Int Rev Cytol 2007; 258:137-93; PMID:17338921; https://doi.org/10.1016/S0074-7696(07)58003-4
- Chehayeb JF, Robertson AP, Martin RJ, Geary TG. Proteomic analysis of adult Ascaris suum fluid compartments and secretory products. PLoS Negl Trop Dis 2014; 8:e2939; PMID:24901219; https://doi.org/10.1371/journal.pntd.0002939
- Kimble J, Sharrock WJ. Tissue-specific synthesis of yolk proteins in Caenorhabditis elegans. Dev Biol 1983; 96:189-96; PMID:6825952; https://doi.org/10.1016/0012-1606(83)90322-6
- Wang X, Li W, Zhao D, Liu B, Shi Y, Chen B, Yang H, Guo P, Geng X, Shang Z, et al. Caenorhabditis elegans transthyretin-like protein TTR-52 mediates recognition of apoptotic cells by the CED-1 phagocyte receptor. Nature cell biology 2010; 12:655-64; PMID:20526330; https://doi.org/10.1038/ncb2068
- O'Rourke D, Baban D, Demidova M, Mott R, Hodgkin J. Genomic clusters, putative pathogen recognition molecules, and antimicrobial genes are induced by infection of C. elegans with M. nematophilum. Genome research 2006; 16:1005-16; PMID:16809667; https://doi.org/10.1101/gr.50823006
- Irazoqui JE, Troemel ER, Feinbaum RL, Luhachack LG, Cezairliyan BO, Ausubel FM. Distinct pathogenesis and host responses during infection of C. elegans by P. aeruginosa and S. aureus. PLoS Pathog 2010; 6:e1000982; PMID:20617181; https://doi.org/10.1371/journal.ppat.1000982
- Trapnell C, Roberts A, Goff L, Pertea G, Kim D, Kelley DR, Pimentel H, Salzberg SL, Rinn JL, Pachter L. Differential gene and transcript expression analysis of RNA-seq experiments with TopHat and Cufflinks. Nature protocols 2012; 7:562-78; PMID:22383036; https://doi.org/10.1038/nprot.2012.016
- Xu MJ, Fu JH, Nisbet AJ, Huang SY, Zhou DH, Lin RQ, Song HQ, Zhu XQ. Comparative profiling of microRNAs in male and female adults of Ascaris suum. Parasitol Res 2013; 112:1189-95; PMID:23306386; https://doi.org/10.1007/s00436-012-3250-x
- Shao CC, Xu MJ, Alasaad S, Song HQ, Peng L, Tao JP, Zhu XQ. Comparative analysis of microRNA profiles between adult Ascaris lumbricoides and Ascaris suum. BMC Vet Res 2014; 10:99; PMID:24766827; https://doi.org/10.1186/1746-6148-10-99
- Kozomara A, Griffiths-Jones S. miRBase: integrating microRNA annotation and deep-sequencing data. Nucleic acids research 2011; 39:D152-7; PMID:21037258; https://doi.org/10.1093/nar/gkq1027
- Mah SM, Buske C, Humphries RK, Kuchenbauer F. miRNA*: a passenger stranded in RNA-induced silencing complex? Critical reviews in eukaryotic gene expression 2010; 20:141-8; PMID:21133843; https://doi.org/10.1615/CritRevEukarGeneExpr.v20.i2.40
- Wang Y, Gao X, Wei F, Zhang X, Yu J, Zhao H, Sun Q, Yan F, Yan C, Li H, et al. Diagnostic and prognostic value of circulating miR-21 for cancer: a systematic review and meta-analysis. Gene 2014; 533:389-97; PMID:24076132; https://doi.org/10.1016/j.gene.2013.09.038
- Brodersen P, Voinnet O. Revisiting the principles of microRNA target recognition and mode of action. Nat Rev Mol Cell Biol 2009; 10:141-8; PMID:19145236; https://doi.org/10.1038/nrm2619
- Enright AJ, John B, Gaul U, Tuschl T, Sander C, Marks DS. MicroRNA targets in Drosophila. Genome Biol 2003; 5:R1; PMID:14709173; https://doi.org/10.1186/gb-2003-5-1-r1
- Coronnello C, Benos PV. ComiR: Combinatorial microRNA target prediction tool. Nucleic acids research 2013; 41:W159-64; PMID:23703208; https://doi.org/10.1093/nar/gkt379
- Grimson A, Farh KK, Johnston WK, Garrett-Engele P, Lim LP, Bartel DP. MicroRNA targeting specificity in mammals: determinants beyond seed pairing. Mol Cell 2007; 27:91-105; PMID:17612493; https://doi.org/10.1016/j.molcel.2007.06.017
- Betel D, Wilson M, Gabow A, Marks DS, Sander C. The microRNA.org resource: targets and expression. Nucleic acids research 2008; 36:D149-53; PMID:18158296; https://doi.org/10.1093/nar/gkm995
- Friedman RC, Farh KK, Burge CB, Bartel DP. Most mammalian mRNAs are conserved targets of microRNAs. Genome Res 2009; 19:92-105; PMID:18955434; https://doi.org/10.1101/gr.082701.108
- Lewis BP, Burge CB, Bartel DP. Conserved seed pairing, often flanked by adenosines, indicates that thousands of human genes are microRNA targets. Cell 2005; 120:15-20; PMID:15652477; https://doi.org/10.1016/j.cell.2004.12.035
- Mullokandov G, Baccarini A, Ruzo A, Jayaprakash AD, Tung N, Israelow B, Evans MJ, Sachidanandam R, Brown BD. High-throughput assessment of microRNA activity and function using microRNA sensor and decoy libraries. Nature methods 2012; 9:840-6; PMID:22751203; https://doi.org/10.1038/nmeth.2078
- Tehler D, Hoyland-Kroghsbo NM, Lund AH. The miR-10 microRNA precursor family. RNA Biol 2011; 8:728-34; PMID:21881411; https://doi.org/10.4161/rna.8.5.16324
- Lee RC, Feinbaum RL, Ambros V. The C. elegans heterochronic gene lin-4 encodes small RNAs with antisense complementarity to lin-14. Cell 1993; 75:843-54; PMID:8252621; https://doi.org/10.1016/0092-8674(93)90529-Y
- Olsen PH, Ambros V. The lin-4 regulatory RNA controls developmental timing in Caenorhabditis elegans by blocking LIN-14 protein synthesis after the initiation of translation. Dev Biol 1999; 216:671-80; PMID:10642801; https://doi.org/10.1006/dbio.1999.9523
- de Wit E, Linsen SE, Cuppen E, Berezikov E. Repertoire and evolution of miRNA genes in four divergent nematode species. Genome research 2009; 19:2064-74; PMID:19755563; https://doi.org/10.1101/gr.093781.109
- Boulias K, Horvitz HR. The C. elegans microRNA mir-71 acts in neurons to promote germline-mediated longevity through regulation of DAF-16/FOXO. Cell metabolism 2012; 15:439-50; PMID:22482727; https://doi.org/10.1016/j.cmet.2012.02.014
- Wang Q, Rosa BA, Jasmer DP, Mitreva M. Pan-Nematoda Transcriptomic Elucidation of Essential Intestinal Functions and Therapeutic Targets With Broad Potential. EBioMedicine 2015; 2:1079-89; PMID:26501106; https://doi.org/10.1016/j.ebiom.2015.07.030
- Williamson AL, Lecchi P, Turk BE, Choe Y, Hotez PJ, McKerrow JH, Cantley LC, Sajid M, Craik CS, Loukas A. A multi-enzyme cascade of hemoglobin proteolysis in the intestine of blood-feeding hookworms. The Journal of biological chemistry 2004; 279:35950-7; PMID:15199048; https://doi.org/10.1074/jbc.M405842200
- Minning DM, Gow AJ, Bonaventura J, Braun R, Dewhirst M, Goldberg DE, Stamler JS. Ascaris haemoglobin is a nitric oxide-activated 'deoxygenase'. Nature 1999; 401:497-502; PMID:10519555; https://doi.org/10.1038/46822
- Blaxter ML, De Ley P, Garey JR, Liu LX, Scheldeman P, Vierstraete A, Vanfleteren JR, Mackey LY, Dorris M, Frisse LM, et al. A molecular evolutionary framework for the phylum Nematoda. Nature 1998; 392:71-5; PMID:9510248; https://doi.org/10.1038/32160
- Chen K, Rajewsky N. Deep conservation of microRNA-target relationships and 3'UTR motifs in vertebrates, flies, and nematodes. Cold Spring Harb Symp Quant Biol 2006; 71:149-56; PMID:17381291; https://doi.org/10.1101/sqb.2006.71.039
- Xu J, Zhang R, Shen Y, Liu G, Lu X, Wu CI. The evolution of evolvability in microRNA target sites in vertebrates. Genome research 2013; 23:1810-6; PMID:24077390; https://doi.org/10.1101/gr.148916.112
- Benson DA, Karsch-Mizrachi I, Lipman DJ, Ostell J, Wheeler DL. GenBank. Nucleic Acids Res 2005; 33:D34-8; PMID:15608212; https://doi.org/10.1093/nar/gki063
- Jex AR, Liu S, Li B, Young ND, Hall RS, Li Y, Yang L, Zeng N, Xu X, Xiong Z, et al. Ascaris suum draft genome. Nature 2011; 479:529-33; PMID:22031327; https://doi.org/10.1038/nature10553
- Trapnell C, Pachter L, Salzberg SL. TopHat: discovering splice junctions with RNA-Seq. Bioinformatics 2009; 25:1105-11; PMID:19289445; https://doi.org/10.1093/bioinformatics/btp120
- Hillier LW, Reinke V, Green P, Hirst M, Marra MA, Waterston RH. Massively parallel sequencing of the polyadenylated transcriptome of C. elegans. Genome Res 2009; 19:657-66; PMID:19181841; https://doi.org/10.1101/gr.088112.108
- Robinson MD, McCarthy DJ, Smyth GK. edgeR: a Bioconductor package for differential expression analysis of digital gene expression data. Bioinformatics 2010; 26:139-40; PMID:19910308; https://doi.org/10.1093/bioinformatics/btp616
- Wasmuth JD, Blaxter ML. Prot4EST: Translating Expressed Sequence Tags from neglected genomes. BMC Bioinformatics 2004; 5:187; PMID:15571632; https://doi.org/10.1186/1471-2105-5-187
- Anders S, Reyes A, Huber W. Detecting differential usage of exons from RNA-seq data. Genome research 2012; 22:2008-17; PMID:22722343; https://doi.org/10.1101/gr.133744.111
- Friedländer MR, Chen W, Adamidi C, Maaskola J, Einspanier R, Knespel S, Rajewsky N. Discovering microRNAs from deep sequencing data using miRDeep. Nat Biotechnol 2008; 26:407-15; PMID:18392026; https://doi.org/10.1038/nbt1394
- Friedländer MR, Mackowiak SD, Li N, Chen W, Rajewsky N. miRDeep2 accurately identifies known and hundreds of novel microRNA genes in seven animal clades. Nucleic acids research 2012; 40:37-52; PMID:21911355; https://doi.org/10.1093/nar/gkr688
- Martin J, Rosa BA, Ozersky P, Hallsworth-Pepin K, Zhang X, Bhonagiri-Palsikar V, Tyagi R, Wang Q, Choi YJ, Gao X, et al. Helminth.net: expansions to Nematode.net and an introduction to Trematode.net. Nucleic acids research 2015; 43:D698-706; PMID:25392426; https://doi.org/10.1093/nar/gku1128
- Richardson K, Lai CQ, Parnell LD, Lee YC, Ordovas JM. A genome-wide survey for SNPs altering microRNA seed sites identifies functional candidates in GWAS. BMC Genomics 2011; 12:504; PMID:21995669; https://doi.org/10.1186/1471-2164-12-504
- Team RC. R: A Language and Environment for Statistical Computing. Vienna, Austria, 2012.
- Kumar L, E Futschik M. Mfuzz: a software package for soft clustering of microarray data. Bioinformation 2007; 2:5-7; PMID:18084642; https://doi.org/10.6026/97320630002005
- Hunter S, Jones P, Mitchell A, Apweiler R, Attwood TK, Bateman A, Bernard T, Binns D, Bork P, Burge S, et al. InterPro in 2011: new developments in the family and domain prediction database. Nucleic acids research 2012; 40:D306-12; PMID:22096229; https://doi.org/10.1093/nar/gkr948
- Quevillon E, Silventoinen V, Pillai S, Harte N, Mulder N, Apweiler R, Lopez R. InterProScan: protein domains identifier. Nucleic acids research 2005; 33:W116-20; PMID:15980438; https://doi.org/10.1093/nar/gki442
- Prufer K, Muetzel B, Do HH, Weiss G, Khaitovich P, Rahm E, Paabo S, Lachmann M, Enard W. FUNC: a package for detecting significant associations between gene sets and ontological annotations. BMC Bioinformatics 2007; 8:41; PMID:17284313; https://doi.org/10.1186/1471-2105-8-41