
ABSTRACT
The origin of replication complex subunit ORC1 is important for DNA replication. The gene is known to encode a meiotic transcript isoform (mORC1) with an extended 5′-untranslated region (5′-UTR), which was predicted to inhibit protein translation. However, the regulatory mechanism that controls the mORC1 transcript isoform is unknown and no molecular biological evidence for a role of mORC1 in negatively regulating Orc1 protein during gametogenesis is available. By interpreting RNA profiling data obtained with growing and sporulating diploid cells, mitotic haploid cells, and a starving diploid control strain, we determined that mORC1 is a middle meiotic transcript isoform. Regulatory motif predictions and genetic experiments reveal that the activator Ndt80 and its middle sporulation element (MSE) target motif are required for the full induction of mORC1 and the divergently transcribed meiotic SMA2 locus. Furthermore, we find that the MSE-binding negative regulator Sum1 represses both mORC1 and SMA2 during mitotic growth. Finally, we demonstrate that an MSE deletion strain, which cannot induce mORC1, contains abnormally high Orc1 levels during post-meiotic stages of gametogenesis. Our results reveal the regulatory mechanism that controls mORC1, highlighting a novel developmental stage-specific role for the MSE element in bi-directional mORC1/SMA2 gene activation, and correlating mORC1 induction with declining Orc1 protein levels. Because eukaryotic genes frequently encode multiple transcripts possessing 5′-UTRs of variable length, our results are likely relevant for gene expression during development and disease in higher eukaryotes.
Introduction
DNA replication in budding yeast is a multi-step process initiated by the origin of replication binding complex (ORC), which includes 6 subunits.Citation1 ORC1 encodes a conserved ATPase essential for the mitotic cell cycle.Citation2,3 While Orc1 functions during pre-meiotic DNA replication and protects repetitive ribosomal DNA (rDNA) sequences from becoming unstable during meiotic recombination, no role is known for the protein during middle and late stages of meiosis and spore formation.Citation4 The mitotic isoform of ORC1 is divergently expressed with the long non-coding RNA XUT1538, which belongs to a class of regulatory lncRNAs that are targeted by the cytoplasmic 5′–3′ exoribonuclease Xrn1.Citation5 Paradoxically, ORC1 expression is strongly induced in diploid cells that enter meiotic M-phase,Citation6,7 and this induction pattern coincides with the transcriptional activation of divergently expressed meiosis-specific SMA2. This gene is important for the spore membrane pathway that ensures proper encapsulation of haploid nuclei into spores.Citation8-10 Bi-directional transcription patterns, which may involve pairs of mRNAs, long non-coding RNAs (lncRNAs) or a combination of both, have been described as an intrinsic property of yeast promoters, but the regulatory mechanisms underlying this phenomenon are often not understood. Citation9,11,12
An earlier RNA- and ribosome profiling study of yeast sporulation reported that ORC1 encodes a meiotic isoform with an extended 5′-untranslated region (UTR) that was predicted to inhibit Orc1 translation during post-meiotic stages of spore development via upstream open reading frames (uORFs).Citation13 However, Orc1 protein levels during meiosis and gametogenesis have not been determined, and the transcription factors that control the expression of mORC1 during growth and development are unknown.
Meiotic M-phase requires middle genes that are specific for the process and genes that function during mitosis and meiosis. The transcriptional activator Ndt80 induces both types of genes via direct interaction with MSEs,Citation14 while Sum1 represses meiosis-specific genes, including NDT80,Citation15 during vegetative growth either alone or by recruiting the histone deacetylase Hst1 to a sequence motif that overlaps certain MSEs.Citation16,17 NDT80 is transcriptionally activated during meiotic prophase I in a 2-step process, whereby the gene is first de-repressed prior to meiotic M-phase I, when Ume6 and Sum1 activities are progressively down-regulated, and then strongly induced via an auto-activating loop when cells trigger the meiotic divisions;Citation18 reviewed in.Citation19 Ndt80 target promoters were identified in a large-scale in vivo protein-DNA binding assay of samples from sporulating cells.Citation20 This experiment, together with position weight matrices (PWMs), which represent patterns such as transcription factor target motifs in DNA sequences, identified genes that are likely regulated by Ndt80.Citation21,22
In this study we report that cells switch to a long ORC1 transcript isoform containing an extended 5′-UTR (mORC1) prior to entry into meiotic M-phase, while starvation alone fails to induce this transcript. Importantly, we show that in meiosis Ndt80 directly activates mORC1 together with the divergently expressed SMA2 locus via its bi-directional MSE target motif, while Sum1 acts as a mitotic repressor for both transcripts. Finally, we demonstrate that Orc1 protein becomes undetectable when cells finish pre-meiotic DNA replication and start expressing mORC1, while Orc1 remains detectable in an MSE deletion mutant that fails to induce the long isoform. These findings agree with large-scale ribosome profiling data.Citation13 Our data suggest a novel role for the Ndt80 activator in yeast meiosis, which is to down-regulate Orc1 protein via induction of an untranslatable transcript isoform. The results therefore highlight an interesting regulatory design that enables an activator to repress a target gene product during eukaryotic cell differentiation.
Results
Datasets and experimental rationale
In earlier work, we used tiling arrays to determine the transcriptome of diploid budding yeast during fermentation, respiration and sporulation in comparison to vegetative growth of haploid cells.Citation9,23,24 Initially, we focused on meiotic lncRNAs and later on developmentally regulated transcript isoforms with extended 5′-UTRs. Published tiling array data are available at the ReproGenomics Viewer (RGV, rgv.genouest.org; Fig. S1Citation25) and the Saccharomyces Genomics Viewer (SGV, sgv.genouest.orgCitation26). Furthermore, we interpreted DNA strand-specific RNA-Sequencing data from mitotically growing haploid and diploid wild type versus xrn1 mutant cells in S288C, W303 and SK1 strain backgrounds,Citation5 and our unpublished RNA-Sequencing data (not DNA strand-specific) from MATa/α and MATα/α cells cultured in YPD, YPA and SPII media (E. Becker, M. H. Guilleux, K. Waern, M. Snyder and M. Primig et al., in preparation).
The 5′-UTR expression analysis by Lardenois, Liu et al. included a non-exhaustive list of early, middle and late transcript isoforms, which lacked the meiotic isoform mORC1 because the segmentation algorithm used to analyze tiling array data failed to detect it.Citation9,23 The ORC1 locus is, however, an interesting case: its mRNA is cell cycle regulated in mitotically growing cells and strongly induced during meiotic development, although the the protein it encodes is a priori dispensable after pre-meiotic DNA replication is finished.
Diploid yeast cells express divergent ORC1/XUT1538 transcripts in mitosis and mORC1/SMA2 only in meiosis but not starvation
Diploid cells growing asynchronously in the presence of glucose (YPD) or acetate (YPA) and synchronized haploid cells undergoing a full mitotic cell cycle express only the mitotic ORC1 transcript isoform (to which we also refer as the short isoform; ), while the 5′-extended mORC1 isoform is undetectable. We also observed a faint signal corresponding to what appeared to be an lncRNA divergently expressed from the ORC1 promoter. In fact, this RNA turned out to be the Xrn1-sensitive unstable transcript XUT1538.Citation5 We note that the activity of Xrn1 is strong in S288C and W303 but attenuated in SK1 (). This indicates that the ORC1 promoter is bidirectional during vegetative growth.
Figure 1. ORC1 isoform expression during growth and differentiation. (A) Color-coded heatmaps generated with RGV version 1.0, show DNA strand-specific Sc_tlg tiling array expression data ordered in rows for samples and columns for each oligonucleotide probe (blue is low, red is high; bicolor pivot 3.9 on the log scale). The strain background is shown to the right in red, time points are given in minutes to the left. A schematic represents the loci (shades of blue for ORFs and SUT, green for the UTR, and red for XUT) on both DNA strands (black lines). Arrows indicate transcription start sites. Note that the data shown, which cover one mitotic cycle, are part of a larger experiment reported in reference.Citation24 (B) A heatmap shows RNA-Sequencing data for 3 wild type strains (WT S288C, W303 and SK1) and corresponding strains lacking Xrn1 activity (xrn1) given to the left. All strains are haploid unless their DNA content is indicated (2n). Cells were cultured in YPD. The complete dataset was reported in reference.Citation5 (C) A heatmap like in panel A shows samples from diploid wild type cells cultured in rich media (YPD, YPA) and sporulation medium (SPII) taken at the time points indicated in hours (h). The strain is indicated to the right in green. Genome-wide data are from reference.Citation9 (D) A schematic summarizes the mitotic (top) and meiotic (bottom) expression profiles of SMA2 and ORC1 (dark and light blue rectangles, respectively) and the lncRNAs SUT292 and XUT1538 (blue and red rectangles). Transcripts are shown as wavy blue lines. Black lines represent the top and bottom DNA strands. Arrows indicate transcription start sites.
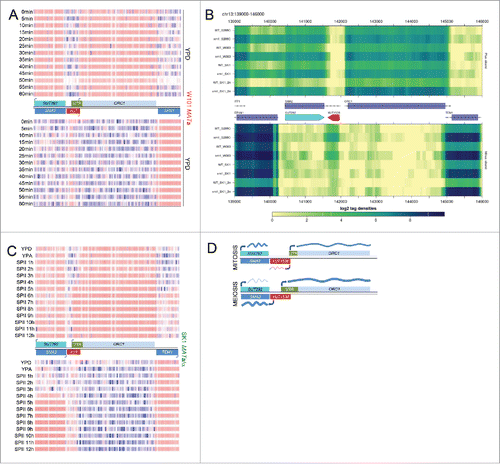
MATa/α cells cultured in sporulation medium (SPII) induce mORC1 when they exit pre-meiotic DNA replication and enter M-phase. This coincides with the transcriptional onset of divergently expressed SMA2, which overlaps the constitutively expressed antisense lncRNA SUT292 (). A Northern blot by Brar et al. 2012 suggests that SK1 cells exclusively express the short ORC1 transcript isoform during vegetative growth and pre-meiotic DNA replication when Orc1 is needed. Critically, at the onset of meiotic M-phase approximately 6 hours after transfer into sporulation medium, cells completely switch to expressing the long transcript isoform. Note that the meiotic isoform has the size predicted for a full-length ORC1 transcript with a 5′-extended UTR (see in referenceCitation13). Genomics data thus reveal a complex regulatory pattern involving 5 transcripts: haploid and diploid cells undergoing mitotic growth express SUT292 and divergent ORC1/XUT1538 transcripts downstream of it, while middle meiotic cells continue to express SUT292 but co-induce divergent mORC1/SMA2 transcripts via a developmentally regulated bi-directional promoter element ().
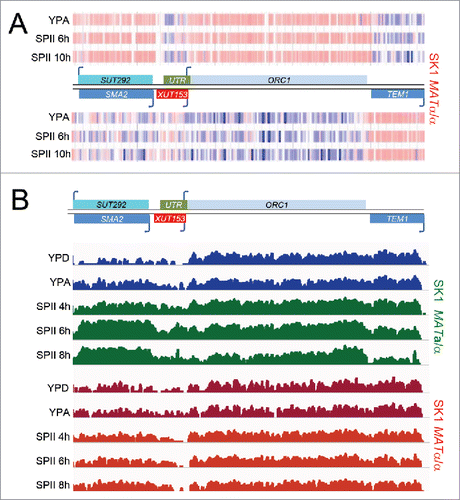
We have previously reported that early and middle meiotic isoforms are not induced by starvation alone, since they typically do not accumulate to normal (or even detectable) levels in sporulation-deficient MATα/α control cells.Citation23 In the case of ORC1, tiling array data and RNA-Sequencing data from starving SK1 MATα/α cells cultured in sporulation medium indicate that they do not induce the long isoform. We conclude that mORC1's transcriptional activation or its stability (or both) depend on meiosis ().
Figure 2. mORC1 induction requires sporulation. (A) (SPII, 4h, 6h, 8h). Tiling array data for ORC1 are shown as in for sporulation deficient SK1 MATα/α cells cultured in pre-sporulation medium (YPA) and sporulation medium (SPII, 4, 6, 8h). (B) A schematic shows the region containing the ORC1 locus as in . RNA-Sequencing data (not DNA strand-specific) are given as a color-coded histogram (IGV version 2.3.40 set at log scale data range min 0 and max 800) for cells cultured rich media in blue (YPD, YPA) and for sporulation medium in green (SPII) as shown to the left. The wild type (SK1 MATa/α in green) and sporulation deficient control strains (SK1 MATα/α in red) are indicated to the right.
Divergent promoters driving isoforms pair them with ubiquitous transcripts or developmentally stage-specific mRNAs
We find that the expression of mORC1/SMA2 during gametogenesis is likely not an isolated case. Further examples include ORC3/SPO75 (which overlaps antisense MMM1), PEX32/POP7 (which overlaps antisense CUT028), PCM1/SOM1 (for which mSOM1 overlaps antisense HHY1) and IWR1/YDL114W; see sgv.genouest.org, rgv.genouest.org and the Yeast Promoter Atlas at ypa.csbb.ntu.edu.tw/.Citation27 Meiotic IWR1 (mIWR1) is not detectable by tiling arrays in haploid cycling cells (Fig. S2A top and bottom panels). The tiling array data indicate the presence of an unknown weakly expressed SUT-type antisense transcript that overlaps IWR1; however, the function of this transcript, if it has any at all, is presently unclear. High-throughput data for mIWR1, IWR1 and YDL114W obtained with SK1 are reproduced by RT-PCR assays using samples from the distantly related strain JHY222 (which is derived from the standard background S288CCitation9,28), indicating that the phenomenon is not strain-specific but generally occurs in budding yeast (Fig. S2B). We note that mIWR1 accumulates to lower levels than YDL114W, which may reflect distinct RNA synthesis rates or decay rates. These results concur with the finding that yeast promoters are intrinsically bi-directional.Citation11,12
mORC1/SMA2 repression in mitosis requires Sum1 while their full induction in meiosis depends on Ndt80
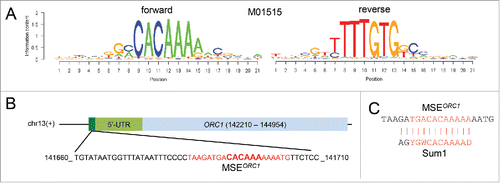
A search for regulatory motifs in the ORC1 promoter region identified an MSE immediately upstream of mORC1 (). Given the base composition of mORC1s MSE it is likely bound by the meiotic activator Ndt80 and the mitotic repressor Sum1, which is consistent with ORC1 transcript isoform's middle meiosis-specific expression pattern ().Citation17
Figure 3. MSE prediction. (A) Logos of the predicted MSE (M01515) are shown as graphs plotting information content (y-axis) vs. position for each base in the sequence for forward (left) and reverse (right) DNA strands (x-axis). (B) A schematic represents the MSE in dark green, the 5′-UTR in light green and ORC1 in light blue. A black line represents the top DNA strand (+). The chromosome number is indicated. The base coordinates and the base composition of the 5′-mORC1 region, which contains a predicted MSE (bases are shown in red with the core bases enlarged and in bold), are shown at the bottom. (C) The predicted ORC1 MSE is aligned with the Sum1 target motif; a vertical line indicates base matches and similarities. Bases in the core sequence are given in red.
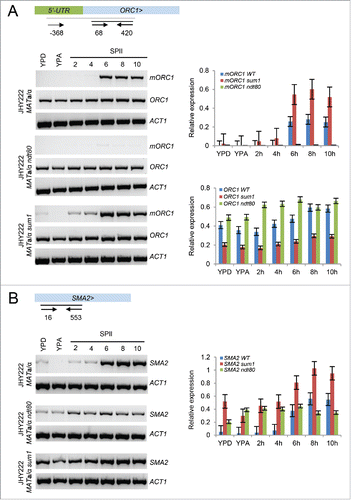
We next sought to prove that the predicted promoter element is indeed biologically active. To this end, we first designed combinations of oligonucleotide primers for RT-PCR assays to validate tiling array data and RNA-Seq data in wild type cells, and to study the expression of mitotic and meiotic isoforms encoded by ORC1 in the absence of the Ndt80 activator and Sum1 repressor. None of the gene deletions affected the mitotic isoform in JHY222 cells cultured in rich media (YPD, YPA) and sporulation medium (SPII) at bi-hourly time points (2h-10h) (). To the contrary, we found that mORC1 was moderately de-repressed in sum1 cells cultured in rich medium (YPD) and sporulation medium (SPII), while it was nearly undetectable in ndt80 mutant cells cultured in rich media and sporulation medium under the conditions used (). We next assayed the divergently transcribed SMA2 gene and found a broadly similar induction pattern in JHY222 wild type cells as compared to tiling array data obtained in the SK1 background (). As expected, SMA2 mRNA did not accumulate to normal meiotic levels in the absence of NDT80 and was elevated in sum1 mutant cells cultured in growth, pre-sporulation, and sporulation media (). These results are consistent with a role for Ndt80 and Sum1 in the regulation of mORC1. The observed lack of mORC1 induction in ndt80 mutant cells could, however, be an indirect effect because ndt80 cells arrest during pachytene stage of meiotic prophase I, which might impair the transcription of the long ORC1 isoform.Citation14
Figure 4. Ndt80-dependent mORC1/SMA2 expression. (A) A schematic shows the ORC1 5′-UTR in green and the ORF in light blue; > indicates the transcriptional direction. Small arrows symbolize oligonucleotide primers and black lines represent PCR products. Their coordinates with respect to the first base in the ATG start codon are given. The output of RT-PCR assays is shown for ORC1 isoforms (mORC1, ORC1) and ACT1. The wild type, ndt80 and sum1 strain backgrounds are shown to the left. Cells were harvested in rich media (YPD, YPA) and sporulation medium (SPII) at the bi-hourly time points indicated at the top. Two bar graphs show quantified signals from RT-PCR assays in panel A for mORC1 (top) and ORC1 (bottom) for the wild type (blue), sum1 (red) and ndt80 (green) strains given in the legends. Relative expression levels (y-axis) are plotted against samples (x-axis) as shown. Bars indicate the values obtained in duplicate experiments. (B) A schematic on top shows the SMA2 locus and the position of oligonucleotide primers (arrows) beneath a black line indicating the PCR fragment. The output of RT-PCR assays for SMA2 in wild type, ndt80 and sum1 strains is shown and bar diagrams are given as in panel A.
Ndt80 and Sum1 directly act on mORC1/SMA2 via an MSE element
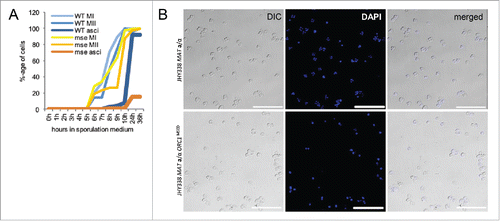
The results described above complement earlier work where we predicted an MSE in the intergenic region of ORC1 and SMA2, which was reported to be bound by Ndt80 in vivo.Citation9,20 The combined results are consistent with – but do not prove – a direct role for Ndt80/MSE. To provide unambiguous evidence for a novel function of Ndt80 in activating a meiotic ORC1 transcript isoform, we deleted the MSE (in a congenic strain background for technical reasons related to selectable marker genes; ) and found that mORC1 indeed failed to be induced in middle meiosis, while the mutation did not alter the mitotic isoform's expression level (). Consistently, SMA2 mRNA also failed to be meiotically induced in the absence of a functional MSE in the gene's promoter region. (). We note that a low level of MSE-independent SMA2 expression appear to be mediated by at least one other promoter element. This is, however, likely insufficient for Sma2 function since the ORC1 MSE deletion strain displays a sporulation phenotype similar to the one previously reported for the sma2 mutant: cells progress through the meiotic divisions but mostly fail to form asci because the nuclei are not properly packaged ().Citation8,10 The simplest explanation is that Sum1 contributes to the repression of mORC1 and SMA2 during mitotic growth, while Ndt80 activates the transcripts from middle meiosis onwards by directly interacting with a bi-directional MSE present in the ORC1 promoter.
Figure 5. Bi-directional MSE-dependent mORC1/SMA2 expression. (A) A schematic shows the wild type and MSE mutant sequences upstream of ORC1. The deleted sequence is given in red, flanking bases are enlarged and given in bold. (B) The output of RT-PCR assays with samples from wild type cells versus cells lacking the MSE upstream of mORC1 (MSEΔORC1) is shown for the ORC1 isoforms and for ACT1. RT-PCR signals are given as bar diagrams. (C) RT-PCR data are given for SMA2 and ACT1 in wild type (WT) and motif deletion strains (MSEΔORC1) as in panel B.
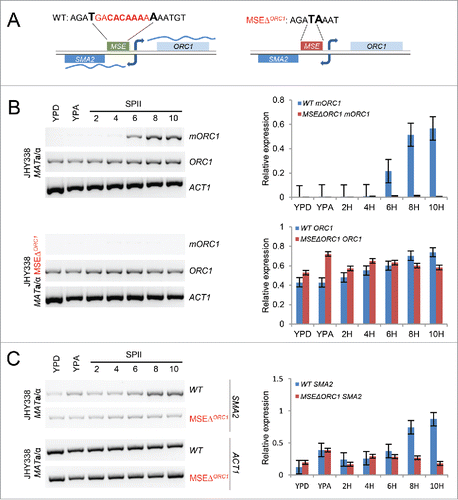
Figure 6. Phenotypic analysis of the MSE deletion mutant. (A) A graph shows the percentage of wild type and MSE mutant cells cells (y-axis) at the bi-nuclear (MI), tetra-nuclear (MII) and ascus stage over time in sporulation medium shown in hours (x-axis). (B) Representative images of wild type (top) and MSE deletion (bottom) strains are shown using differential interference contrast (DIC, left), fluorescent staining of DNA (DAPI, middle) or both (merged, right). The strains are given to the left. A bar indicates 50μm.
mORC1 expression and Orc1 protein levels are negatively correlated
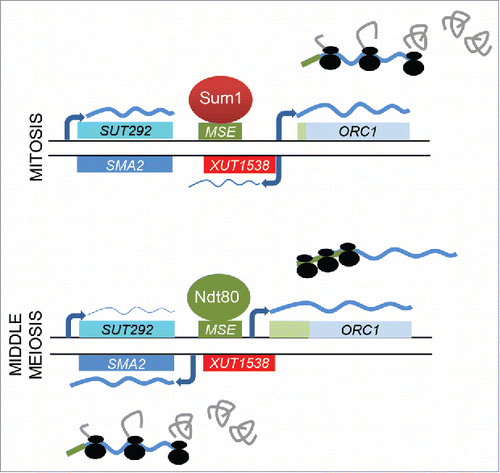
Our findings, together with the prediction by Brar et al., that the long isoform of ORC1 may inhibit protein translation, raises the interesting possibility that Ndt80 represses Orc1 after pre-meiotic DNA replication by activating a transcript isoform that sequesters ribosomes at its 5′ end via uORFs; (referenceCitation13; Fig. S3). The extended ORC1 5′-UTR contains 2 such uORFs encoding proteins of 113 and 64 amino acids, respectively, that are in frame with the main ORF (). We reasoned that the induction of mORC1 should correlate with declining Orc1 protein levels as cells enter meiotic M-phase and found this indeed to be the case. Importantly, we detected the Orc1 protein during and after M-phase in the ORC1MSEΔ deletion strain that cannot induce mORC1 (; Fig. S4). These findings are consistent with the regulatory design proposed in : mORC1 and SMA2 are repressed in mitosis by the Sum1 complex and activated in meiosis by Ndt80, which enables Sma2 but not Orc1 protein to accumulate when cells exit meiosis and enter gamete formation.
Figure 7. ORC1 RNA vs. Orc1 protein levels. (A) A schematic shows the ORC1 locus in blue and the extended 5′UTR in gray at the top. Genome coordinates for the ORC1 ORF and the meiotic transcription start site (TSS) are given. Two in frame upstream ORFs located in the 5′-UTR are shown in red at the bottom. The amino acid sequences are indicated and an asterisk represents the stop codon. (B) Cells from wild type (JHY388 MATa/α) and MSE mutant (JHY338 MATa/α MSEΔORC1) strains were cultured in growth media (YPD, YPA) an sporulation medium (SPII) at the time points indicated in hours. As shown to the right, protein samples were analyzed for Orc1, using Pgk1 as a loading control. RNA samples were assayed for the long isoform (mORC1), and the short isoform (ORC1), using ACT1 as a loading control. (C) A color-coded graph shows quantified log-transformed units (y-axis) representing Orc1 protein levels in panel B for samples from growing and sporulating cells (x-axis). Samples from wild type (WT) cells are shown in black, those from mutant (MSEΔORC1) cells are shown in orange.
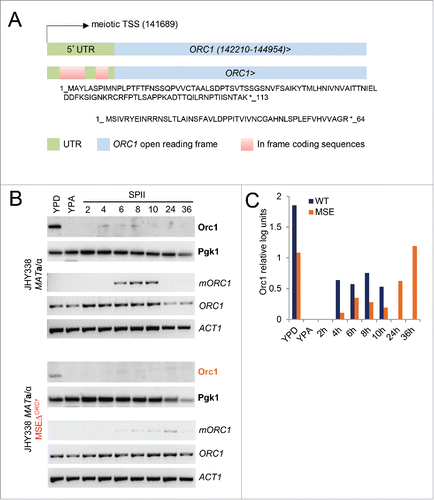
Figure 8. A model for mORC1/SMA2 induction in meiosis. A schematic depicts the mitotic (top) and meiotic (bottom) regulation of ORC1 and SMA2 shown as light and dark blue rectangles, respectively, by Sum1 (dark red) and Ndt80 (green). Mitotic and meiotic ORC1 5′-UTRs are shown in green. SUT292 and XUT1538 are given in blue and red, respectively. The MSE is given as a light green rectangle. Transcripts are shown as wavy lines for which the thickness represents the expression level. Black lines represent the top and bottom DNA strands.
Discussion
The yeast meiotic transcriptome comprises classical early, middle and late mRNAs, meiotic transcript isoforms that possess either 5′- or 3′-extended UTRs, and lncRNAs.Citation6,7,9,23,29,30 These findings raise the question if the transcriptional regulatory network, which controls developmental stage-specific mRNAs, also contributes to the regulation of meiotically induced mRNA isoforms and lncRNAs. In this report, we begin to unravel the regulatory mechanism controlling the meiotic isoform of ORC1, which is co-induced with divergent SMA2 when diploid cells undergo meiosis and gametogenesis. We also present evidence supporting the conceptually new model that the activator Ndt80 negatively regulates post-meiotic Orc1 protein levels by inducing the long isoform of ORC1, which inhibits translation via an extended 5′UTR.
The ORC1 promoter drives divergent mRNA/lncRNA expression in mitotically growing cells
It is unclear what role, if any, the divergent lncRNA in the ORC1 locus might play during growth and development. It is perhaps noteworthy that the transcript, although annotated as XUT1538,Citation5 also shows features typical for two other types of lncRNAs, since it is detectable in wild type cells (SUTsCitation12) and it accumulates in the absence of Rrp6 (CUTsCitation31). Given the considerable overlap between these transcript classes, especially in the cases of SUTs and XUTs, more work is needed to understand the molecular mechanisms governing their variable synthesis and decay rates.
Establishing developmental stage-specific middle meiotic isoform expression
Contrary to early meiotic transcript isoforms present in mitotic ume6 cells,Citation23 one would not expect middle meiotic transcript isoforms such as mORC1 to strongly accumulate in a fermenting sum1 mutant because their activator Ndt80 is undetectable in cells cultured in rich medium. Indeed, we find that mORC1 is weakly de-repressed in fermenting JHY222 sum1 cells and during incubation in sporulation medium. For SMA2 the level of mitotic accumulation in sum1 cells is elevated as compared to mORC1, which might be due to distinct RNA half-lives. Taken together, our results are consistent with a role for Sum1 in repressing mORC1 and SMA2 during mitotic growth via the putative target sequence within the ORC1MSE (see and ). In addition, it is conceivable that SMA2 expression is partially inhibited during mitosis by SUT292 and XUT1538 via well-established antisense- and promoter interference mechanismsCitation32,33; for review see reference.Citation34
A new role for Ndt80 in the activation of a meiotic transcript isoform that inhibits translation
One might expect ORC1 to be transcriptionally repressed when cells exit pre-meiotic DNA replication, because there is no further need for assembling an origin recognition complex at autonomously replicating sequence (ARS) elements. Yet, earlier work with microarrays containing probes for the 3′-regions of ORFs shows that ORC1 gene expression strongly increases as cells progress through meiotic development.Citation6,7 Recent studies using tiling arrays and RNA-Sequencing helped explain this puzzling fact: cells induce a long transcript isoform with an extended 5′-UTR proposed to inhibit Orc1 translation.Citation13,29 However, neither microarrays nor RNA-Seq experiments unambiguously show that the 5′-extended isoform is synthesized through to the same transcription termination site (TTS) as the short isoform. We propose that data in previously published work and this study are consistent with the notion that both isoforms use a common TTS as the model in implies.Citation13,23
A key question that we sought to answer is which regulator activates mORC1 and SMA2 at the onset of meiotic M-phase. The presence of an MSE prompted us to assay mORC1 induction in an ndt80 mutant strain and we found that the long transcript isoform does not accumulate to normal levels in the absence of Ndt80. In spite of the predicted MSE′s presence in the promoter, this effect could still be indirect because ndt80 mutant cells arrest at the pachytene checkpoint prior to entry into M-phase and therefore simply might be unable to induce mORC1. Two lines of evidence argue against this interpretation and in favor of our model (). First, a high-throughput protein-DNA binding assay based on chromatin immunoprecipitation and microarrays (ChIP-Chip) showed that Ndt80 binds the ORC1 upstream region in vivo.Citation20 Second, deleting the MSE in the ORC1 promoter prevents normal induction of the meiotic ORC1 isoform and strongly reduces SMA2 expression during sporulation. We currently do not know why we detect low levels of SMA2 in the MSE mutant strain. Another weak promoter element might mediate basal expression or the mRNA might be unusually stable in meiotic cells.
An intriguing aspect of the model in is that Ndt80 could potentially drive bi-directional transcription of mRNA/isoform pairs via MSEs that both have a biological function. Such a novel role for Ndt80 is consistent with earlier reports suggesting that yeast promoters typically mediate bi-directional transcription.Citation11,12 Our findings raise the possibility that promoters driving the expression of divergent transcript may have brought about an evolutionary advantage: cells need to induce SMA2 given its important role in sporulation,Citation8,10 while ORC1 is not involved in late meiotic processes. Therefore, the induction of an extended isoform, which inhibits Orc1 translation via uORFs, represents an elegant solution for down-regulating a protein without the need for repressing the promoter. In addition, we speculate that this mechanism, which keeps the ORC1 promoter chromatin in an open configuration during the entire process of gametogenesis, may also allow for rapid induction of ORC1 during spore germination and initiation of the first round of mitosis.
ORC1 is a model locus suitable to study the regulation of 5′-extended developmental stage specific transcripts and their role in controlling protein levels when cells switch from growth to development. Our findings extend the known roles of Ndt80/Sum1 to the transcriptional control of middle meiotic transcript isoforms. Bearing in mind that the DNA binding fold of Ndt80 was suggested to be evolutionarily linked to the major tumor suppressor TP53,Citation35 our results are potentially relevant for transcriptional mechanisms implicated in development and disease in humans.
Experimental procedures
Yeast strains
The tiling array data were produced with wild type SK1 MATa/α and sporulation deficient MATα/α control strains. RT-PCR assays were done with samples from SK1 MATa/α and JHY222 MATa/α as published.Citation23 The expression of the long ORC1 isoform was analyzed in JHY222 MATa/α ndt80 and sum1 homozygous deletion strains and JHY338 MATa/α ORC1ΔMSE (). Yeast strains were cultured at 30°C in standard rich medium with glucose (YPD) or acetate (YPA) and sporulation medium (SPII).
Table 1. Yeast strains.
Table 2. Oligonucleotides for RT-PCR assay.
Yeast Sc_tlg tiling array data and RNA-Sequencing data
In this study, we employed unpublished non-DNA strand-specific RNA-Sequencing data that were produced using the Illumina GAII system. Duplicate samples from wild type SK1 MATa/α and meiosis-deficient MATα/α control cells were cultured in rich medium (YPD), pre-sporulation medium (YPA), and sporulation medium (SPII, 4h, 6h, 8h; Becker et al., in preparation). Furthermore, we interpreted published Yeast Sc_tlg GeneChip expression data from duplicate samples of asynchronously growing SK1 MATa/α cells cultured in rich medium (YPD) or pre-sporulation medium (YPA), and differentiating cells cultured in sporulation medium (SPII). In addition, dividing and starving meiosis-deficient MATα/α cells were used as a control.Citation9 SK1 is a strain background commonly employed in genetic and genomic analyses of meiosis because of its efficient sporulation properties.Citation7 Published Sc_tlg GeneChip data from single samples of synchronized cells undergoing mitotic growth and division were obtained with the W101 MATa strain.Citation24 Mitotic gene expression is typically studied in haploid cells because of well-established cell synchronization protocols.Citation36,37 Graphical displays of tiling array data are available online at SGV (Saccharomyces Genome Viewer, sgv.genouest.orgCitation26) and RGV (ReproGenomics Viewer, rgv.genouest.orgCitation25). A DNA strand-specific RNA-Seq data set was used to interpret the transcriptomes of asynchronously growing haploid wild type and xrn1 temperature sensitive mutants in the S288C, W303, and SK1 backgrounds, and diploid SK1 wild type and xrn1 mutant cells.Citation5
RT-PCR assays
Total RNA was isolated using the hot phenol method as described.Citation7 Briefly, cell pellets were treated with hot phenol (65°C) and phenol/chloroform (1:1). Total RNA was precipitated overnight with 2 volumes of 100 % ethanol and 0.1 volume of 3 M NaOAc (pH 5) at −80°C. The RNA was digested with 2 units of DNaseI for 30 min at 37°C, and then 2 μg of RNA was reverse transcribed into cDNA using reverse transcriptase and random primers supplied in the High Capacity cDNA Reverse Transcription Kit (Applied Biosystems). 1 μl of cDNA was amplified for 28 cycles (denaturation at 94°C for 1 min, annealing at 60°C for 1 min, and extension at 72°C for 1 min) using Taq DNA Polymerase (Qiagen). PCR products were run on a 2% agarose gel in 1×TAE buffer containing GelRed DNA dye (Biotium) and photographed using the Gel Doc XR+ imaging system (Bio-Rad). Primer sequences are given in .
Prediction of MSEs
We screened a 2 kb region upstream of the annotated ORC1 locus (Chr13:14210-142210) using the Match tool of the TRANSFAC professional database.Citation38 We employed the MSE motif M01515 with cut-off scores minimizing false positives. The logo was produced with the R package seqLogo.Citation39,40 A single MSE motif was predicted with a core score of 1.00 and a matrix score of 0.949.
MSE deletion
The predicted Ndt80 target site MSE in the ORC1 promoter region was deleted using the 50:50 genome editing method as recently described.Citation41,42 Genomic PCR was used to screen deletion strains for successful integration/excision events. For this study we analyzed two independent isolates that were verified by DNA sequencing. We note that the construction of this strain required the ura3Δ0 auxotrophic marker present only in the JHY338 background, which is derived from prototrophic JHY222. Oligonucleotide sequences are given in .
Table 3. Oligonucleotides to construct and validate MSE deletion.
Sporulation landmarks
Diploid cells were cultured in growth medium, presporulation medium and sporulation medium, harvested, and fixed in ethanol as described.Citation7 The percentage of bi-, and tetranuclear cells and asci was determined using a standard manual cell counter.
Light- and fluorescence microscopy
Yeast cells were stained with DAPI (Interchim) at 5 μg/ml and inspected using a Zeiss AxioImager fluorescence microscope (Zeiss). Pictures were taken with an AxioCam camera using default settings of AxioVision software (Zeiss).
Protein analysis
Protein extracts were prepared and analyzed by Western blotting as published.Citation9 Briefly, 35 μg of a total protein extract was loaded on a 4-20% SDS-PAGE gradient gel, and run first at 60V for 30 minutes and then at 120 V for one hour. Proteins were transferred onto a PVDF membrane (Millipore) at 60mA for 2.5 hours using a semi-dry electroblotter (Hoefer). The membrane was blocked in 5% milk (Regilait) for one hour at room temperature, and incubated over night at 4°C on a shaker with the primary polyclonal anti-Orc1 antibody (Santa Cruz) at a dilution of 1:200. A monoclonal antibody against Pgk1 (Invitrogen) was used at 1:15′000. Secondary anti-goat and anti-mouse antibodies (ThermoScientific) diluted at 1:30'000 or 1:5000, respectively, were incubated at room temperature for one hour, before the signal was revealed using an ECL kit (General Electric) and the ChemiDoc XRS imaging system (Bio-Rad). Band intensities were quantified using Quantity One 1-D analysis software (Bio-Rad).
Disclosure of Potential Conflicts of Interest
No potential conflicts of interest were disclosed.
Supplemental_Data.zip
Download Zip (1.4 MB)Acknowledgments
We thank Olivier Collin and Olivier Sallou for the GenOuest bioinformatics infrastructure, Thomas Darde for extensive help with RGV, and Marc Descrimes for generating heatmaps representing RNA-Seq data.
Funding
This work was supported by a National Institute of Health grant (5P01HG000205) to R.W. Davis, a Ligue Contre le Cancer PhD fellowship to B. Xie and funding provided by the University of Rennes 1 and Institut National de Sante et de Recherche Medicale to M. Primig.
Related Research Data
References
- Li H, Stillman B. The origin recognition complex: a biochemical and structural view. Sub-cell Biochem 2012; 62:37-58; PMID:22918579; http://dx.doi.org/10.1007/978-94-007-4572-8_3
- Bell SP, Mitchell J, Leber J, Kobayashi R, Stillman B. The multidomain structure of Orc1p reveals similarity to regulators of DNA replication and transcriptional silencing. Cell 1995; 83:563-8; PMID:7585959; http://dx.doi.org/10.1016/0092-8674(95)90096-9
- Klemm RD, Austin RJ, Bell SP. Coordinate binding of ATP and origin DNA regulates the ATPase activity of the origin recognition complex. Cell 1997; 88:493-502; PMID:9038340; http://dx.doi.org/10.1016/S0092-8674(00)81889-9
- Vader G, Blitzblau HG, Tame MA, Falk JE, Curtin L, Hochwagen A. Protection of repetitive DNA borders from self-induced meiotic instability. Nature 2011; 477:115-9; PMID:21822291; http://dx.doi.org/10.1038/nature10331
- Wery M, Descrimes M, Vogt N, Dallongeville AS, Gautheret D, Morillon A. Nonsense-Mediated Decay Restricts LncRNA Levels in Yeast Unless Blocked by Double-Stranded RNA Structure. Mol Cell 2016; 61(3):379-92; PMID:26805575
- Chu S, DeRisi J, Eisen M, Mulholland J, Botstein D, Brown PO, Herskowitz I. The transcriptional program of sporulation in budding yeast. Science 1998; 282:699-705; PMID:9784122; http://dx.doi.org/10.1126/science.282.5389.699
- Primig M, Williams RM, Winzeler EA, Tevzadze GG, Conway AR, Hwang SY, Davis RW, Esposito RE. The core meiotic transcriptome in budding yeasts. Nat Genet 2000; 26:415-23; PMID:11101837; http://dx.doi.org/10.1038/82539
- Rabitsch KP, Toth A, Galova M, Schleiffer A, Schaffner G, Aigner E, Rupp C, Penkner AM, Moreno-Borchart AC, Primig M, et al. A screen for genes required for meiosis and spore formation based on whole-genome expression. Curr Biol 2001; 11:1001-9; PMID:11470404; http://dx.doi.org/10.1016/S0960-9822(01)00274-3
- Lardenois A, Liu Y, Walther T, Chalmel F, Evrard B, Granovskaia M, Chu A, Davis RW, Steinmetz LM, Primig M, et al. Execution of the meiotic noncoding RNA expression program and the onset of gametogenesis in yeast require the conserved exosome subunit Rrp6. Proc Natl Acad Sci U S A 2011; 108:1058-63; PMID:21149693; http://dx.doi.org/10.1073/pnas.1016459108
- Maier P, Rathfelder N, Maeder CI, Colombelli J, Stelzer EH, Knop M. The SpoMBe pathway drives membrane bending necessary for cytokinesis and spore formation in yeast meiosis. EMBO J 2008; 27:2363-74; PMID:18756268; http://dx.doi.org/10.1038/emboj.2008.168
- Neil H, Malabat C, d'Aubenton-Carafa Y, Xu Z, Steinmetz LM, Jacquier A. Widespread bidirectional promoters are the major source of cryptic transcripts in yeast. Nature 2009; 457:1038-42; PMID:19169244; http://dx.doi.org/10.1038/nature07747
- Xu Z, Wei W, Gagneur J, Perocchi F, Clauder-Munster S, Camblong J, Guffanti E, Stutz F, Huber W, Steinmetz LM. Bidirectional promoters generate pervasive transcription in yeast. Nature 2009; 457:1033-7; PMID:19169243; http://dx.doi.org/10.1038/nature07728
- Brar GA, Yassour M, Friedman N, Regev A, Ingolia NT, Weissman JS. High-resolution view of the yeast meiotic program revealed by ribosome profiling. Science 2012; 335:552-7; PMID:22194413; http://dx.doi.org/10.1126/science.1215110
- Xu L, Ajimura M, Padmore R, Klein C, Kleckner N. NDT80, a meiosis-specific gene required for exit from pachytene in Saccharomyces cerevisiae. Mol Cell Biol 1995; 15:6572-81; PMID:8524222; http://dx.doi.org/10.1128/MCB.15.12.6572
- Corbi D, Sunder S, Weinreich M, Skokotas A, Johnson ES, Winter E. Multisite phosphorylation of the Sum1 transcriptional repressor by S-phase kinases controls exit from meiotic prophase in yeast. Mol Cell Biol 2014; 34:2249-63; PMID:24710277; http://dx.doi.org/10.1128/MCB.01413-13
- Xie J, Pierce M, Gailus-Durner V, Wagner M, Winter E, Vershon AK. Sum1 and Hst1 repress middle sporulation-specific gene expression during mitosis in Saccharomyces cerevisiae. Embo J 1999; 18:6448-54; PMID:10562556; http://dx.doi.org/; http://dx.doi.org/10.1093/emboj/18.22.6448
- Pierce M, Benjamin KR, Montano SP, Georgiadis MM, Winter E, Vershon AK. Sum1 and Ndt80 proteins compete for binding to middle sporulation element sequences that control meiotic gene expression. Mol Cell Biol 2003; 23:4814-25; PMID:12832469; http://dx.doi.org/10.1128/MCB.23.14.4814-4825.2003
- Tsuchiya D, Yang Y, Lacefield S. Positive feedback of NDT80 expression ensures irreversible meiotic commitment in budding yeast. PLoS Genet 2014; 10:e1004398; PMID:24901499; http://dx.doi.org/10.1371/journal.pgen.1004398
- Winter E. The Sum1/Ndt80 transcriptional switch and commitment to meiosis in Saccharomyces cerevisiae. Microbiol Mol Biol Rev 2012; 76:1-15; PMID:22390969; http://dx.doi.org/10.1128/MMBR.05010-11
- Klutstein M, Siegfried Z, Gispan A, Farkash-Amar S, Zinman G, Bar-Joseph Z, Simchen G, Simon I. Combination of genomic approaches with functional genetic experiments reveals two modes of repression of yeast middle-phase meiosis genes. BMC Genomics 2010; 11:478; PMID:20716365; http://dx.doi.org/10.1186/1471-2164-11-478
- Spivak AT, Stormo GD. ScerTF: a comprehensive database of benchmarked position weight matrices for Saccharomyces species. Nucleic Acids Res 2012; 40:D162-8; PMID:22140105; http://dx.doi.org/10.1093/nar/gkr1180
- Van Loo P, Marynen P. Computational methods for the detection of cis-regulatory modules. Brief Bioinform 2009; 10:509-24; PMID:19498042; http://dx.doi.org/10.1093/bib/bbp025
- Lardenois A, Stuparevic I, Liu Y, Law MJ, Becker E, Smagulova F, Waern K, Guilleux MH, Horecka J, Chu A, et al. The conserved histone deacetylase Rpd3 and its DNA binding subunit Ume6 control dynamic transcript architecture during mitotic growth and meiotic development. Nucleic Acids Res 2015; 43:115-28; PMID:25477386; http://dx.doi.org/10.1093/nar/gku1185
- Granovskaia MV, Jensen LJ, Ritchie ME, Toedling J, Ning Y, Bork P, Huber W, Steinmetz LM. High-resolution transcription atlas of the mitotic cell cycle in budding yeast. Genome Biol 2010; 11:R24; PMID:20193063; http://dx.doi.org/10.1186/gb-2010-11-3-r24
- Darde TA, Sallou O, Becker E, Evrard B, Monjeaud C, Le Bras Y, Jégou B, Collin O, Rolland AD, Chalmel F. The ReproGenomics Viewer: an integrative cross-species toolbox for the reproductive science community. Nucleic Acids Res 2015; 43:W109-16; PMID:25883147; http://dx.doi.org/10.1093/nar/gkv345
- Lardenois A, Gattiker A, Collin O, Chalmel F, Primig M. GermOnline 4.0 is a genomics gateway for germline development, meiosis and the mitotic cell cycle. Database 2010; 2010:baq030; PMID:21149299; http://dx.doi.org/10.1093/database/baq030
- Chang DT, Huang CY, Wu CY, Wu WS. YPA: an integrated repository of promoter features in Saccharomyces cerevisiae. Nucleic Acids Res 2011; 39:D647-52; PMID:21045055; http://dx.doi.org/10.1093/nar/gkq1086
- Liti G, Carter DM, Moses AM, Warringer J, Parts L, James SA, Davey RP, Roberts IN, Burt A, Koufopanou V, et al. Population genomics of domestic and wild yeasts. Nature 2009; 458:337-41; PMID:19212322; http://dx.doi.org/10.1038/nature07743
- Kim Guisbert KS, Zhang Y, Flatow J, Hurtado S, Staley JP, Lin S, Sontheimer EJ. Meiosis-induced alterations in transcript architecture and noncoding RNA expression in S. cerevisiae. RNA 2012; 18:1142-53; PMID:22539527; http://dx.doi.org/10.1261/rna.030510.111
- Wilhelm BT, Marguerat S, Watt S, Schubert F, Wood V, Goodhead I, Penkett CJ, Rogers J, Bähler J. Dynamic repertoire of a eukaryotic transcriptome surveyed at single-nucleotide resolution. Nature 2008; 453:1239-43; PMID:18488015; http://dx.doi.org/10.1038/nature07002
- Wyers F, Rougemaille M, Badis G, Rousselle JC, Dufour ME, Boulay J, Régnault B, Devaux F, Namane A, Séraphin B, et al. Cryptic pol II transcripts are degraded by a nuclear quality control pathway involving a new poly(A) polymerase. Cell 2005; 121:725-37; PMID:15935759; http://dx.doi.org/10.1016/j.cell.2005.04.030
- Hongay CF, Grisafi PL, Galitski T, Fink GR. Antisense transcription controls cell fate in Saccharomyces cerevisiae. Cell 2006; 127:735-45; PMID:17110333; http://dx.doi.org/10.1016/j.cell.2006.09.038
- van Werven FJ, Neuert G, Hendrick N, Lardenois A, Buratowski S, van Oudenaarden A, Primig M, Amon A. Transcription of two long noncoding RNAs mediates mating-type control of gametogenesis in budding yeast. Cell 2012; 150:1170-81; PMID:22959267; http://dx.doi.org/10.1016/j.cell.2012.06.049
- Pelechano V, Steinmetz LM. Gene regulation by antisense transcription. Nat Rev Genet 2013; 14:880-93; PMID:24217315; http://dx.doi.org/10.1038/nrg3594
- Lamoureux JS, Stuart D, Tsang R, Wu C, Glover JN. Structure of the sporulation-specific transcription factor Ndt80 bound to DNA. EMBO J 2002; 21:5721-32; PMID:12411490; http://dx.doi.org/10.1093/emboj/cdf572
- Cho RJ, Campbell MJ, Winzeler EA, Steinmetz L, Conway A, Wodicka L, Wolfsberg TG, Gabrielian AE, Landsman D, Lockhart DJ, et al. A genome-wide transcriptional analysis of the mitotic cell cycle. Mol Cell 1998; 2:65-73; PMID:9702192; http://dx.doi.org/10.1016/S1097-2765(00)80114-8
- Spellman PT, Sherlock G, Zhang MQ, Iyer VR, Anders K, Eisen MB, Brown PO, Botstein D, Futcher B. Comprehensive identification of cell cycle-regulated genes of the yeast Saccharomyces cerevisiae by microarray hybridization. Mol Biol Cell 1998; 9:3273-97; PMID:9843569; http://dx.doi.org/10.1091/mbc.9.12.3273
- Matys V, Kel-Margoulis OV, Fricke E, Liebich I, Land S, Barre-Dirrie A, Reuter I, Chekmenev D, Krull M, Hornischer K, et al. TRANSFAC and its module TRANSCompel: transcriptional gene regulation in eukaryotes. Nucleic Acids Res 2006; 34:D108-10; PMID:16381825; http://dx.doi.org/10.1093/nar/gkj143
- 3-900051-07-0 RDCTI. R: A language and environment for statistical computing. R Foundation for Statistical Computing, Vienna, Austria, 2012.
- Bembom O. seqLogo: Sequence logos for DNA sequence alignments.R package
- Lardenois A, Stuparevic I, Liu Y, Law MJ, Becker E, Smagulova F, Waern K, Guilleux MH, Horecka J, Chu A, et al. The conserved histone deacetylase Rpd3 and its DNA binding subunit Ume6 control dynamic transcript architecture during mitotic growth and meiotic development. Nucleic Acids Res 2015; 43:115-28; PMID:25477386; http://dx.doi.org/10.1093/nar/gku1185
- Horecka J, Davis RW. The 50:50 method for PCR-based seamless genome editing in yeast. Yeast 2014; 31:103-12; PMID:24639370; http://dx.doi.org/10.1002/yea.2992