
ABSTRACT
The unstable (CTG·CAG)n trinucleotide repeat in the myotonic dystrophy type 1 (DM1) locus is bidirectionally transcribed from genes with terminal overlap. By transcription in the sense direction, the DMPK gene produces various alternatively spliced mRNAs with a (CUG)n repeat in their 3′ UTR. Expression in opposite orientation reportedly yields (CAG)n-repeat containing RNA, but both structure and biologic significance of this antisense gene (DM1-AS) are largely unknown. Via a combinatorial approach of computational and experimental analyses of RNA from unaffected individuals and DM1 patients we discovered that DM1-AS spans >6 kb, contains alternative transcription start sites and uses alternative polyadenylation sites up- and downstream of the (CAG)n repeat. Moreover, its primary transcripts undergo alternative splicing, whereby the (CAG)n segment is removed as part of an intron. Thus, in patients a mixture of DM1-AS RNAs with and without expanded (CAG)n repeat are produced. DM1-AS expression appears upregulated in patients, but transcript abundance remains very low in all tissues analyzed. Our data suggest that DM1-AS transcripts belong to the class of long non-coding RNAs. These and other biologically relevant implications for how (CAG)n-expanded transcripts may contribute to DM1 pathology can now be explored experimentally.
Introduction
During the last decade it has become clear that the eukaryotic genome is transcribed in a pervasive manner, whereby RNA synthesis occurs from both strands of the DNA for a significant number of loci.Citation1,2 Production of sense and antisense transcript pairs from a particular locus is thus a relatively frequent event. The actual expression and structure of the RNAs formed may depend on convergent or divergent orientation of the transcribed DNA segments, chromatin embedding of the locus, complementary overlap between RNA products and ultimately the mode of RNA processing.
As only a minority of all transcripts contain evolutionary conserved open reading frames or represent well-characterized structural or catalytic RNAs, most transcripts have a still unknown function. Collectively, these RNAs make up what is referred to as pools of stable unannotated transcripts (SUTs) or cryptic unstable transcripts (CUTs), for which intergenic, intronic and cis-antisense long noncoding RNAs (lncRNAs) are main representatives.Citation3 Based on recent evidence that lncRNAs and other types of non-coding RNAs are not merely genomic by-products, but could be key elements of cellular homeostasis,Citation4 attention is now increasingly focused on the understanding of how structural alteration and dysregulation of production of non-coding RNAs is inherent in development and progression of human diseases.
Neurodegenerative diseases that have been associated with transcription across loci that contain unstable repeat sequences (usually trinucleotide motifs of variable lengthCitation5,6) form particularly interesting cases for non-coding and antisense RNA research. Currently, microsatellite instability has been identified as the cause of disease for >30 disorders. Well-known examples are myotonic dystrophy, Huntington's disease, Fragile X syndrome, several spinocerebellar ataxias (SCAs) and C9orf72-related amyotrophic lateral sclerosis with frontotemporal dementia (ALS/FTD). Protein-coding transcripts from repeat-containing loci produced in sense orientation were originally considered the only molecular actors in disease manifestation. Nowadays, however, it is becoming clear that the pathogenic picture is much more complex and involves expression of antisense transcripts from the same locus, usually cis-antisense type lncRNAs.Citation7-11 Specific disease features are usually coupled to microsatellite sequences in sense transcripts and can be ribostasis- or proteostasis-related, dependent on whether the repeat sequence is located in the 5′ or 3′ UTR region of the transcript, in an intron or in the ORF that encodes the final protein product. It cannot be excluded, however, that disease features are also, or maybe specifically, associated with the complementary repeat element in antisense RNA products from the same locus. Besides, pathogenicity may be coupled to the actual bidirectional transcription process through the microsatellite tract itself, as transcription is known to enhance repeat instability and thus may modulate disease progression.Citation12-14
Myotonic dystrophy type 1 (DM1), an autosomal-dominant multisystemic disorder caused by expansion of a (CTG·CAG)n repeat in the DMPK gene is the archetypal example of a repeat disease with complex RNA-related etiology. In the healthy population, the (CTG·CAG)n repeat is polymorphic in length and consists of 5–37 triplets, whereas DM1 patients carry a DMPK allele with 50 to up to several thousands of triplets. When transcribed in the sense direction from the mutant allele, an abnormal DMPK mRNA is produced with a long hairpin-forming (CUG)n repeat sequence in its 3′ UTR.Citation15-17 In the DM field there is strong support for this RNA being the primary and dominant cause of toxic gain-of-function effects that give the disease its complex and unpredictable character.Citation18,19 Expanded DMPK transcripts are largely retained in the nucleus and form abnormal RNP aggregates by sequestration of transcription factors and RNA-binding proteins.Citation20,21 This leads to RNP-related stress that can deregulate transcription and have effects on processing of other mRNAs and miRNAs.Citation21,22 A new potentially toxic mechanism has been recently described, by which homopolymeric proteins are formed by repeat-associated non-ATG (RAN) translation across the triplet repeat segment in the RNA.Citation23,24
The picture that posits abnormal, sense DMPK (CUG)n mRNA as the root cause of problems in DM1 may not be complete, as also antisense transcription through the repeat region in the DM1 locus has been observed.Citation25 Antisense transcription across the (CTG·CAG)n repeat was reported to emanate from the adjacent SIX5 regulatory region.Citation25 The actual unit that is transcribed in antisense direction may thereby extend into a chromatin insulator element formed by 2 CTCF-binding sites that flank the (CTG·CAG)n repeat.Citation26 Based on these findings a role for gene products from the region in regulating the surrounding chromatin structure has been proposed.Citation25 Thus far, however, few dedicated analyses were conducted of expression of (CAG)n-repeat segments or flanking regions in antisense RNA transcripts.Citation23,27-29 As a consequence, while detailed knowledge is available on sense genes DMWD, DMPK and SIX5 in the DM1 locus, information on the antisense gene, here coined DM1-AS, and its products is still scarce.
We investigated DM1-AS transcripts in silico and in vitro using a combinatorial approach of bioinformatics analyses of transcriptome-wide data and wet-laboratory experiments based on healthy and DM1 samples. Our data point to the existence of a DM1-AS transcription unit that is much larger than originally assumed. Primary DM1-AS transcripts occur as very low abundant RNAs of different lengths - with and without the (CAG)n repeat - due to alternative polyadenylation. Alternative splicing may remove the (CAG)n repeat from the longer DM1-AS RNAs as part of an intron, similar to what happens with the (CCUG)n repeat in DM type 2. Thus, DM1 tissues contain a heterogeneous population of DM1-AS transcripts with and without expanded (CAG)n repeat. We discuss how our findings may help to experimentally explore the normal and pathobiological role of DM1-AS RNA further.
Results
Antisense transcription in the DM1 locus occurs specifically in the SIX5-DMPK region
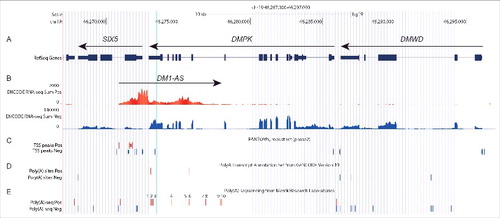
The Encyclopedia of DNA Elements (ENCODE) project has systematically mapped regions of transcription in a large collection of >35 cell lines, including HeLa-S3, K562, HSMM and many others (see Materials and Methods).Citation30 We used this data, specifically the cumulative scores for RNA-seq signals per strand, to visualize regions in the DM1 locus that are transcribed. As expected, RNA-seq signal distribution on one strand (the negative strand) was fully in agreement with previously annotated gene structures of DMWD, DMPK and SIX5, as indicated by the high signal from known exons ( and ). On the positive strand, i.e. the orientation antisense with respect to DMPK and SIX5, RNA-seq signal was relatively low but persistent throughout the region complementary to SIX5 intron 1 to DMPK intron 9. This signal, which we termed DM1-AS (for DM1 antisense) RNA, was unlikely to be noise-related, since similar RNA-seq signals were not observed elsewhere in the DM1 locus. Even though no absolute exon-intron boundaries could be discerned in the DM1-AS RNA-seq signal, the intensity in the mid-region of the presumed transcription unit, where the (CAG)n repeat is located, clearly appeared lower.
Figure 1. DM1-AS overlaps with SIX5 and DMPK. UCSC genome browser view of the human DM1 locus. (A) Annotated protein-coding and non-coding genes taken from the NCBI Reference Sequences Database (RefSeq). Sense genes DMWD, DMPK and SIX5 are depicted. The position of the (CAG·CTG)n repeat is indicated with a vertical light blue line. (B) Long RNA-seq reads from a variety of cell types and tissues shown as cumulative signal per strand (ENCODE). RNA-seq signals from sense transcripts (blue) correspond with known exons in DMWD, DMPK and SIX5. Signals originating from the complementary strand (red) are low, but well above background, clearly indicating the occurrence of an antisense gene which we coined DM1-AS (large arrow pointing to the right). (C) Multiple transcription start sites (TSSs) related to DM1-AS expression (red) as well as for sense genes DMWD, DMPK and SIX5 (blue) (FANTOM5). (D) Poly(A) transcript annotation by GENCODE version 19. Poly(A) sites for antisense transcripts are shown in red; those for sense transcripts in blue. (E) Poly(A)-seq signals from Merck Research Laboratories. Multiple poly(A) sites were described for DM1-AS (red, numbered 1 to 10) as well as for DMWD, DMPK and SIX5 (blue). See Fig. S3 for more details on TSS and poly(A) sites.
Since the DM1 locus, comprising DMWD, DMPK and SIX5, is located in a syntenic chromosome region well conserved between human and mouse,Citation31 we wanted to learn about the degree of evolutionary conservation of DM1-AS, as this is often used as a measure for the biologic significance of genome elements. Unfortunately, high gene density in this chromosome region and inability to separate evolutionary pressure between the 2 DNA strands obscured analysis and made it difficult to come to predictive conclusions (Fig. S1). ENCODE RNA-seq data from mouse tissues learned that, as expected, RNA-seq signal of the sense genes was in agreement with previously annotated gene structures (Fig. S2). In the antisense direction, the signal was low, but started in the same region as in humans, complementary to Six5 intron 1. Unlike in human cells, a defined 3′ end of the transcription unit could not easily be identified in these mouse samples.
DM1-AS transcription starts in the region complementary to intron 1-exon 1 of SIX5
To identify potential transcription start sites (TSSs) in DM1-AS, we used data from the functional annotation of the mammalian genome 5 (FANTOM5) project.Citation32 We identified multiple TSSs for both the sense genes (DMWD, DMPK, SIX5) and the antisense gene (DM1-AS) (; Fig. S3). TSSs for DM1-AS were located in the region complementary to SIX5 intron 1 and exon 1, which matches the edge of the previously observed RNA-seq signal ().
To try to clarify TSS usage further, we analyzed ENCODE data regarding positioning of histone modification H3K4me3, a regional mark of regulatory elements primarily associated with promoters and TSSs.Citation30 H3K4me3 signal extended into the presumed DM1-AS promoter, but appeared difficult to interpret due to overlap with the SIX5 promoter in the same area (Fig. S4).
For an interspecies comparison, we analyzed FANTOM5 data on TSSs and their usage in mouse primary cells, cell lines and tissues. Multiple TSSs were again identified for the sense genes. For the opposite strand, only one TSS was described in the region complementary to Six5 intron 1, matching the start of the observed RNA-seq signal for Dm1-as (Fig. S2) and the location of the human gene. The relevance of this DM1-AS TSS is further supported by the evolutionary conservation of a corresponding segment in the center of intron 1 of SIX5 (Fig. S1).
Multiple poly(A) sites for DM1-AS transcription exist 5′ and 3′ from the (CAG)n repeat
To examine 3′ end formation of DM1-AS transcripts, we focused on polyadenylation and potential poly(A) sites. ENCODE RNA-seq data include findings with both poly(A)-depleted and poly(A)-selected RNA, which allowed us to determine a signal ratio of poly(A)-depleted versus poly(A)-selected RNA for transcripts from the DM1 locus (). The poly(A)-depleted: poly(A)-selected ratio in DM1-AS did not significantly differ from those of the 3 sense transcripts from the DM1 locus, suggesting equal presence of poly(A) tails on DM1-AS, DMWD, DMPK and SIX5 transcripts.
Figure 2. DM1-AS transcripts may be polyadenylated via poly(A) sites 5′ or 3′ of the (CAG)n repeat. (A) Box plot of ENCODE RNA-seq signal ratio between poly(A)-depleted (poly(A)-) and poly(A)-selected (poly(A)+) RNA samples for each of the 4 genes from the DM1 locus. (B) Poly(A)-site usage based on data from Merck Research Laboratories from UHR (universal human reference), brain, kidney, liver, muscle and testis. Numbering of poly(A) sites refers to . Note that sites 1–3 are located 5′ of the (CAG)n repeat, whereas sites 4–10 are located 3′ of the repeat. Bars represent mean + SEM. (C) RT-PCR approach to examine DM1-AS poly(A)-site usage. RT reaction was performed with an adaptor-(dT)10 primer to start reverse transcription specifically at a poly(A) stretch. PCR was subsequently performed using specific forward primers E, I, or J, each located upstream of the putative poly(A) addition sites. Successful DNA production from amplicons was analyzed on blot using 32P-labeled oligo probes X, Y, and Z. Predicted amplicon lengths, based on adaptor-(dT)10 primer annealing immediately at the 5′ end of the poly(A) tail, are given (annealing more downstream in the poly(A) tail may occur and would result in a slightly larger fragment). (D) The protocol illustrated in (C) was applied to 5 samples: I: healthy human myoblasts (5/5); II: DM1 myoblasts (13/800); III: CDM psoas muscle (12/1300); IV: DM500 myoblasts (DM500); V: RT-minus control. Interpretation of the signals, taking predicted amplicon lengths (C) into account, is indicated on the right. Citation1 The 410 bp amplicon may arise from an A-stretch in the genome. Citation2 Signals that cannot be explained with current knowledge.
By using amplicons corresponding to different parts of the presumed DM1-AS gene in RT-PCR, we verified polyadenylation of DM1-AS transcripts in healthy human myoblasts carrying 2 (CTG·CAG)5 alleles (5/5) and in muscle tissue from a DM1 patient (12/1300) (Fig. S5). Two RNA fractions were compared: (i) poly(A)-selected RNA, isolated through binding to oligo(dT) beads and (ii) poly(A)-depleted RNA representing unbound RNA. Most DM1-AS amplicons were detected in both fractions, confirming that a significant fraction (30–45%) of DM1-AS transcripts contains a poly(A) tail. Besides, using this assay, no obvious differences in polyadenylation status of DM1-AS RNA between unaffected and patient samples were detected.
A subsequent search predicted multiple poly(A) sites in the DM1-AS region, according to GENCODE poly(A) transcript annotationCitation33 and poly(A)-seq results by Merck Research LaboratoriesCitation34 ( and ; Fig. S3). Sequences flanking these poly(A) sites were analyzed for the presence of a poly(A) signal, generally located 10–30 nucleotides upstream of the actual poly(A) addition site, which constitutes a CPSF binding siteCitation35,36 (Table S1). Presence of a GU-rich region downstream of the cleavage site essential for binding of CSTFCitation35-37 was also monitored (Table S1). Interestingly, we found a few poly(A) sites upstream from the (CAG)n repeat, which indicates that short primary DM1-AS transcripts are formed that do not contain a (CAG)n repeat (∼10% of molecules in the total DM1-AS population; ). Poly(A) sites in the region complementary to DMPK intron 10 and 9 were most frequently used (85%) in the samples analyzed by Merck Research Laboratories.
Parallel study of poly(A)-seq data from Merck Research Laboratories for mouse tissues suggest that the most frequently used poly(A) site for the Dm1-as gene in this species is located in the region complementary to Dmpk intron 2 (Fig. S2). Thus, although the 5′ end of Dm1-as matched with that of DM1-AS in humans, its 3′ end probably extends much further downstream.
Poly(A) site usage in human myoblasts was assessed by RT-PCR, where we focused on preferred sites, located both 5′ and 3′ of the (CAG)n repeat (). Total RNA was reverse transcribed using an adaptor-(dT)10 primer,Citation38 which only allowed cDNA synthesis of poly(A)-containing transcripts, followed by a PCR with a DM1-AS specific forward primer (see protocol in ). For a sensitive detection, PCR products were transferred to a membrane and hybridized with a select set of 32P-labeled oligo probes. In RNA isolated from healthy human (5/5) myoblasts, use of poly(A) sites both 5′ and 3′ from the (CAG)n repeat was observed (). In the same analysis, we also used RNA from human DM1 myoblasts (13/800), CDM psoas muscle (12/1300) and from mouse DM500 myoblasts which carry the complete human DM1 locus with a (CTG·CAG)500 repeat.Citation39 The latter sample was included to assess the effect of (CAG)n repeat expansion on DM1-AS poly(A)-site usage without confounding products from a healthy human locus. In all these DM1 samples DM1-AS poly(A) sites 5′ as well as 3′ of the (CAG)n repeat were used (). Taking the weight of our bioinformatics data and RT-PCR findings combined, we conclude that transcripts from the DM1-AS gene form a mixture of RNAs with and without a (CAG)n repeat.
The (CAG)n repeat is located in an alternatively spliced DM1-AS intron
As judged from differential TSS and poly(A) site usage, primary DM1-AS transcripts vary between 1.2 and 6 kb in length (). We next wondered whether these primary gene products would be subject to splicing and looked for splice junctions in ENCODE RNA-seq data. At least 16 splice donor sites and 15 splice acceptor sites were identified (; Tables S2 and S3, and Fig. S6). Frequency of splice site usage calculated based on the number of reads over a splice junction (exon into exon) and the number of reads over an unused splice site (exon into retained intron) was 2–50% (). A number of these DM1-AS splice sites and combinations of splice modes were confirmed by RT-PCR using RNA from healthy human and DM500 myoblasts (Fig. S6). Identified splice sites conformed to consensus sequences MAG|gtragt and yag|RNN at the 5′ and 3′ end of the intron respectively (; Tables S2 and S3). Notably, we identified several splice modes where the (CAG)n repeat was located in a large intron, indicative of a novel pathological cascade in DM1 by which an expanded (CAG)n repeat may end up in a lariat structure ( and Fig. S6).
Figure 3. The (CAG)n repeat is occasionally spliced out as part of a large intron. (A) Splice donor and acceptor sites in DM1-AS were identified in ENCODE RNA-seq data. Multiple alternative splice modes are used, the most frequent of which are shown here. Some splice modes include the removal of the (CAG)n repeat (vertical blue bar) as part of a large alternatively spliced intron. Gray shading indicates frequently used exons (dark) and introns (light). Donor and acceptor splice sites are indicated as 5′ and 3′ and numbered with capital and small Roman numerals, respectively (5's indicates 2 donor sites in close proximity). Fig. S6 shows all identified splice modes in our study. (B) Nucleotide frequency plot summarizing all identified splice site sequences (listed in Tables S2 and S3). The GT/AG conservation at donor/acceptor sites of introns is observed for most predicted sites. (C) Frequency of splice site usage based on individual DM1-AS reads in ENCODE RNA-seq data. (D) To examine the composition and length of the DM1-AS transcript population, size-fractionated RNAs from healthy (5/5) myoblasts and CDM (5/1300) gastrocnemius muscle were used as input (size in kb indicated on top) in a series of RT-PCR reactions covering DM1-AS (8 amplicons, locations in (A); for approach see Fig. S5 and Materials and Methods).
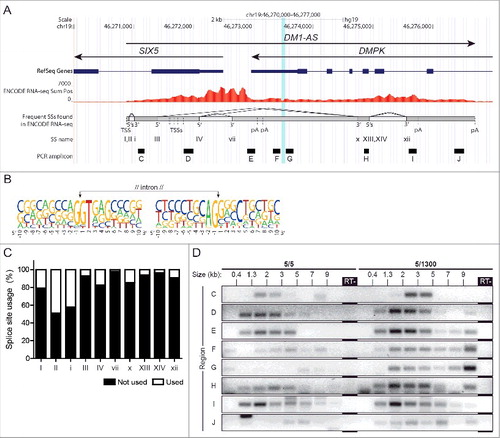
To gain insight in the actual size of primary and processed transcripts in the steady-state pool of DM1-AS RNAs, we size fractionated RNA from healthy myoblasts and DM1 gastrocnemius muscle and analyzed each fraction for DM1-AS RNA abundance. We first confirmed that the fractionation was successful via RT-PCR using known reference transcripts of different size (MAP3K4, DMPK and GAPDH) (Fig. S7). As anticipated, the influence of an expanded (CUG)n repeat on DMPK transcript migration was readily visible when comparing healthy and CDM material. Size-fractionated RNA was analyzed for relative expression of multiple regions covering the entire DM1-AS gene (). Healthy myoblast RNA showed prominent signals in essentially all fractions between 0.4 and 7 kb, corroborating our other findings and suggesting that DM1-AS RNAs exist as a heterogeneous population. CDM gastrocnemius RNA in addition showed more prominent signal strength in fractions with RNA of >7 kb in length. We take this as evidence for presence of DM1-AS transcripts containing a (CAG)1300 repeat originating from the expanded allele, which renders these RNAs ∼4 kb longer than normal-sized transcripts. Broadening of the size distribution is similar to that occurring with the population of DMPK transcripts, when comparing RNA isolates from unaffected 5/5 and affected 5/1300 muscle (Fig. S7).
DM1-AS transcripts are present in the nucleus and in the cytoplasm
ENCODE RNA-seq data was also used to obtain clues about the cellular localization of DM1-AS transcripts. Earlier observations made in our laboratoryCitation40 and by othersCitation41 already found a rather high nucleus: cytoplasm distribution ratio for DMPK mRNA. Comparison of signal ratio from nuclear and cytoplasmic fractions of transcripts from the DM1 locus demonstrated that also a relatively high proportion of DM1-AS transcripts – higher than for DMWD and SIX5 RNAs – resided in the nucleus (). Some care should be taken in interpreting these data, however, since the calculation for DM1-AS was based on transcripts from the whole transcription unit, because precise sequence information regarding mature, processed DM1-AS RNAs is still unknown. Discrimination between sequences specific for primary and processed DM1-AS RNA, as was done for sense transcripts from DMWD, SIX5 and DMPK, was therefore not possible.
Figure 4. DM1-AS transcripts are present in the nucleus as well as the cytoplasm. (A) Box plots of ENCODE RNA-seq signal ratio between nuclear and cytoplasmic RNA for each of the 4 transcripts from the DM1 locus. The ratio for DM1-AS differs significantly from the ratio for DMWD and SIX5, indicating that DM1-AS transcripts reside more in the nucleus. (B) RT-PCR expression analysis of various regions of DM1-AS (A-J; see and Fig. S5 for location of these amplicons). Nuclear RNA (Nu), cytoplasmic RNA (Cy) and RT-minus control (R-) from healthy (5/5), DM1 (13/800) and DM1 mouse model (DM500) myoblasts were used as input. Regions A and B, located upstream from DM1-AS, were included as negative controls. Quantification of DM1-AS signals in regions C-J is shown in (C). Bars represent mean + SEM. Black, nuclear RNA; white, cytoplasmic RNA.
To experimentally validate these bioinformatics data, we analyzed how frequent sequences from different regions from the putative DM1-AS gene (for approach see Fig. S5) were represented in nuclear and cytoplasmic RNA fractions from different types of myoblasts. First, efficiency of nuclear-cytoplasmic RNA fractionation was verified by monitoring distribution of pre-mRNA DMPK and mature ACTB transcripts, used as reference (Fig. S8). We observed expression of essentially all DM1-AS regions in healthy (5/5) myoblast RNA, with stronger signals for the nuclear samples (). As anticipated, 2 control regions upstream from DM1-AS (regions A and B) showed no signal. To analyze whether nuclear retention of DM1-AS transcripts would be more pronounced for RNAs carrying an expanded (CAG)n repeat, we analyzed human DM1 (13/800) and DM1 mouse model (DM500) myoblast RNAs (). Again, we observed signal from all segments of DM1-AS, with strongest intensities in the nuclear fraction. No stronger nuclear retention than for normal-sized DM1-AS transcripts was observed (), which suggests that nuclear retention may be an intrinsic property that is not dominated by presence of an expanded (CAG)n repeat. In fact, a fair proportion of DM1-AS transcripts may have lost their (CAG)n repeat during splicing, as part of an intron.
Multiple short ORFs are encoded by DM1-AS transcripts
To elaborate on a potential function for DM1-AS transcripts, we analyzed its encoded open reading frames (ORFs). In our prediction from sequence analysis, we included regular AUG-initiated and RAN-initiated ORFs, which can run across the long (CAG)n repeat (Fig. S9). Among many ORFs identified, the longest one specified a >200 amino acid-long protein, while the second longest consisted of 171 amino acids and continued over a splice site. These ORFs both used the first AUG codon present in DM1-AS. Only one ORF, starting with an AUG codon much more downstream, encompassed the (CAG)n repeat and would encode a polypeptide of 78 amino-acids + polySer-stretch (Fig. S9).
Each of the hypothetical peptides longer than 7 amino acids was analyzed with Globplot2, an algorithm for predicting intrinsic protein disorder, domains and globularity.Citation42 None showed SMART/Pfam domains and only 2 showed globular domains (data not shown). Furthermore, no region of significant sequence similarity was found for any of these hypothetical peptides in the Conserved Domain Database.Citation43
Finally, we analyzed ribosome profiling (ribo-seq) data provided by genome-wide information on protein synthesis (GWIPS), available via a dedicated ribo-seq genome browser.Citation44 Unfortunately, data was not strand-specific and DM1-AS information overlapped with those of SIX5 and DMPK (Fig. S9). With the information retrieved from these data, we can thus neither confirm nor exclude protein-coding potential of DM1-AS.
DM1-AS expression level is very low, but increases with disease severity
Finally, we quantified DM1-AS expression level in more detail. Our analyses were hindered by extremely low signal frequencies and by uncertainties regarding splice site choices, coupled to the apparent lack of signal variation across putative exon and intron areas () and the possibility of alternative RNA processing ( and ). We therefore used the complete DM1-AS gene for the FPKM (Fragments Per Kilobase Of Exon Per Million Reads Mapped) calculation in ENCODE RNA-seq data from 16 cell lines, including SkMC (). The choice for the complete DM1-AS gene may have led to an underestimation of DM1-AS expression in comparison to other transcripts. DM1-AS expression varied between cell lines and was 4–40-fold lower than that of DMPK (). Parallel assessment of expression levels using poly(A)-seq data (Merck Research Laboratories) of various tissues revealed that DM1-AS expression was lowest in brain and highest in kidney, testis and muscle (). Since expression levels were 10–80-fold lower than that of DMPK, this analysis confirmed RNA-seq data. Knowing that DMPK is a low abundant transcript,Citation45 DM1-AS transcripts must be very rare. Based on these comparisons, we predict that only one or 2 molecules per cell or even less - one RNA molecule per 5–10 cells – is present in most tissues.
Figure 5. The DM1-AS transcript is a low-abundance RNA. (A) Expression levels of the 4 genes from the DM1 locus in cell lines (ENCODE). Each data point represents one cell line. FPKM values were calculated against the transcriptome originating from chromosome 19. The complete DM1-AS region, including alternative introns, was used in the calculation, thereby presumably somewhat underestimating DM1-AS transcript abundance. (B) Expression determined via poly(A)-seq data in tissues (Merck Research Laboratories). If a transcript had multiple poly(A) sites, the value represented here is the sum of all these sites (n ≥ 1, with mean + SEM for universal human reference (UHR) and brain). DM1-AS expression varies between tissues, with lowest values in brain. (C) Examination of expression correlation of DM1-AS with the other 3 genes in the DM1 locus using log2-transformed FPKM values from (A). Pearson R2 values are shown in the graphs. (D) FPKM values for DM1-AS and DMPK in muscle biopsies from healthy control individuals and 3 classes of DM1 patients (ranking based on estimated MBNL activity, see Materials and Methods). (E) Correlation between DM1-AS and DMPK expression in control and DM1 samples using log2-transformed FPKM values from (D). Pearson R2 value is shown in the graph. DM1-AS/DMPK expression ratio is significantly different between patients with severe DM1 (ratio = 40) and control individuals (ratio = 85) (p < 0.01).
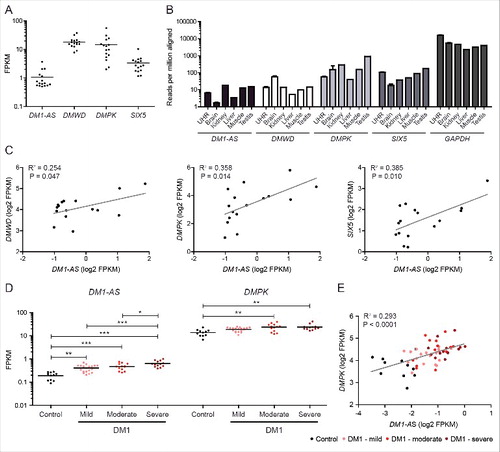
We also examined a coupling between DM1-AS expression and expression of other genes in the DM1 locus. One possibility is that DM1-AS is indeed co-regulated and co-expressed with DMWD, DMPK and/or SIX5. Another possibility is that their expression is mutually exclusive, because bidirectional convergent transcription is avoided to prevent collision of RNA polymerase II molecules.Citation46 ENCODE RNA-seq data from various cell lines were used, with FPKM values calculated against chromosome 19 only. Weak but significant positive correlations for DM1-AS expression were found, the highest with expression of DMPK and SIX5 ().
Since the (CTG·CAG)n repeat in DMPK and DM1-AS is expanded in DM1 and might influence RNA expression from these genes positively or negatively, we used RNA-seq data from patients with DM1 (n = 45) − classified as either mild, moderate or severeCitation47 − and controls (n = 11) to quantify expression in tibialis anterior muscle biopsies. Corroborating the results from the ENCODE and Merck data sets, DM1-AS expression was clearly detectable in control muscle as well as DM1 samples, but on average 56-fold lower than DMPK expression in the same sample (Fig. S10; ). Interestingly, no obvious differences in DM1-AS read density were observed between DM1 and control samples (Fig. S10; data not shown). This also holds true for patterns of SIX5, DMPK and DMWD from the opposite strand. We observed a weak but significant expression correlation between DM1-AS and DMPK (). Unexpectedly, a much stronger correlation between DM1-AS expression and DM1 disease severity was identified (). DM1-AS expression increased significantly up to 3-fold in severely affected DM1 patients ().
Discussion
Advances in RNA sequencing technologies have given new insight in the enormous complexity of the RNA population that makes up the transcriptome, of which it is now known that only ∼2% is represented by protein-encoding RNAs and 98% by non-coding RNAs. Among the latter RNAs, several classes of regulatory RNAs with important tasks in biologic networks that orchestrate cell growth, homeostasis and communication within tissues are being discovered.Citation48 It is now well established that these tasks go far beyond the classical protein-coding role of mRNA or the enzymatic-structural role of rRNAs in ribosomes or snRNAs in spliceosomes. For some newer classes of non-coding transcripts, like miRNAs, the functional relevance is already quite well established. For many others, in particular members of the heterogeneous group of lncRNAs, relevance is still poorly understood.Citation4,48-50 This situation may rapidly change, as the emerging idea that the many thousands of newly discovered RNAs are biologically important for regulation of the genome has led to a surge of studies aimed at characterizing the role of abnormal RNA expression in disease.
Here, we report on characteristics and expression of one specific elusive RNA, the DM1-AS transcript, which is being produced from the DM1 locus in antisense orientation across the (CAG·CTG)n repeat. We anticipated that with improved knowledge on this RNA, we would contribute to a better understanding of how bidirectional expression of the unstable trinucleotide repeat in the DM1 locus could potentially contribute to the highly variable and complex phenotypic manifestation of disease. For many trinucleotide disorders it has now been well established that when expanded repeats in RNAs are transcribed in the sense orientation they generally cause coding or topological abnormalities (i.e., hairpins, G-quadruplexes), which contribute to pathogenesis via in trans effects on cellular ribostasis or proteostasis.Citation5,20 The type of problems depends on whether the repeat tract is in the protein-coding or non-coding portion of the RNA. A new phenomenon, called RAN (repeat-associated non-ATG) translation, whereby homopolymeric or dipeptide proteins are produced, using the repeat as template, may contribute to the complexity.Citation51 Whether the same pathobiological mechanisms apply to antisense transcripts is still an open question for a whole series of repeat disorders for which bidirectional transcription has been reported, e.g. ALS, DM1, HDL2, FXTAS, FXS, and SCA8.Citation7-11
Study of this issue is often hindered by low abundance of antisense transcripts and the fact that the regulation of transcription and processing of antisense RNAs often does not obey rules that apply for production of mRNAs.Citation7 There is hope that clues may come from structural and functional differences between expanded antisense RNA in patient cells and normal-sized antisense RNA in cells from healthy individuals. Concurrent sense transcription may blur the picture however, as effects of repeat expansion in antisense RNA can then not be easily studied in isolation.
Tapscott and coworkers were the first to describe antisense RNA from the DM1 locus about 10 y ago.Citation25 In the present study we have been able, using computational and experimental methods not available at that time, to considerably refine the structural organization of the DM1-AS gene and its RNA products. Bidirectional transcription across the (CTG·CAG)n repeat was thought to be locally confined by CTCF binding and antisense transcripts were proposed to regulate local chromatin configuration, possibly after being converted to 21-nt fragmentsCitation25 (see literature summary depicted in Fig. S11). We provide now data indicating that long DM1-AS RNAs are produced that extent downstream from the insulator element formed by the CTCF-binding sites. Another discrepancy with previous findings appears in promoter mapping, since the DM1-AS promoter was originally mapped to a region upstream from and overlapping with the hypersensitive-site enhancer, a regulatory region located between DMPK and SIX5.Citation25,52 This region contains conserved E-boxes and it was therefore proposed that DM1-AS expression may be regulated by MyoD during cell differentiation.Citation25 Our analysis of FANTOM5 data identified multiple TSSs for DM1-AS in the region complementary to SIX5 intron 1-exon 1, all upstream of the E-box area. To explain the differences in findings, we have to keep in mind that entirely different methods of TSS analysis (e.g., CAGE and RT-PCR) were used in both studies. In addition, we cannot exclude that TSS usage is cell-type specific: while the FANTOM5 promoter atlas is based on a variety of primary cells, cell lines and tissues,Citation32 the initial report on DM1-AS was primarily based on data from fibroblasts.Citation25 Recent, detailed epigenome data for the DM1 locusCitation53 also give indication for regulatory histone marks around the newly assigned TSS sites proposed here and lend support to our map positions for start of the DM1-AS transcript (Fig. S4).
Until we started our bioinformatics and experimental analyses only limited data was available on the structural organization of the DM1-AS gene, based on use of RT-qPCR and primers positioned around the (CAG)n repeatCitation23,27-29 (Fig. S11). Using RNA-seq information, size-fractionated RNA and tools that covered more extensive regions of the putative DM1-AS gene, we found that primary DM1-AS transcripts are subjected to alternative polyadenylation, can either be small or conspicuously long, and are likely to undergo alternative splicing (graphical summary presented in ). Alternative transcription and RNA processing thus render a large variety of mature DM1-AS transcripts, with some variants being more abundant than others.
Figure 6. Model for production of DM1-AS transcripts with and without a (CAG)n repeat. In the model the main data presented in this paper are included. The DM1-AS gene is subject to alternative transcription initiation (multiple TSSs) and 3′ end formation (multiple poly(A) sites, pA). These events lead to the production of short and long primary DM1-AS transcripts, with or without a (CAG)n repeat, presumably carrying a poly(A) tail. During further RNA processing, alternative splicing may occur and the (CAG)n repeat may be removed as part of an intron. Thus, a variety of primary and processed DM1-AS transcripts can occur, with and without a (CAG)n repeat, while the (CAG)n repeat may also be present in the lariat structure of an excised intron.
Importantly, the (CAG)n repeat is not always present in the primary transcript, through use of a poly(A) signal upstream of the (CAG·CTG)n repeat. When transcribed, the repeat is removed in approximately 20% of the transcripts, as part of alternative intron during splicing. Such a location in a region that can be removed during RNA processing creates a situation similar to that for the expanded (CCUG)n repeat in CNBP pre-mRNA causing DM2.Citation54 Clearly, any DM1-AS RNA gain-of-function toxicity may be triggered at all phases in the lifetime of an abnormal DM1-AS RNA and might be caused by processing intermediates or by primary or mature transcripts themselves.Citation55,56
What can be concluded with regard to the quantity and tissue-specificity of DM1-AS expression? We did find significant correlations between DM1-AS expression and that of other DM1 locus genes, but these correlations were rather weak, indicating that regulation of DM1-AS expression occurs largely independently from that of SIX5 and DMPK, like was observed for transcripts from other bidirectionally transcribed genome regions.Citation28,29 Our bioinformatics analysis and RT-qPCR approaches have shown that DM1-AS transcripts are produced in essentially all cell types and tissues, always in very low abundance. Despite a mild increase in DM1-AS expression in patients, our findings indicate that DM1-AS transcripts occur roughly 5–50-fold less frequent than DMPK mRNA molecules, with variation in this ratio dependent on cell or tissue type (see also refs.Citation27,29). Since we recently determined that the absolute number of DMPK transcripts amounts to 1–50 molecules per cell,Citation45 we conclude that some cells may contain up to a dozen DM1-AS transcripts, whereas many others may completely lack DM1-AS transcripts or contain only one or 2 copies. Only highly sophisticated single-molecule single-cell in situ approachesCitation57,58 can determine whether different alternatively processed DM1-AS RNA variants occur as a mixture in one cell (with many other cells in the same tissue having no products at all) or whether each cell at a given moment contains one unique DM1-AS transcript variant.
The extremely low expression has important implications for the function of DM1-AS RNA and for its potential contribution to DM1 pathology. Presence of expanded DM1-AS RNA in the nucleus and in the cytoplasm (in a ratio that is atypical for housekeeping mRNAs) would allow involvement in the formation of toxic nuclear RNP aggregates and in the generation of RAN translation products in the cytoplasm. RNP foci containing expanded (CAG)n RNA have indeed been reported for DM1 cells.Citation27,29 Homopolymeric RAN peptides, which could be formed from DM1-AS RNA with expanded (CAG)n tracts, may exert proteotoxicity at very low concentration, alike formation of abnormally aggregated protein complexes around prion-protein cores in only some cells in a tissue population.Citation59-61 DM1-AS RNAs could, however, also engage in formation of dsRNA molecules by hybridization to complementary sequences in DMPK transcripts. Such an event might trigger toxic dsRNA-responsive kinase signaling with possible immune effects or abnormal effects of aberrant repeat-containing siRNA, formed after DICER processing of the dsRNA.Citation62,63 More speculative, DM1-AS transcripts may play a structural role in local chromatin organization in the DM1 locus in the nucleus. Potentially related to that, we identified several possible G-quadruplex structures in DM1-AS RNA (Fig. S12), which could form a platform for protein complex formation and RNA-based guidance to the SIX5-DMPK area, similar to what has been described for intronic switch RNAs in immunoglobulin class switch recombination.Citation64 Whatever the (patho)biologic function of DM1-AS RNA may be, it is intriguing that its abundance positively correlates with disease severity as assessed using functional MBNL concentrations.Citation47 Whether this correlation occurs due to repeat-dependent chromatin changes, increased stability of repeat-containing RNA or other mechanisms will be important to elucidate.
Purely based on the expression data for DM1-AS in normal cells and tissues it is rather challenging – if not impossible - to properly classify the role of DM1-AS RNA. When taking all evidence combined, we tend to conclude that primary and processed DM1-AS transcripts belong to the heterogeneous class of lncRNAs,Citation4,48-50 because they share many signatures with this type of RNA. LncRNAs, like mRNAs, may be subject to post-transcriptional processing, including 5′ capping, 3′ polyadenylation and splicing. Despite their name-giving, it has now become clear that at least some lncRNAs still do encompass an ORF and can undergo translation.Citation65 We identified multiple AUG-initiated ORFs in DM1-AS, with the longest encoding a hypothetical 205-amino acid protein. By a quick search in short ORF (sORF) finder, we identified 2 other potential coding regions, but none had predicted functionality.Citation66 Recent studies have demonstrated that any such sORF, which is generally smaller than 150 codons, may encode functional peptides.Citation67-70 Gathering evidence for functional sORFs in lncRNAs has so far relied mostly on combining computational approaches (for identification of conserved sequences, examination of codon content and coding features) with experimental approaches for analyzing transcriptional and translational events. Development of specific antibodies and special proteomics toolsCitation71 should now be considered as next steps for detection of potential DM1-AS protein products, but we consider this work that goes beyond the scope of our present study.
In summary, we provide evidence that DM1-AS transcripts are widely expressed as low abundant RNAs and propose that they belong to the functional and structural heterogeneous class of lncRNAs. DM1-AS transcripts are formed with different 5′ ends from alternative TSSs and different 3′ ends as a result of alternative polyadenylation. RNA processing of DM1-AS transcripts involves alternative splicing, whereby the (CAG)n repeat, when included in the primary transcript, can be removed in the context of an alternative intron, similar to what happens with the (CCUG)n repeat in CNBP intron 1 in DM2. Healthy and DM1 tissues thus contain a heterogeneous set of DM1-AS transcripts with and without (CAG)n repeat, which not necessarily are co-expressed with DMPK mRNAs in the same cell. These new findings about DM1-AS expression enable us to formulate new hypotheses about its possible association with disease and help to refine theories on the etiology of DM1, improve prognosis, and facilitate the search for therapeutic targets for disease amelioration.
Materials and methods
Human material
Skeletal muscle samples were collected from pre-consented post-mortem donors. A 14-day-old male twin had a confirmed clinical and DNA diagnosis of congenital DM1 (CDM) and carried a normal-sized repeat of 5 (patient A) and 12 (patient B) triplets, next to expanded repeats of around 1300 triplets (5/1300 and 12/1300 in short). Gastrocnemius muscle tissue from patient A and psoas muscle tissue from patient B were snap frozen immediately after collection and stored at −135 to −80°C.
Cell culture
LHCN-M2 immortalized human satellite cells,Citation72 carrying 2 (CTG·CAG)5 alleles (5/5 in short), were grown on 0.1% (w/v) gelatin-coated plastic surfaces in skeletal muscle cell basal medium (PromoCell) with Supplement Mix (0.05 mL/mL fetal calf serum, 50 µg/mL fetuin (bovine), 10 ng/mL epidermal growth factor (recombinant human), 1 ng/mL basic fibroblast growth factor (recombinant human), 10 µg/mL insulin (recombinant human), 0.4 µg/mL dexamethasone), supplemented with 1% (v/v) GlutaMAX and 15% (v/v) bovine growth serum (Thermo Scientific) at 7.5% CO2 and 37°C.
Primary DM1 myoblasts (13/800),Citation73 were grown on 0.1% (w/v) gelatin-coated plastic surfaces in Ham's F10 medium (Gibco) supplemented with GlutaMAX and 20% (v/v) bovine growth serum (Thermo Scientific) at 7.5% CO2 and 37°C.
Immortalized DM500 mouse myoblasts expressing a human DM1 genomic fragment carrying a (CTG·CAG)n repeat of approximately 500 tripletsCitation74 were grown on 0.1% (w/v) gelatin-coated plastic surfaces in proliferation medium containing DMEM (Gibco) supplemented with 20% (v/v) fetal bovine serum (PAA, Pasching, Austria), 4 mM L-glutamine (Gibco), 1 mM pyruvate (Sigma), 50 µg/mL gentamicin (Gibco), 20 units/mL γ-interferon (BD Biosciences) and 2% (v/v) chicken embryo extract (Sera Laboratories International) at 7.5% CO2 and 33°C.
RNA isolation and fractionation
Total RNA from muscle tissue and cultured cells was isolated using TRIzol reagent (Invitrogen) and Aurum Total RNA Mini Kit (Bio-Rad), respectively, according to manufacturer's instructions.
For RNA isolation from subcellular fractions, myoblasts were grown to 80% confluence, collected via trypsinization and pelleting by centrifugation at 1,000 x g for 5 min at 4°C. Cell pellets were washed twice with ice-cold PBS. Pellets were resuspended in ice-cold cell disruption buffer (10 mM KCl, 1.5 mM MgCl2, 20 mM Tris-Cl (pH 7.5), 1 mM DTT) and incubated on ice for 10 min.Citation75 Samples were homogenized in a chilled Dounce homogenizer (Wheaton) for 15 strokes and then Triton X-100 was added to a final concentration of 0.1%. The lysate was spun at 1,500 x g for 5 min at 4°C. The supernatant (cytoplasmic fraction) and the pellet (nuclear fraction) were mixed with lysis buffer according to instructions of the Aurum Total RNA Mini Kit (Bio-Rad) and RNA was isolated.
Poly(A)-selected RNA was isolated from total RNA using the NucleoTrap® mRNA kit (Macherey-Nagel). Total RNA was mixed with oligo(dT) latex beads, allowing binding of poly(A) tails of transcripts to the beads, followed by several washing steps using a microfilter and ultimately elution of poly(A)-selected RNA. The poly(A)-depleted fraction was obtained by isolating RNA from unbound and wash fractions.
For size-based RNA fractionation, total RNA, denatured in 50% formamide at 70°C for 10 min, was electrophoresed in a 1.2% (w/v) MOPS-buffered agarose gel stained with ethidium bromide. Gel lanes were sliced in multiple fragments, guided by a ssRNA ladder (NEB). RNA was extracted from the gel slices using the Zymoclean™ Gel RNA Recovery Kit (Zymo Research), resulting in multiple RNA fractions, each corresponding to a defined range of transcript sizes.
RT-PCR analysis
For analysis of expression of specific regions of DM1-AS, an equivalent of 1 μg total RNA was subjected to cDNA synthesis using SuperScript III Reverse Transcriptase (Life Technologies) and strand-specific primers with a 5′ linker ().Citation23,27 In a subsequent PCR, DM1-AS regions were amplified from these cDNA samples using Q5® High-Fidelity Polymerase (NEB), DM1-AS-specific forward primers () and either the RT primer or a reverse primer matching the linker attached to each RT primer (5′-GGAGCACGAGGACACTGA-3′). PCR conditions were optimized for each reaction and amplicon identity was confirmed by sequencing. Amplified products were analyzed via agarose gel electrophoresis followed by ethidium bromide staining. A no-reverse transcriptase reaction (RT-) was included as negative control. Signals were quantified using FIJI software.Citation76
Table 1. List of primers used to analyze expression of DM1-AS regions by RT-PCR.
To determine poly(A)-site usage, 500 ng total RNA was subjected to cDNA synthesis. To this end 50 pmol of 5′-GGGGATCCGCGGTTTTTTTTTT-3′ adaptorCitation38 was annealed to poly(A) containing mRNAs in the mixture, before serving as primer for cDNA synthesis by SuperScript III Reverse Transcriptase. Next, the cDNA was used as template for amplification by PCR using Q5 polymerase and a DM1-AS-specific forward primer close to predicted poly(A) sites (primers in region E, I and J; ). No additional reverse primer was added and the 5′-GGGGATCCGCGGTTTTTTTTTT-3′ adaptor from the RT reaction would function as reverse primer. A no reverse transcriptase reaction (RT-) was included as negative control. PCR fragments were separated on agarose gel and transferred to Hybond-XL nylon membrane (Amersham Pharmacia Biotech). Membranes were incubated with 32P-end-labeled oligonucleotides (X: 5′-ACTGTGGAGTCCAGAGCT-3′; Y: 5′-GACCACTTGGCACCTTTCCT-3′; Z: 5′-GGGGTATGAAGTGGCTGTCC-3′) using conventional methods and signals were quantified using a phosphor imager (Molecular Imager FX, Bio-Rad).
To examine splicing of primary DM1-AS transcripts, 500 ng total RNA was reverse transcribed using SuperScript III Reverse Transcriptase with (dT)18 primer. The cDNA preparation was used as template in a PCR, with combinations of forward and reverse primers, close to transcription start- and polyadenylation sites respectively, using Q5 polymerase. Forward primers were 5′-CAGAAGACGGACCACGCC-3′ and forward primers of region C and D (); reverse primers were 5′-AGCTCTGGACTCCACAGT-3′, 5′-AGGAAAGGTGCCAAGTGGTC-3′ and 5′-CCAGCTTGATTCTGAACCGC-3′. PCR amplicons were visualized on agarose gel, isolated and Sanger sequenced to determine splice modes.
RT-qPCR was used to analyze size-fractionated RNA (using 1 μg RNA as input for the RT reaction) and to analyze nuclear and cytoplasmic RNA fractions (500 ng cytoplasmic RNA and an equivalent of nuclear RNA for the RT reaction). RNA was reverse transcribed using the iScript™ cDNA Synthesis Kit (Bio-Rad). For qPCR, 3 µL tenfold diluted cDNA preparation was mixed in a final volume of 10 µL containing 5 µL iQ™ SYBR® Green Supermix (Bio-Rad) and 4 pmol of each primer (MAP3K4 ex3-ex4: 5′-TGCAAAGGGCACGTATAGCATTGG-3′ and 5′-GCTCCTCCCACGACACAGCA-3′; DMPK ex1-ex2: 5′-ACTGGCCCAGGACAAGTACG-3′ and 5′-CCTCCTTAAGCCTCACCACG-3′; GAPDH ex1-ex2: 5′-CCCGCTTCGCTCTCTGCTCC-3′ and 5′-CCTTCCCCATGGTGTCTGAGCG-3′; DMPK ex2-in2: 5´-GAGGGACGACTTCGAGATTCTGAA-3´ and 5´-CACCACGAGTCAAGTCAGGC-3´; ACTB ex2-ex3: 5´-CGGGCCGTCTTCCCCTCCAT-3´ and 5´-TGGGCCTCGTCGCCCACATA-3´; Actb ex5-ex6: 5′-GCTCTGGCTCCTAGCACCAT-3′ and 5′-GCCACCGATCCACACAGAGT-3′). Samples were analyzed using the CFX96 Real-time System (Bio-Rad). A melting curve was obtained for each sample to confirm single product amplification. Samples from no template (NTC) and no reverse transcriptase reactions (RT-) were included as negative controls.
ENCODE RNA-seq
Processed RNA sequencing data in BAM format was downloaded from ENCODE at ftp://hgdownload.cse.ucsc.edu/goldenPath/hg19/encodeDCC/wgEncodeCshlLongRnaSeq.30 Long RNA-seq reads (101 nt) from Cold Spring Harbor Laboratory (CSHL) were visualized in the University of California at Santa Cruz (UCSC) Genome Browser, human genome build GRCh37/hg19, as the sum of signals per strand. In total 190 files were used from various cell lines, including HeLa-S3, K562, HSMM, and many others. These reads were also used to identify splice sites.
To obtain information on polyadenylation status, ENCODE RNA-seq data by CSHL (GSE30567) on poly(A)-selected and poly(A)-depleted RNA from whole cell was included from 14 cell lines (A549, AG04450, BJ, GM12878, H1-hESC, HeLa-S3, HepG2, HSMM, HUVEC, K562, MCF-7, NHEK, NHLF, and SK-N-SH RA). For analysis on cellular localization of transcripts, ENCODE RNA-seq data by CSHL (GSE30567) on nuclear and cytoplasmic-selected RNA from whole cell poly(A)-selected material was included from 10 cell lines (A549, GM12878, H1-hESC, HeLa-S3, HepG2, HUVEC, IMR90, K562, MCF-7, and NHEK).
Fragments Per Kilobase Of Exon Per Million Fragments Mapped (FPKM) values were calculated in Cufflinks (version 2.0.0), using the ENSEMBL GTF file (Homo_sapiens.GRCh37.75.gtf.gz, accessed on April 2nd, 2014) with the position of the antisense transcript (GRCh37/hg19, chr19: 46,270,855–46,276,570) manually included. FPKM values per transcript per cell line were calculated for chromosome 19.
Also for mouse, processed RNA sequencing data from ENCODE by CSHL (GSE36025) was available and visualized in the UCSC Genome Browser (mouse genome build NCBI37/mm9). Data from the following adult tissues was included: adrenal gland, bladder, cerebellum, colon, cortex, duodenum, frontal lobe, genital fat pad, heart, kidney, large intestine, liver, lung, mammary gland, ovary, placenta, small intestine, spleen, stomach, subcutaneous fat pad, testis, and thymus.
Myotonic dystrophy deep sequencing data repository
RNA-seq data from DM1 patients were taken from the Myotonic Dystrophy Deep Sequencing Data Repository (www.dmseq.org). RNA originated from biopsies from tibialis muscle, provided by Drs Katy Eichinger and Charles Thornton. RNA-seq data from 11 controls and 45 DM1 patients were included in our study. Samples were aligned to the hg19 reference genome using the RNA-seq aligner HISAT2. MISO (version 0.4.8)Citation77 was used to estimate isoform frequencies for splicing events using a minimum of 20 reads per event and the parameters of burn_in = 500, lag = 10, num_iters = 5000, and num_chains = 6. DM1 patients were classified as mild, moderate or severe by their inferred MBNL concentration, described in.Citation47 DM1 samples were binned as follows: mild, n = 19, [MBNL]inferred [0.40–0.80]; moderate, n = 13, [MBNL]inferred [0.21–0.39]; severe, n = 13, [MBNL]inferred [0.0–0.20]. Fragments Per Kilobase Of Exon Per Million Fragments Mapped (FPKM) values were calculated in Cufflinks (version 2.0.0), using the ENSEMBL GTF file (Homo_sapiens.GRCh37.75.gtf.gz, accessed on April 2nd, 2014) with the position of the antisense transcript (GRCh37/hg19, chr19: 46268039–46285965) manually included. FPKM values per transcript per biopsy sample were calculated for chromosome 19. The sample's DMPK and DM1-AS FPKM values were binned according to the above (mpm) metric ( and ).
The strand-specific RNA-seq protocols used enable including only reads belonging to the original orientation of transcription for the calculation of exon counts. Exon RPKM (Reads Per Kilobase of exon model per Million mapped reads) values were calculated according to exon hits and normalized against the library size (total MAPQ ≥ 1 reads) and to the merged length of the coding sequence of each gene.Citation78
Transcription start sites
FANTOM5 mapped transcription start sites (TSSs) and their usage in human and mouse primary cells, cell lines and tissues.Citation32 The TSS profile is based on evidence of read counts using cap analysis of gene expression (CAGE) reads. Data was accessed via the FANTOM5 datahub in the UCSC Genome Browser.
Poly(A) sites
Merck Research Laboratories developed Poly(A)-seq, a strand-specific and quantitative method for high-throughput sequencing of 3′ end of polyadenylated transcripts, and globally mapped polyadenylation sites in human and mouse tissues (GSE30198).Citation34 Data is available via the Poly(A)-seq track in the UCSC Genome Browser.
The Poly(A) transcript annotation set from GENCODE version 19 was also accessed via the UCSC Genome browser.Citation33 This set contained poly(A) signals and sites manually annotated on the genome, based on transcribed evidence (ESTs and cDNAs) of 3′ end of transcripts containing at least 3 As not matching the genome.
Histone modification and evolutionary conservation
A comprehensive set of human histone modifications based on ChIP-seq experiments was available from ENCODE by the Broad Institute (GSE29611) and the University Washington (GSE35583).Citation30,79 Occurrence of H3K4me3, a mark of regulatory elements primarily associated with promoters and transcription starts, was analyzed.
Multiple alignments of 100 vertebrate species and measurements of evolutionary conservation using phastConsCitation80 and phyloPCitation81 were visualized in the conservation track (‘Vertebrate Multiz Alignment & Conservation (100 Species)’) in the UCSC Genome Browser.
Exploring protein-coding potential of DM1-AS transcripts
Open reading frames were analyzed via web.expasy.org/translate. Ribo-seq data obtained with the ribosome profiling technique was visualized in GWIPS-viz (genome wide information on protein synthesis) genome browser.Citation44,82 Globplot2 (via globplot.embl.de) was used to identify potential domains in DM1-AS ORFs.Citation42
Statistical analysis
FPKM ratios of poly(A)-depleted: poly(A)-selected RNA and of nucleus: cytoplasm RNA were compared between transcripts using multiple Wilcoxon signed rank tests followed by a Bonferroni correction. Correlation between expression of DM1-AS, DMWD, DMPK and SIX5 (log2 transformed FPKM values) were analyzed using Pearson's test. Statistical analyses were performed in GraphPad Prism version 5.01 for Windows. *, p < 0.05.
Disclosure of potential conflicts of interest
No potential conflicts of interest were disclosed.
Supplemntal_Data.zip
Download Zip (13.9 MB)Acknowledgements
We thank V. Mouly and D. Furling (Institute of Myology, Paris) for their generous gift of normal human myoblasts and myoblasts of DM1 patients. We thank the ENCODE Consortium and the ENCODE production laboratories for generating the data sets. We thank the founders of and contributors to the Myotonic Dystrophy Deep Sequencing Data Repository available via www.dmseq.org. We thank members of the Department of Cell Biology for discussions.
Funding
This work was supported by the Prinses Beatrix Spierfonds in combination with the Stichting Spieren voor Spieren under Grants W.OR10–04 and W.OR16–09.
Related Research Data
References
- Katayama S, Tomaru Y, Kasukawa T, Waki K, Nakanishi M, Nakamura M, Nishida H, Yap CC, Suzuki M, Kawai J, et al. Antisense transcription in the mammalian transcriptome. Science 2005; 309:1564-6; PMID:16141073; https://doi.org/10.1126/science.1112009
- Pelechano V, Steinmetz LM. Gene regulation by antisense transcription. Nat Rev Genet 2013; 14:880-93; PMID:24217315; https://doi.org/10.1038/nrg3594
- Clark MB, Johnston RL, Inostroza-Ponta M, Fox AH, Fortini E, Moscato P, Dinger ME, Mattick JS. Genome-wide analysis of long noncoding RNA stability. Genome Res 2012; 22:885-98; PMID:22406755; https://doi.org/10.1101/gr.131037.111
- Esteller M. Non-coding RNAs in human disease. Nat Rev Genet 2011; 12:861-74; PMID:22094949; https://doi.org/10.1038/nrg3074
- Mirkin SM. Expandable DNA repeats and human disease. Nature 2007; 447:932-40; PMID:17581576; https://doi.org/10.1038/nature05977
- McMurray CT. Mechanisms of trinucleotide repeat instability during human development. Nat Rev Genet 2010; 11:786-99; PMID:20953213; https://doi.org/10.1038/nrg2828
- Batra R, Charizanis K, Swanson MS. Partners in crime: bidirectional transcription in unstable microsatellite disease. Hum Mol Genet 2010; 19:R77-82; PMID:20368264; https://doi.org/10.1093/hmg/ddq132
- Ladd PD, Smith LE, Rabaia NA, Moore JM, Georges SA, Hansen RS, Hagerman RJ, Tassone F, Tapscott SJ, Filippova GN. An antisense transcript spanning the CGG repeat region of FMR1 is upregulated in premutation carriers but silenced in full mutation individuals. Hum Mol Genet 2007; 16:3174-87; PMID:17921506; https://doi.org/10.1093/hmg/ddm293
- Moseley ML, Zu T, Ikeda Y, Gao W, Mosemiller AK, Daughters RS, Chen G, Weatherspoon MR, Clark HB, Ebner TJ, et al. Bidirectional expression of CUG and CAG expansion transcripts and intranuclear polyglutamine inclusions in spinocerebellar ataxia type 8. Nat Genet 2006; 38:758-69; PMID:16804541; https://doi.org/10.1038/ng1827
- Wilburn B, Rudnicki DD, Zhao J, Weitz TM, Cheng Y, Gu X, Greiner E, Park CS, Wang N, Sopher BL, et al. An antisense CAG repeat transcript at JPH3 locus mediates expanded polyglutamine protein toxicity in Huntington's disease-like 2 mice. Neuron 2011; 70:427-40; PMID:21555070; https://doi.org/10.1016/j.neuron.2011.03.021
- Ikeda Y, Daughters RS, Ranum LPW. Bidirectional expression of the SCA8 expansion mutation: one mutation, two genes. Cerebellum 2008; 7:150-8; PMID:18418692; https://doi.org/10.1007/s12311-008-0010-7
- Budworth H, McMurray CT. Bidirectional transcription of trinucleotide repeats: roles for excision repair. DNA Repair (Amst) 2013; 12:672-84; PMID:23669397; https://doi.org/10.1016/j.dnarep.2013.04.019
- Lin Y, Leng M, Wan M, Wilson JH. Convergent transcription through a long CAG tract destabilizes repeats and induces apoptosis. Mol Cell Biol 2010; 30:4435-51; PMID:20647539; https://doi.org/10.1128/MCB.00332-10
- Morales F, Couto JM, Higham CF, Hogg G, Cuenca P, Braida C, Wilson RH, Adam B, del Valle G, Brian R, et al. Somatic instability of the expanded CTG triplet repeat in myotonic dystrophy type 1 is a heritable quantitative trait and modifier of disease severity. Hum Mol Genet 2012; 21:3558-67; PMID:22595968; https://doi.org/10.1093/hmg/dds185
- Brook JD, McCurrach ME, Harley HG, Buckler AJ, Church D, Aburatani H, Hunter K, Stanton VP, Thirion JP, Hudson T. Molecular basis of myotonic dystrophy: expansion of a trinucleotide (CTG) repeat at the 3′ end of a transcript encoding a protein kinase family member. Cell 1992; 68:799-808; PMID:1310900; https://doi.org/10.1016/0092-8674(92)90154-5
- Mahadevan M, Tsilfidis C, Sabourin L, Shutler G, Amemiya C, Jansen G, Neville C, Narang M, Barceló J, O'Hoy K. Myotonic dystrophy mutation: an unstable CTG repeat in the 3′ untranslated region of the gene. Science 1992; 255:1253-5; PMID:1546325; https://doi.org/10.1126/science.1546325
- Fu YH, Pizzuti A, Fenwick RG, King J, Rajnarayan S, Dunne PW, Dubel J, Nasser GA, Ashizawa T, de Jong P. An unstable triplet repeat in a gene related to myotonic muscular dystrophy. Science 1992; 255:1256-8; PMID:1546326; https://doi.org/10.1126/science.1546326
- Sicot G, Gourdon G, Gomes-Pereira M. Myotonic dystrophy, when simple repeats reveal complex pathogenic entities: new findings and future challenges. Hum Mol Genet 2011; 20:R116-123; PMID:21821673; https://doi.org/10.1093/hmg/ddr343
- Udd B, Krahe R. The myotonic dystrophies: molecular, clinical, and therapeutic challenges. Lancet Neurol 2012; 11:891-905; PMID:22995693; https://doi.org/10.1016/S1474-4422(12)70204-1
- Wojciechowska M, Krzyzosiak WJ. Cellular toxicity of expanded RNA repeats: Focus on RNA foci. Hum Mol Genet 2011; 20:3811-21; PMID:21729883; https://doi.org/10.1093/hmg/ddr299
- Pettersson OJ, Aagaard L, Jensen TG, Damgaard CK. Molecular mechanisms in DM1 - a focus on foci. Nucleic Acids Res 2015; 43:2433-41; PMID:25605794; https://doi.org/10.1093/nar/gkv029
- Batra R, Charizanis K, Manchanda M, Mohan A, Li M, Finn DJ, Goodwin M, Zhang C, Sobczak K, Thornton CA, et al. Loss of MBNL leads to disruption of developmentally regulated alternative polyadenylation in RNA-mediated disease. Mol Cell 2014; 56:311-22; PMID:25263597; https://doi.org/10.1016/j.molcel.2014.08.027
- Zu T, Gibbens B, Doty NS, Gomes-Pereira M, Huguet A, Stone MD, Margolis J, Peterson M, Markowski TW, Ingram MAC, et al. Non-ATG-initiated translation directed by microsatellite expansions. Proc Natl Acad Sci U S A 2011; 108:260-5; PMID:21173221; https://doi.org/10.1073/pnas.1013343108
- Cleary JD, Ranum LPW. Repeat-associated non-ATG (RAN) translation in neurological disease. Hum Mol Genet 2013; 22:R45-51; PMID:23918658; https://doi.org/10.1093/hmg/ddt371
- Cho DH, Thienes CP, Mahoney SE, Analau E, Filippova GN, Tapscott SJ. Antisense transcription and heterochromatin at the DM1 CTG repeats are constrained by CTCF. Mol Cell 2005; 20:483-9; PMID:16285929; https://doi.org/10.1016/j.molcel.2005.09.002
- Filippova GN, Thienes CP, Penn BH, Cho DH, Hu YJ, Moore JM, Klesert TR, Lobanenkov V V, Tapscott SJ. CTCF-binding sites flank CTG/CAG repeats and form a methylation-sensitive insulator at the DM1 locus. Nat Genet 2001; 28:335-43; PMID:11479593; https://doi.org/10.1038/ng570
- Huguet A, Medja F, Nicole A, Vignaud A, Guiraud-Dogan C, Ferry A, Decostre V, Hogrel JY, Metzger F, Hoeflich A, et al. Molecular, physiological, and motor performance defects in DMSXL mice carrying >1,000 CTG repeats from the human DM1 locus. PLoS Genet 2012; 8:e1003043; PMID:23209425; https://doi.org/10.1371/journal.pgen.1003043
- Brouwer JR, Huguet A, Nicole A, Munnich A, Gourdon G. Transcriptionally repressive chromatin remodelling and CpG methylation in the presence of expanded CTG-repeats at the DM1 locus. J Nucleic Acids 2013; 2013:567435; PMID:24455202; https://doi.org/10.1155/2013/567435
- Michel L, Huguet-Lachon A, Gourdon G. Sense and Antisense DMPK RNA Foci Accumulate in DM1 Tissues during development. PLoS One 2015; 10:e0137620; PMID:26339785; https://doi.org/10.1371/journal.pone.0137620
- Dunham I, Kundaje A, Aldred SF, Collins PJ, Davis CA, Doyle F, Epstein CB, Frietze S, Harrow J, Kaul R, et al. An integrated encyclopedia of DNA elements in the human genome. Nature 2012; 489:57-74; PMID:22955616; https://doi.org/10.1038/nature11247
- Saunders AM, Seldin MF. A molecular genetic linkage map of mouse chromosome 7. Genomics 1990; 8:525-35; PMID:1981054; https://doi.org/10.1016/0888-7543(90)90040-2
- Forrest ARR, Kawaji H, Rehli M, Baillie JK, de Hoon MJL, Lassmann T, Itoh M, Summers KM, Suzuki H, Daub CO, et al. A promoter-level mammalian expression atlas. Nature 2014; 507:462-70; PMID:24670764; https://doi.org/10.1038/nature13182
- Harrow J, Frankish A, Gonzalez JM, Tapanari E, Diekhans M, Kokocinski F, Aken BL, Barrell D, Zadissa A, Searle S, et al. GENCODE: The reference human genome annotation for the ENCODE project. Genome Res 2012; 22:1760-74; PMID:22955987; https://doi.org/10.1101/gr.135350.111
- Derti A, Garrett-Engele P, MacIsaac KD, Stevens RC, Sriram S, Chen R, Rohl CA, Johnson JM, Babak T. A quantitative atlas of polyadenylation in five mammals. Genome Res 2012; 22:1173-83; PMID:22454233; https://doi.org/10.1101/gr.132563.111
- Kamasawa M, Horiuchi J. Identification and characterization of polyadenylation signal (PAS) variants in human genomic sequences based on modified EST clustering. In Silico Biol 2008; 8:347-61; PMID:19032167
- Lutz CS. Alternative polyadenylation: a twist on mRNA 3′ end formation. ACS Chem Biol 2008; 3:609-17; PMID:18817380; https://doi.org/10.1021/cb800138w
- Zarudnaya MI, Kolomiets IM, Potyahaylo AL, Hovorun DM. Downstream elements of mammalian pre-mRNA polyadenylation signals: primary, secondary and higher-order structures. Nucleic Acids Res 2003; 31:1375-86; PMID:12595544; https://doi.org/10.1093/nar/gkg241
- Murray EL, Schoenberg DR. Assays for determining poly(A) tail length and the polarity of mRNA decay in mammalian cells. Methods Enzymol 2008; 448:483-504; PMID:19111191; https://doi.org/10.1016/S0076-6879(08)02624-4
- Seznec H, Lia-Baldini AS, Duros C, Fouquet C, Lacroix C, Hofmann-Radvanyi H, Junien C, Gourdon G. Transgenic mice carrying large human genomic sequences with expanded CTG repeat mimic closely the DM CTG repeat intergenerational and somatic instability. Hum Mol Genet 2000; 9:1185-94; PMID:10767343; https://doi.org/10.1093/hmg/9.8.1185
- van Agtmaal EL, André LM, Willemse M, Cumming S, van Kessel IDG, van den Broek WJAA, Gourdon G, Furling D, Mouly V, Monckton DG, et al. CRISPR/Cas9- Induced (CTG•CAG)n Repeat Instability in the Myotonic Dystrophy Type 1 Locus: Implications for therapeutic genome editing. Mol Ther 2017; 25:24-43; PMID:28129118; https://doi.org/10.1016/j.ymthe.2016.10.014
- Davis BM, McCurrach ME, Taneja KL, Singer RH, Housman DE. Expansion of a CUG trinucleotide repeat in the 3′ untranslated region of myotonic dystrophy protein kinase transcripts results in nuclear retention of transcripts. Proc Natl Acad Sci U S A 1997; 94:7388-93; PMID:9207101; https://doi.org/10.1073/pnas.94.14.7388
- Linding R, Russell RB, Neduva V, Gibson TJ. GlobPlot: Exploring protein sequences for globularity and disorder. Nucleic Acids Res 2003; 31:3701-8; PMID:12824398; https://doi.org/10.1093/nar/gkg519
- Marchler-Bauer A, Derbyshire MK, Gonzales NR, Lu S, Chitsaz F, Geer LY, Geer RC, He J, Gwadz M, Hurwitz DI, et al. CDD: NCBI's conserved domain database. Nucleic Acids Res 2014; 43:D222-6; PMID:25414356; https://doi.org/10.1093/nar/gku1221
- Michel AM, Fox G M., Kiran A, De Bo C, O'Connor PBF, Heaphy SM, Mullan JPA, Donohue CA, Higgins DG, Baranov P V. GWIPS-viz: Development of a ribo-seq genome browser. Nucleic Acids Res 2014; 42:859-64; PMID:24185699; https://doi.org/10.1093/nar/gkt1035
- Gudde AEEG, González-Barriga A, van den Broek WJAA, Wieringa B, Wansink DG. A low absolute number of expanded transcripts is involved in myotonic dystrophy type 1 manifestation in muscle. Hum Mol Genet 2016; 25:1648-62; PMID:26908607; https://doi.org/10.1093/hmg/ddw042
- Hobson DJ, Wei W, Steinmetz LM, Svejstrup JQ. RNA polymerase II collision interrupts convergent transcription. Mol Cell 2012; 48:365-74; PMID:23041286; https://doi.org/10.1016/j.molcel.2012.08.027
- Wagner SD, Struck AJ, Gupta R, Farnsworth DR, Mahady AE, Eichinger K, Thornton CA, Wang ET, Berglund JA. Dose-dependent regulation of alternative splicing by MBNL proteins reveals biomarkers for myotonic dystrophy. PLoS Genet 2016; 12:e1006316; PMID:27681373; https://doi.org/10.1371/journal.pgen.1006316
- Wapinski O, Chang HY. Long noncoding RNAs and human disease. Trends Cell Biol 2011; 21:354-61; PMID:21550244; https://doi.org/10.1016/j.tcb.2011.04.001
- Clark BS, Blackshaw S. Long non-coding RNA-dependent transcriptional regulation in neuronal development and disease. Front Genet 2014; 5:164; PMID:24936207; https://doi.org/10.3389/fgene.2014.00164
- Chen X. Predicting lncRNA-disease associations and constructing lncRNA functional similarity network based on the information of miRNA. Sci Rep 2015; 5:13186; PMID:26278472; https://doi.org/10.1038/srep13186
- Green KM, Linsalata AE, Todd PK. RAN translation-What makes it run? Brain Res 2016; 1647:1-13; PMID:27060770; https://doi.org/10.1016/j.brainres.2016.04.003
- Klesert TR, Otten AD, Bird TD, Tapscott SJ. Trinucleotide repeat expansion at the myotonic dystrophy locus reduces expression of DMAHP. Nat Genet 1997; 16:402-6; PMID:9241282; https://doi.org/10.1038/ng0897-402
- Buckley L, Lacey M, Ehrlich M. Epigenetics of the myotonic dystrophy-associated DMPK gene neighborhood. Epigenomics 2016; 8:13-31; PMID:26756355; https://doi.org/10.2217/epi.15.104
- Liquori CL, Ricker K, Moseley ML, Jacobsen JF, Kress W, Naylor SL, Day JW, Ranum LP. Myotonic dystrophy type 2 caused by a CCTG expansion in intron 1 of ZNF9. Science 2001; 293:864-7; PMID:11486088; https://doi.org/10.1126/science.1062125
- Margolis JM, Schoser BG, Moseley ML, Day JW, Ranum LPW. DM2 intronic expansions: evidence for CCUG accumulation without flanking sequence or effects on ZNF9 mRNA processing or protein expression. Hum Mol Genet 2006; 15:1808-15; PMID:16624843; https://doi.org/10.1093/hmg/ddl103
- O'Rourke JR, Swanson MS. Mechanisms of RNA-mediated disease. J Biol Chem 2009; 284:7419-23; PMID:18957432; https://doi.org/10.1074/jbc.R800025200
- Raj A, van den Bogaard P, Rifkin SA, van Oudenaarden A, Tyagi S. Imaging individual mRNA molecules using multiple singly labeled probes. Nat Methods 2008; 5:877-9; PMID:18806792; https://doi.org/10.1038/nmeth.1253
- Battich N, Stoeger T, Pelkmans L. Image-based transcriptomics in thousands of single human cells at single-molecule resolution. Nat Methods 2013; 10:1127-33; PMID:24097269; https://doi.org/10.1038/nmeth.2657
- Jucker M, Walker LC. Self-propagation of pathogenic protein aggregates in neurodegenerative diseases. Nature 2013; 501:45-51; PMID:24005412; https://doi.org/10.1038/nature12481
- Zhang Y-J, Jansen-West K, Xu Y-F, Gendron TF, Bieniek KF, Lin W-L, Sasaguri H, Caulfield T, Hubbard J, Daughrity L, et al. Aggregation-prone c9FTD/ALS poly(GA) RAN-translated proteins cause neurotoxicity by inducing ER stress. Acta Neuropathol 2014; 128:505-24; PMID:25173361; https://doi.org/10.1007/s00401-014-1336-5
- Wen X, Tan W, Westergard T, Krishnamurthy K, Markandaiah SS, Shi Y, Lin S, Shneider NA, Monaghan J, Pandey UB, et al. Antisense proline-arginine RAN dipeptides linked to C9ORF72-ALS/FTD form toxic nuclear aggregates that initiate in vitro and in vivo neuronal death. Neuron 2014; 84:1213-25; PMID:25521377; https://doi.org/10.1016/j.neuron.2014.12.010
- Krol J, Fiszer A, Mykowska A, Sobczak K, de Mezer M, Krzyzosiak WJ. Ribonuclease dicer cleaves triplet repeat hairpins into shorter repeats that silence specific targets. Mol Cell 2007; 25:575-86; PMID:17317629; https://doi.org/10.1016/j.molcel.2007.01.031
- Yu Z, Teng X, Bonini NM. Triplet repeat-derived siRNAs enhance RNA-mediated toxicity in a Drosophila model for myotonic dystrophy. PLoS Genet 2011; 7:e1001340; PMID:21437269; https://doi.org/10.1371/journal.pgen.1001340
- Zheng S, Vuong BQ, Vaidyanathan B, Lin J-Y, Huang F-T, Chaudhuri J. Non-coding RNA Generated following Lariat debranching mediates targeting of AID to DNA. Cell 2015; 161:762-73; PMID:25957684; https://doi.org/10.1016/j.cell.2015.03.020
- Housman G, Ulitsky I. Methods for distinguishing between protein-coding and long noncoding RNAs and the elusive biological purpose of translation of long noncoding RNAs. Biochim Biophys Acta 2016; 1859:31-40; PMID:26265145; https://doi.org/10.1016/j.bbagrm.2015.07.017
- Hanada K, Akiyama K, Sakurai T, Toyoda T, Shinozaki K, Shiu SH. sORF finder: A program package to identify small open reading frames with high coding potential. Bioinformatics 2009; 26:399-400; PMID:20008477; https://doi.org/10.1093/bioinformatics/btp688
- Slavoff SA, Mitchell AJ, Schwaid AG, Cabili MN, Ma J, Levin JZ, Karger AD, Budnik BA, Rinn JL, Saghatelian A. Peptidomic discovery of short open reading frame-encoded peptides in human cells. Nat Chem Biol 2013; 9:59-64; PMID:23160002; https://doi.org/10.1038/nchembio.1120
- Ma J, Ward CC, Jungreis I, Slavoff SA, Schwaid AG, Neveu J, Budnik BA, Kellis M, Saghatelian A. Discovery of human sORF-encoded polypeptides (SEPs) in cell lines and tissue. J Proteome Res 2014; 13:1757-65; PMID:24490786; https://doi.org/10.1021/pr401280w
- Slavoff SA, Heo J, Budnik BA, Hanakahi LA, Saghatelian A. A human short open reading frame (sORF)-Encoded polypeptide that stimulates DNA end joining. J Biol Chem 2014; 289:10950-7; PMID:24610814; https://doi.org/10.1074/jbc.C113.533968
- Lauressergues D, Couzigou J-M, Clemente HS, Martinez Y, Dunand C, Bécard G, Combier J-P. Primary transcripts of microRNAs encode regulatory peptides. Nature 2015; 520:90-3; PMID:25807486; https://doi.org/10.1038/nature14346
- Andrews SJ, Rothnagel JA. Emerging evidence for functional peptides encoded by short open reading frames. Nat Rev Genet 2014; 15:193-204; PMID:24514441; https://doi.org/10.1038/nrg3520
- Zhu C-H, Mouly V, Cooper RN, Mamchaoui K, Bigot A, Shay JW, Di Santo JP, Butler-Browne GS, Wright WE. Cellular senescence in human myoblasts is overcome by human telomerase reverse transcriptase and cyclin-dependent kinase 4: consequences in aging muscle and therapeutic strategies for muscular dystrophies. Aging Cell 2007; 6:515-23; PMID:17559502; https://doi.org/10.1111/j.1474-9726.2007.00306.x
- Furling D, Lemieux D, Taneja K, Puymirat J. Decreased levels of myotonic dystrophy protein kinase (DMPK) and delayed differentiation in human myotonic dystrophy myoblasts. Neuromuscul Disord 2001; 11:728-35; PMID:11595515; https://doi.org/10.1016/S0960-8966(01)00226-7
- Mulders SAM, van den Broek WJAA, Wheeler TM, Croes HJE, van Kuik-Romeijn P, de Kimpe SJ, Furling D, Platenburg GJ, Gourdon G, Thornton CA, et al. Triplet-repeat oligonucleotide-mediated reversal of RNA toxicity in myotonic dystrophy. Proc Natl Acad Sci U S A 2009; 106:13915-20; PMID:19667189; https://doi.org/10.1073/pnas.0905780106
- Rio DC, Ares M, Hannon GJ, Nilsen TW. Preparation of cytoplasmic and nuclear RNA from tissue culture cells. Cold Spring Harb Protoc 2010; PMID:20516179; https://doi.org/10.1101/pdb.prot5441
- Schindelin J, Arganda-Carreras I, Frise E, Kaynig V, Longair M, Pietzsch T, Preibisch S, Rueden C, Saalfeld S, Schmid B, et al. Fiji: an open-source platform for biological-image analysis. Nat Methods 2012; 9:676-82; PMID:22743772; https://doi.org/10.1038/nmeth.2019
- Katz Y, Wang ET, Airoldi EM, Burge CB. Analysis and design of RNA sequencing experiments for identifying isoform regulation. Nat Methods 2010; 7:1009-10015; PMID:21057496; https://doi.org/10.1038/nmeth.1528
- Mortazavi A, Williams BA, McCue K, Schaeffer L, Wold B. Mapping and quantifying mammalian transcriptomes by RNA-Seq. Nat Methods 2008; 5:621-8; PMID:18516045; https://doi.org/10.1038/nmeth.1226
- ENCODE Project Consortium. A user's guide to the encyclopedia of DNA elements (ENCODE). PLoS Biol 2011; 9:e1001046; PMID:21526222; https://doi.org/10.1371/journal.pbio.1001046
- Siepel A, Bejerano G, Pedersen JS, Hinrichs AS, Hou M, Rosenbloom K, Clawson H, Spieth J, Hillier LW, Richards S, et al. Evolutionarily conserved elements in vertebrate, insect, worm, and yeast genomes. Genome Res 2005; 15:1034-50; PMID:16024819; https://doi.org/10.1101/gr.3715005
- Pollard KS, Hubisz MJ, Rosenbloom KR, Siepel A. Detection of nonneutral substitution rates on mammalian phylogenies. Genome Res 2010; 20:110-21; PMID:19858363; https://doi.org/10.1101/gr.097857.109
- Ingolia NT, Ghaemmaghami S, Newman JRS, Weissman JS. Genome-wide analysis in vivo of translation with nucleotide resolution using ribosome profiling. Science 2009; 324:218-23; PMID:19213877; https://doi.org/10.1126/science.1168978