
ABSTRACT
Although BC200 RNA is best known as a neuron-specific non-coding RNA, it is overexpressed in various cancer cells. BC200 RNA was recently shown to contribute to metastasis in several cancer cell lines, but the underlying mechanism was not understood in detail. To examine this mechanism, we knocked down BC200 RNA in cancer cells, which overexpress the RNA, and examined cell motility, profiling of ribosome footprints, and the correlation between cell motility changes and genes exhibiting altered ribosome profiles. We found that BC200 RNA knockdown reduced cell migration and invasion, suggesting that BC200 RNA promotes cell motility. Our ribosome profiling analysis identified 29 genes whose ribosomal occupations were altered more than 2-fold by BC200 RNA knockdown. Many (> 30%) of them were directly or indirectly related to cancer progression. Among them, we focused on S100A11 (which showed a reduced ribosome footprint) because its expression was previously shown to increase cellular motility. S100A11 was decreased at both the mRNA and protein levels following knockdown of BC200 RNA. An actinomycin-chase experiment showed that BC200 RNA knockdown significantly decreased the stability of the S100A11 mRNA without changing its transcription rate, suggesting that the downregulation of S100A11 was mainly caused by destabilization of its mRNA. Finally, we showed that the BC200 RNA-knockdown-induced decrease in cell motility was mainly mediated by S100A11. Together, our results show that BC200 RNA promotes cell motility by stabilizing S100A11 transcripts.
Introduction
Brain Cytoplasmic 200 RNA (BC200 RNA) is a non-coding RNA (ncRNA) that is selectively expressed in human neurons. Following their expression, BC200 RNAs immediately migrate to dendrites, where they interact and interfere with various translational initiation factors, including eIF4A, eIF4B, and PABP.Citation1-7 BC200 RNA is thought to exert local translational control by forming distinctive microdomains in dendrites, and this is believed to contribute to the maintenance of neuronal plasticity. BC1 RNA is the rodent counterpart of BC200 RNACitation3; the 2 together comprise the BC RNAs. BC200 RNA originated by retro-transposition of an Alu domain, whereas BC1 RNA arose by retroposition of tRNAAla.Citation3,Citation8
Although BC200 RNA is normally specific to neuronal dendritesCitation3 it is abnormally overexpressed under some disease conditions. In Alzheimer disease, for example, BC200 RNA levels are upregulated in specific brain areas associated with the disease, and they increase with disease progression.Citation9 BC200 RNA is also highly expressed in various cancers of non-neural origins.Citation10,Citation11 In breast cancer, invasive carcinoma reportedly expresses BC200 RNA at higher levels than normal tissues or benign tumors.Citation12 Moreover, overexpression of BC200 RNA in non-small-cell lung and colorectal cancers was recently reported to promote metastasis.Citation13,Citation14 However, it is still unclear how deregulated BC200 RNA expression influences the metabolism of such cells, and how such changes influence disease.
Genome-wide gene expression profiling has expanded rapidly over the past 2 decades, from the first introduction of microarray techniques, which opened new vistas in biology, to the introduction of techniques intended to improve the accuracy and utility of genome-wide profiling, such as high throughput sequencing (HTS).Citation15 As these techniques are fundamentally optimized for the quantification of nucleic acids, gene expression profiling has traditionally focused on measuring the abundance and regulation of mRNA at the transcriptional level. However, gene expression is also extensively regulated at the translational level, meaning that mRNA abundance alone does not fully present the expressional status. To measure gene expression at the protein-synthesis level, HTS has been expanded to ribosome footprint profiling, which detects actively translating mRNA fragments in vivo..Citation16,Citation17 As ncRNAs are actively involved in expression control at the translational levelCitation18 and BC200 RNA (an ncRNA) is a known to inhibit translation, we speculated that ribosome profiling might allow us to gain insight into the in vivo role of BC200 RNA in cancer cells.
To examine whether BC200 RNA is involved in cancer cell metastasis, we first knocked it down in cancer cells, which overexpress BC200 RNA. Examination of cell motility revealed that BC200 RNA knockdown significantly reduced cell migration and invasion. To identify possible underlying mechanisms for this reduction, we used ribosome footprint profiling to examine downstream targets of BC200 RNA. Our profiling analysis identified 29 genes whose expression levels were altered more than 2-fold following BC200 knockdown. Most of them were found to be involved in chromatin formation and cancer development. Among them, S100A11 is highly associated with the motility and invasiveness of cancer cells.Citation19-23 This calcium-binding protein is known to promote cellular motility by maintaining outer membrane integrity.Citation19-23 Ribosome profiling showed reducing expression of S100A11 following BC200 knockdown. Further analysis revealed that S100A11 was reduced at both the mRNA and protein levels following BC200 RNA knockdown, suggesting that the reduced footprints mainly resulted from the downregulation of mRNA. Knockdown of BC200 RNA had little effect on the transcription rate of the S100A11 mRNA, but it significantly decreased the stability of this mRNA. Collectively, our results suggest that BC200 RNA up-regulates S100A11 expression by stabilizing the S100A11 mRNA at the post-transcriptional level, and that this upregulation of S100A11 contributes to the ability of BC200 RNA to increase cancer cell motility.
Results
Depletion of BC200 RNA disrupts the migration and invasion of HeLa cells
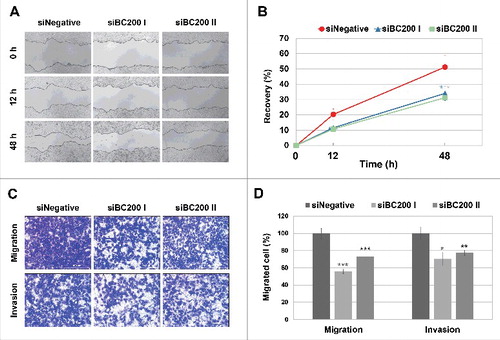
As an initial step toward understanding the role and action mechanism of BC200 RNA in cancer, we first examined the effects of BC200 RNA knockdown on the phenotypes of HeLa cervical carcinoma cells, in which BC200 RNA is highly upregulated. To knock down endogenous BC200 RNA, we designed 4 siRNAs to target BC200 RNA in accordance with Matveeva et al.Citation24 for maximum silencing efficiency with low off-target effects and tested for their gene silencing effects. Among them siBC200 I and siRNA200 II were most effective ones. We found that siBC200 I and siRNA200 II reduced BC200 RNA expression to 11.8% and 48%, respectively, of the level seen in cells transfected with the control siRNA (siNegative) (Fig. S1). Cells subjected to BC200 RNA knockdown were then examined using wound-healing, migration, invasion, and proliferation assays. Wound-healing assays revealed that the healing rate of siBC200-treated cells was 60% of that of siNegative cells (). In trans-well experiments designed to examine cell migration (uncoated chambers) and invasion (Matrigel-coated chambers), the numbers of migrated/invaded cells were reduced to about 30–40% of the control levels (). Proliferation assays showed that BC200 RNA knockdown did not significantly affect the proliferation of HeLa cells (Fig. S2). Moreover, the BC200 RNA knockdown-induced decrease of cell migration was not affected by inhibition of proliferation under our serum-free medium conditions () or FBS-containing medium conditions in the presence of mitomycin C (Fig. S3). These data suggest that BC200 RNA can alter the cell motility but not the proliferation of HeLa cells and that the decreased cell motility might not be caused by inhibition of cell proliferation. Since cell motility is a critical feature for high-grade cancer cells, it seems that BC200 RNA might contribute to the development of high-grade cancers by facilitating cellular motility.
Figure 1. Effects of BC200 RNA knockdown on the migration and invasion of HeLa cells. (A and B) HeLa cells transfected with siNegative, siBC200 I, or siBC200 II were scraped (wounded) at 24 h post-transfection, and the degree of recovery was measured at 0, 12, and 48 h post-wounding. (A) Representative pictures, 40x magnification. (B) Quantitative analyses of wound-healing results. The percentage of recovery was measured and estimated based on the initial wound size of each sample. Shown are siNegative (red), siBC200 I (blue), and siBC200 II (green) (mean ± SD; n = 3; *P < 0.05, by Student's t-test). (C and D) HeLa cells were transfected with siNegative, siBC200 I, or siBC200 II and 5×10⁴ cells were allowed to invade Matrigel or 3×10⁴ cells were allowed to migrate toward collagen. After 40 h, the invaded or migrated cells were fixed and counted. (C) Representative pictures of trans-well assay results, 200x magnification. (D) Quantitative analyses of trans-well assay results (mean ± SD; n = 3; *P < 0.05, **P < 0.01, ***P < 0.001, by Student's t-test).
Possible downstream targets of BC200 RNA
ncRNAs have been shown to delicately regulate gene expressions via distinct mechanismsCitation25,Citation26 Based on our above results, we hypothesized that BC200 RNA might alter the expression levels of target genes involved in cell motility. We set to find these downstream targets by analyzing BC200 RNA-knockdown-associated changes in the genome-wide ribosome footprint. We prepared 4 ribosome-protected mRNA samples from each duplicate of siBC200 I-knockdown and siNegative control cells, and subjected the fragments to deep-sequencing. We used the edge R analysis tool to compare the reads per kilobase per million mapped reads (RPKM) between knockdown and control samples, and visualized the data using a volcano plot (). When we searched for genes that showed a greater than 2-fold change and a p-value below 0.05, our analysis identified 29 genes that showed altered ribosome footprints (16 upregulated and 13 downregulated genes) ( and Table S1). Many (about 40%) of the genes found to be upregulated by knockdown of BC200 RNA encode histones, which are involved in maintaining chromatin structures ().Citation27 This suggests that the overexpression of BC200 RNA in cancer cells may alter the transcription of specific genes by affecting chromatin organization. This is notable, because previous in vitro studies found that BC200 RNA can inhibit translation by interacting with translational initiation factors (e.g., eIF4A, eIF4B, and PABP).Citation28 The downregulated genes were found to be relatively diverse, but many of them are involved in cancer-related processes (). The FACS analysis showed that the BC200 RNA knockdown increased a portion of cells undergoing apoptosis (Fig. S4). This finding as well as the ribosome footprint profiling data suggests that BC200 RNA is functionally associated with cancer. The downregulated genes included S100A11, which is highly related to cellular motility in cancer.Citation19-23 It is overexpressed in a large variety of invasive carcinomas, and its suppression substantially decreases cell migration.Citation21,Citation23 Therefore, the reduced motility of siBC200-transfected HeLa cells could result from the BC200 RNA-knockdown-induced downregulation of S100A11.
Figure 2. BC200 RNA-knockdown-associated changes in the ribosome footprint profile. (A) A schematic of the workflow used to profile ribosome footprints. First, ribosome bounded mRNAs were purified from HeLa cells transfected with siRNAs. RNase I degraded unbounded fractions of mRNAs. Next, ribosomes were purified by sucrose cushioning and mRNAs bounded by ribosomes were selectively extracted. Finally, the remained mRNA fragments were converted to sequencing libraries and sequencing was performed. (B) A volcano plot representing the fold change (x-axis, log2 [Fold change]) and statistical significance (y-axis, −log10 [P-value]). Genes whose expression levels were significantly changed (P < 0.05 and > 2-fold change) by knockdown of BC200 RNA are marked. (C and D) Gene ontology (GO) analysis was performed using the QuickGO interface (http://www.ebi.ac.uk/QuickGO).Citation47 (C) GO of genes upregulated by knockdown of BC200 RNA. (D) GO of genes downregulated by knockdown of BC200 RNA.
![Figure 2. BC200 RNA-knockdown-associated changes in the ribosome footprint profile. (A) A schematic of the workflow used to profile ribosome footprints. First, ribosome bounded mRNAs were purified from HeLa cells transfected with siRNAs. RNase I degraded unbounded fractions of mRNAs. Next, ribosomes were purified by sucrose cushioning and mRNAs bounded by ribosomes were selectively extracted. Finally, the remained mRNA fragments were converted to sequencing libraries and sequencing was performed. (B) A volcano plot representing the fold change (x-axis, log2 [Fold change]) and statistical significance (y-axis, −log10 [P-value]). Genes whose expression levels were significantly changed (P < 0.05 and > 2-fold change) by knockdown of BC200 RNA are marked. (C and D) Gene ontology (GO) analysis was performed using the QuickGO interface (http://www.ebi.ac.uk/QuickGO).Citation47 (C) GO of genes upregulated by knockdown of BC200 RNA. (D) GO of genes downregulated by knockdown of BC200 RNA.](/cms/asset/ebdf6441-fe64-4a65-95ff-d157395a24e2/krnb_a_1297913_f0002_oc.jpg)
BC200 RNA knockdown decreases S100A11
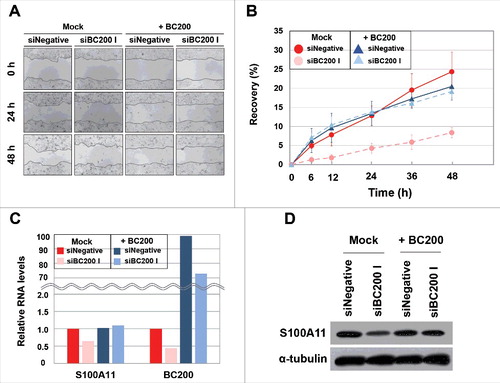
The RPKM of S100A11 in BC200 RNA-knockdown cells was 50% of that in control cells. Since RPKM mainly depends on the cellular level and translation efficiency of mRNA, we performed qRT-PCR to quantify the mRNA level of S100A11. The S100A11 mRNA level was significantly lower in BC200 RNA-knockdown cells at 24 h after the siRNA transfection (40% that of the control level) (), suggesting that this change, rather than an alteration in translation efficiency, accounted for the reduction in RPKM for the S100A11 gene. Our analysis of protein expression revealed that the S100A11 proteins levels in BC200 RNA-knockdown cells were 38% those in control cells (), suggesting that the decrease in mRNA levels was responsible for the reduction in protein expression. The mRNA and protein levels of S100A11 in cells treated with the less-efficient siBC200 II were decreased to 77% and 73% of those in the control cells, respectively (), suggesting that the decrease of S100A11 expression was proportional to the knockdown efficiency. We also performed rescue experiments by overexpression of BC200 RNA after the BC200 RNA knockdown. The rescue from the BC200 RNA knockdown restored cell motility and S100A11 expression (). All the data support that BC200 RNA is responsible for the changes in these parameters.
Figure 3. BC200 RNA knockdown decreases S100A11 expression. (A) RPKM of the S100A11 gene in our ribosome footprint profiling experiment (mean ± SD; n = 2; **P < 0.01, by Student's t-test). (B) Quantitative analysis of S100A11 mRNA abundance. Cells were transfected with siRNAs and incubated for 24 h, and total RNA was purified and subjected to qRT-PCR (mean ± SD; n = 3; *P < 0.05, ***P < 0.001, by Student's t-test). The abundance of S100A11 mRNA was normalized to the amount of GAPDH mRNA and depicted as relative RNA levels after dividing with the RNA abundance in siNegative-treated cells. (C) Time course analysis of S100A11 mRNA abundance after the siRNA transfection. Relative S100A11 mRNA levels are expressed relative to the amount of S100A11 mRNA before each siRNA treatment after normalizing to GAPDH mRNA. (D) Cells were transfected with siRNAs and incubated for 24 h, and whole-cell extracts were subjected to Western blotting. The amount of S100A11 protein was quantified using the ImageJ software (mean ± SD; n = 3; *P < 0.05, by Student's t-test). Relative protein levels are expressed relative to the S100A11 protein band intensity in siNegative-treated cells after normalization to α-tubulin. (E) Time course analysis of S100A11 protein abundance after the siRNA transfection.
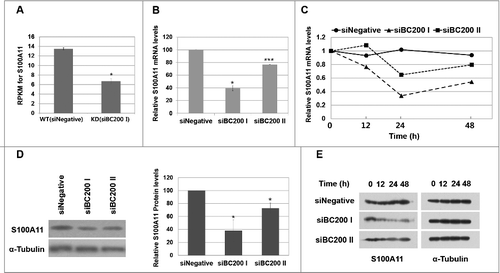
Figure 4. Recovery of wound healing and S100A11 expression in BC200 RNA-knockdown HeLa cells by BC200 RNA overexpression. (A and B) Wound-healing assays were performed as in except that HeLa cells were simultaneously transfected with siBC200 I and BC200 expression plasmid DNA. (A) Representative pictures, 40x magnification. (B) Quantitative analyses of wound-healing results. The percentage of recovery was measured and estimated based on the initial wound size of each sample. Shown are Mock-siNegative (red), Mock-siBC200 I (pale red), +BC200-siNegative (blue) and +BC200-siBC200 I (pale blue) (mean ± SD; n = 3; *P < 0.05, by Student's t-test). +BC200, overexpression of BC200 RNA. (C and D) Cells were simultaneously transfected with siBC200 I and BC200 expression plasmid DNA. Total RNA or whole-cell extracts were purified at 24 h post-transfection. (C) Quantitative analysis of S100A11 mRNA and BC200 RNA abundance by qRT-PCR. The abundance of each RNA was normalized to the amount of GAPDH mRNA and depicted as relative RNA levels after dividing with the corresponding RNA abundance in siNegative-treated cells. Shown are Mock-siNegative (red), Mock-siBC200 I (pale red), +BC200-siNegative (blue) and +BC200-siBC200 I (pale blue). (D) Whole-cell extracts were subjected to Western blotting.
BC200 RNA knockdown does not alter transcription of the S100A11 mRNA
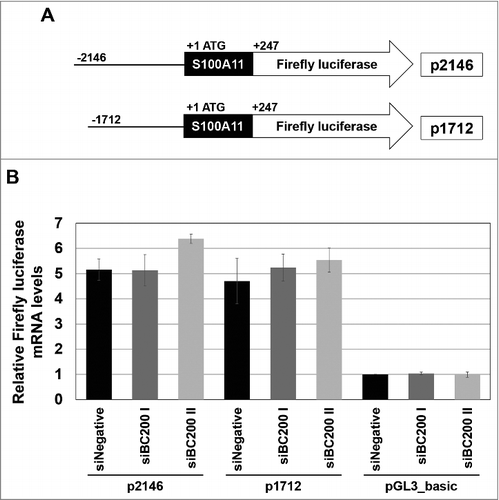
Next, we examined whether BC200 RNA knockdown affected the activity of the S100A11 promoter. The transcription of S100A11 is enhanced by EGFRvIII through the JAK/STAT pathway,Citation20 which drives diverse phenotypic changes in proliferation, energy metabolism, immune response and cell invasion.Citation29-32 This enhancement of S100A11 transcription, which requires 2 STATx binding sites residing in the −2146 to −1712 region (+1 at ATG of S100A11), was reported to be responsible for cellular migration.Citation20 Since S100A11 promotes cell migration at least in part through the JAK/STAT pathway, we speculated that the motility change triggered by BC200 RNA knockdown could involve this pathway. To test this, we cloned S100A11 promoter fragments containing the upstream sequences up to −2146 nt and −1712 nt into the pGL3 vector and used qRT-PCR to monitor the mRNA expression of luciferase (which is encoded by this vector). However, knockdown of BC200 RNA did not significantly affect transcription from either promoter region (), suggesting that the decrease of S100A11 mRNA levels in BC200 RNA-knockdown cells is not due to decreased transcriptional activity.
Figure 5. Effects of BC200 RNA knockdown on the transcription of S100A11. (A) Schematic diagrams of S100A11 promoter fragments inserted into a firefly luciferase expression vector pGL3_Basic so as to drive the firefly luciferase reporter gene. The constructs containing the S100A11 promoter regions −2146/+247 and −1712/+247 (+1 at ATG) are p2146 and p1712, respectively. (B) qRT-PCR-based quantification of luciferase transcripts. HeLa cells were serially transfected with the indicated siRNAs, incubated for 24 h, and then transfected with the p2146 or p1712 reporter constructs or with the pGL3_Basic vector (pBasic). At 48 h after the initial siRNA transfection, total RNA was purified and subjected for qRT-PCR (mean ± SD; n = 3). The abundance of firefly luciferase mRNA was normalized to the amount of GAPDH mRNA and depicted as relative RNA levels after dividing with the RNA abundance in siNegative and pGL3_Basic vector-treated cells.
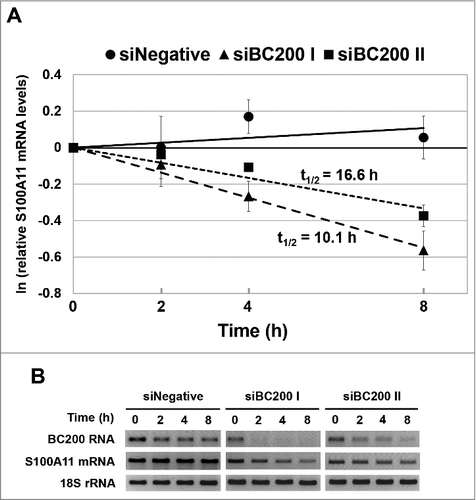
Knockdown of BC200 RNA destabilizes the S100A11 RNA
To examine whether BC200 RNA could affect the stability of the S100A11 mRNA, we performed actinomycin D-chase experiments with BC200 RNA-knockdown and control HeLa cells. Our results revealed that BC200 RNA knockdown significantly destabilized the S100A11 mRNA (). In control cells, the S100A11 mRNA was so stable that it was difficult for us to estimate the half-life within the experimental time course. In cells treated with siBC200 I or siBC200 II, in contrast, the S100A11 mRNA registered measurable half-lives of 10.1 h and 16.6 h, respectively. These data indicate that BC200 RNA notably contributes to maintaining the stability of the S100A11 mRNA. Based on this, we propose that RNA destabilization is a main contributor to the BC200 RNA-knockdown-induced downregulation of the S100A11 mRNA.
Figure 6. BC200 RNA knockdown alters the stability of the S100A11 mRNA. (A) HeLa cells were transfected with siRNAs, incubated for 24 h, and treated with actinomycin D (Final concentration: 5 μg/ml). Cells were harvested at 0, 2, 4 and 8 h after the actinomycin D treatment, and total RNA was purified and analyzed by qRT-PCR for S100A11 mRNA. The abundance of S100A11 mRNA was normalized to the amount of GAPDH mRNA in siNegative-, siBC200 I-, or siBC200 II-treated cells, and depicted as relative RNA levels after dividing with the RNA abundance in the corresponding cells before the actinomycin D treatment (mean ± SD; n = 3). (B) The total RNA was also analyzed by semi-qRT-PCR for S100A11 mRNA, BC200 RNA, and 18S rRNA.
S100A11 critically mediates the ability of BC200 RNA to induce cell migration and invasion
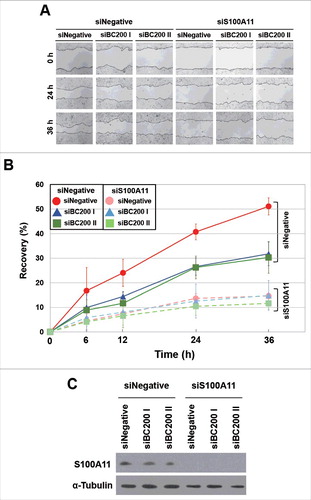
Finally, we examined whether S100A11 plays a critical role in BC200 RNA-induced migration. HeLa cells were transfected with siBC200s, incubated for 24 h, and then transfected with the S100A11 expression plasmid. We found that overexpression of S100A11 rescued the BC200 RNA knockdown effect (). Alternatively, HeLa cells were transfected with siS100A11 RNA, incubated for 24 h, and then transfected with the 2 siBC200 RNAs. Wound-healing assays revealed that S100A11 knockdown decreased the motility of HeLa cells, but the subsequent knockdown of BC200 RNA did not cause a further decrease in motility (). Likewise, our trans-well assays showed that S100A11 knockdown significantly disrupted the migration and invasion of HeLa cells, but the subsequent knockdown of BC200 RNA had little effect (Fig. S5). We also analyzed cell cycle and apoptosis after overexpression of S100A11 with and without BC200 RNA knockdown. We found that S100A11 overexpression did not significantly affect cell cycle progression and apoptosis rates either with or without BC200 RNA knockdown (Fig. S6), suggesting that the decreased cell motility by the BC200 RNA knockdown-induced decrease of S100A11 expression might have nothing to do with cell proliferation and apoptosis. These findings support the notion that S100A11 is a key mediator of the BC200 RNA-induced changes in migration and invasion of HeLa cells.
Figure 7. Recovery of the wound healing of BC200 RNA-knockdown HeLa cells by overexpression of S100A11. (A and B) HeLa cells were transfected with siBC200 I or siBC200 II, incubated for 24 h, and then transfected with the S100A11 expression plasmid DNA. Cells were scraped (wounded) at 48 h after the initial knockdown, and the degree of recovery was measured at 0, 12, 24, 36, and 48 h post-wounding. (A) Representative pictures, 40x magnification. (B) The results of our wound-healing assay were quantified as described in the legend to (mean ± SD; n = 3). Shown are siNegative (red), siBC200 I (blue), and siBC200 II (green). (C) At 48 h after the initial knockdown, whole-cell extracts were prepared and subjected to Western blot analysis.
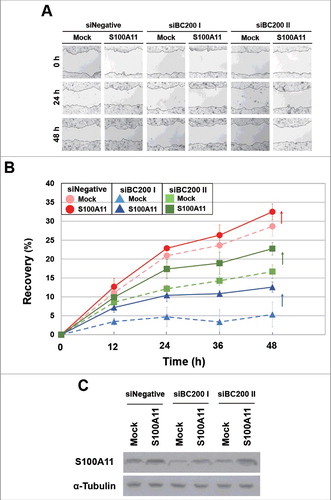
Figure 8. Effects of BC200 RNA knockdown on the wound healing of S100A11-knockdown HeLa cells. (A and B) HeLa cells were transfected with siS100A11, incubated for 24 h, and then transfected with siBC200 I or siBC200 II. Cells were scraped (wounded) at 48 h after the initial knockdown, and the degree of recovery was measured at 0, 6, 12, 24, and 36 h post-wounding. (A) Representative pictures, 40x magnification. (B) The results of our wound-healing assay were quantified as described in the legend to (mean ± SD; n = 3). Shown are siNegative (red), siBC200 I (blue), and siBC200 II (green). (C) At 48 h after the initial knockdown, whole-cell extracts were prepared and subjected to Western blot analysis.
BC200 RNA knockdown decreases cell motility and S100A11 expression in MCF7 cells
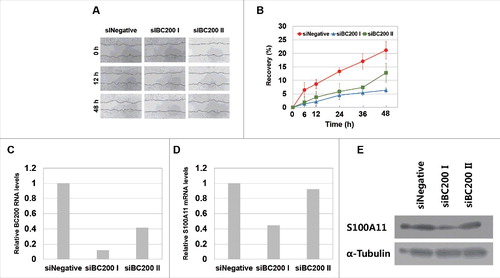
Since BC200 RNA is highly expressed in some breast cancer cellsCitation19-23 we also analyzed the connection between BC200 RNA, cell motility, and S100A11 expression (). We found that the BC200 RNA knockdown decreased the wound-healing rate. The expression levels of S100A11 protein were also reduced by the BC200 RNA knockdown. The decreased levels in both cell motility and S100A11 expression were more prominent with siBC200 I than siBC200 II. These data showed that these BC200 RNA knockdown effects can occur in different cancer cell types.
Figure 9. Effects of BC200 RNA knockdown on would healing and S100A11 expression of MCF7 breast cancer cells. MCF7 cells were transfected with siNegative, siBC200 I, or siBC200 II were analyzed for effects of the BC200 RNA knockdown on wound healing, as in , and on S100A11 expression, as in . (A) Representative pictures of the would-healing recovery, 40x magnification. (B) Quantitative analyses of wound-healing results (mean ± SD; n = 3). Shown are siNegative (red), siBC200 I (blue), and siBC200 II (green). (C and D) Quantitative analysis of (C) BC200 RNA and (D) S100A11 mRNA abundance. Cells were transfected with siRNAs and incubated for 24 h, and total RNA was purified and subjected to qRT-PCR. Relative RNA levels are expressed each RNA abundance after dividing with the corresponding RNA abundance in siNegative-treated cells as in . (E) Cells were transfected with siRNAs and incubated for 24 h, and whole-cell extracts were subjected to Western blotting.
Discussion
BC200 RNA has been reported to be highly upregulated in several cancers and cancer cell lines.Citation10,Citation11 In this study, we investigated possible functions of BC200 RNA in cancer cells, and found that knockdown of BC200 RNA significantly reduced cell motility. We then used ribosome footprint profiling to analyze genome-wide gene expression changes in BC200 RNA-knockdown and control cells. We identified several genes with reduced RPKM in knockdown cells, and selected S100A11, which belongs to the S100 protein family,Citation33 for further analysis. Correlations have been drawn between the expression levels of S100 proteins and cell migration/invasion. BC200 RNA knockdown reduced the protein levels of S100A11, in association with the reduced RPKM. Since the reduced cell motility of BC200 RNA knockdown cells was rescued by overexpression of S100A11 and the knockdown of BC200 RNA did not further reduce the cell motility of S100A11-knockdown cells, we believe that the upregulation of BC200 RNA in HeLa cells increases cell motility through the upregulation of S100A11. The promoter activity of the gene encoding S100A11 was not affected by BC200 RNA knockdown, but the stability of the S100A11 mRNA was significantly reduced. We do not yet know how BC200 RNA contributes to stabilizing the S100A11 mRNA. We speculate, however, that BC200 RNA may function as a buffer against the degradation of this mRNA. In this, it could be analogous to other ncRNAs, such as Linc-ROR, LncRNA-ATB, and MALAT1, which stabilize mRNAs by acting as competing endogenous RNAs to sequester miRNAs and inhibit the miRNA-mediated decay of their target mRNAs.Citation34-36 Alternatively, BC200 RNA may increase the stability of S100A11 mRNA by interacting with complementary sequences. There is a putative BC200 RNA binding site between positions −30 and −15 of S100A11 mRNA relative to the start codon (+ 1 would be A of the ATG codon). We showed that an RNA fragment containing this site could interact with BC200 RNA in vitro (Fig. S7), but it remains to be demonstrated whether or not this interaction is biologically relevant to the BC200 RNA-mediated increase of S100A11 mRNA stability in vivo. Such in vivo RNA-RNA interactions would be validated by using a method based on RNA antisense purification to systematically map RNA-RNA interactions.Citation37
One may argue that the siRNA-mediated inhibition of S100A11 expression might be caused by off-target effects. Since we used 2 non-overlapping siRNAs and the knockdowned BC200 RNA levels correlate with those of S100A11 expression and cell motility, the chance of having the same off-target effects is very slim. Furthermore, we found that overexpression of BC200 RNA rescued the BC200 knockdown effects. Therefore, it is very unlikely that the biologically relevant phenotypes by the siRNAs result from siRNA-mediated off-target gene silencing.
Our ribosome footprint profiling identified only 29 genes as being downstream targets of BC200 RNA, as defined by a > 2-fold change in knockdown versus control cells. Of them, 16 genes were upregulated and 13 genes were downregulated. Since BC200 RNA acts as a general translation inhibitor in vitro,Citation2,Citation7 the results representing that only a limited number of genes were altered by BC200 RNA in vivo suggest that there would be an additional mechanism, granting a specificity of effects in vivo. In neurons, BC200 RNA is strictly restricted to dendrites; thus, it would logically inhibit the translation of dendritic mRNAs. Therefore, it is possible that BC200 RNA may be distinctly localized in the cytoplasm and inhibit translation of specifically localized mRNAs. Our recent finding that BC200 RNA appears as fine punctate staining in the cytoplasm of HeLa cellsCitation38 may support this hypothesis. Although we herein focused on S100A11 as a downstream partner, BC200 RNA seems to have various effects on cancer cells. Moreover, our ribosome profiling data showed that BC200 RNA can alter the mRNA expression levels of various histones. These core protein components of chromatin are wound around with DNA and play crucial roles in gene regulation,Citation39 suggesting that BC200 RNA could contribute to gene regulation by altering the expression of histone mRNAs. Here, we add to this knowledge by showing that knockdown of BC200 RNA affected the expression levels of certain genes related to the cell survival and energy metabolism. Thus, expression changes of these genes may be involved in the development of cancer.
In summary, we herein show that BC200 RNA affects the expression levels of specific genes in cancer cells. We focused on S100A11, whose BC200 RNA-induced upregulation can enhance cell motility. Our novel findings may provide a basis for using BC200 RNA as a biomarker for cancer diagnosis, and suggest BC200 RNA itself could be a drug target for cancer treatment in the future.
Materials and methods
Cell culture and transfection
HeLa and MCF7 cells (ATCC) were maintained in Dulbecco's modified Eagle's medium (Gibco) containing 10% fetal bovine serum (Gibco) and 1% antibiotic-antimycotic (Gibco) at 37°C with 5% CO2. For transfections, cells were seeded and incubated for 24 h and siRNA or DNA transfections were performed using Lipofectamine 3000 (Invitrogen) according to the manufacturer's protocol.
Plasmid DNAs
For expression of BC200 RNA in HeLa cells, the BC200 sequence was PCR-amplified from Human genomic DNA (Roche) and cloned into the BglII/XhoI sites of pSUPER vector DNA (Oligoengine). For assays testing promoter activity of S100A11, S100A11-lucifierase transcriptional fusions were constructed as described previously.Citation20 The S100A11 promoter-containing DNA fragments from −2146 to +247 and from −1712 to +247 (+1 at ATG), respectively, were amplified by PCR using Human genomic DNA (Roche). The amplified DNA fragments, −2146/+247 and −1712/+247, were inserted at the XhoI/HindIII sites of the pGL3-Basic vector DNA (Promega). For expression of S100A11 in HeLa cells, the S100A11 open reading frame (ORF) sequence was PCR-amplified from a cDNA library (KCTC) and inserted at the EcoRI/XhoI sites of the pCNDA3HA (Invitrogen).
Primers and siRNAs
The primers for amplification of BC200 sequence were as follows: Fwd 5′-CGC GGA TCC CCG GCC GGG CGC GGT G-3′ and Rev 5′-CCC AAG CTT AAA AAG GGG GGG GGG GGT TG-3′. The primers for amplification of S100A11 promoter-containing DNA fragments and the S100A11 ORF sequence were as follows: p2146, Fwd 5′-CCG CTC GAG TGT GGT GTG TAA GGC CTC AT-3′ and Rev 5′-CCG AAG CTT TGT CGT GAC TGG GAA GGC TA-3′; p1712, Fwd 5′-CCG CTC GAG TGG AGT AGC TGA GAA CTG AG-3′ and Rev 5′-CCG AAG CTT TGT CGT GAC TGG GAA GGC TA-3′; S100A11 ORF, Fwd 5′-CCG GAA TTC ATG GCA AAA ATC TCC AG-3′ and Rev 5′-GCC CTC GAG TCA GGT CCG CT-3′. The primers used for semi-quantitative RT-PCR and quantitative real-time (qRT-)PCR were as follows: BC200 RNA, Fwd 5′-GCC TGT AAT CCC AGC TCT CA-3′ and Rev 5′-GTT GCT TTG AGG GAA GTT ACG CT-3′; GAPDH, Fwd 5′-GAA GGT GAA GGT CGG AGT C-3′ and Rev 5′-GAA GAT GGT GAT GGG ATT TC-3′; S100A11, Fwd 5′-CTC CAA GAC AGA GTT CCT AAG CTT C-3′ and Rev 5′-CAG CCT TGA GGA AGG AGT CAT G-3′; Firefly luciferase, Fwd 5′-TCA AAG CGA ACT GTG TG-3′ and Rev 5′-TTT TCC GTC ATC GTC TTT CC-3′; and 18S rRNA, Fwd 5′-CGG CTA CCA CT CCA AGG AA-3′ and Rev 5′-GCT GGA ATT ACC GCG GCT-3′. The primers for DNA fragments used as templates for in vitro transcription were as follows: S100A11_UTR, Fwd 5′-GAA TTC TAA TAC GAC TCA CTA TAG GTT GAG GAG AGG CTC CAG AC-3′ and Rev 5′-CT GTT GGA GCT GAG CGA GGC-3′; S100A11_ORF, Fwd 5′-GAA TTC TAA TAC GAC TCA CTA TAG GTG CT CGA GTC CCT GAT TGC-3′ and Rev 5′-TCA TGA AGC TTA GGA ACT CTG TCT TGG-3′; BC200 RNA, Fwd 5′-GAA TTC TAA TAC GAC TCA CTA TAG GCC GGG CGC GGT G-3′ and Rev 5′-AAA GGG GGG GGG GGG TTG TTG CTT TG-3′. Antisense oligonucleotides for probes of Northern blot were as follows: anti-BC200 (5′-TTT GAG GGA AGT TAC GCT TAT-3′), anti-5S (5′-CT CCA AGT ACT AAC CAG GCC C-3′) All of oligonucleotides were purchased from Bioneer. The sequences of small interfering RNAs (siRNAs) used for RNA interference were as follows: for BC200 RNA, siBC200 I, 5′-GUA ACU UCC CUC AAA GCA ATT-3′, siBC200 II, 5′-CGU UCU CCA GAA AAA GGA ATT-3′, siBC200 III, 5′-CUG CCU GGG CAA UAU AGC GAG-3′ and siBC200 IV, 5′-CCG GGC GCG GUG GCU CAC G-3′; and for S100A11, siS100A11, 5′-GAA CUA GCU GCC UUC ACA ATT-3′.Citation40 All of the siRNAs including a negative control siRNA (siNegative, SN-1001) were purchased from Bioneer.
Wound-healing assay
HeLa and MCF7 cells were seeded at 200,000 and 250,000 cells, respectively, per well to a 6-well cell culture plate (SPL Life Sciences) and grown to confluence. The monolayer was scraped (wounded) with the tip of a sterile plastic micropipette, debris was removed by washing the cells with 1 mL of growth medium/well, and the medium was replaced with 2 mL of serum-free medium per well. Digitized images were collected at various post-wounding intervals using an inverted microscope (Nikon Eclipse TS100) equipped with a digital camera (Nikon Digital Sight DS-Ri1). The wounded areas were calculated using the ImageJ software (NIH) and the results were used to estimate the degree of recovery.
Trans-well assays
Trans-well assays were performed as described previously.Citation41 For invasion assays, cells (50,000 per well) were plated in serum-free medium on 24-well trans-well inserts (Costar) coated with 100 μl/well of Matrigel (BD Biosciences, #354234, 250 μg/ml) and 100 μl/well of collagen I (the underside; Sigma, C7661, 20 μg/ml). When mitomycin C (Sigma, M4287, 1 μg/ml) was added, FBS-containing medium was used instead of serum-free medium. The plates were incubated for 40 h at 37 °C in 5% CO2, the cells on the upper side of the insert were scraped off, and the invaded cells (those on the underside of the insert) were fixed with 4% formaldehyde for 30 min at room temperature. The fixed cells were stained with 1% crystal violet for 30 min at room temperature, images were captured for 5 randomly chosen high-power (200x) fields per insert, and the invaded cells were counted. Migration assays were performed in a similar manner using 30,000 cells/well in trans-well inserts lacking the Matrigel coating.
Cell proliferation assay
Cell Counting Kit-8 (Sigma, #96992) was used to measure the cellular proliferative activity. Cells were seeded at a density of 12,000 cells per well into a 24-well plate and allowed to attach for 16 h. Viable cell numbers were measured with Cell Counting Kit-8 assays at 24, 48, and 72 h after siRNA transfection, respectively, according to the manufacturer's protocol.
Cell cycle analysis
HeLa cells transfected with siRNAs for 48 h or 72 h were harvested, washed with PBS, and fixed in 75% ethanol at 4°C for 30 min. The fixed cells were stained with 10 μg/ml propidium iodide solution (Sigma, P4864) containing 0.3 mg/ml RNase A (Roche, #10109169001) and 0.2% BSA for 15 min at 25°C. Cells were then analyzed for relative DNA content using a FACSCalibur (BD Immunocytometry System).
Profiling of ribosome footprints
Profiling of ribosome footprints was performed as described previously,Citation42 with a few modifications. Cells were harvested with a lysis buffer containing cycloheximide (Sigma, C4859, 100 μg/ml) to maintain the occupation of ribosomes on mRNAs. Lysates were treated with RNase I (Invitrogen, AM2294, 250 U/ml) to produce ribosome-footprinting fragments, which were purified by sucrose cushioning and filtered by size (26 to 34 nt). The fragments originating from rRNAs were removed by pulling down with biotinylated rRNA depletion oligos and the remaining fragments were converted to a sequencing library. The library was sequenced on a HiSeq 2500 platform (Illumina), and the obtained sequences were trimmed by removal of the 5′ clipping sequence (5′-AAT GAT ACG GCG ACC ACC GAG ATC TAC ACT CTT TCC CTA CAC GAC GCT CTT CCG ATC T-3′) and the 3′ clipping sequence (5′-CTG TAG GCA CCA TCA ATA GAT CGG AAG AGC ACA CGT CTG AAC TCC AGT CAC-3′). The trimmed sequences were aligned to the human reference genome (hg19) using CLC genomics workbench 7.5.1 (CLC bio), and the data were statistically analyzed using edgeR.Citation43
Semi-quantitative RT-PCR and quantitative real-time PCR
Total RNA was prepared from HeLa cells using an easy-Blue™ Total RNA Extraction kit (Intron) or an RNeasy Mini kit (Qiagen), according to the manufacturers' descriptions. cDNAs were synthesized from 1 μg of total RNA using a ReverTra Ace® qPCR RT Master Mix with gDNA Remover (TOYOBO). For semi-quantitative RT-PCR, cDNAs were amplified using a Taq Premix kit (Enzynomics) with and primer pairs specific to BC200 RNA, 18S rRNA, S100A11 mRNA, or luciferase mRNA. The PCR products were electrophoresed on 3% agarose gels, stained with Loading STAR (Dyne Bio), and analyzed on a GelDoc 1000 (Bio-Rad). For qRT-PCR, cDNAs were amplified using a Bioneer Exicycler™ 96 Real-Time Quantitative Thermal Block (Bioneer) with TOPreal™ qPCR 2x PreMIX (Enzynomics) and the specific primer pairs. Fluorescence plots were generated, the value of CT was estimated using the Exicycler™ program (Bioneer), and RNA was quantified according to the comparative CT method.Citation44
RNA stability analysis
HeLa cells were transfected with siRNAs, incubated for 24 h, and treated with 5 μg/ml (final concentration) of actinomycin D (Sigma, A9415), as described previously.Citation45 Cells were collected at various intervals after the actinomycin D treatment, and total RNAs were prepared and analyzed for S100A11 mRNA and BC200 RNA by semi-quantitative RT-PCR as described above.
Western blot analysis
Cells were harvested and lysed in RIPA buffer [50 mM Tris-HCl, pH 7.5, 150 mM NaCl, 0.5% Na-deoxycholate (m/v), 0.1% SDS (w/v), 1% Triton X-100 (v/v), 2 mM EDTA, 1 tablet/50 ml of Complete Protease Inhibitor Cocktail (Roche)]. The obtained proteins were resolved by SDS-PAGE and transferred to Hybond ECL nitrocellulose membranes (GE Healthcare). Immunostaining was performed using the Amersham ECL Prime Western Blotting Detection Reagent (GE Healthcare) according to the manufacturer's protocol. Antibodies used for this analysis were as follows: S100A11 (1:1000, Proteintech, 10237–1-AP) and α-Tubulin (1:1500, Santa Cruz, sc-8035).
Northern blot analysis
Total RNA was fractionated on a 6% polyacrylamide gel containing 7 M Urea and transferred to a Hybond-XL membrane (GE Healthcare). Antisense oligonucleotides were 5′end labeled with [γ-32P] ATP (PerkinElmer Life Sciences, BLU002A250UC) by T4 polynucleotide kinase (Enzynomics) and used as probes for hybridization. Hybridization in Rapid-Hyb buffer (GE Healthcare) was performed at 40°C for BC200 RNA overnight, and 42°C for 5S RNA in a hour. The membrane was washed twice at room temperature in 2× SSC buffer (20 mM sodium phosphate, pH 7.4; 0.3 M NaCl; 2 mM EDTA) with 0.1% SDS for 20 min and twice in 0. 2× SSC buffer with 0.1% SDS for 20 min. The membrane was exposed to imaging plate (Fuji BAS-IP) for overnight and analyzed on a phospho-image analyzer (Fuji FLA-7000).
Electrophoretic mobility shift assay (EMSA)
EMSA experiments were performed as described previously.Citation46 The DNA templates for S100A11_UTR, S100A11_ORF and BC200 RNA were amplified using PCR with the corresponding primer pairs. RNAs were prepared by in vitro transcription using T7 RNA polymerase (Promega, P1320), with the amplified DNA fragments as templates. 5′-32P-end-labeled BC200 RNA (2 nM) was incubated with unlabeled S100A11 mRNA fragments (2, 20, 40, 80, 120 or 200 nM) in 25 μl TMN buffer [20 mM Tris-acetate, pH 7.6, 100 mM NaOAc, 5 mM Mg(OAc)2] at 25 °C for 20 min. The reactions were then analyzed on a 6% (v/v) non-denaturing polyacrylamide gel at 4 °C.
Statistical analysis
For statistical analysis, 2-sided unpaired Student's t-test were processed. A P < 0.05 was considered statistically significant. The symbols * indicate P < 0.05; ** indicate P < 0.01; *** indicate P < 0.001. Error bars represented SD of at least 3 independent experiments, unless indicated otherwise.
Disclosure of potential conflicts of interests
No potential conflicts of interests were disclosed.
Supplemental_Materials.docx
Download MS Word (1.7 MB)Acknowledgment
We thank Dr. Yong-Joon Cho (ChunLab, Inc.) for assistance with profiling data analysis.
Funding
This study was supported by National Research Foundation of Korea (NRF) funded by the Korea government (MSIP) (2011–0020322; NRF-2014R1A2A1A11049414) and the Intelligent Synthetic Biology Center of Global Frontier Project funded by MSIP (2013M3A6A8073557).
References
- Lin D, Pestova TV, Hellen CU, Tiedge H. Translational control by a small RNA: dendritic BC1 RNA targets the eukaryotic initiation factor 4A helicase mechanism. Mol Cell Biol 2008; 28:3008-19; PMID:18316401; https://doi.org/10.1128/MCB.01800-07
- Kondrashov AV, Kiefmann M, Ebnet K, Khanam T, Muddashetty RS, Brosius J. Inhibitory effect of naked neural BC1 RNA or BC200 RNA on eukaryotic in vitro translation systems is reversed by poly(A)-binding protein (PABP). J Mol Biol 2005; 353:88-103; PMID:16154588; https://doi.org/10.1016/j.jmb.2005.07.049
- Tiedge H, Chen W, Brosius J. Primary structure, neural-specific expression, and dendritic location of human BC200 RNA. J Neurosci 1993; 13:2382-90; PMID:7684772
- Eom T, Berardi V, Zhong J, Risuleo G, Tiedge H. Dual Nature of Translational Control by Regulatory BC RNAs. Mol Cell Biol 2011; 31:4538-49; PMID:21930783; https://doi.org/10.1128/MCB.05885-11
- Muslimov IA, Patel MV, Rose A, Tiedge H. Spatial code recognition in neuronal RNA targeting: role of RNA-hnRNP A2 interactions. J Cell Biol 2011; 194:441-57; PMID:21807882; https://doi.org/10.1083/jcb.201010027
- Eom T, Muslimov IA, Tsokas P, Berardi V, Zhong J, Sacktor TC, Tiedge H. Neuronal BC RNAs cooperate with eIF4B to mediate activity-dependent translational control. J Cell Biol 2014; 207:237-52; PMID:25332164; https://doi.org/10.1083/jcb.201401005
- Hasler J, Strub K. Alu RNP and Alu RNA regulate translation initiation in vitro. Nucleic Acids Res 2006; 34:2374-85; PMID:16682445; https://doi.org/10.1093/nar/gkl246
- Rozhdestvensky TS, Kopylov AM, Brosius J, Huttenhofer A. Neuronal BC1 RNA structure: evolutionary conversion of a tRNA(Ala) domain into an extended stem-loop structure. RNA 2001; 7:722-30; PMID:11350036; https://doi.org/10.1017/S1355838201002485
- Mus E, Hof PR, Tiedge H. Dendritic BC200 RNA in aging and in Alzheimer's disease. Proc Natl Acad Sci U S A 2007; 104:10679-84; PMID:17553964; https://doi.org/10.1073/pnas.0701532104
- Chen W, Bocker W, Brosius J, Tiedge H. Expression of neural BC200 RNA in human tumours. J Pathol 1997; 183:345-51; PMID:9422992; https://doi.org/10.1002/(SICI)1096-9896(199711)183:3%3c345::AID-PATH930%3e3.0.CO;2-8
- Gibb EA, Brown CJ, Lam WL. The functional role of long non-coding RNA in human carcinomas. Mol Cancer 2011; 10:38; PMID:21489289; https://doi.org/10.1186/1476-4598-10-38
- Iacoangeli A, Lin Y, Morley EJ, Muslimov IA, Bianchi R, Reilly J, Weedon J, Diallo R, Böcker W, Tiedge H. BC200 RNA in invasive and preinvasive breast cancer. Carcinogenesis 2004; 25:2125-33; PMID:15240511; https://doi.org/10.1093/carcin/bgh228
- Hu T, Lu YR. BCYRN1, a c-MYC-activated long non-coding RNA, regulates cell metastasis of non-small-cell lung cancer. Cancer Cell Inter 2015; 15:36; PMID:25866480; https://doi.org/10.1186/s12935-015-0183-3
- Li P, Yang B, Xia SY, Chen L, Ning N, Ma B, et al. BC200 RNA is over-expressed in colorectal cancer and promotes migration and invasion of HCT116 cells. Int J Clin Exp Patho 2016; 9:1481-6
- Reuter JA, Spacek DV, Snyder MP. High-throughput sequencing technologies. Mol Cell 2015; 58:586-97; PMID:26000844; https://doi.org/10.1016/j.molcel.2015.05.004
- Ingolia NT. Ribosome Footprint Profiling of Translation throughout the Genome. Cell 2016; 165:22-33; PMID:27015305; https://doi.org/10.1016/j.cell.2016.02.066
- Ingolia NT, Ghaemmaghami S, Newman JR, Weissman JS. Genome-wide analysis in vivo of translation with nucleotide resolution using ribosome profiling. Science 2009; 324:218-23; PMID:19213877; https://doi.org/10.1126/science.1168978
- Bhan A, Mandal SS. Long noncoding RNAs: emerging stars in gene regulation, epigenetics and human disease. ChemMedChem 2014; 9:1932-56; PMID:24677606; https://doi.org/10.1002/cmdc.201300534
- Fan C, Fu Z, Su Q, Angelini DJ, Van Eyk J, Johns RA. S100A11 mediates hypoxia-induced mitogenic factor (HIMF)-induced smooth muscle cell migration, vesicular exocytosis, and nuclear activation. Mol Cell Proteom 2011; 10:M110 000901; PMID: 21139050; https://doi.org/10.1074/mcp.M110.000901
- Luo X, Xie H, Long X, Zhou M, Xu Z, Shi B, Jiang H, Li Z. EGFRvIII mediates hepatocellular carcinoma cell invasion by promoting S100 calcium binding protein A11 expression. PloS One 2013; 8:e83332; PMID:24376686; https://doi.org/10.1371/journal.pone.0083332
- Jaiswal JK, Lauritzen SP, Scheffer L, Sakaguchi M, Bunkenborg J, Simon SM, Kallunki T, Jäättelä M, Nylandsted J. S100A11 is required for efficient plasma membrane repair and survival of invasive cancer cells. Nat Commun 2014; 5:3795; PMID:24806074; https://doi.org/10.1038/ncomms4795
- Gabril M, Girgis H, Scorilas A, Rotondo F, Wala S, Bjarnason GA, Ding Q, Evans A, Tawedrous E, Pasic M, et al. S100A11 is a potential prognostic marker for clear cell renal cell carcinoma. Clin Exp Metastasis 2016; 33:63-71; PMID: 21139050; https://doi.org/10.1007/s10585-015-9758-6
- Niu Y, Shao Z, Wang H, Yang J, Zhang F, Luo Y, Xu L, Ding Y, Zhao L. LASP1-S100A11 axis promotes colorectal cancer aggressiveness by modulating TGFbeta/Smad signaling. Sci Rep 2016; 6:26112; PMID:27181092; https://doi.org/10.1038/srep26112
- Matveeva O, Nechipurenko Y, Rossi L, Moore B, Saetrom P, Ogurtsov AY, Atkins JF, Shabalina SA. Comparison of approaches for rational siRNA design leading to a new efficient and transparent method. Nucleic Acids Res 2007; 35:e63; PMID:17426130; https://doi.org/10.1093/nar/gkm088
- Zhao XY, Lin JD. Long Noncoding RNAs: A New Regulatory Code in Metabolic Control. Trends Biochem Sci 2015; 40:586-96; PMID:26410599; https://doi.org/10.1016/j.tibs.2015.08.002
- Moran VA, Perera RJ, Khalil AM. Emerging functional and mechanistic paradigms of mammalian long non-coding RNAs. Nucleic Acids Res 2012; 40:6391-400; PMID:22492512; https://doi.org/10.1093/nar/gks296
- Bannister AJ, Kouzarides T. Regulation of chromatin by histone modifications. Cell Res 2011; 21:381-95; PMID:21321607; https://doi.org/10.1038/cr.2011.22
- Iacoangeli A, Tiedge H. Translational control at the synapse: role of RNA regulators. Trends Biochem Sci 2013; 38:47-55; PMID:23218750; https://doi.org/10.1016/j.tibs.2012.11.001
- Thomas SJ, Snowden JA, Zeidler MP, Danson SJ. The role of JAK/STAT signalling in the pathogenesis, prognosis and treatment of solid tumours. Br J Cancer 2015; 113:365-71; PMID:26151455; https://doi.org/10.1038/bjc.2015.233
- Demaria M, Giorgi C, Lebiedzinska M, Esposito G, D'Angeli L, Bartoli A, Gough DJ, Turkson J, Levy DE, Watson CJ, et al. A STAT3-mediated metabolic switch is involved in tumour transformation and STAT3 addiction. Aging 2010; 2:823-42; PMID:21084727; https://doi.org/10.18632/aging.100232
- Kortylewski M, Kujawski M, Wang T, Wei S, Zhang S, Pilon-Thomas S, Niu G, Kay H, Mulé J, Kerr WG, et al. Inhibiting Stat3 signaling in the hematopoietic system elicits multicomponent antitumor immunity. Nat Med 2005; 11:1314-21; PMID:16288283; https://doi.org/10.1038/nm1325
- Cho KH, Jeong KJ, Shin SC, Kang J, Park CG, Lee HY. STAT3 mediates TGF-beta1-induced TWIST1 expression and prostate cancer invasion. Cancer Lett 2013; 336:167-73; PMID:23623921; https://doi.org/10.1016/j.canlet.2013.04.024
- Gross SR, Sin CG, Barraclough R, Rudland PS. Joining S100 proteins and migration: for better or for worse, in sickness and in health. Cell Mol Life Sci 2014; 71:1551-79; PMID:23811936; https://doi.org/10.1007/s00018-013-1400-7
- Eades G, Wolfson B, Zhang Y, Li Q, Yao Y, Zhou Q. lincRNA-RoR and miR-145 regulate invasion in triple-negative breast cancer via targeting ARF6. Mol Cancer Res 2015; 13:330-8; PMID:25253741; https://doi.org/10.1158/1541-7786.MCR-14-0251
- Yuan JH, Yang F, Wang F, Ma JZ, Guo YJ, Tao QF, Liu F, Pan W, Wang TT, Zhou CC, et al. A long noncoding RNA activated by TGF-beta promotes the invasion-metastasis cascade in hepatocellular carcinoma. Cancer Cell 2014; 25:666-81; PMID:24768205; https://doi.org/10.1016/j.ccr.2014.03.010
- Wang SH, Zhang WJ, Wu XC, Weng MZ, Zhang MD, Cai Q, Zhou D, Wang JD, Quan ZW. The lncRNA MALAT1 functions as a competing endogenous RNA to regulate MCL-1 expression by sponging miR-363-3p in gallbladder cancer. J Cell Mol Med 2016; 20(12):2299-308; PMID:27420766; https://doi.org/10.1111/jcmm.12920
- Engreitz JM, Sirokman K, McDonel P, Shishkin AA, Surka C, Russell P, Grossman SR, Chow AY, Guttman M, Lander ES. RNA-RNA interactions enable specific targeting of noncoding RNAs to nascent Pre-mRNAs and chromatin sites. Cell 2014; 159:188-99; PMID:25259926; https://doi.org/10.1016/j.cell.2014.08.018
- Shin H, Lee J, Kim Y, Jang S, Ohn T, Lee Y. Identifying the cellular location of brain cytoplasmic 200 RNA using an RNA-recognizing antibody. BMB Rep 2017; pii: 3721; PMID:28042783
- Marino-Ramirez L, Kann MG, Shoemaker BA, Landsman D. Histone structure and nucleosome stability. Expert Rev Proteomics 2005; 2:719-29; PMID:16209651; https://doi.org/10.1586/14789450.2.5.719
- Gorsler T, Murzik U, Ulbricht T, Hentschel J, Hemmerich P, Melle C. DNA damage-induced translocation of S100A11 into the nucleus regulates cell proliferation. BMC Cell Biol 2010; 11:100; PMID:21167017; https://doi.org/10.1186/1471-2121-11-100
- Nam EH, Lee Y, Moon B, Lee JW, Kim S. Twist1 and AP-1 cooperatively upregulate integrin alpha5 expression to induce invasion and the epithelial-mesenchymal transition. Carcinogenesis 2015; 36:327-37; PMID:25600770; https://doi.org/10.1093/carcin/bgv005
- Ingolia NT, Brar GA, Rouskin S, McGeachy AM, Weissman JS. The ribosome profiling strategy for monitoring translation in vivo by deep sequencing of ribosome-protected mRNA fragments. Nat Protocols 2012; 7:1534-50; PMID:22836135; https://doi.org/10.1038/nprot.2012.086
- Robinson MD, McCarthy DJ, Smyth GK. edgeR: a Bioconductor package for differential expression analysis of digital gene expression data. Bioinformatics 2010; 26:139-40; PMID:19910308; https://doi.org/10.1093/bioinformatics/btp616
- Livak KJ, Schmittgen TD. Analysis of relative gene expression data using real-time quantitative PCR and the 2(-Delta Delta C(T)) Method. Methods 2001; 25:402-8; PMID:11846609; https://doi.org/10.1006/meth.2001.1262
- Li Y, Francia G, Zhang JY. p62/IMP2 stimulates cell migration and reduces cell adhesion in breast cancer. Oncotarget 2015; 6:32656-68; PMID:26416451; https://doi.org/10.18632/oncotarget.5328
- Bak G, Lee J, Suk S, Kim D, Young Lee J, Kim KS, Choi BS, Lee Y. Identification of novel sRNAs involved in biofilm formation, motility, and fimbriae formation in Escherichia coli. Sci Rep 2015; 5:15287; PMID:26469694; https://doi.org/10.1038/srep15287
- Binns D, Dimmer E, Huntley R, Barrell D, O'Donovan C, Apweiler R. QuickGO: a web-based tool for Gene Ontology searching. Bioinformatics 2009; 25:3045-6; PMID:19744993; https://doi.org/10.1093/bioinformatics/btp536