
ABSTRACT
An increasing number of studies propose circulating microRNAs (miRNAs) as biomarkers for a large number of human diseases including cancer, cardiovascular diseases, neurologic pathologies and others. To further validate miRNA as biomarkers it is indispensable to understand the variability of circulating miRNAs in healthy individuals. We determined the longitudinal miRNomes of 90 serum samples from the Janus Serum Bank in Norway, which have been stored between 23 and 40 y at -25 °Celsius. We profiled 3 serum samples with microarrays for 30 individuals, each. For each individual the samples were collected with a time interval of approximately 5 y. This design allowed insights into inter-individual variability, age dependent miRNA variability and the impact of storage length and pre-processing. A significant proportion of the miRNome was affected by the age of the blood donor and a not negligible, albeit small, part of the miRNome by the storage time. A substantial part of miRNAs was differentially abundant between individuals, independent of the time when samples were collected. Stepwise filtering of the 529 miRNAs that were detected in the serum samples showed 168 miRNAs with differential abundance depending on the time point analyzed, 56 miRNAs differentially abundant between individuals, and 169 miRNAs with an abundance depending on the sampling procedure. While these groups of miRNAs contain generally interesting and biologically important miRNAs, the remaining 135 miRNAs constitute very promising biomarker candidates as they show an overall low variability between healthy individuals, a likewise overall low variability across a longer life span, and a high independence of the sampling process and the storage length.
Introduction
Molecular markers are intensively studied as promising biomarkers to advance human healthcare. In the past three decades, mRNAs, coding for proteins have been considered as biomarkers for many human diseases. Now attention has been shifted toward the non-coding part of the genome. A substantial part of non-coding RNAs are small non-coding RNAs, sncRNAs. Among the best studied sncRNAs are microRNAs (miRNAs), nucleic acid chains of 17–23 nucleotides. The first miRNAs that were described as early as 1993 in C. elegans were lin-4 and let-7.Citation1 Later, in 2001, the role of “tiny regulators with great potential” has been described by Ambros.Citation2 Applying different experimental techniques miRNA expression profiles have been associated to literally all diseases. Examples include Acute Myocardial Infarction (AMI),Citation6 Alzheimer Disease,Citation3 Bladder cancer,Citation7 lung cancer,Citation4,Citation5 endocrine cancers,Citation8 gastric cancer,Citation6 pancreatic cancer,Citation7 glioma,Citation8Citation9 and many others.Citation10 In these studies, genome wide high-throughput profiles of miRNAs are usually done using microarrays or next-generation sequencing. For validation and lower-throughput analyses RT-qPCR is applied. Advantages and disadvantages of the different platforms have been investigated by Mestdagh et al.Citation11 Notwithstanding the great potential of miRNAs as biomarkers,Citation12,Citation13 the translation of miRNAs from basic research to patient care is progressing slowly. A recent review article by Witwer and Halushka summarizes major challenges for the clinical translational of miRNA biomarkers, including aspects such as relating miRNAs to cell types within tissues, reliable assay techniques and others.Citation14 The need for more background knowledge is exemplarily demonstrated for miR-144, which is considered as “general diseases marker”Citation15 and appears to be predominantly expressed in red blood cells.Citation16 To adequately judge its value as biomarker it is mandatory to have a more complete picture on its tissue specific expression. Similar challenges apply also for other miRNAs such as miR-143/145.Citation17 Databases providing comprehensive information on miRNA expression in different tissuesCitation18 or in different blood cell typesCitation19 are a first step toward a better biologic understanding of proposed miRNA biomarkers. Other issues toward clinical translation of miRNAs biomarkers are the methodological challenges associated with the use of serum or plasma as source for circulating miRNA markers.Citation20
In addition to the afore mentioned challenges, there is an urgent need for further evaluation of most of the proposed miRNA biomarkers in terms of stability and variability in a population of individuals without known diseases. If respective markers show high variability between unaffected people, it is difficult to define fixed thresholds that are necessary for most application in the clinical routine. Thus, variable markers can only be used if there are substantial differences in the signal between affected and unaffected individuals. For those markers that are currently applied in clinical routine, reference values remain largely unknown for the according miRNAs. Especially the afore mentioned inter-individual variations complicates the determination of reference values. Since miRNA values are also influenced by the age of individualsCitation21 – not only in body fluids but even in tissues such as the heartCitation22 – longitudinal monitoring of individuals over time is required. Specifically, for the present study, we included individuals without known malignant diseases at the time of blood drawing. Since the respective individuals may, however, suffer from a malignant disease that has not been diagnosed at this time point, longitudinal data with follow-up information are likewise important.
These requirements call for samples that have been collected prospectively in population- based studies, with long follow-up times. In most studies with sera from healthy individuals, the focus has been on the comparison between miRNAs identified in patients and in healthy controls without testing other factors that impact the miRNA abundance. Having consecutive measurements combined with follow-up data over many years allows to estimate the variability of miRNA abundances during lifetime of healthy individuals. In the present study, we included individuals from the Janus Serum Bank in Norway. Information on non-cancer diseases was not available for the individuals included in this study. Notably, none of the included controls from the Norwegian cancer research biobank did develop cancer after the blood donation during the time monitored. This allowed us to address the questions how variable miRNAs are between different individuals that did not developed cancer, how variable miRNAs are within individuals over time, and how strong long-time storage of samples affects miRNA profiles.
Results
Study set-up for whole-genome-wide miRNA profiling
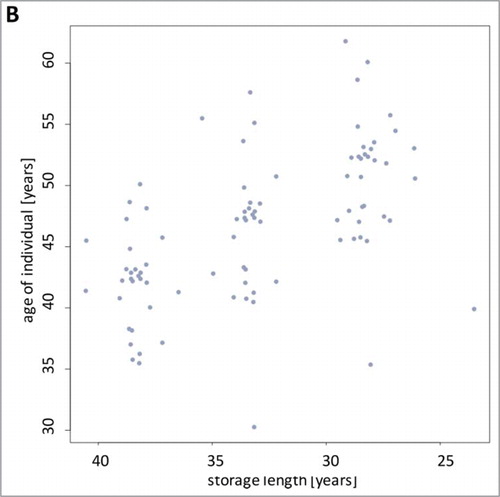
To determine the variation of miRNA abundances in sera of cancer free individuals we analyzed samples from the Janus Serum Bank in Norway. We measured the genome-wide miRNomes of 90 serum samples from 30 individuals. Each of the individuals was analyzed at 3 time points, with an interval of approximately 5 y between each drawing. All blood donors were residents of Norway and had not been diagnosed with cancer at the time of blood drawings. To acknowledge the influence of diseases with a delayed clinical manifestation we also excluded donors that were diagnosed with cancer following the last blood drawing. Upon blood drawing sera were isolated as detailed in Material and Methods and stored at −25°C degree. The storage times varied between 23.5 and 40.5 y and the age of individuals at the times of blood drawing between 30.3 and 61.8 y. The overall distribution of age and storage length are presented in . The samples have been selected in a way that the length of the storage times was largely comparable for each of the 3 time points of blood drawing. As depicted in there are three almost identical age clusters each with an approximate time span of 5 y. Since we performed a longitudinal study on the same individuals over 10 years, the more recently collected samples (having shorter storage times) correspond to older individuals. Thus, age and time of sampling are inversely correlated (correlation of −0.54, p-value 3 × 10⁻⁸).
Figure 1A. Box-plots showing the distribution of age of the blood donors (given in years on the Y-axis) and the distribution of the duration of storage times (given in days on the Y-axis).
Figure 1B. Scatter plot of the age of the blood donors and of the storage times. For each donor, the samples were collected at three comparable time windows of approximately 5 y as indicated by 3 clusters.
Estimating the influence of age and storage length
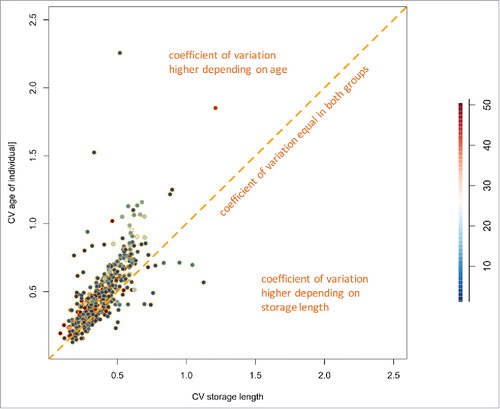
One of the main objectives of this study was to determine the effect of long-term storage of serum samples on the miRNome. The answer to this question is complicated by the above-mentioned inverse correlation of the length of storage and the age of the blood donor at the times of sampling. Changes in the abundance of miRNAs over time may be due to the altered age of the blood donors or to the duration of the sample storage. To address this issue, we selected two subsets of samples. In the first subset, we included 15 of the 90 samples with minimal differences in storage length and maximal variation in the age range. These samples showed a variation in storage times of 0.9 y i.e. the maximal difference in storage times between the earliest and the latest time point was 0.9 y. In contrast, the age interval of the same individuals was 27.3 y. In the second subset we likewise included 15 samples but with minimal age difference and maximal variation in storage times. These samples showed a maximal age difference of 2.9 y and a difference in storage times of 27 y. summarizes the distribution of age and storage times for each of the two subsets. We determined the coefficient of variation (CV) for the miRNAs in both subsets of samples to obtain an estimate on whether a miRNA is generally more affected by storage times or by the age of the individuals. As depicted in the majority of the miRNAs present in the serum samples showed a good correlation of CVs in both subsets. As for the differences between both sets, the average CV with respect to the age of the blood donors at the time of sampling across all miRNAs was 0.48 and the average CV for with respect to the storage length was 0.38. A 2-tailed and paired t-test demonstrated a highly significant decreased CV depending on the storage length as compared with the age (p < 2.2 × 10⁻¹⁶). The results indicate that the miRNAs that show a variability are mostly affected by the age of the blood donors and to a lower extent by the storage time. A prominent example was miR-21–5p with a CV of 1.52 for the age of the donor and a CV of 0.33 for the storage length. Few miRNAs show opposite patterns. For example, miR-4730 and miR-4306 both had high CV with respect to the storage time (1.04 and 1.12 respectively) and a low CV with respect to the age of the blood donor at sampling times (0.7 and 0.57). Interestingly, the differences in CV between storage length and age were larger for higher abundant miRNAs. Although the data rely on a subset of all samples and may show a selection bias, the results show that a significant portion of the miRNome is affected by the age of the blood donor and a not negligible, albeit small, part of the miRNome by the storage time.
Figure 1C. Distribution of age and storage times for two subsets of samples. The first subset, which is framed by two orange dashed lines includes samples with minimal differences in storage length and maximal variation in the age range (n = 15). The second subset, which is framed by two blue dashed lines, includes samples with minimal age difference and maximal variation in storage times (n = 15).
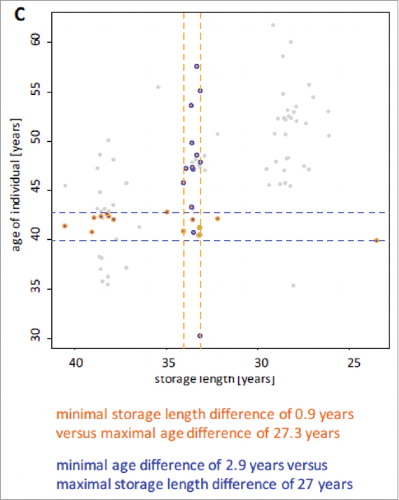
Figure 2. Scatter plot of the coefficient variation of the storage length and the age of the blood donors. MiRNAs are generally more affected by the age of the blood donors than by the storage time. Points are colored with respect to the expression intensity of the respective miRNAs.
Inter-individual and time-dependent variability
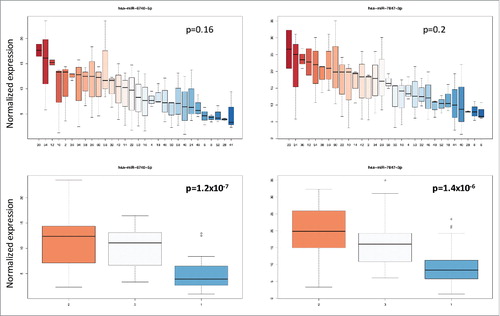
Besides the age of the blood donors and the duration of storage, differences in miRNA expression between individuals may also account for the variability of the miRNomes. To test this hypothesis, we performed two analyses of variance (ANOVA) for each miRNA. Using the time point (first, second and last measurement) or the individual as response variables, we clearly identified miRNAs that were largely dependent on the time point and miRNAs that were largely dependent on the individual (). Following adjustment for multiple testing by applying the Benjamini-Hochberg approach, 73 miRNAs were significantly different between individuals. Although only three measurements were available for each individual, the lowest significance value was 1.8 × 10⁻⁹. This value was calculated for miR-328–5p, showing a 20-fold variation between the individual with smallest and the individual with largest miRNA abundance. The same miRNA showed a not significant p-value of 0.66 for the storage time as response variable. Likewise, miR-144–3p was highly significant (4.2 × 10⁻⁶) for the individuals but not for the storage time (0.55). Box-plots for miR-328–5p and miR-144–3p each for the 30 individuals and the 3 time points are given in . By contrast, miR-6740–5p did not significantly varied between individuals (p = 0.16) but was significant with respect to the time points (p = 1.2 × 10⁻⁷). A similar pattern was calculated for miR-7847–3p. Box-plots for miR-6740–5p and miR-7847–3p are shown in . Tables with detailed statistics for all miRNAs are provided as Supplemental Material (Supplemental Table 1). While these miRNAs are biologically very interesting the wide range of abundance already in unaffected individuals may cause challenges for respective miRNAs to be used as diagnostic or prognostic biomarkers.
Figure 3. Scatter plot of an analysis of variance (ANOVA) for each miRNA with either the storage time or the individual as response variable. The significance values for each miRNA are given as negative decade logarithm.
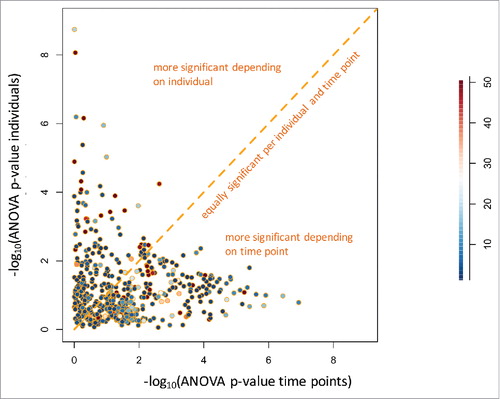
Figure 4. Box-plots for miR-328–5p and miR-144–3p showing the variance of both miRNAs between the 30 individuals and the 3 time points. The different individuals (upper part of the figure) and the different time points (lower part of the figure) are referred to by numbers on the X axis. The variation of intensity values is given on the y-axis. The variation of both miRNA was not significant for the storage time but highly significant between the individuals.
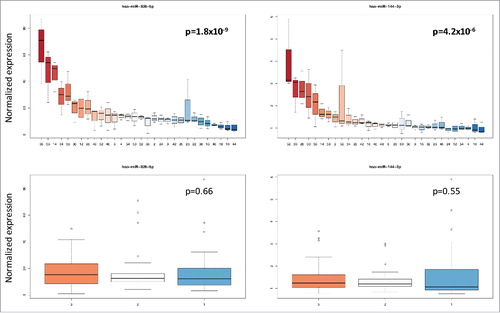
Figure 5. Box-plots for miR-6740–5p and miR-7847–3p showing the variance of both miRNAs between the 30 individuals and the 3 time points. The different individuals (upper part of the figure) and the different time points (lower part of the figure) are referred to by numbers on the X axis. The variation of intensity values is given on the y-axis. The variation of both miRNA was significant for the storage time but not significant between the individuals.
miRNAs with divergent abundance between different sample groups
For studies that last for one or even more decades, it is no uncommon that sample collection routines and serum/sample pre-processing are modified over time. Respective alterations potentially impact the patterns of molecular markers and it is of importance to test for according dependencies. The sampling of the Janus Serum Bank was divided in five different categories based on sampling year and sample preprocessing protocols. ANOVA of these highlighted significant results: most significant was the previously mentioned miR-328–5p (p-value of 3.7 × 10⁻¹⁸) followed by miR-150–3p (p-value of 1.4 × 10⁻¹²). Since the miRNAs are potentially affected by inter-individual variations or in by the sampling procedures we filtered all miRNAs that are (1) significantly affected by inter-individual, (2) age related, (3) storage length related, or (4) related to different sampling procedures. In addition to the miRNAs mentioned in the previous section the latter step removed further 169 miRNAs. In sum, starting from a set of 528 miRNAs that were detected in the serum samples we end with a set of 135 miRNAs (25.6%). These are also included in Supplemental Table 1.
Differences in miRNA features
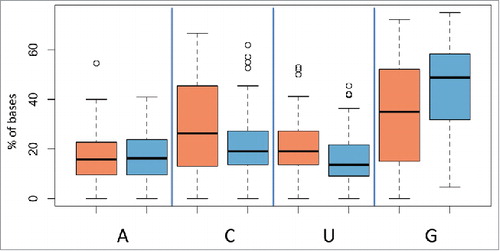
Both, biologic- as well as technical variations potentially add to the overall variability in miRNA measurements. Previously, we observed that among other factors the base composition, i.e., the content of A, C U and G substantially influences the signal intensities.Citation23 We thus investigated the sequence features of the miRNAs that were variable between individuals and the miRNAs that were variable due to time of storage. Specifically, we correlated sequence features to each of both groups and observed a surprisingly high and statistically significant difference in the base composition of the two groups. By far the largest effects were calculated for the guanine content of miRNAs. The group of miRNAs with variations only between individuals but not between time points contained 45% guanine bases while the other group contained only 35% guanines (p = 7.6 × 10⁻⁶). The miRNAs that differed between time points but not between individuals were significantly enriched for cytosine and uracil (). Astonishingly, this bias was observed across all miRNAs independent of the their absolute expression intensity.
Figure 6. Box-plots showing the percentage of bases for miRNAs that varied significantly between individuals indicated in blue and miRNAs that varied significantly between storage times indicated in red. The nature of the nucleotides is indicated on the X axis with reference to the basis adenine, cytosine, uracil, and guanine and the percentage of the nucleotides on the Y-axis.
The differences in base composition between both groups also lead to shifts in miRNA motifs. We determine the most over- and under-represented 4-nucleotide miRNA motifs in both groups. The three most over-represented motifs of miRNAs that were significant for the times of storage included “CCCA” (27% versus 9%), “UCCC” (26% vs. 7%) and “CCCC” (30% vs. 7%). Vice versa, the most over-represented motifs in the group of miRNAs significant for the individuals were “GGGG” (20% vs. 47%), “GGAG” (25% vs. 48%) and “GCGG” (9% vs. 26%). By applying miEAACitation24 for identifying pathways that are regulated differentially between both groups of miRNAs we did not obtain significant results.
Discussion
In the present study, we investigated the variation of miRNA abundances over longer life spans between different healthy individuals. For all factors that we investigated, the storage time, the life span, the different individuals and the different collection techniques we observed significant variations. While a certain variability in miRNA expression usually renders a miRNA interesting (e.g., variability between healthy controls and diseased patients), a “perfect” biomarker should be stable in an unaffected population over a time span and be rather independent of different collection techniques. Our results suggest the presence of 135 least affected miRNAs in serum samples of control individuals collected in a population based study in Norway.
To facilitate the discovery of biomarkers, especially in the light of long follow up times, serum collections that have been carefully build up over years or even decades are required. Respective sera collections that have been frequently maintained over years but were of limited use for molecules with a short half life even when stored under low temperature conditions. MiRNAs have, however, not only a relatively in vivo but also a high ex vivo stability.Citation25 Tapping into the resources of sera collections for miRNAs biomarker analysis opens a great option for extended retro perspective studies. To properly use this resource, it is mandatory to have a clear idea to what extent the miRNA in sera are effected by long-term storage.
The majority of the miRNA studies that analyzed human sera, did not specifically acknowledge the long-term storage effects on miRNAs in human sera. Using samples from the Janus Serum Bank, we provided first evidence that serum based miRNA profiles were generally stable over several years and that a developing cancer might be detectable years before diagnosis through a specific miRNA signature.Citation26 A recent study by Rounge et al. also based on serum from the Janus Serum Bank, confirmed that miRNAs are present and stable in archived samples frozen at −25°C for at least 40 y. While the long-time storage did not reduce miRNA yields the preanalytical conditions like different clotting times had a significant effect on miRNA abundances.Citation27 Further evidence for the stability of miRNAs in stored samples came from a real-time PCR analysis that was performed on a panel of 8 miRNAs from samples that were stored for 12 months at −80 °C.Citation28
Independent of the influence of the duration of the storage it is important to address the difference between various collection protocols. Although the majority of the protocols is on collections of sera, there is a multitude of variations including scenarios that required the collection of plasma or of whole blood, which is later used for serum or plasma isolation, scenarios that largely vary in terms of storage duration and storage temperature of either blood, serum or plasma, and protocols that vary in terms of the methods used for RNA isolation. Finally, the reports vary in terms of the time and temperature at which the isolated RNA is stored. Overall, the variations between the protocols complicates the comparison and the evaluations of miRNAs as biomarkers.Citation20
Beside the impact of storage duration, our study identified miRNAs that have been affected by the age of the blood donors. Previous reports also indicated the influence of age on the miRNA abundance in human blood including our own study that reported several miRNAs that were correlated with age whereas sex was less of a confounding factor.Citation21 We developed a web-based application to allow testing of miRNAs for their likelihood of being influenced by confounding factors (http://www.ccb.uni-saarland.de/mirnacon). Recently, a study by RT-qPCR on 155 plasma miRNAs indicated that circulating miRNAs cannot only be affected by age, but also by BMI and sex.Citation29
The present study set-up allowed to analyze 3 consecutive time points of each individual with the blood samples collected over 10 y with narrow variations between the time intervals. The study set-up also ensures that the individuals did not develop cancer during this time. Nevertheless, the study design has obvious disadvantages. The total cohort size with 30 individuals is comparably small, especially when sub-groups are considered (e.g., males only, or “young” individuals only). Furthermore, the very long collection time over many decades necessarily entrails differences in the sample collection protocols. Considering these influences we, however, think that the abundance of miRNAs in the respective samples largely reflects the original expression of miRNAs even after longer storage times.
Additionally, other factors that are unknown, e.g., diseases that have gone undetected in the respective individuals, may blur our results. Taking this into account, we assume that the stable markers identified in this study carry information as biomarker if they are found to be altered in cancer patients. We can, however, not rule out that the variable of dynamic miRNAs can also be due to undiscovered pathogenic processes.
In the light of the above-mentioned advantages and disadvantages we conclude that the abundance of miRNAs in serum can be influenced by the storage time, the sampling procedure and the age of the blood donor. Respective miRNAs that are not affected from one of the evaluated factors may represent promising candidates in biomarker development, especially in cancer research, with a potential for translation into clinical care. To properly judge the diagnostic value the substantial number of miRNA candidates that have been implicated in various diseases, it is of upmost importance to know the normal variation of miRNAs in healthy individuals at different time points.
Methods
Study Samples
Samples were selected from the Janus Serum Bank, which is a population-based cancer research biobank containing prediagnostic biospecimens from 318,628 Norwegians.Citation30 Samples were collected from health examination surveys in Norway (HE) and from Red Cross Blood donors (RCBD) in Oslo region during 1972–2004. The samples were stored in freezers at −25°C. The samples were collected in gel vials, or in 10-mL tubes containing either 5 mg sodium iodoacetate or no additives. After coagulation and centrifugation at room temperature, the samples were shipped cold (+1°C; +10°C) to a central facility and frozen within days. Few samples were lyophilized and have been rehydrated before use. Clotting time was 1 hour for the HE samples and varied between 14 hours and 28 hours for the RCBD samples. Based on the above-mentioned protocol variations, the samples were assigned to five sampling categories; 1) HE samples with iodoactetate added collected in 1972–1978, 2) HE samples with no additives collected 1979–1986, 3) HE samples in separating gel tubes collected 1987–2004, 4) RCBD samples with no additives collected 1973–1979, 5) RCBD samples with no additives collected in 1980–1991.
RNA extraction, quality control and miRNA profiling
Total RNA including miRNAs was isolated using the miRNeasy Serum/Plasma Kit (Qiagen, Hilden, Germany). In detail, 100 µl serum was mixed with 100 µl RNase-free water and 1ml Qiazol lysis solution and incubated for 5 min at room temperature. After addition of 200 µl chloroform, the samples were vigorously shaken for 15s and centrifuged at 12,000 rpm and 4°C for 15 min. The aqueous phase was transferred into an empty tube and mixed with 3 µl glycogen solution (20 mg/ml) to facilitate RNA precipitation. Subsequently, the samples were transferred into the QIAcube instrument and RNA was isolated automatically according to the manufacturers protocol. RNA concentration was measured using NanoDrop2000 (Thermo Fisher Scientific, Waltham, MA, USA) and RNA quality was measured in a bioanalyzer run using the SmallRNA Chip (Agilent Technologies, Santa Clara, CA, USA). The miRNA expression profiles were measured using the SurePrint G3 8 × 60k miRNA microarray (miRBase version 21, Cat. no. G4872A) containing probes for detection of 2,549 mature human miRNAs and the miRNA Complete Labeling and Hyb Kit (Cat. No. 5190–0456) according to the manufacturers recommendations. Briefly, 100 ng total RNA including miRNA for each sample was dephosphorylated for 30 min at 37 °C using calf intestinal phosphatase, denatured for 10 min at 100 °C using 100% dimethyl sulfoxide (DMSO) and subsequently labeled with Cy3-pCp for 2 h at 16 °C using T4 ligase. The labeled RNA for each sample was hybridized to the microarray for 20 h at 55 °C with 20 rpm rotation in the SureHyb chambers (Agilent). After two washing steps, the arrays were dried and scanned using the Agilent Microarray Scanner G2565BA (Agilent Technologies, Santa Clara, CA, USA) with 3 µm resolution in double-pass mode. Resulting TIF-files were analyzed with the Agilent AGW Feature Extraction software (version 10.10.11, Agilent Technologies). All raw data and normalized microarray data are available in the gene expression omnibusCitation31,Citation32 (GEO) under reference GSE100768.
Computational analysis
Profiles were investigated using the freely available programming environment R. miRNAs in serum samples were considered to be detected according to the "gIsGeneDetected” flag provided by the manufacturers software. To include a miRNA in the study we required positive signals in at least 10 different samples. Following exclusion of the low abundant miRNAs, microarray measurements were normalized using quantile normalization (preprocess Core package). Clustering has been performed using the Heatplus package. As distance measure the Euclidian distance was used. Analysis of variance (ANOVA) was performed using the aov function. To consider variability in the context of the mean expression we calculated the coefficient of variation, the quotient of standard deviation and average value for each mina on a non-logarithmic scale.
Supp_table_1_Sources_to_variability_in_circulating_human_miRNA_signatures.xlsx
Download MS Excel (29.4 KB)References
- Lee RC, Feinbaum RL, Ambros V. The C. elegans heterochronic gene lin-4 encodes small RNAs with antisense complementarity to lin-14. Cell. 1993;75(5):843–54.
- Ambros, V.microRNAs: tiny regulators with great potential. Cell. 2001;107(7):823–6. doi:10.1016/S0092-8674(01)00616-X.
- Leidinger, P., Backes C, Deutscher S, Schmitt K, Mueller SC, Frese K, Haas J, Ruprecht K, Paul F, Stähler C, et al., A blood based 12-miRNA signature of Alzheimer disease patients. Genome Biol. 2013;14(7):R78. doi:10.1186/gb-2013-14-7-r78.
- Keller A, Leidinger P, Borries A, Wendschlag A, Wucherpfennig F, Scheffler M, Huwer H, Lenhof HP, Meese E. miRNAs in lung cancer – studying complex fingerprints in patient's blood cells by microarray experiments. BMC Cancer. 2009;9:353. doi:10.1186/1471-2407-9-353.
- Leidinger P, Brefort T, Backes C, Krapp M, Galata V, Beier M, Kohlhaas J, Huwer H, Meese E, Keller A. High-throughput qRT-PCR validation of blood microRNAs in non-small cell lung cancer. Oncotarget. 2016;7(4):4611–23. doi:10.18632/oncotarget.6566.
- Sierzega M, Kaczor M, Kolodziejczyk P, Kulig J, Sanak M, Richter P. Evaluation of serum microRNA biomarkers for gastric cancer based on blood and tissue pools profiling: the importance of miR-21 and miR-331. Br J Cancer. 2017;117(2):266–273. doi:10.1038/bjc.2017.190.
- Qu K, Zhang X, Lin T, Liu T, Wang Z, Liu S, Zhou L, Wei J, Chang H, Li K, et al. Circulating miRNA-21-5p as a diagnostic biomarker for pancreatic cancer: evidence from comprehensive miRNA expression profiling analysis and clinical validation. Sci Rep. 2017;7(1):1692. doi:10.1038/s41598-017-01904-z.
- Xing W, Zeng C. A novel serum microRNA-based identification and classification biomarker of human glioma. Tumour Biol. 2017;39(5):1010428317705339. doi:10.1177/1010428317705339
- Ames H, Halushka MK, Rodriguez FJ. miRNA Regulation in Gliomas: Usual Suspects in Glial Tumorigenesis and Evolving Clinical Applications. J Neuropathol Exp Neurol. 2017;76(4):246–254. doi:10.1093/jnen/nlx005.
- Keller A, Leidinger P, Bauer A, Elsharawy A, Haas J, Backes C, Wendschlag A, Giese N, Tjaden C, Ott K, et al. Toward the blood-borne miRNome of human diseases. Nat Methods. 2011;8(10):841–3. doi:10.1038/nmeth.1682.
- Mestdagh P, Hartmann N, Baeriswyl L, Andreasen D, Bernard N, Chen C, Cheo D, D'Andrade P, DeMayo M, Dennis L, et al. Evaluation of quantitative miRNA expression platforms in the microRNA quality control (miRQC) study. Nat Methods. 2014;11(8):809–15. doi:10.1038/nmeth.3014.
- Keller A, Meese E. Can circulating miRNAs live up to the promise of being minimal invasive biomarkers in clinical settings? Wiley Interdiscip Rev RNA. 2016;7(2):148–56.
- Backes C, Meese E, Keller A. Specific miRNA Disease Biomarkers in Blood, Serum and Plasma: Challenges and Prospects. Mol Diagn Ther. 2016;20(6):509–518. doi:10.1007/s40291-016-0221-4.
- Witwer KW, Halushka MK. Toward the promise of microRNAs – Enhancing reproducibility and rigor in microRNA research. RNA Biol. 2016;13(11):1103–1116. doi:10.1080/15476286.2016.1236172.
- Keller A, Leidinger P, Vogel B, Backes C, ElSharawy A, Galata V, Mueller SC, Marquart S, Schrauder MG, Strick R et al. miRNAs can be generally associated with human pathologies as exemplified for miR-144. BMC Med. 2014;12:224. doi:10.1186/s12916-014-0224-0.
- Halushka MK. MicroRNA-144 is unlikely to play a role in bronchiolitis obliterans syndrome. J Heart Lung Transplant. 2016;35(4):543. doi:10.1016/j.healun.2016.01.008.
- Kent OA, McCall MN, Cornish TC, Halushka MK. Lessons from miR-143/145: the importance of cell-type localization of miRNAs. Nucleic Acids Res. 2014;42(12):7528–38. doi:10.1093/nar/gku461.
- Ludwig N, Leidinger P, Becker K, Backes C, Fehlmann T, Pallasch C, Rheinheimer S, Meder B, Stähler C, Meese E, et al. Distribution of miRNA expression across human tissues. Nucleic Acids Res. 2016;44(8):3865–77. doi:10.1093/nar/gkw116.
- Schwarz EC, Backes C, Knörck A, Ludwig N, Leidinger P, Hoxha C, Schwär G, Grossmann T, Müller SC, Hart M, et al. Deep characterization of blood cell miRNomes by NGS. Cell Mol Life Sci. 2016;73(16):3169–81. doi:10.1007/s00018-016-2154-9.
- Moldovan L, Batte KE, Trgovcich J, Wisler J, Marsh CB, Piper M. Methodological challenges in utilizing miRNAs as circulating biomarkers. J Cell Mol Med. 2014;18(3):371–90. doi:10.1111/jcmm.12236.
- Meder B, Backes C, Haas J, Leidinger P, Stähler C, Großmann T, Vogel B, Frese K, Giannitsis E, Katus HA, et al. Influence of the confounding factors age and sex on microRNA profiles from peripheral blood. Clin Chem. 2014;60(9):1200–8. doi:10.1373/clinchem.2014.224238.
- Boon RA, Iekushi K, Lechner S, Seeger T, Fischer A, Heydt S, Kaluza D, Tréguer K, Carmona G, Bonauer A, et al. MicroRNA-34a regulates cardiac ageing and function. Nature. 2013;495(7439):107–10. doi:10.1038/nature11919.
- Backes C, Sedaghat-Hamedani F, Frese K, Hart M, Ludwig N, Meder B, Meese E, Keller A. Bias in High-Throughput Analysis of miRNAs and Implications for Biomarker Studies. Anal Chem. 2016;88(4):2088–95. doi:10.1021/acs.analchem.5b03376.
- Backes C, Khaleeq QT, Meese E, Keller A. miEAA: microRNA enrichment analysis and annotation. Nucleic Acids Res. 2016;44(W1):W110–W116. doi:10.1093/nar/gkw345
- Backes C, Leidinger P, Altmann G, Wuerstle M, Meder B, Galata V, Mueller SC, Sickert D, Stähler C, Meese E, et al. Influence of next-generation sequencing and storage conditions on miRNA patterns generated from PAXgene blood. Anal Chem. 2015;87(17):8910–6. doi:10.1021/acs.analchem.5b02043.
- Keller A, Leidinger P, Gislefoss R, Haugen A, Langseth H, Staehler P, Lenhof HP, Meese E. Stable serum miRNA profiles as potential tool for non-invasive lung cancer diagnosis. RNA Biol. 2011;8(3):506–16. doi:10.4161/rna.8.3.14994.
- Rounge TB, Rounge TB, Lauritzen M, Langseth H, Enerly E, Lyle R, Gislefoss RE. microRNA Biomarker Discovery and High-Throughput DNA Sequencing Are Possible Using Long-term Archived Serum Samples. Cancer Epidemiol Biomarkers Prev. 2015;24(9):1381–7. doi:10.1158/1055-9965.EPI-15-0289.
- Balzano F, Balzano F, Deiana M, Dei Giudici S, Oggiano A, Baralla A, Pasella S, Mannu A, Pescatori M, Porcu B, Fanciulli G, et al. miRNA Stability in Frozen Plasma Samples. Molecules. 2015;20(10):19030–40. doi:10.3390/molecules201019030.
- Ameling S, Kacprowski T, Chilukoti RK, Malsch C, Liebscher V, Suhre K, Pietzner M, Friedrich N, Homuth G, Hammer E, et al. Associations of circulating plasma microRNAs with age, body mass index and sex in a population-based study. BMC Med Genomics. 2015;8:61. doi:10.1186/s12920-015-0136-7.
- Langseth H, et al. Cohort Profile: The Janus Serum Bank Cohort in Norway. Int J Epidemiol. 2016;46(2):403–404g. doi:10.1093/ije/dyw027.
- Edgar R, Domrachev M, Lash AE. Gene Expression Omnibus: NCBI gene expression and hybridization array data repository. Nucleic Acids Res. 2002;30(1):207–10. doi:10.1093/nar/30.1.207.
- Barrett T, Wilhite SE, Ledoux P, Evangelista C, Kim IF, Tomashevsky M, Marshall KA, Phillippy KH, Sherman PM, Holko M, et al. NCBI GEO: archive for functional genomics data sets–update. Nucleic Acids Res. 2013;41( Database issue):D991–5. doi:10.1093/nar/gks1193.