
 ?Mathematical formulae have been encoded as MathML and are displayed in this HTML version using MathJax in order to improve their display. Uncheck the box to turn MathJax off. This feature requires Javascript. Click on a formula to zoom.
ABSTRACT
The two major steps of gene expression are transcription and translation. While hundreds of studies regarding the effect of sequence features on the translation elongation process have been published, very few connect sequence features to the transcription elongation rate. We suggest, for the first time, that short transcript sub-sequences have a typical effect on RNA polymerase (RNAP) speed: we show that nucleotide 5-mers tend to have typical RNAP speed (or transcription rate), which is consistent along different parts of genes and among different groups of genes with high correlation. We also demonstrate that relative RNAP speed correlates with mRNA levels of endogenous and heterologous genes. Furthermore, we show that the estimated transcription and translation elongation rates correlate in endogenous genes. Finally, we demonstrate that our results are consistent for different high resolution experimental measurements of RNAP densities. These results suggest for the first time that transcription elongation is partly encoded in the transcript, affected by the codon-usage, and optimized by evolution with a significant effect on gene expression and organismal fitness.
Introduction
The first major step of gene expression is the process of transcribing a stretch of DNA to its corresponding RNA molecule. The transcription process can be performed simultaneously by many RNA polymerase (RNAP) complexes (RNAP II in this case), and is initiated by the binding of an RNAP to the DNA template of a gene – the 3′ end of the gene's complement strand. The RNAP advances through the DNA template synthesizing the RNA nascent transcript; when the RNAP reaches the end of the DNA template, the RNA transcript is released and the RNAP unbinds from the DNA.Citation1
Gene expression regulation was traditionally associated with features of the promoter and untranslated regions (UTRs). However, recent emerging evidence show that various signals related to all gene expression regulation stages (including transcription and its kinetics) also appear in the coding sequence itself via its biophysical interaction with the other segments of the transcript.Citation2-Citation5 For instance, an implied sequence-mediated relation between codon-usage bias (CUB) and the transcription process suggests that protein encoding genes from organisms with a high metabolic rate tend to include more Adenine-ending codons, and also tend to have higher Adenine content in their introns than those from organisms with a low metabolic rate, due to the fact that higher Adenine frequency in the DNA sequence contributes to faster transcription elongation.Citation6 Another claim promotes the idea that selection on CUB plays a role at both the transcriptional and translational level in order to synergistically optimize the efficiency of gene expression.Citation7,Citation8 However, none of these studies were based on direct large scale measurements of transcription elongation speed.
In recent years, there has been a sharp increase in high throughout experimental methods addressing this challenge. A pioneering study by Churchman and Weissman described a novel approach called Native Elongating Transcript sequencing (NET-seq), designed for capturing RNAP density over the genome of Saccharomyces cerevisiae, with a single nucleotide resolution.Citation9 Additional methods use various run-on techniques, such as GRO/PRO-seqCitation10,Citation11 and BioGROCitation12 that uses tiling arrays.
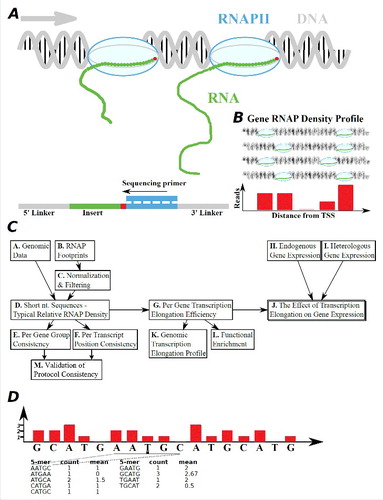
A summary of the NET-seq protocol can be seen in . In brief, it ‘freezes’ transcription and then pull down the RNAPs with the nascent RNA transcripts attached to them. Next, the RNAPs are removed and the nascent transcripts go through a sequencing process that results in short reads, ending with the last nucleotide that was transcribed. Following, these reads are mapped to the reference genome and pinpoint the location or density of the RNAPs with a single nucleotide resolution; see the Methods section and also Churchman and Weissman.Citation9 This study presented an aggregated global RNAP density profile for a selected group of genes, which indicate a peak downstream to the transcription start site (TSS) followed by a gradual descent. It also showed a certain sequence motif, which tends to appear at positions with very high RNAP densities, referred to as pauses. Yet, the general and continuous triple relation between RNAP density (an estimation of the transcription elongation rate), the underlying DNA sequence, and the possible causal effects of transcription elongation on organismal fitness and intracellular functions has not been studied. Furthermore, although RNAP pauses might be the main rate limiting step in transcription elongation,Citation13 pause-free RNAP elongation velocities at saturating concentrations of NTPs have been estimated (in single-molecule experiments) to vary in the range of 15–23 bp/s.Citation14-Citation16 This variance has never been explained and in this study we aimed at explaining it.
Figure 1. A schematic framework of this work. (A) Illustration of a NET-seq method for the estimation of RNAP elongation rates.Citation9 After freezing and cutting the exposed DNA, the RNAP is immunoprecipitated. Next, the RNAP is removed and the transcript, which holds the last nucleotide that was transcribed just before the freezing, gets sequenced. (B) All the reads that end with the last nucleotide that was transcribed are aligned back to the genome, quantifying the number of reads per nucleotide. (C) A flow diagram of this study (see details in the main text). We analyzed the experimental data (i.e. the RNAP density reads) together with the known gene annotations and genomic data. The reads were normalized by the average read of each gene. We learnt 5-mers from different groups of genes and regions within genes in order to demonstrate consistency. We performed comparison with additional run-on protocol measurements,Citation24 in order to demonstrate consistency. Several possible factors were controlled for, such as mRNA levels, GC content, folding energy etc. Finally, we suggest that the transcription elongation rate is related to expression levels, and so we study the profiles of transcription elongation and the relation between gene function and elongation. (D) The 5-mer density score is defined as the mean normalized density of the 5-mer's middle nucleotide over all the 5-mer occurrences. For instance, considering only one gene and its normalized gene profile as shown, the 5-mer AATGC would have a density score of 1; similarly, the 5-mer GCATG would have a density score of 2.67.
An additional and ‘analogous’ technology, related to translation instead of transcription, was developed by Ingolia et al.Citation17 This technology, based on deep sequencing of ribosome-protected mRNA fragments and by measuring ribosomal density at a nucleotide resolution, opened a window to understanding the translation process that was previously unavailable. Many recent studies showed the relations between the features of the mRNA sequence and ribosome density reads.Citation17-Citation23 However, a similar relation between the DNA sequence and RNAP density reads has not been found yet, mostly due to lack of relevant high-resolution data related to transcription elongation.
In this work we focus on the elongation phase of the transcription process in the model organism S. cerevisiae, aiming at understanding how it is encoded in the transcript, affects its gene expression, and contributes to organismal fitness. We suggest, for the first time, that short transcript sub-sequences have a typical effect on the RNAP speed.
Results
The main objective of the study is to model and understand how transcription elongation is partially encoded in the DNA; we specifically suggest that the RNAP elongation speed is affected by the composition of short nucleotide sub-sequences. To this end, we develop a method for estimating the relative RNAP density/speed on different 5 nucleotides k-mer (or 5-mer) and the elongation rate of transcripts. We show that this measure is meaningful, correlate with gene expression measurements, and can be used for modeling and understating gene expression and its evolution; see details of choosing the 5-mer in Supplementary Note S1 and Fig. S9.
An illustration of the work flow appears in : based on genomic data and RNAP densities NET-seq measurements taken from Churchman and Weissman,Citation9 we assign for each short DNA motif of 5-mer (Boxes A-C) a score according to the estimated strength of its effect on the elongation phase of the transcription process (Box D). We show that this property is consistent in different groups of genes (Box E), along different gene locations (Box F), and when using additional run-on protocol (PRO-seq; Box M). Following, we use this score to define the mean typical transcription elongation rate of genes (MTTR; Box G), and show that it significantly correlates with endogenous mRNA levels (Boxes H-J). We validate our hypothesis regarding the possible relation between transcription elongation and expression levels on two heterologous gene libraries (Boxes I-J), where all variants have identical promoters. Finally, we study the effect of general genomic properties on transcription elongation, such as the relative elongation rates of different gene groups and gene regions (Boxes K-L).
The RNAP typical densities over nucleotide 5-mers cannot be explained by GC content and DNA folding alone
In order to study the relation between RNAP density reads and the underlying DNA sequence, we first normalized each transcript to control for the different transcription initiation rates. Next, we assigned each nucleotide read density to its surrounding k-mer context; thus, for each 5-mer occurrence we attributed the normalized density read of the middle nucleotide. Following, we normalized the values related to each nucleotide 5-mer, over all its various occurrences (see illustration in and more details the Methods section). We also filtered out locations with pauses (i.e. exceptionally high amount of reads) and locations without any reads at all (see more details in the Methods section); nonetheless, most of our reported results are robust to these filters (see e.g., the 5-mer ranking in Table S1).
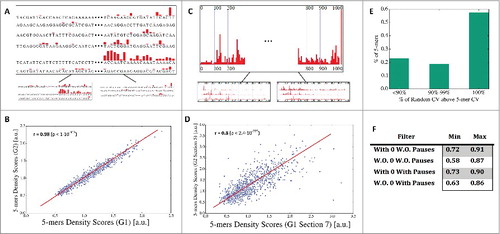
First, in order to demonstrate that nucleotide k-mers tend to have typical RNAP density, we compared for each 5-mer the coefficient of variation (CV) of all its occurrences to a randomized ‘null models’: 1,000 sets with the same number of read count values and GC content that were picked at random from all available transcripts (3rd random model; see details in the Methods section). We found that most of the 5-mers (741 out of 1024) have significantly lower CV values compared to the null models, and only 26 out of the 1024 5-mers have a CV higher than random (see and also in Supplementary Note S3). These results support our conjecture that the k-mers indeed have a typical transcription elongation rate that is encoded in the nucleotide composition, and that the differences among the k-mer density scores are not due to variability/noise in the data.
Figure 2. 5-mers density scores consistent between genes and along genes. (A) Illustration of the first validation test: we split the set of genes into two groups, computed for each group all the 5-mers density scores, and checked the 2 group's ranked correlation. (B) The plot of the median correlation (out of 100 repeats) for the case of no zeros-no pauses. (C) Illustration of the second test: we split the set of genes into two groups. We computed all the 5-mers density scores for the first ten 100nt sections in each group of genes, and then checked all the ranked correlation between any two sections from different groups. (D) The plot of the median correlation (out of 100 repeats) for the case of no zeros-no pauses (occurred for section 7 in the first group and section 5 in the second). (E) The frequency of 5-mers with coefficient of variation (CV) that is lower than random. ∼79% have their CV below over 90% of the random model. (F) Sections consistency check: The minimum and maximum Spearman correlation between any two sets of 5-mers learnt from two different groups of genes and from different parts of the genes.
Next, we aimed at studying the relation between fundamental biophysical features of the k-mers such as their GC content and local DNA folding energy (FE), as well as the potential effect of these features on relative k-mer RNAP densities and transcription elongation. Specifically, the goal was to verify whether these simple features are sufficient to explain the distribution of RNAP densities among the different 5-mers. We found that the 5-mer GC score has a very low Spearman correlation with the 5-mer density score (r = 0.097, p<1.8·10−3; see the Methods section). The RNAP density box-plots for each of the six possible 5-mer GC score values show a slight increase of the 5-mer density scores (average and median) as the 5-mer GC score increases (Fig. S1A). However, we did not find a significant correlation between 5-mer density scores and 5-mer local FE scores (r<0.01, p = 0.97; see Fig. S1B and the Methods section). Thus, only 0.01% of the variability of the 5-mer density scores can be explained by local FE or GC content. This result suggests that the effect of nucleotide k-mers on transcription elongation rate cannot be explained by simple features such as GC content and/or folding strength alone; among others, it may be related to ‘complex’ biochemical interactions between the k-mers and the RNAP, the rest of the DNA sequence, nucleosomes, the pre-mRNA, and with additional transcription factors.
The ranking of 5-mers according to their typical RNAP density is consistent along genes and between genes
The purpose of this subsection is to confirm that the k-mer ranking is consistent, not gene or position specific, and robust. If this is true, we should get similar results when using only subsets of the original genes or when performing the k-mer ranking based only on a certain region within the genes.
To show this, we used two randomization processes that arbitrarily separated all the genes into two groups of genes, separately computed the RNAP density scores of 5-mers obtained from each group, and compared these scores. Specifically, we split the genes into two equally sized non-overlapping/disjoint groups at random (1st random model shown in and described in the Methods section), and from different parts within genes (using intervals of 100nt long; 2nd random model shown in and described in the Methods section). The analysis shown in demonstrate that there is a high Spearman correlation (r>0.95; p<10−324) between the 5-mers density scores learnt from the two different genes groups, even when controlling for GC scores. In addition, we also found a strong correlation between the 5-mers density scores learnt from different sections of the genes (e.g., the first 100 nucleotides close to the TSS in all genes, the second interval 101–200nt from the TSS in all genes, etc.). As shown in , the Spearman correlations (controlling for GC scores and mRNA 5-mers) between density scores of 5-mers from 10 different intervals of genes (each of 100nt long) are larger than 0.58 (the median correlation is 0.8); see also summary in . Results remain consistent (r>0.97; p<10−324) while excluding paralog group genes, i.e. considering only one gene per paralog group, and when separately learning from highly and lowly expressed genes (r>0.94, p<10−324; see details in Supplementary Note S2).
The consistent correlation between different sections of 100 nucleotides each, rules out the possibility that all the results are related only to nucleosome effects, as they occupy about 140 nucleotides and the first 4 nucleotides tend to be placed at specific locations,Citation9 and therefore the affinity for the nucleosome is different between sections (see Fig. S2). These results support the conjecture that the different 5-mers of nucleotides consistently affect RNAP density and that the direction and strength of the effect is consistent among different gene groups and gene regions and thus partially encoded in the DNA sequence.
The reported consistency signals cannot be trivially explained based on sequencing bias
The purpose of this subsection is to demonstrate that when performing the k-mer density scoring process on mRNA-seq data originating from the NET-seq experiment we do not get the same results, suggesting that the k-mer ranking based on the NET-seq experiment cannot be trivially explained by sequencing biases. Accordingly, if we do get high correlation between the two k-mer scores generated based on mRNA-seq or NET-seq, it may suggests that the observed signal is related to various experimental and/or sequencing biases.
To this end, we analyze mRNA-seq information that was used for the NET-seq RNAP read countCitation9 in the same manner as of the RNAP reads (the fragmented mature mRNA has the same size distribution as the nascent RNA). The Spearman correlation between RNAP density scores and mRNA-seq density scores was very low (r<0.1; p<6.3·10−3) and the reported partial correlation when controlling for the mRNA-seq read densities are similar. These results support the conjecture that the NET-seq inferred k-mer RNAP densities are mainly related to biological phenomena and not to various experimental and/or sequencing biases.
Comparative analysis shows consistent 5-mers ranking between high resolution methods used for studying transcription elongation
Since we've found that the DNA sequence affects RNAP speed, and in order to validate our results and further demonstrate the robustness of the observed/reported relations, it is important to analyze additional datasets that provide a high resolution RNAP elongation data. Such an analysis would potentially unveil possible NET-seq biases or artifacts affecting the results.
To this end, we used recently published Precision Run-On sequencing (PRO-seq) data for S. cerevisiae, taken from Booth et al.Citation24; see more details in the Methods section. Comparison of the mRNA levels from the two experiments (PRO-seq protocol paper vs. the NET-seq protocol paper) over the entire S. cerevisiae genome showed high resemblance (r = 0.75; p = 7.18·10−188); a similar comparison based on the average RNAP read count over all genes showed a lower but significant association (r = 0.3; p = 1.43·10−23). This result can be explained by the numerous differences between the two protocols.Citation24-Citation26 Next, we calculated the PRO-seq 5-mers density scores and compared their ranking with the one obtained for NET-seq; see details in Table S1. The correlation was 0.29 (p = 1.04·10−20), suggesting a consistency of the 5-mer ranking between the two datasets, which is the level of the correlation between these two protocols.
RNAP densities and estimated transcription elongation rates significantly correlate with mRNA levels and codon decoding rates in endogenous genes
Following, we suggest, for the first time, a transcription elongation rate score named the Mean Typical Transcription elongation Rate (MTTR). The MTTR score, designed to estimate the average transcription elongation rate of a specific gene (in a specific species), is computed per gene based on the geometric mean of all its reciprocals k-mer scores, learnt from an RNAP density experiment; see the Methods and previous sections. Thus, for a certain organism with RNAP density data, this score can be computed for all known genes. Accordingly, we first found high consistency between NET-seq and PRO-seq MTTR scores (r = 0.78, p = 8.82·10−75; see , Fig. S13, and Table S2). Next, we observed that genes with relatively high average NET-seq RNAP density have a correlation of 0.19 (p = 4.4·10−10; top 25% average density levels) with MTTR. This correlation may be related to selective pressure for higher elongation cycles in genes that “consume” more RNAP for optimizing/maximizing the RNAP pool and thus the global transcription rate.
Figure 3. MTTR vs. Expression Levels. (A) Scatter plot of per gene NET-seq MTTR and PRO-seq MTTR compared for 1076 genes with the highest average RNAP density in both datasets. (B) Scatter plot of per gene average measured RNAP density and mRNA levels. (C) Scatter plot of per gene MTTR and mRNA levels. (D) Scatter plot of per gene MTTR and MTDR. (E) Schematic description of the reporter approach for studying splicing mediated gene expression regulation: Intron insertion cassettes were constructed in-vitro, each comprised of a selection marker (URA3), a constitutive promoter, the first 195 YFP coding nucleotides (nt), and one of 240 native S. cerevisiae introns followed by an additional 600 YFP coding nt. Each insertion cassette was transformed into the genome of a master strain, which contained a promoter-less YFP gene, and so creating an in-vivo intron-reporter yeast library (YiFP). Culture growth and YFP expression levels of each variant in the library were monitored using a micro-plate reader.Citation29 (F) YFP library used to study the effect of the transcript on transcription efficiency and mRNA levels. We analyzed a library in which the last 14 nucleotides of the 5′ UTR were randomized, but did not change the codons of the analyzed gene and YFP.Citation27 (G) A scatter plot of computed MTTR vs. Expression levels. Spearman correlation between MTTR and expression levels is displayed inside the plot. (H) MTTR plotted against mRNA levels of 5′UTR HRSVgb04 variants.
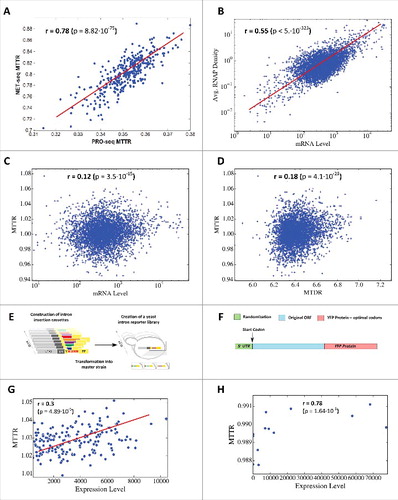
If the transcription elongation rate affects the overall transcription rate, we expect to see a correlation between mRNA levels and MTTR; thus, we aimed at evaluating the relative effect of transcription initiation and elongation rates on mRNA levels via correlating NET-seq MTTR and RNAP densities with mRNA levels. The Spearman correlation between mRNA levels of endogenous and average measured RNAP density (which is expected to be mainly related to transcription initiation) is 0.5 or 0.55, when controlling for the GC of the genes (p<10−64 in both cases). The Spearman correlation (controlling for gene GC content or RNAP density) between the NET-seq MTTR and mRNA levels is very significant (r = 0.12; p = 1.7·10−15), but lower than mRNA levels vs. average measured RNAP density (see ). This implies that genes with lower relative 5-mers density scores (i.e. higher transcription elongation rate) tend to have higher mRNA levels.
In order to further support the claim above and show that the relation cannot be explained by simple features of the sequence (e.g., GC content), we calculated the NET-seq/PRO-seq k-mer density scores for 1,000 randomized transcriptomes generated by shuffling of each gene's nucleotides (3rd random model; see Methods). Analysis found that the correlation between the actual 5-mer scores and the randomized versions was lower than 0.59 (median = 0.56; i.e. less than 31% of the variance of the actual 5-mer score can be explained by the randomized variant). Next, we calculated for each randomized transcriptome its MTTR scores and compared them with the actual MTTR results; the correlation between the actual MTTR and the randomized MTTR was found to be lower than 0.72 (median = 0.69; i.e. less than 48% of the variance of the MTTR score can be explained by the randomized variant). Finally, analysis demonstrated that all the correlations of the randomized MTTR vs. mRNA levels were lower than the actual value (NET-seq: actual = 0.262 vs. random median = 0.186, PRO-seq: actual = 0.268 vs. random median = 0.178; empirical p<1·10−3, see Fig. S12A). Results remain consistent when using 1,000 randomized transcriptomes that preserve the ORF's CUB (4th random model; see Methods). We note that the measured density depends strongly on the transcription initiation rate, but our computed RNAP density relates only to the elongation rate. Thus, our results support the conjecture that elongation and not initiation alone have a certain contribution to transcription rates and the organismal fitness, as well as associates with them.
It was previously shown that different codons tend to have typical (and different) codon decoding rates, which tend to affect translation elongation rates in vivo.Citation2,Citation27,Citation28 Thus, one fundamental question is related to the possible relation between transcription and elongation rates, or whether CUB tends to affect both transcription and translation elongation in a correlative manner. To examine this, we correlated the estimated MTTR values with the estimated codon Mean Typical Decoding Rates (MTDR) of the S. cerevisiae genesCitation18 and found it to be significant (r = 0.18, p = 4.1·10−29; correlation of r = 0.34, p<10−39 for highly expressed genes; see ).
Finally, we show that DNA folding, GC content, or the distribution of nucleotide pairs cannot solely explain the observed correlations reported in this section: first, we found that the partial correlation between MTTR and mRNA levels given GC content and folding energy, i.e. r(MTTR, mRNA | GC, FE), is 0.059 (p<2·10−4); the correlation between MTTR and MTDR given GC and folding energy, i.e. r(MTTR, MTDR | GC, FE), is 0.43 (p<10−183). In addition, we performed dinucleotide randomizations that preserve the frequency distribution of adjacent pairs of nucleotides (in addition to GC content; see the 5th random model in Methods). Analysis demonstrated that all the correlations between randomized MTTR vs. mRNA levels were lower than the actual value (actual = 0.287 vs. random median = 0.170 for NET-seq; empirical p<1·10−3, see Fig. S12B).
The RNAP density score over introns and UTRs correlates with expression levels in synthetic libraries
In order to demonstrate the direct effect of transcription elongation on mRNA levels, we need to control for factors such as the transcription initiation rates, which vary among different endogenous genes and have strong effect on the transcription rate. One possible experimental way to control for transcription initiation is via the study of synthetic libraries, composed of variants with identical promoters (and thus identical or similar transcription initiation rates); in this sub-section we report the analysis of two such libraries.
At the first step, we re-analyze the measured expression levels taken from Yofe et al.Citation29 and related to 240 YFP based variants transformed in S. cerevisiae. Each variant contains the same promoter, the first 195 YFP coding nucleotides, a different native yeast intron, and the remaining 600 YFP coding nucleotides. Accordingly, the variants differ only by the use of different yeast intron (see illustration in ), which is expected to be removed from the pre-mRNA before the translation stage. Thus, the differences in YFP levels in this library are partially related to differences in transcription elongation of the introns and splicing efficiencies.
We found that the spearman correlation between the measured expression level and our computed MTTR is 0.3 with p = 4.9·10−5 (see ). The average expression level of the variants with top 10% MTTR score (which has mean MTTR of 1.04) is 5,490 compared to 2,534, which is the average expression level of the variants with lowest 10% MTTR score (which has mean MTTR of 1.01; Wilcoxon rank-sum test with p<2.7·10−4). These results roughly suggest that an increase of 1.023 fold in MTTR is related to an increase of 2.17 fold in mRNA levels (when the initiation rate is not affected).
Additionally, we performed an analysis that also controls the transcription initiation rate, aiming at estimating the relation between transcription elongation rates (measured by MTTR) and mRNA levels in a controlled experiment. For that purpose, we have used the mRNA levels of different variants of the gene HRSVgb04 from a synthetic library, which was adapted to S. cerevisiae by Ben-Yehezkel et al.Citation27. All variants share the same promoter and coding region and hence, presumably, have the same initiation rate. The library contains 13 variants of the 5′UTR (each of them is 14nt long; see ). We have computed the MTTR of each variant (using 5-mer density scores learned from RNAP profile experiment). The Spearman correlation between MTTR and mRNA levels in the library (see ) is 0.78 (p = 1.6·10−3). The correlation when controlling for the transcripts GC content is 0.76 (p<3.6·10−3).
Evidence supporting the conjecture that there is selection for decreased elongation rate at the beginning of transcripts
The new transcription elongation rate measure developed here enables studying for the first time not only the MTTR of genes, but also the profile of transcription elongation speed along transcripts. Ergo, we studied the mean genomic profile of MTTR over non-coding parts of the genes (which are not considered to be under selective pressure related to the properties of the encoded protein).
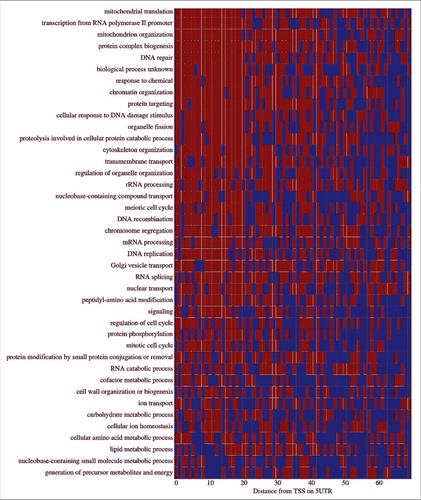
To this end, we generated a genomic profiles of transcription elongation speed based on the 5-mer typical NET-seq RNAP densities; see details in the Methods section. Interestingly, we found that at the first 16 nucleotide of the non-coding part of the transcript the speed tends to be lower than afterwards. Specifically, as can be seen in , the elongation speed increases monotonically at the beginning of transcripts and is lower than the elongation speed at the end of transcripts. Furthermore, and as can be seen , this relation holds for many gene functions supporting the conjecture that this feature may be under selection to improve the organismal fitness.
Figure 4. Transcription elongation speed profile in S. cerevisiae. (A) Transcription elongation speed profile of 5′UTRs where all genes were aligned to the TSS. (B) Transcription elongation speed profile of 3′UTRs where all genes were aligned to the TTS (Transcription Termination Site). Percentiles of 1,000 random genomes are in green (5%) and orange (50%).
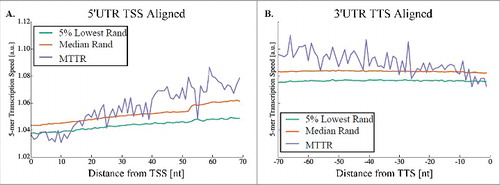
Figure 5. Transcription elongation profile for different GO slim categories. The red color means that the profile at that position is below the median random profile; otherwise the color blue is used. In all the mean MTTR of the first 15 nucleotides is lower than the mean MTTR of nt 16–70.
Functionality of genes with efficient transcription elongation
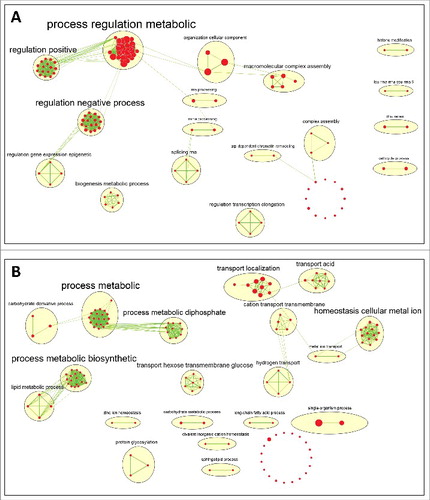
Lastly, we aimed at finding the functional gene group with top (and low) transcription elongation rates. To this end we performed functional enrichment of the genes based on their MTTR; see more details in the Methods section and Eden et al.Citation30 There are 191 biological process GO terms enriched with a p-value lower than 10−3 for genes with higher transcription elongation rate and 160 for genes with lower transcription elongation rate. We used the Enrichment Map Cytoscape plugin in order to deal with the high number of enriched terms.Citation31 The enriched GO terms are represented as nodes in a network where edges connect any two terms with a relatively high gene overlap (see Methods section for details). Similar connected nodes were clustered together and were named following the most frequent words from the terms description. We found that genes that relate to biological processes such as transport tend to have high transcription elongation rates and regulation of metabolic process tend to have low transcription elongation rates (see , Supplementary Data file, and Fig. S4-S5).
Figure 6. Enrichment map of GO terms. The enriched GO terms (red circles – their size is proportionate to the number of genes associated with this GO term) are grouped together in clusters based on their similarity. The cluster name (the font size represents the number of GO terms enriched in the cluster) is a function of the word frequency in the description of the corresponding GO terms. (A) Enrichment map for genes ordered by ascending MTTR order, which is related to genes with low transcription elongation rate. (B) Enrichment map for genes ordered by descending MTTR order, which is related to genes with high transcription elongation rate.
Discussion
In this work, we performed for the first time a large scale transcription elongation study in a model organism. Our analyses suggest that transcription elongation rate is partially encoded in the composition of short nucleotide sub-sequences of the gene DNA sequence, and provide the first quantification of this relation. The reported results also suggest that not only initiation but also the elongation phase has significant effect on transcription, gene expression, organismal fitness, and the evolution of transcripts.
Although our results quantify the relation between the RNAP density reads and the underlying DNA sequence, we still do not fully understand the mechanisms behind the elongation process. We have ruled out several simple factors, such as folding energy and GC content, which could explain the causes for high density reads. Therefore, it is possible that some of the reported signals are due to complex interactions (and not a single factor) between DNA nucleotide k-mers and the RNAP, and/or pre-mRNA and/or other transcription factors, and/or the nucleosomes, etc. Accordingly, our analysis calls for additional set of experiments for deciphering the biophysical mechanisms by which transcription elongation rate is encoded in the DNA. Specifically, the effective RNA-DNA surface interaction length (i.e. the length that is relevant to its movement) is currently unknown and non-trivial to measure; the length and the location of this surface may help explaining some of the patterns reported here.
As was demonstrated, different nucleotide k-mers tend to have typical effect on transcription elongation speed, which can be used for inferring the elongation rates of all endogenous and synthetic genes in organisms with measured RNAP densities. This can be done even if there are RNAP density measurements for part of the organism's genome, or when considering only highly/lowly expressed genes. Moreover, the correlation between the MTTR score of the two studied protocols (i.e. NET-seq and PRO-seq) is high, suggesting that our method is robust and gives consistent results even when using different protocol. This method can therefore be used to develop novel models of transcript evolution, which consider the effect of mutations on organismal fitness, and for improving our understanding of the evolutionary constraints affecting different properties in various transcript regions; see, for example.Citation6,Citation8,Citation32,Citation33 The data related to typical transcription elongation rate can also be integrated to biophysical models of transcription,Citation34,Citation35 and to machine learning modelsCitation36 aiming at predicting various aspects of gene expression.
Interestingly, we have found that there is a positive correlation between the estimations of the transcription-elongation (i.e. MTTR) and translation-elongation rates (i.e. MTDR), and vice versa. We have also shown that different k-mers of nucleotides tend to have typical transcription elongation rate. Thus, by definition, changing the codon composition of a gene (i.e. CUB) affects its nucleotide k-mer composition and thus its transcription elongation rate. This relation may also suggest that there is co-evolution of the transcription-elongation and the translation-elongation processes through the sequence level. This coupling, we conjecture, may possibly leads to more efficient gene expression due to similar codon effects on the elongation rates of both transcription and translation. This result also highlights the non-modularity aspects affecting the way gene expression is encoded in the transcript, and emphasizes the challenges in understanding the relations between codon-usage, gene expression, and organismal fitness.Citation2,Citation37
One important result reported in this study is related to the correlation between transcription elongation estimation (i.e. MTTR) and mRNA levels. It is important to emphasize that there are two major (not mutually exclusive) mechanisms that can explain the correlation between MTTR and mRNA levels of endogenous genes: 1) It is possible that a higher transcription elongation rate (i.e. higher MTTR) directly affects transcription rate and thus mRNA levels; thus, highly expressed genes have higher mRNA levels partially since they have higher MTTR. 2) A less direct possible mechanism may be related to the fact that highly expressed genes consume more RNAPs, since they have higher initiation rates. For that reason, they undergo stronger sequence selection for higher transcription elongation rates to improve transcription efficiency through increasing the pool of free RNAP, and increase global transcription initiation rates; a similar idea was suggested in the case of translation.Citation21,Citation38 The fact that there is significant correlation between MTTR and RNAP density supports the conjecture that the second explanation is at least partially relevant. However, the fact that a positive correlation between MTTR and expression levels was observed in the case of the synthetic librariesCitation27,Citation29 supports the conjecture that elongation affects the transcription rate and mRNA levels in a direct causal way. In addition, the reported correlation between MTTR and expression levels in synthetic libraries demonstrates that estimation of transcription elongation rates can and should be used for gene expression optimization of heterologous genes for various biotechnological objectives. Specifically, we suggest that manipulating the nucleotide composition of the entire transcript (and not only the promoter) can have an effect of a few hundred percentages on expression levels due to their effect on transcription elongation.
It is important to emphasize that this study is based on estimating the typical transcription elongation speed of all the k-mers and not in relatively rare transcription pauses. In practice, the effect of a single k-mer on the overall typical elongation rate of a gene is naturally expected to be relatively small. Thus, similarity to the case of CUB based indexes,Citation18,Citation39–Citation41 we compared the MTTR score of the entire transcripts to expression measurements from synthetic systems.Citation27,Citation29 Our analyses of the synthetic libraries show positive correlation between MTTR and expression levels (see the examples in ); these results support the conjecture that transcription-elongation affects the transcription rate and mRNA levels in a direct causal way.
Rivetingly, we found that the transcription elongation at the beginning of transcripts tend to be lower than afterwards. This result suggests that the profile of transcription elongation and not only the average elongation rate is important for the organismal fitness and is analogous to a similar result observed in the case of translation elongation.Citation21 Various explanations were suggested in the case of slower translation elongation at the 5′end of coding regions, many of them might be also relevant here. For example, it was suggested that this feature improves the allocation of ribosomes via decreasing the number of traffic jams and thus improving the number of available ribosomes.Citation21,Citation38 Similar arguments can be applied in the case of RNAP allocation. Additionally it was suggested that this feature is related to timing the recruitment of chaperons,Citation2,Citation22 and analogous explanations may be related to recruitment and/or stabilization of transcription elongation factors. This feature may also be related to lack of selection against transcription errors (that may be more abundant when the elongation speed is lower as was suggested in the case of translation,Citation2 which may be less deleterious at the 5′end of transcripts.
This research was done solely on protein coding genes, which are known to be transcribed by the RNAP II and thus are related to the analyzed protocols.Citation9,Citation24 It would be interesting for future research to repeat this analysis for other types of RNA polymerase (e.g., RNAP III), and using the relevant protocol.
Finally, the data (ribosome and RNAP density reads) that were used to generate our results (as is the case with any next generation sequencing based data) may suffer from an experimental bias (e.g., early unimodal shape; see Fig. S6). Nevertheless, our results hold even after ignoring the first 200 nucleotides that contain the suspicious peak. In addition, we controlled for GC content and we show that the results cannot be obtained via the analyses of mRNA-seq data instead of RNAP related reads; hence, they are not trivially related to biases or to the sequencing process.
Conclusions
Our results demonstrate that transcription elongation information is partly encoded in the DNA sequence and is affected by the composition of short DNA sub-sequences that appear in the transcript. Thus, our analyses suggest that codon usage should also be associated to transcription elongation: changing a codon to a different one affects not only translation but also transcription. In addition, using a novel measure of transcription elongation we were able to show that transcription elongation significantly affects gene expression and organismal fitness; while the effect of transcription initiation is stronger, elongation does has an effect.
These novel methods and results described here have important ramification to many biomedical disciplines including functional genomics, systems biology, molecular evolution, and biotechnology. They should enable developing more accurate models related to fundamental phenomena and objectives in these fields.
Materials and methods
Data sources
Gene reference genome and annotations were downloaded from NCBI (08/05/2009). We used the UTR annotations published by Xu et al.Citation42 Levels of mRNA were based on Ingolia et al.Citation17 Nucleosome positions were based on a nucleosome map created by Brogaard et al.Citation43 Ribosome densities were based on two different studies.Citation17,Citation44 The mean of typical decoding rate (MTDR) scores are based on Dana & Tuller.Citation18
We used nascent RNA reads related to RNA polymerase densities (i.e. NET-seq) that were measured by Churchman and Weissman in the model system of S. cerevisiae, with mRNA-seq data of fragmented mature mRNA of size distribution similar to that of the nascent RNA was also used.Citation9 In addition, we used recently published PRO-seq (Precision Run-On sequencing) data for S. cerevisiae, taken from Booth et al.Citation24 To this end, all the files containing the processed/aligned read count (RC) information were downloaded from the Gene Expression Omnibus database (GEO; accession numbers GSE25107 and GSE76142, respectively). The RCs of each gene were divided by the average RC (of that gene) in order to control for different transcription initiation rates; we will refer to them hereafter as NRCs (Normalized RCs). Specifically, we used the WT NET-seq and WT PRO-seq files (respectively), as well as the WT mRNA-seq information. For NET-Seq (or PRO-seq, respectively) the raw RNA fragments of at least 18 (or 15) nucleotides were remapped to the yeast reference genome allowing three (or two) mismatches and only unique alignments were considered. The mapping was done using BowtieCitation45; this version enforces a quality-aware alignment policy by default and with the following parameters: “-n 2 -l 28 -e 70”; see more details in the relevant GEO accession page. For instance, The NET-seq Alignments to genomic regions represented 27%–42% of the total reads, an approximately 100-fold enrichment for nascent RNA (assuming that the nascent RNA constitutes 0.34% of the total RNA in the yeast cell).Citation9
The NET-Seq and PRO-seq datasets contains many locations without any RC information; this raises the question whether it is related to low coverage, noise/biases due to problems in the experiment, no transcription, or maybe other reasons. Therefore, when we computed the typical k-mer density scores we normalized the sum of NRCs (per k-mer) by the k-mer non-zero occurrence (i.e. zero-density reads were filtered out); for NET-seq, we also filtered out exceptionally high-density reads (or pauses; see definition in the next subsection), which are not in the focus of this work. Yet, results were very much the same, when using and without using this normalization method; see Table S1.
We used the mRNA levels of variants of a heterologous gene (HRSVgb04), adapted to S. cerevisiae, generated by Ben-Yehezkel et al.Citation27 Briefly, they analyzed the gene HRSVgp04 and generated 3 libraries differentiated by nucleotide composition in three different regions: 5′ UTR, the first 40 codons (after the start codon), and the 40 codons after them. The general composition of each library included the same promoter followed by a 5′ UTR (14 nucleotides), a start codon, 240 nucleotides (the first 80 codons from HRSVgb04) and an optimal codon YFP reporter (483 nucleotides). The first library randomized the 14 nucleotides in the 5′ UTR. The second library had synonymous nucleotide substitutions in the first 40 codons of the open reading frame (ORF); only the third nucleotide of codons 2–41 of the HRSVgp04 ORF were modified, maintaining the encoded protein and the nucleotide composition outside this region. The third library had synonymous nucleotide substitutions in codons 42–81 of the ORF; again, only the third nucleotide of codons 42–81 of the HRSVgp04 ORF were modified, maintaining the encoded protein and the nucleotide composition outside this region. The three libraries include a total of 207/151/25 variants, and were named L5UTR, L2-41C, L42-81C, respectively. The mRNA levels of 16/6/13 variants were measured and were used in our analysis. For more details see.Citation27
We used mRNA levels of S. cerevisiae YFP variants taken from Yofe et al.Citation29 Each variant contains a promoter, the first 195 YFP coding nucleotides, a native yeast intron, and the remaining 60 YFP coding nucleotides. The variants differ only by the use of the yeast introns (see ). In this library, some variants had very low expression, which means that probably splicing did not occur. We filtered out those un-spliced variants,Citation29 which yielded 178 variants.
Pauses
Transcription pauses are positions in the gene in which the RNAP spends an exceptionally long period of time and they are usually related to various transcription regulatory mechanisms. Possible evidence of a pause can be an exceptionally high RNAP read at that position. As such, locations with high amount of NRCs are usually defined as 3 standard deviations above the mean of the surrounding 200 nucleotides with no pause.Citation9,Citation26
We report a transcription pause to be the nucleotide position of an RNAP read, which is higher than six standard deviations above the mean of the 99% lowest reads of a particular gene – a slightly different calculation of the pause; nevertheless, both computations yield similar results (see Fig. S8A and Note S4).
Algorithms and tools
We filtered out genes that do not have any of the following data: RNAP density reads, UTR coordinates, or mRNA levels. We were left with 4,232 genes. To ensure there are no biases due to different gene length, we further filtered the data to 1023 genes with length greater or equal to 1,000nt, and median read count greater than zero (see Fig. S7).
Learning of the k-mer density scores
Let ardg
be the average read density of gene g. Let dg
(k) be the sum of density reads of the middle nucleotide of k-mer k in all its occurrences in gene g. Let cS
(k) be the total number of occurrences of k-mer k in all the genes in gene set S. Thus, the density score of k-mer k in gene set S, , is then computed using (1).
We normalize by the ardg to control for the unknown initiation rate of that gene which is expected to affect uniformly all the positions in the gene.
The score variance can be computed using (2).
The GC score for a k-mer is defines as the counting the number of the G/C nucleotides in this k-mer. GC content is the GC score divided by the k-mer length.
Aggregate RNAP density profile
We aligned all the genes to their TSS and averaged the densities of all the genes at each position. See typical features of the global density profile in Supplementary Note S5.
Lags
Density score with a lag L means relating the density score of a nearby (L nt upstream/downstream to the current position depends on l’s sign) k-mer to each k-mer.
DNA folding prediction
We computed the local DNA folding energy profile of each gene in overlapping windows of 40 nucleotides. For each such window we used a tool to compute the free energy – Vienna RNAFold with a set of parameters adapted to DNA chains.Citation46 The energy score of each 5-mer is the average of all the windows that contain this 5-mer.
5-mers distribution
We focus our analysis on 5-mers and not on longer k-mers since longer k-mers may not be found in some or all subsets of the genes. Shorter k-mers contain less information hence they are less preferable. There are 1024 (45) different 5-mers. The histograms in Fig. S9 describe the log-normal like distribution of the number of occurrences of 5-mers across all the genes, and the NRC per k-mers for k = 5, 6, and 7. See further details in Supplementary Notes S1/S4.
Analysis of the PRO-seq dataset
The PRO-seq RNAP information was downloaded from Booth et al.Citation24 and matched to the NET-seq data. Initially, a comparison of the average mRNA-seq levels obtained from the NET-seq and PRO-seq studies was done over the entire S. cerevisiae genome (r = 0.75; p = 7.18·10−188). Next, a similar comparison was performed, based on the NRC information, showing a much lower association (r = 0.3; p = 1.43·10−23). Therefore, we carefully analyzed the NET-seq and PRO-seq NRC profiles, in order to locate the position that maximizes the mean/median correlation of these profiles; this was done at a single nucleotide resolution and separately for each gene over the entire genome; the profile information can be found in Supplementary Data file SD2. We found that the highest correlation between the gene's NRC profiles is found when a two nucleotide upstream lag is done on the PRO-seq dataset (see previous sections and Fig. S3). We used this result to calculate the PRO-seq k-mers density scores, based on this lag. Specifically, when we compared the 5-mer density scores ranking of the PRO-seq with the one obtained for NET-seq we found the Spearman correlation to be 0.29 (p = 1.04·10−20); this suggests a consistency of the k-mer ranking between the two datasets, which is the level of the correlation previously found between the two protocols. See also 5-mer ranking comparison in Table S1.
The mean typical transcription elongation rate (MTTR)
The gene transcription elongation rate (i.e. the Mean Typical Transcription elongation Rate; MTTR) is computed using a geometric mean of the reciprocals of all its k-mers density scores of a specific gene. Accordingly, different gene (with other sequence) will naturally have different set of k-mers and therefore a different MTTR score; as such, it also controls for the length of the gene transcribed.
This metric was chosen to use geometric mean due to its higher sensitivity to lower/higher values in comparison to regular average measures, such as the arithmetic mean. It is based on the hypothesis that very slow k-mers should have relatively high effect on the total elongation rate. This averaging method is quite common, and is widely used in the field.Citation18,Citation39,Citation40 Nonetheless, the measure is robust and changing to arithmetic mean gives similar results, e.g., the Spearman correlation between arithmetic and geometrical MTTR is for NET-seq is 0.97.
Transcription elongation rate profile
We aligned the 5′ UTRs of most of the yeast genes (4171 genes with UTR length > 4) to the transcription start site. At each position (i) we averaged the reciprocal 5-mer density score of all the genes with a UTR longer than i+4.
Where gi is the group of all genes with a UTR longer than i+4, dig is the density score of the ith 5-mer of gene g.
Randomization null models
In order to support our claims we used various randomization models in this work (our ‘null hypothesis’ models, based on the S. cerevisiae reference genome), with up to N = 1,000 randomization generated in each model. Specifically, they were designed to preserve key elements of the original set such as NRC distribution, GC content, CUB, intronic and UTR properties, etc. Hereafter, we describe the randomized models used:
This model allows us to test the Spearman rank correlation between 5-mers density scores learnt from two equally sized non-overlapping/disjoint groups of genes. To this end, we randomly split the set of genes into two equally sized subgroups and for each subgroup compute all the 5-mers density scores.
This model allows us to test the Spearman rank correlation between 5-mers density scores learnt from different sections of the genes. To this end, we look only at the first 1,000 nucleotides of each gene (starting from the TSS) divided into ten 100nt long sections. Specifically, randomly split the set of genes into two equally sized groups; for each group of genes we compute all the 5-mer density scores per section. Next, we compute the Spearman rank correlation between the 5-mer density scores of each section of the first group to the scores of the other group.
Transcripts were randomized by shuffling each gene's nucleotide positions for 1,000 times; this randomization maintains the transcript length, read count distribution and GC content of each gene, but creates a new sets of k-mer distributions.
Genes were randomized for 1,000 times as following: Non-coding regions were randomized by a shuffle procedure, while coding regions (i.e. ORFs) retained the CUB of each gene. This randomization maintains the ORF length, codon-usage, and the GC content of each gene.
In order to show that the reported selection signal is not related to naturally occurring biases due to neighboring codon frequencies, we used a model that preserves both the amino acid order and content, and the frequency distribution of 16 possible pairs of adjacent nucleotides (i.e. dinucleotides) for each sequence separately. Specifically, we used the algorithm proposed by Zhang et al.,Citation47 which is based on a multivariate Boltzmann sampling scheme; see more details in Goz & Tuller.Citation48
The nucleotide shuffling (described in models 3, 4, and 5) is done after the reads are mapped, aligned to the yeast reference genome, and normalized to control for the different transcription initiation rates (per gene). Therefore, for each nucleotide there is matching NRC information. In the process of randomization, nucleotides independently change position in each gene, including their corresponding NRC; this maintains the NRC distribution and the GC content of each gene, but creates different distribution of k-mers in this gene (or any other gene for that matter).
empirical p-value level was determined based on a comparison between the randomized models and the actual one as follows, when we expect the real to be significantly lower than the randomized: Let be the value of the actual intronome and
a vector containing N random values sampled from the randomized models, where
is the value of the
sample; then
. When we expect the real to be significantly higher than the randomized version, the p-valued was computed as follows:
.
Correlation and significance level evaluation
In this work the Spearman's rank correlation coefficient is regularly used. It was chosen (instead of the Pearson correlation) due to its ability to evaluate monotonic relations, which are not necessarily linear in nature. The correlations reported here are based on thousands of points/genes and on noisy/biased data. For such cases it is usually very difficult to get correlation values that are higher than 0.5-0.6; for instance, a typical correlation between expression levels measurements of the same condition in different labs is around 0.5.
In addition, there are potentially between dozens to thousands relevant factors in this type of research and usually a good model should include dozens of relevant variables. Thus, a correlation of ∼0.4 (like some of the correlations reported here) means that ∼16% (i.e. 0.4^2) of the variance in one variable can be potentially explained by the second variable and this is practically very high and helpful for model development. Indeed many important studies published in recent years have reported absolute correlation values of 0.3-0.6 in many biological systems (for example,Citation7,Citation18,Citation24,Citation32,Citation49-Citation55).
MTTR GO enrichment and enrichment map
We used the GOrilla enrichment tool on the list of genes ordered by ascending and descending MTTR order.Citation30
Enrichment Map Cytoscape Plugin is a graphical tool for summarizing large number of enriched terms.Citation31 The enrichment data is represented as a network. Nodes in the network represent gene-sets (i.e. GO terms) and edges represent mutual overlap (i.e. genes) between two sets; a network clustering method named markov cluster algorithm is used to group highly redundant gene-sets.Citation56 Each cluster is then gets its name from the most frequent words of the description of the gene-sets in this cluster using word cloud tool.Citation57 There are two parameters that determine which nodes will appear and are based on the GO terms' p-value and FDR q-value (we used 0.005 for both). Another parameter controls whether two nodes will be connected with an edge based on the magnitude of gene overlap between the two nodes, we used Jaccard score of 0.4.
Competing interests
No potential conflicts of interest were disclosed.
Supplementary_Information_A_code_for_transcription_elongation_speed.pdf
Download PDF (1.9 MB)Suppl_mat_A_Code_for_Transcription_Elongation_Speed.zip
Download Zip (6 MB)Suppl_Table1_A_Code_for_Transcription_Elongation_Speed.xlsx
Download MS Excel (131.8 KB)suppl_table_A_Code_for_Transcription_Elongation_Speed.xlsx
Download MS Excel (221.2 KB)Acknowledgements
This study was supported in part by a fellowship from the Edmond J. Safra Center for Bioinformatics at Tel-Aviv University.
Related Research Data
References
- Alberts B, Johnson A, Lewis J, Morgan D, Raff M, Roberts K, Walter P. Molecular biology of the cell. (6th Edition). New York (NY) and Abingdon: Garland Science; 2015.
- Tuller T, Zur H. Multiple roles of the coding sequence 5′ end in gene expression regulation. Nucleic Acids Res. 2015;43:13–28. doi:10.1093/nar/gku1313.
- Naftelberg S, Schor IE, Ast G, Kornblihtt AR. Regulation of alternative splicing through coupling with transcription and chromatin structure. Ann Rev. Biochem. 2015;84:165–98. doi:10.1146/annurev-biochem-060614-034242.
- Bentley DL. Coupling mRNA processing with transcription in time and space. Nat Rev Genet. 2014;15:163–75. doi:10.1038/nrg3662.
- Stergachis AB, Haugen E, Shafer A, Fu W, Vernot B, Reynolds A, Raubitschek A, Ziegler S, LeProust EM, Akey JM, et al. Exonic transcription factor binding directs codon choice and affects protein evolution. Science. 2013;342:1367–72. doi:10.1126/science.1243490.
- Xia X. Maximizing transcription efficiency causes codon usage bias. Genetics. 1996;144:1309–20.
- Trotta E. Selection on codon bias in yeast: A transcriptional hypothesis. Nucleic Acids Res. 2013;41:9382–95. doi:10.1093/nar/gkt740.
- Trotta E. The 3-base periodicity and codon usage of coding sequences are correlated with gene expression at the level of transcription elongation. PLoS ONE. 2011;6:1–11. doi:10.1371/journal.pone.0021590.
- Churchman LS, Weissman JS. Nascent transcript sequencing visualizes transcription at nucleotide resolution. Nature. 2011;469:368–73. doi:10.1038/nature09652.
- Kwak H, Fuda NJ, Core LJ, Lis JT. Precise Maps of RNA polymerase reveal how promoters direct initiation and pausing. Science. 2013;339:950–3. doi:10.1126/science.1229386.
- Core LJ, Waterfall JJ, Lis JT. Nascent RNA sequencing reveals widespread pausing and divergent initiation at human promoters. Science. 2008;322:1845–8. doi:10.1126/science.1162228.
- Jordán-Pla A, Gupta I, de Miguel-Jiménez L, Steinmetz LM, Chávez S, Pelechano V, Pérez-Ortín JE. Chromatin-dependent regulation of RNA polymerases II and III activity throughout the transcription cycle. Nucleic Acids Res. 2015;43:787–802. doi:10.1093/nar/gku1349.
- Dangkulwanich M, Ishibashi T, Bintu L, Bustamante C. Molecular mechanisms of transcription through single-molecule experiments. Chem Rev. 2014;114:3203–23. doi:10.1021/cr400730x.
- Zamft B, Bintu L, Ishibashi T, Bustamante C. Nascent RNA structure modulates the transcriptional dynamics of RNA polymerases. Proc Natl Acad Sci. 2012;109:8948–53. doi:10.1073/pnas.1205063109.
- Hodges C, Bintu L, Lubkowska L, Kashlev M, Bustamante C. Nucleosomal fluctuations govern the transcription dynamics of RNA polymerase II. Science. 2009;325:626–8. doi:10.1126/science.1172926.
- Galburt EA, Grill SW, Wiedmann A, Lubkowska L, Choy J, Nogales E, Kashlev M, Bustamante C. Backtracking determines the force sensitivity of RNAP II in a factor-dependent manner. Nature. 2007;446:820–3. doi:10.1038/nature05701.
- Ingolia NT, Ghaemmaghami S, Newman JRS, Weissman JS. Genome-wide analysis in vivo of translation with nucleotide resolution using ribosome profiling. Science. 2009;324:218–23. doi:10.1126/science.1168978.
- Dana A, Tuller T. The effect of tRNA levels on decoding times of mRNA codons. Nucleic Acids Res. 2014:9171–81.
- Frenkel-Morgenstern M, Danon T, Christian T, Igarashi T, Cohen L, Hou Y-M, Jensen LJ. Genes adopt non-optimal codon usage to generate cell cycle-dependent oscillations in protein levels. Mol Syst Biol. 2012;8:572–81. doi:10.1038/msb.2012.3.
- Stadler M, Fire A. Wobble base-pairing slows in vivo translation elongation in metazoans. RNA. 2011;17:2063–73. doi:10.1261/rna.02890211.
- Tuller T, Carmi A, Vestsigian K, Navon S, Dorfan Y, Zaborske J, Pan T, Dahan O, Furman I, Pilpel Y. An evolutionarily conserved mechanism for controlling the efficiency of protein translation. Cell. 2010;141:344–54. doi:10.1016/j.cell.2010.03.031.
- Fredrick K, Ibba M. How the sequence of a gene can tune its translation. Cell. 2010;141:227–9. doi:10.1016/j.cell.2010.03.033.
- Arava Y, Boas FE, Brown PO, Herschlag D. Dissecting eukaryotic translation and its control by ribosome density mapping. Nucleic Acids Res. 2005;33:2421–32. doi:10.1093/nar/gki331.
- Booth GT, Wang IX, Cheung VG, Lis JT. Divergence of a conserved elongation factor and transcription regulation in budding and fission yeast. Genome Res. 2016;26:799–811. doi:10.1101/gr.204578.116.
- Mahat DB, Kwak H, Booth GT, Jonkers IH, Danko CG, Patel RK, Waters CT, Munson K, Core LJ, Lis JT. Base-pair-resolution genome-wide mapping of active RNA polymerases using precision nuclear run-on (PRO-seq). Nat Protoc. 2016;11:1455–76. doi:10.1038/nprot.2016.086.
- Churchman LS, Weissman JS. Native elongating transcript sequencing (NET-seq). Curr Protoc Mol Biol. 2012; 98:II:4.14:14.4.1–14.4.17.
- Ben-Yehezkel T, Atar S, Zur H, Diament A, Goz E, Marx T, Cohen R, Dana A, Feldman A, Shapiro E, et al. Rationally designed, heterologous S. cerevisiae transcripts expose novel expression determinants. RNA Biology. 2015;12:972–84. doi:10.1080/15476286.2015.1071762.
- Gardin J, Yeasmin R, Yurovsky A, Cai Y, Skiena S, Futcher B. Measurement of average decoding rates of the 61 sense codons in vivo. eLife. 2014;3:1–20. doi:10.7554/eLife.03735.
- Yofe I, Zafrir Z, Blau R, Schuldiner M, Tuller T, Shapiro E, Ben-Yehezkel T. Accurate, model-based tuning of synthetic gene expression using introns in S. cerevisiae. PLoS Genet. 2014;10:1–10. doi:10.1371/journal.pgen.1004407.
- Eden E, Navon R, Steinfeld I, Lipson D, Yakhini Z. GOrilla: A tool for discovery and visualization of enriched GO terms in ranked gene lists. BMC Bioinf. 2009;10:48. doi:10.1186/1471-2105-10-48.
- Merico D, Isserlin R, Stueker O, Emili A, Bader GD. Enrichment map: A network-based method for gene-set enrichment visualization and interpretation. PLoS ONE. 2010;5:1–12. doi:10.1371/journal.pone.0013984.
- Tuller T, Ruppin E, Kupiec M. Properties of untranslated regions of the S. cerevisiae genome. BMC Genomics. 2009;10:391. doi:10.1186/1471-2164-10-391.
- Haddrill PR, Charlesworth B, Halligan DL, Andolfatto P. Patterns of intron sequence evolution in Drosophila are dependent upon length and GC content. Genome Biol. 2005;6:R67. doi:10.1186/gb-2005-6-8-r67.
- Edri S, Gazit E, Cohen E, Tuller T. The RNA polymerase flow model of gene transcription. IEEE Trans Biomed Circuits Syst. 2014;8:54–64. doi:10.1109/TBCAS.2013.2290063.
- Tripathi T, Chowdhury D. Interacting RNA polymerase motors on a DNA track: Effects of traffic congestion and intrinsic noise on RNA synthesis. Phys Rev E. 2008;77:1–11. doi:10.1103/PhysRevE.77.011921.
- Vogel C, de Sousa Abreu R, Ko D, Le SY, Shapiro BA, Burns SC, Sandhu D, Boutz DR, Marcotte EM, Penalva LO. Sequence signatures and mRNA concentration can explain two-thirds of protein abundance variation in a human cell line. Mol Syst Biol. 2010;6:1–9. doi:10.1038/msb.2010.59.
- Quax TEF, Claassens NJ, Söll D, van der Oost J. Codon bias as a means to fine-tune gene expression. Mol Cell. 2015;59:149–61. doi:10.1016/j.molcel.2015.05.035.
- Raveh A, Margaliot M, Sontag ED, Tuller T. A model for competition for ribosomes in the cell. J R Soc Interface. 2016;13:1–17. doi:10.1098/rsif.2015.1062.
- dos Reis M, Savva R, Wernisch L. Solving the riddle of codon usage preferences: A test for translational selection. Nucleic Acids Res. 2004;32:5036–44. doi:10.1093/nar/gkh834.
- Sharp PM, Li WH. The codon adaptation index-a measure of directional synonymous codon usage bias, and its potential applications. Nucleic Acids Res. 1987;15:1281–95. doi:10.1093/nar/15.3.1281.
- Ikemura T. Correlation between the abundance of Escherichia coli transfer RNAs and the occurrence of the respective codons in its protein genes: A proposal for a synonymous codon choice that is optimal for the E. coli translational system. J Mol Biol. 1981;151:389–409. doi:10.1016/0022-2836(81)90003-6.
- Xu Z, Wei W, Gagneur J, Perocchi F, Clauder-Munster S, Camblong J, Guffanti E, Stutz F, Huber W, Steinmetz LM. Bidirectional promoters generate pervasive transcription in yeast. Nature. 2009;457:1033–7. doi:10.1038/nature07728.
- Brogaard K, Xi L, Wang J-P, Widom J. A map of nucleosome positions in yeast at base-pair resolution. Nature. 2012;486:496–501.
- Brar GA, Yassour M, Friedman N, Regev A, Ingolia NT, Weissman JS. High-resolution view of the yeast meiotic program revealed by ribosome profiling. Science. 2012;335:552–7. doi:10.1126/science.1215110.
- Langmead B, Trapnell C, Pop M, Salzberg SL. Ultrafast and memory-efficient alignment of short DNA sequences to the human genome. Genome Biol. 2009;10:R25. doi:10.1186/gb-2009-10-3-r25.
- Mathews DH. Using an RNA secondary structure partition function to determine confidence in base pairs predicted by free energy minimization. RNA. 2004;10:1178–90. doi:10.1261/rna.7650904.
- Zhang Y, Ponty Y, Blanchette M, Lécuyer E, Waldispühl J. SPARCS: A web server to analyze (un)structured regions in coding RNA sequences. Nucleic Acids Res. 2013;41:W480–W5. doi:10.1093/nar/gkt461.
- Goz E, Tuller T. Widespread signatures of local mRNA folding structure selection in four Dengue virus serotypes. BMC Genomics. 2015;16:S4. doi:10.1186/1471-2164-16-S10-S4.
- van Dijk D, Dhar R, Missarova AM, Espinar L, Blevins WR, Lehner B, Carey LB. Slow-growing cells within isogenic populations have increased RNA polymerase error rates and DNA damage. Nat Commun. 2015;6:1–9.
- Tuller T, Veksler-Lublinsky I, Gazit N, Kupiec M, Ruppin E, Ziv-Ukelson M. Composite effects of gene determinants on the translation speed and density of ribosomes. Genome Biol. 2011;12:R110. doi:10.1186/gb-2011-12-11-r110.
- Kertesz M, Wan Y, Mazor E, Rinn JL, Nutter RC, Chang HY, Segal E. Genome-wide measurement of RNA secondary structure in yeast. Nature. 2010;467:103–7. doi:10.1038/nature09322.
- Baerenfaller K, Grossmann J, Grobei MA, Hull R, Hirsch-Hoffmann M, Yalovsky S, Zimmermann P, Grossniklaus U, Gruissem W, Baginsky S. Genome-scale proteomics reveals Arabidopsis thaliana gene models and proteome dynamics. Science. 2008;320:938–41. doi:10.1126/science.1157956.
- Brockmann R, Beyer A, Heinisch JJ, Wilhelm T. Posttranscriptional expression regulation: What determines translation rates? PLoS Comput Biol. 2007;3:e57. doi:10.1371/journal.pcbi.0030057.
- Stoletzki N, Eyre-Walker A. Synonymous codon usage in Escherichia coli: Selection for translational accuracy. Mol Biol Evol. 2007;24:374–81. doi:10.1093/molbev/msl166.
- Jia M, Li Y. The relationship among gene expression, folding free energy and codon usage bias in Escherichia coli. FEBS Lett. 2005;579:5333–7. doi:10.1016/j.febslet.2005.08.059.
- Enright AJ, Van Dongen S, Ouzounis CA. An efficient algorithm for large-scale detection of protein families. Nucleic Acids Res. 2002;30:1575–84. doi:10.1093/nar/30.7.1575.
- Isserlin R, Merico D, Alikhani-Koupaei R, Gramolini A, Bader GD, Emili A. Pathway analysis of dilated cardiomyopathy using global proteomic profiling and enrichment maps. Proteomics. 2010;10:1316–27. doi:10.1002/pmic.200900412.