
ABSTRACT
Long non-coding RNAs (lncRNAs) are emerging as important players in regulation of gene expression in higher eukaryotes. DDX5/p68 RNA helicase protein which is involved in splicing of precursor mRNAs also interacts with lncRNAs like, SRA and mrhl, to modulate gene expression. We performed RIP-seq analysis in HEK293T cells to identify the complete repertoire of DDX5/p68 interacting transcripts including 73 single exonic (SE) lncRNAs. The LOC284454 lncRNA is the second top hit of the list of SE lncRNAs which we have characterized in detail for its molecular features and cellular functions. The RNA is located in the same primary transcript harboring miR-23a∼27a∼24-2 cluster. LOC284454 is a stable, nuclear restricted and chromatin associated lncRNA. The sequence is conserved only in primates among 26 different species and is expressed in multiple human tissues. Expression of LOC284454 is significantly reduced in breast, prostate, uterus and kidney cancer and also in breast cancer cell lines (MCF7 and T47D). Global gene expression studies upon loss and gain of function of LOC284454 revealed perturbation of genes related to cancer-related pathways. Focal adhesion and cell migration pathway genes are downregulated under overexpression condition, and these genes are significantly upregulated in breast cancer cell lines as well as breast cancer tissue samples suggesting a functional role of LOC284454 lncRNA in breast cancer pathobiology.
Introduction
Recent advances in large scale RNA sequencing and bioinformatic analyses have revealed that while a substantial portion of the human genome is transcribed into RNA, only a small set of these transcripts (2–5%) code for proteins [Citation1]. The rest of the RNA repertoire consists of thousands of non-coding RNAs. The most abundant non-coding transcripts are the ribosomal RNA and the transfer RNAs. The other important class of non-coding transcripts that function in fine tuning of genetic network and gene regulation are the regulatory RNAs. The regulatory non-coding RNAs are divided into two major classes: short non-coding RNAs (<200 nucleotides) and long non-coding RNAs (≥200 nucleotides). The long non-coding RNAs (lncRNA) include intergenic, overlapping, intronic and antisense transcripts [Citation2,3]. They are predominantly nuclear localized, have a lower level of expression than protein coding genes [Citation4] and shown to be involved in various cellular processes ranging from embryonic stem cell (ESC) pluripotency, cell-cycle regulation, chromatin remodeling and epigenetic changes [Citation5–8]. LncRNAs in association with RNA binding proteins impart specific molecular functions by targeting RNA binding proteins to specific sites as guides or titrating away specific proteins as decoy or by acting as a scaffold wherein the single RNA binds distinct effector molecules that modulate diverse biological processes [Citation2,3,6]. In spite of their different mode of function, the central theme lies in the formation of ribonucleoprotein complexes consisting of lncRNAs and the RNA binding proteins (RBPs).
The dynamic association of lncRNAs with RBPs influences stability, function, transport, cellular localization and regulation of lncRNAs. Some well characterized RNA binding domains include the RNA recognition motif (RRM), K–homology domain (KH), Arg-Gly-Gly Box(RGG), SM domain, Piwi/Argonaute /Zwille (PAZ) domain and Asp-Glu-Ala-Asp (DEAD/DEAH) box domain [Citation9]. The DEAD-box domain containing proteins Gemin3, Ddx5 (p68), Ddx17 (p72) are ubiquitous and play a major role in RNA-mediated processes [Citation10]. DDX5/p68, a well-known RNA helicase, in addition to its established role in mRNA splicing, influences various cellular processes [Citation11]. Studies have also shown that p68 interacts with the non-coding RNA, steroid receptor RNA activator (SRA), and co-activates estrogen receptor alpha [Citation12]. P68 in association with SRA also influences transcriptional activation of MyoD during skeletal muscle differentiation [Citation13]. Subsequent studies have revealed the role of the p68-SRA complex as an essential component for chromatin insulator function upon binding to CTCF [Citation14]. Extensive studies from our laboratory have shown that p68 interacts with a novel lncRNA mrhl (meiotic recombination hot spot locus) of mouse [Citation15,16], and regulates Wnt signaling and meiotic commitment in spermatogonial cells through Sox8. [Citation17,18]. The mrhl RNA associates with chromatin to regulate the expression of several Wnt signaling pathway and spermatogenesis related genes in a p68 dependent manner [Citation19]. Considering the role of p68-lncRNA complex in diverse cellular processes we were encouraged to identify novel p68 interacting non-coding RNAs in human cells. Towards this objective we have carried out RIP-seq analysis of p68-associated RNAs and identified 158 lncRNAs that interact with p68. LOC284454 is the second top hit among the 73 single exonic lncRNAs that interacts with p68. LOC284454 RNA has a unique genome organization which is transcribed to a 1.77 kb long unspliced, polyadenylated, stable LOC284454 transcript cleaved from a longer primary transcript of 2.2 kb that also harbors the miR-23-a∼27a∼24-2 cluster. The sequence of LOC284454 gene is highly conserved only in the primate genomes. LOC284454 transcript is a stable, nuclear restricted and chromatin associated RNA. LOC284454 was differentially expressed in various cancer such as breast, prostate, uterus, colon and ovary. We found down-regulation of LOC284454 in breast cancer tissues and breast carcinoma cell lines T47D and MCF7. Total transcriptome analysis of HEK293T cells upon LOC284454 silencing showed perturbation of a small subset of genes associated with cancer. Overexpression of LOC284454 RNA in HEK293T cells perturbs the expression of different sets of genes more particularly cell adhesion pathways. Ectopic expression of LOC284454 in T47D and MCF7 cells reduced cellular proliferation and migration characteristics suggesting that LOC284454 could play an important role in breast cancer pathobiology.
Results
Identification of LOC284454 as a p68 interacting RNA
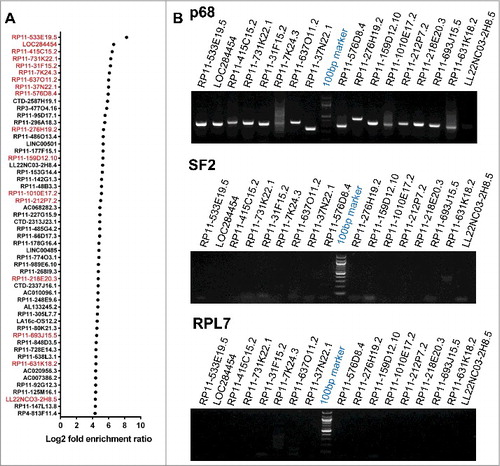
The p68 protein consists of an N-terminal domain followed by the helicase core and the C-terminal RNA binding domain (). To characterize the repertoire of RNA partners that are associated with p68 protein in human cells, we performed RNA immunoprecipitation followed by high throughput sequencing (RIP-seq) in HEK293T cells. Immunoprecipitation (IP) of the nuclear extract was carried out using in house generated and purified highly mono-specific anti-p68 antibody. The specificity of the p68 antibody is shown in Fig. S1A. The RIP RNAs were subjected to high throughput sequencing. An outline of the experimental strategy, data collection and analysis pipeline is shown in . The specificity of the pull-down was also demonstrated by the amplification of SRA lncRNA in the pull-down fraction which is known to interact with p68 in vivo () [Citation12]. The scatterplots of the RIP-seq reads showed the RNAs which were enriched in the p68 IP fraction (). A few non-specific interactions were also observed for some transcripts, as depicted by the dots along the X axis. The peak calling was carried out by PIRANHA [Citation20] and the enrichment ratios were calculated as described in Materials and Methods. A cut-off at 2-fold enrichment in RIP samples over control samples identified a large number of enriched transcripts (Table S1) that are associated with the p68 protein (corrected p value < 0.01). Majority of these transcripts belonged to the mRNA class (). This is not surprising since p68 is one of the major players in the pre-mRNA splicing process. The next abundant class (158 transcripts) of RNAs were the lncRNAs which consisted of both single exonic (73, SE) and multiple exonic (85, ME) transcripts. The enrichment of lncRNAs with multiple exons in p68 RIP-seq (Fig. S1B-F) might be due to the splicing function of p68 in splicing events of these lncRNAs. Among the ME lncRNAs that are associated with p68 protein, we find that the top ranking RNA is SRA, which has already been shown to interact with p68 [Citation14]. Interestingly, we also find MALAT1 in this list as one of the p68 interacting lncRNA that has been shown to be involved in promoting metastasis in lung cancer [Citation21]. Apart from the ME lncRNAs, there were 73 SE long non-coding RNAs that were associated with p68 out of which 54 of them showing a fold enrichment ratio of >20 are represented in . We surmise that these SE lncRNAs which were enriched in this RIP-seq dataset might interact with p68 for a non-splicing function similar to mrhl RNA [Citation15]. In order to substantiate that these SE lncRNAs are indeed due to specific interaction with p68 protein, we performed RIP-PCR with two negative controls using two different antibodies namely anti SF2 (a component of the splicesome complex) and anti RPL7 (ribosomal large subunit 7 protein). As can be seen in , we could validate the enrichment of the SE lncRNAs only with anti p68 antibody, but not with anti-SF2 and anti-RPL7 antibodies. The pull-down efficiency of the antibodies used in these studies are shown in Fig. S2A. We also subjected the RIP-Seq peak region sequences of 54 SE lncRNAs for MEME analysis [Citation22] and we deduced two potential consensus motifs which are present in all the 54 SE lncRNAs (Fig. S2B). Among the two motifs, Motif-1 is present in the LOC284454 sequence with lowest p-value (2.99 × 10−08; Table S2). The top hit transcript RP11-533E19.5 has been annotated as long non-coding transcript which is present upstream of CEP350, a melanoma tumor suppressor [Citation23]. Nevertheless, there is very little information available either on the expression pattern or function of RP11-533E19.5, while the second top transcript, LOC284454, is transcribed as a part of the primary transcript that harbors the miR-23a∼27a∼24-2 cluster [Citation24]. We chose to focus on the LOC284454 RNA for detailed functional analysis based on its unique genomic organization. Given the important role of the miRNA cluster in several cellular processes including cancer [Citation25], we were also curious to understand the biological function of LOC284454 generated from the same primary transcript.
Figure 1. RIP-seq strategy and data analysis. (A) Schematic representation of the domain structure of p68 protein. (B) Outline of RIP-seq analysis pipeline. (C) RIP in HEK293T cells using p68 antibody (top panel). Specificity of the pull down was ascertained by enrichment of SRA RNA in p68 IP (bottom panel). Input represents 10% of the total sample. (D) Scatter plot showing the pattern of enriched transcripts. Read counts (log 2) for each transcript are plotted against that of control (Control+2 and IP+2 to avoid division by zero). Reads with read coverage >10 are plotted. (E) Different types of transcripts obtained in the RIP. SE – single exonic lncRNA transcripts and ME – Multi exonic lncRNA transcripts.
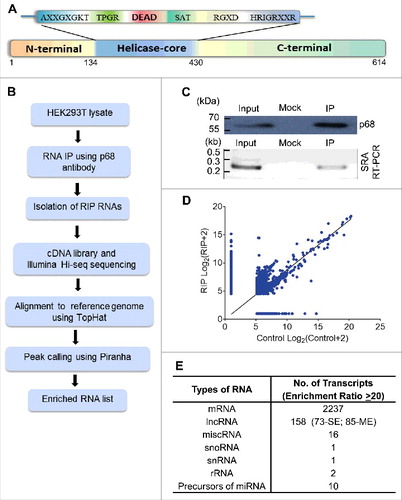
Figure 2. p68 interacting single exonic lncRNAs. (A) We filtered 54 single exonic lncRNA transcripts from 72 single exonic lncRNA transcripts of RIP-seq, transcripts with more than 80% of similarity with its genomic region has been selected and plotted based on their Log2 fold enrichment ratio and few transcripts were selected (red) for further validation by RIP-PCR in HEK293T cells. (B) RIP-PCR of selected transcripts in p68, SF2 (negative control) and RPL7 (negative control) antibody pulldown complexes.
Genomic organization of the LOC284454 RNA gene
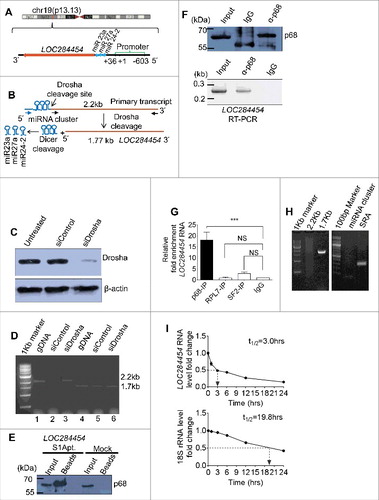
The NCBI BLAST analysis of the sequence read against the Homo sapiens genome showed that LOC284454 RNA gene is located on human chromosome 19, locus 19p13.13 (chr19:13945330-13947473) and miR-23-a∼27a∼24-2 cluster is present immediate upstream of the transcript (). Earlier observation by Lee et al [Citation24] indicated that the 2.2 kb primary transcript upon cleavage by Drosha results in generation of pre-miR 23a, 27a, 24–2 and the 1.7 kb LOC284454 transcript. To validate if the LOC284454 RNA is generated from the same primary transcript, reverse transcription PCR (RT-PCR) was carried out in Drosha silenced HEK293T cells using two different sets of forward primers that bind immediate upstream of miR-23a or within LOC284454 (). siRNA mediated silencing of the Drosha expression resulted in significant reduction of protein levels at 72 h post transfection (). RT-PCR analysis showed the presence of the 1.7 kb LOC284454 RNA in both the control and Drosha silenced cells. However, the full length 2.2 kb primary transcript was observed only in Drosha silenced HEK293T cells (), confirming the earlier observation of Lee et al [Citation24] that processing of the primary transcript is mediated by the Drosha machinery which results in the generation of the 1.7 kb LOC284454 transcript. This raises the question whether it is the 2.2 kb primary transcript or the 1.7 kb LOC284454 RNA that interacts with the p68 protein. In order to check these two possibilities, we cloned only the 1.7 kb LOC284454 RNA transcript with S1 aptamer in the 3′ end. After transfection of HEK293T cells with this vector construct, the protein extract was passed through streptavidin agarose column and the bound complexes were eluted and scored for p68 by western blot. As can be seen in , we were able to detect p68 protein in the eluted complexes. We also observed LOC284454 RNA enrichment in anti-p68 antibody IP fraction by RT-PCR (). We were also curious to find out whether the other 17 SE lncRNAs described in and are also enriched in this pull down experiment. As can be seen in Fig. S2C, there was no enrichment of any other SE lncRNAs as revealed by RT-PCR. Furthermore, enrichment of LOC284454 transcript was not observed in RIP experiments with anti-RPL7 or anti-SF2 antibodies (). In a converse experiment, we also carried out RIP pull down with anti p68 antibody and scored for the 1.7 kb LOC284454 transcript by RT-PCR (). To further demonstrate that LOC284454 RNA generated from the primary transcript is a stable RNA in HEK293T cells, we measured the half-life of LOC284454 RNA after actinomycin D treatment. As shown in , LOC284454 RNA has a half-life of approximately 3 hours validating that it is a stable RNA. Similar half-lives have been reported for other lncRNAs [Citation26].
Figure 3. LOC284454 RNA is a stable RNA that interacts with p68 in vivo. (A) LOC284454 is located on human chromosome 19 (chr19:13945330-13947473). Genomic sequence analysis showed that the RNA is 2 nucleotide downstream to the 3′ end of miR-23a∼27a∼24-2 cluster. The transcription start site and the validated promoter region are marked. (B) Schematic representation of LOC284454 primary transcript. The Drosha cleavage site which generates the miRNA cluster and the LOC284454 is marked. The blue arrow depicts the primer annealing positions on the primary transcript and black arrows on the LOC284454 specific region. (C) Drosha silencing was carried out with pool of 2 independent siRNAs. A representative western blot using anti Drosha antibody shows reduced Drosha level at 72 h post transfection. (D) The 2.2 kb full length PCR product was detected from genomic DNA (lane 2) and Drosha silenced cDNA (lane 4) but not from Drosha scrambled siRNA cDNA template (lane 3). The 1.77 kb LOC284454 was detected from both Drosha control cDNA (lane 6) and Drosha silenced cDNA (lane 7). Genomic DNA was used in lane 2 and lane 5 as positive control for PCR. (E) In vivo pull-down of LOC284454 in HEK293T cells transfected with plasmid containing LOC284454 fused with S1 aptamer at the 3' end. Presence of p68 was observed in the LOC284454-S1 aptamer pull-down but not in the mock pull-down. (F) RNA immunoprecipitation with p68 antibody shows the presence of p68 (top) and enrichment of LOC284454 in the IP fraction (bottom). (G) LOC284454 RNA enrichment in IP fractions of anti-p68 antibody, anti-SF2 antibody, anti-RPL7 antibody and Rabbit anti-IgG, *** – p≤0.0001 and NS-non-significant paired two tailed t test (H) RIP-PCR from p68 IP fraction for primary transcript (2.2kb), LOC284454 (1.7kb) and miRNA cluster, SRA lncRNA was used as a positive control for p68 specificity. (I) RNA stability assay of LOC284454 RNA and 18S rRNA in the presence of actinomycin D (10µg/ml). These data show the means ± SD from three independent experiments in triplicate.
LOC284454transcript is a non-coding, nuclear restricted and chromatin bound RNA
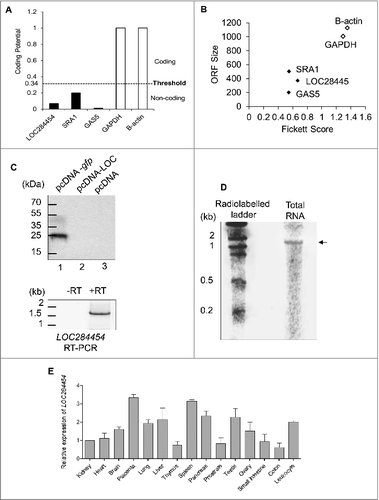
Analysis of LOC284454 sequence with the ORF Finder program failed to detect any significant ORF and also no Kozak sequence was found within the transcript (Fig. S2A). We subjected the LOC284454 RNA sequence to bioinformatic analysis such as Coding Potential Calculator (CPC) [Citation27], Coding Potential Assessment Tool (CPAT) [Citation28], Phylogenetic Codon Substitution Frequencies (PhyloCSF) [Citation29] and PORTRAIT [Citation30]. As shown in , , LOC284454 RNA was predicted as a non-coding RNA with short ORF when compared to protein coding sequences from CPAT. The same was observed with other programs also (Fig. S3 B-E). We also experimentally validated this prediction by carrying out an in vitro coupled transcription and translation (IVTT) assay using 35S methionine. We did not observe any protein product in the pcDNA-LOC284454 lane whereas the positive control pcDNA-gfp gave rise to GFP protein of expected molecular size (). The empty vector served as a negative control. To check if the full length LOC284454 transcript was indeed formed during the in vitro transcription reaction, we isolated the RNA from the same reaction and scored for the presence of LOC284454 transcript by RT-PCR. (bottom panel) shows the PCR amplification of the 1.7 kb product, which suggests that the RNA is indeed transcribed but not translated in the IVTT experiment. We also checked for the presence of the full length transcript in vivo in HEK293T cells by northern blot analysis. The LOC284454 specific probes hybridized to a single band corresponding to approximately 1.7 kb in size (). After demonstrating that LOC284454 is a stable non-coding RNA we analyzed its expression across different human tissues. We carried out expression analysis across 15 different tissues from the Human MTC panel I and II (Clontech) which showed that the RNA is expressed in almost all the tissues tested at varying levels ().
Figure 4. LOC284454 is a non-coding RNA expressed across all the tissues. (A) Coding potential score distribution from CPAT between coding (white bar) and noncoding (black bar) transcripts for LOC284454, SRA1, GAS5, GAPDH and β-actin transcripts. (B) Combinatorial effects of Fickett score, and ORF size on GAPDH and β-actin as coding genes (black dots) and LOC284454, SRA1 and GAS5 as noncoding genes (white dots). (C) In vitro transcription-coupled translation experiment in the presence of 35S methionine with pcDNA –LOC284454 construct failed to detect any protein product. Lane 1 positive control pcDNA–GFP gave a protein product around 27- kDa. In lane 3 empty vector served as a negative control. Bottom panel- RT-PCR of RNA isolated from the in vitro transcription-coupled translation assay of pcDNA-LOC284454 in the presence and absence of RT. (D) Northern blot analysis for LOC284454 with 32P- labeled full length RNA probe showing the presence of LOC284454 in HEK293T cells. (E) Tissue specific expression of LOC284454 analysed by qPCR from cDNA derived from normal human tissues. Gene expression levels were normalized to β-actin.
Since nuclear retention is a general property of many of the long non-protein-coding transcripts, we examined the subcellular distribution of the LOC284454 RNA in HEK293T cells. Cells were fractionated into nuclear and cytoplasmic fractions and RT PCR was carried out to determine the presence of LOC284454. U1 snRNA served as a positive control for the nuclear fraction () and GAPDH protein was used as a positive control for the cytoplasmic fraction (). As shown in , LOC284454 was detected only in the nuclear fraction but not in the cytoplasmic fraction. The localization of this RNA was further examined by RNA fluorescence in situ hybridization (RNA-FISH) performed in both normal and LOC284454 overexpressing conditions. shows that LOC284454 is predominantly localized in the nucleus as punctuate foci in HEK293T cells. No signal was observed in RNase treated cells. It is interesting to note that LOC284454 is restricted to nucleus even under overexpression condition (see ) indicating that this is an intrinsic property of the RNA.
Figure 5. LOC284454 RNA is localized to nucleus and present predominately in the chromatin fraction of HEK293T cells. (A) and (B). HEK293T cells were fractionated into nuclear (NF) and cytoplasmic (CF) fractions. U1 snRNA (A) and GAPDH protein (B) were used to assess the purity of the fractions. (C) Presence of LOC284454 RNA in the nuclear fraction was assessed by RT-PCR. (D) RNA-FISH using LOC284454 specific LNA probes labelled with 5′TYE 563 depicts (upper row) punctate nuclear localization of the RNA in HEK293T cells. LOC284454 RNA was localized in the nucleus even in overexpressed condition (middle row). Cells treated with RNAse A prior to hybridization shows no signal (lower row). Nucleus is stained with DAPI. The scale bar is 10 μm. (E) Sub-cellular fractionation of HEK293T cells. Tubulin, histone H3 and laminin proteins were used to assess the purity of the cytoplasmic (CP), chromatin (Ch) and nucleoplasmic (NP) fractions respectively. (F) LOC284454 is present both in nucleoplasm and chromatin fractions. (G) Immuno pull-down experiment with H3 antibody. The H3 pull-down fraction was probed with p68 antibody which also showed the presence of p68 on chromatin. (H) qPCR analysis shows the enrichment of LOC284454 in the H3 pull-down fraction. The data are expressed as the mean ± S.E.M from three replicates *-p≤0.05, **-p≤0.001, ***-p≤0.0001, NS-Non-significant, paired two tailed t test. SRA and MALAT1 were used as positive control and U1 snRNA was used as the negative control. i. Presence of LOC284454 RNA and p68 on chromatin by ChOP-PCR. qPCR shows the enrichment of LOC284454 RNA in the ChOP fraction. GAPDH was used as a negative control. The data are expressed as the mean ± S. E.M from three replicates. **- p-value ≤0.01, two-tailed paired t-test. (J) p68 protein as determined by western blotting in the ChOP fraction but not in the scrambled pull-down. Input represents 10% of the total sample.
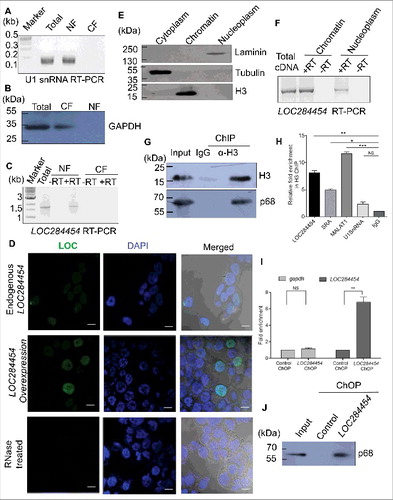
Several lncRNAs act as key regulators of global gene expression at the chromatin level [Citation3,5]. After confirming that LOC284454 RNA is present in the nucleus, we were interested to examine whether LOC284454 RNA is associated with the chromatin fraction. HEK293T cells were fractionated into nucleoplasm and chromatin fractions. The purity of both the fractions was assessed by immunoblot analysis with antibodies to laminin, tubulin and histone H3 (). LOC284454 RNA was observed both in the nucleoplasm and chromatin fractions, majorly in the chromatin fraction (). To address whether the RNA physically interacts with p68 on chromatin, we used the approach of chromatin-associated RNA immunoprecipitation, where we immune-precipitated the chromatin using anti histone H3 antibody () and extracted RNA from the immune-precipitated chromatin, treated with DNase I followed by reverse transcription and PCR. We found seven to eight fold enrichment of LOC284454 in the ChIP fraction in comparison to U1SnRNA while MALAT1 and SRA served as positive controls for this experiment (). The presence of the RNA in chromatin was further confirmed by the chromatin oligo affinity purification technique (ChOP) [Citation17]. In this technique the LOC284454 RNA was isolated from the chromatin fraction using biotin labeled oligonucleotide complementary to the RNA. The RNA was found to be enriched ∼7 fold compared to gapdh RNA (). The presence of p68 in the pull-down experiment was confirmed by western blotting analysis ().
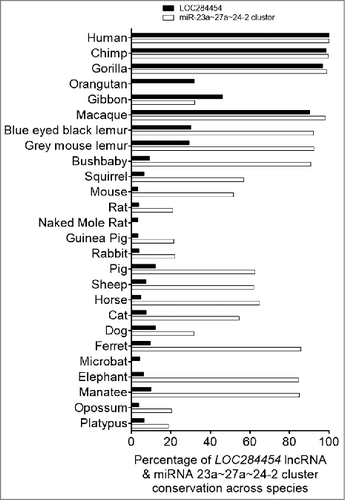
Evolutionary conservation of LOC284454 RNA sequence
To gain insights into the functional importance of this non-coding RNA, we examined the conservation of the RNA sequence across different species. We subjected the sequence of LOC284454 and upstream miR-23a∼27a∼24-2 cluster separately for sequence conservation comparing 26 genomes by the recently described method of Evolinc II [Citation31]. As shown in , the LOC284454 sequence has undergone significant evolution in primates among all the other mammalian species. On the other hand upstream miR-23a∼27a∼24-2 cluster is fairly conserved even in other mammals with a few substitutions within the sequence (Fig. S4A). It is increasingly becoming clear that the sequence conservation is not the primary determining factor for functional conservation among lncRNAs [Citation32,33]. It is believed that structural conservation in a particular domain more likely defines functional conservation. In this context, the patches of conservation from 637–1560 (Chr19:13,945,545-13,946,469) nucleotide in LOC284454 across different species might contribute to some common functions. Analysis of the RNA sequence using Repeatmasker and Fam software revealed the presence of Alu repeats in the LOC284454 (Fig. S4B). We find four subtypes of Alu sequences present in the LOC284454 namely AluSx, AluJr, AluSg and AluJ. These Alu subfamilies belong to different evolutionary ages with AluJ being the most primitive, AluSx the intermediate and AluY, the most recent one [Citation34,35]. The presence of multiple Alu repeats of different subfamilies may indicate a lineage specific diversification of the LOC284454 sequence with specific function towards the higher primates. These Alu repeats belong to a class of retroelements termed SINES that are specific to primates [Citation34]. Figure S4C represents the possible secondary structure of the LOC284454 RNA as predicted by the RNAfold webserver [Citation36]. When we compared the promoter sequence (-2 kb) of the LOC284454 locus across different species we find the promoter features and upstream regions are also conserved only in primates (Fig. S4D).
Figure 6. LOC284454 RNA is conserved only in primates Percentage of LOC24454 and miRNA-23a∼27a∼24-2 cluster conserved across selected species.
Expression analysis of LOC284454 RNA in different cancers
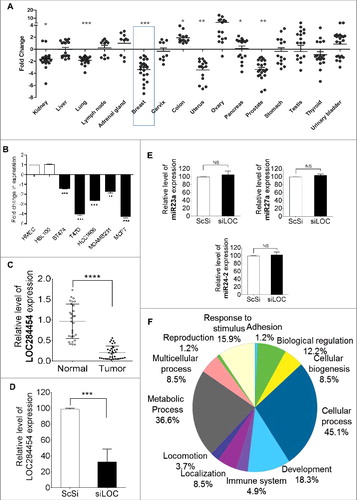
Recent studies have demonstrated that many lncRNAs are associated with several diseases including cancer [Citation37]. In this context we were curious to analyze the expression of LOC284454 RNA in different cancer tissues. For this purpose we initially carried out real-time qPCR analysis in human normal and tumor tissue array from Origene which has cDNAs from different cancers across different grades. The qPCR results showed aberrant expression of LOC284454 RNA in these different cancer tissue cDNA samples (). Among the several cancers tested, the samples from breast, prostate, uterus and kidney showed significant down-regulation in the expression of LOC284454 while tissue samples from colon and ovarian cancer showed up-regulation. Since the most significant down regulation was seen in breast cancer, we also checked for its expression in breast cancer cell lines and compared with the normal mammary epithelial cell lines HMEC and HBL100. Among these, T47D and MCF7 cells showed 4–5 fold reduction in the expression (). We observed higher expression of DDX5/p68 in breast cancer cell lines when compared to normal mammary breast epithelial cells (Fig. S5) which is also corroborated by other studies [Citation38,39]. This shows that there might be a potential association between LOC284454 lncRNA and p68 in breast cancer which needs further investigation. Additionally, we also examined LOC284454 RNA expression in cDNAs of 35 breast cancer patients compared with 25 normal mammary epithelial tissues (see Table S13 for breast cancer tissue details). As shown in , LOC284454 RNA expression was significantly lower in these breast cancer tissues with high statistical significance.
Figure 7. LOC284454 RNA expression is modulated in different cancer tissues and down-regulation of LOC284454 alters expression of selective gene sets. (A) Expression of LOC284454 RNA in different cancer tissues by qPCR. The relative difference between the expression level in tumour sample compared to normal samples are represented. **- p-value ≤0.01; ***- p-value ≤0.001 calculated by unpaired two-tailed t test. (B) Expression of LOC284454 in different breast cancer cell lines by qPCR. The data are expressed as the mean ± S.E.M from three replicates. **- p-value ≤0.01, two-tailed paired t-test. (C) Expression of LOC284454 in different breast tumor and normal tissues cDNA samples and normalized with TBP by qPCR. ****-p<0.0001, unpaired two tailed t test. (D) siRNA mediated knockdown of LOC284454 lncRNA in HEK293T cells. LOC284454 lncRNA expression was normalized with β-actin by qPCR. The data are expressed as the mean ± S.E.M from three replicates. ***-p<0.0001, paired two tailed t test. (E) Silencing LOC284454 lncRNA does not alter miRNA 23a, miR27a and miR24-2 expression. All miRNA expressions were normalized with U6 snRNA, NS refers to non-significant. (F) Gene ontology analysis by PANTHER showing the different biological processes perturbed upon LOC284454 loss of function.
Downregulation of LOC284454 RNA expression perturbs expression of a subset of genes in HEK293T cells
In order to explore the biological function of LOC284454 RNA, we used the approach of RNA-Seq analysis following siRNA mediated down-regulation. This approach has been widely used in the literature including our report on mrhl lncRNA [Citation17]. We designed a pool with two individual siRNAs against LOC284454 RNA and transfected into HEK293T cells. As shown in the we observed more than 65% downregulation after 48 hours of post transfection. Total RNA was extracted and subjected to RNA-Seq analysis using Illumina Sequencing platform. Since the primary transcript of LOC284454 RNA also contains the miR-23-a∼27a∼24-2 cluster, it was necessary for us to see the effect of siRNA treatment on the levels of miRNA23a, miR24-2 and miR27a precursors. We used stem-loop-RT-qPCR method to quantitate the levels of miRNAs [Citation40]. As can be seen in we did not observe any discernable changes in the levels of these miRNA precursors, giving us confidence to go ahead and examine the effect of down-regulation of LOC284454 RNA on global gene expression. The differential global gene expression of genes upon LOC284454 silencing was analyzed using Tophat and cufflinks software [Citation41]. We observed a subset of 95 differentially expressed genes (DEGs) with log2 fold change > 0.3, p-value ≤0.01 which included 56 down-regulated (Table S3) and 39 up-regulated genes (Table S4). Gene ontology (GO) analysis in PANTHER of these differentially expressed genes (Table S5 and S6) revealed that they belong to cellular process (45.1%), metabolic process (36.6%), development (18.3%), response to stimulus (15.9%) and biological regulation (12.2%) (). To validate RNA-Seq analysis we performed RT-qPCR analysis of selected down-regulated genes with p value ≤ 0.001 such as PLOD2, PFKFB3, BNIP3, EGR1, CXCR4, SLC2A3, LIPA, PPP1CC and CD44 and we selected RPL9P8, IFI44L, IFI6, GALC, ISG15, OAS3, IFITM1 and EDA2R for up-regulated genes with p value ≤ 0.001 upon silencing LOC284454 in HEK293T cells. As shown in the Fig. S6 A and B we observed the same trend as we observed in RNA-Seq analysis. We screened these genes in the public databases which revealed that these DEGs are associated with various cancer phenotypes and particularly in breast cancer (Table S7).
Since we had observed that LOC284454 expression is lower in breast cancer samples as well as in cell lines, we wanted to examine the expression of these perturbed genes in breast tumor samples (refer primer details in Table S14). As expected these selected DEGs were also differentially expressed in breast tumor cDNA samples as compared to normal breast epithelial tissues cDNA samples (Fig. S6C, D).
Ectopic over-expression of LOC284454 in breast cancer cells perturbs cellular growth and cell migration characteristics
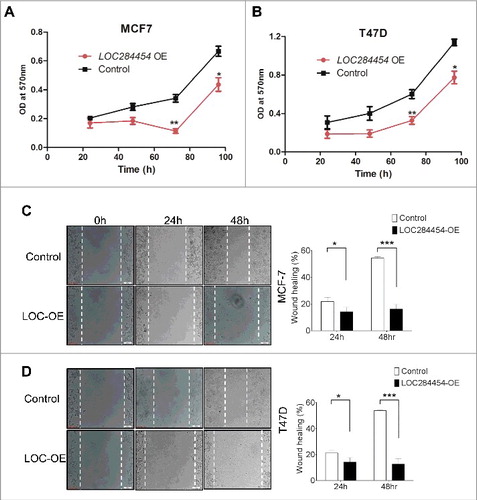
Next, we analysed the overall growth and cell migration phenotypes of breast cancer cells upon ectopic expression of LOC284454 RNA. For this purpose we used MCF7 and T47D cell lines which were earlier shown to express LOC284454 RNA at significantly lower level. These cell lines were transfected with pcDNA alone or pcDNA-LOC284454 construct (Fig. S7) and cellular proliferation and cell migration behavior were monitored. As can be seen in and , there was significant inhibition of cell growth in MCF7 and T47D cells at 72 h post transfection at a significant level of p≤0.001. Cellular migration phenotype was monitored by wound healing assay. These experiments were done in the presence of mitomycin C to take care of the influence of decreased cellular proliferation on the outcome of this experiment. The results of wound healing assay shown in and showed that ectopic expression of the lncRNA resulted in the retardation of cellular migration (50%) in T47D cells and (40%) in MCF7 cells 48 h post-transfection.
Figure 8. Effect of LOC284454 overexpression on proliferation and cell migration of breast cancer cells. (A) and (B). Cell proliferation assays depicting the change in proliferation of MCF7 and T47D cells. Proliferation was measured in terms of OD at 570nm. LOC284454 overexpressed cells showed reduced proliferation 72h post transfection. The data are expressed as the mean ± S.D from three replicates. *- p-value ≤0.05; **- p-value ≤0.01. (C) and (D). Wound healing assays were carried out in the presence of Mitomycin C in LOC284454 overexpressed MCF7 and T47D cells. After 24h of post transfection, cells were exposed to 10µg/ml of MMC and cell monolayer was scratched with a sterile pipette tip. Phase-contrast microscopic images were taken at the indicated time points. The difference in migration upon LOC284454 overexpression in MCF7 and T47D cells are calculated. The data are expressed as the mean ± S.D from three replicates. *-p<0.05, ***-p<0.0001, paired two tailed t test.
Overexpression of LOC284454 RNA in HEK293T cells perturbs expression of a different set of genes
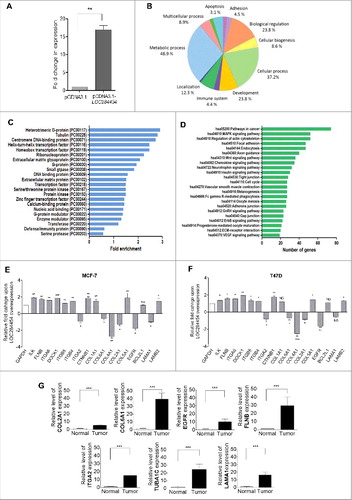
Since, ectopic expression of LOC284454 in breast cancer cells inhibited cell growth and cellular proliferation, the immediate question that arises is its effect on global gene expression. Since, we had already done loss of function studies in HEK293T cells we also carried out the RNA-Seq analysis in HEK293T cells upon ectopic overexpression of LOC284454 and then validated a set of perturbed genes in breast cancer cells and also in breast tumor tissues. The relative fold change of expression was approximately 15 fold in LOC284454 overexpressed cells (). After RNA-seq analysis the data was analyzed as described earlier. We observed a total of 3357 transcripts that were differentially expressed with log 2 fold change > 0.6, with a p-value cut off of p <0.01 and FDR of <0.03 which included 3210 downregulated (Table S8) and 147 upregulated (Table S9) transcripts. Genes were classified based on gene ontology with PANTHER. A high percentage of genes which were differentially expressed belonged to biological processes like metabolic process, cellular process and biological regulation (). Further functional classification showed that LOC284454 RNA overexpression perturbs the expression of genes belonging to a subcategory of heteromeric G protein, tubulin, centromeric DNA binding proteins, transcription factors etc. (). Subsequent KEGG pathway analysis showed that among the different pathways, maximum number of genes belonged to pathways implicated in cancer followed by focal adhesion and regulation of actin skeleton (, Table S10-S12). We observed down-regulation of apoptotic pathway genes as CASP8, CASP9 and BAX and up-regulation of tubulin related genes as TUBA1C, TUBB2A, TUBA1A and TUBB2C in both MCF7 and T47D cells (Fig. S7C, D). Since, we observed earlier that overexpression of LOC284454 in MCF7 and T47D cells resulted in reduced migration characteristics, we examined the expression pattern of selected genes belonging to focal adhesion pathway and migration by RT-qPCR in LOC overexpressing MCF7 and T47D cells. As shown in and we did indeed observe down-regulation of COL2A1, COL4A1, COL6A1 and ITGA2 gene in both these cell lines. Interestingly, we also observed higher expression of COL2A1, COL6A1, EGFR, FLNB, ITGA2, LAMA1 breast cancer tumor tissues ().
Figure 9. Overexpression of LOC284454 alters global gene expression. (A) Extent of overexpression of LOC284454 transcript in HEK293T cells. Transfection with overexpression construct results significant increase in LOC284454 transcript compared to empty vector containing cells. **- p-value ≤0.01; paired two-tailed t test. (B) Gene ontology analysis by PANTHER showing the different biological processes perturbed upon LOC284454 overexpression. (C) Over-representation of particular classes of protein as tested by PANTHER analysis. The Binomial test using Bonferroni correction was used to determine the statistical overrepresentation in the PANTHER protein class. The over-representation was calculated as genes in an input list relative to the genes in the inference list. (D) KEGG Pathway enrichment analysis of the genes using DAVID. (E and F) qPCR validation of selected genes related to focal adhesion pathway in MCF7 and T47D cells after LOC284454 overexpression. The data are expressed as the mean ± S.E.M from three replicates. Paired two-tailed t test, *-p<0.05, **-p<0.001, ***-p<0.0001 and NS-Non-significant (G) RT-qPCR validation of selected genes related to focal adhesion in breast cancer tumor (8 samples) and normal tissue (4 samples) cDNA samples and normalized with TBP. ***-p≤0.0001, unpaired two tailed t test.
Discussion
DDX5/p68 protein is the prototypic member of the DEAD box family of RNA helicases that play important roles in various aspects of RNA metabolism including pre-mRNA processing, RNA turnover, nuclear RNA export, ribosome biogenesis and translation [Citation42]. It also functions as an important coactivator of estrogen-receptor alpha in complex with SRA [Citation43,44]. Interestingly, p68 together with SRA interacts with CCCTC-binding factor (CTCF) and cohesions [Citation14], suggesting that it may also be involved in 3D organization of chromatin loops in the nucleus. P68 was found to form a complex with the RBP-J/Notch coactivator and activates several Notch target genes [Citation45]. Recent reports from our laboratory have also shown that p68 interacts with mrhl lncRNA and modulates Wnt signalling in mouse spermatogonial cells [Citation19,46]. In the context of such a diversity of functional role of p68 in mammalian cells, we surmised that it might interact with many more lncRNAs in the nucleus and therefore we were encouraged to identify complete repertoire of the RNA molecules that interact with the p68 protein in human cells. Here we report identification of several p68 interacting RNAs ranging from mRNAs, ribosomal RNAs, snRNAs, snoRNAs, miRNAs, and lncRNAs and characterized one such lncRNA LOC284454. The single exonic LOC284454 lncRNA is one of the top 5 hits which has an interesting genomic architecture. LOC284454 RNA is a part of the primary transcript that harbors the miR-23a∼27a∼24-2 cluster. It is interesting to note that miR-23a∼27a∼24-2 cluster sequence is highly conserved across all the mammalian species. On the other hand, the LOC284454 RNA sequence is found only in primates. During the evolutionary process, LOC284454 has acquired the primate specific Alu sequences which are repetitive mobile genetic sequences that have contributed widely to genome evolution [Citation34]. Integration of Alu elements is believed to be associated with maturation and gain of function in non-coding RNAs during the evolutionary process [Citation47]. Alu regions which have been termed as Repeat Insertion Domains of LncRNAs (RIDLs) can act as RNA, DNA and protein binding domains that are essential for lncRNA function [Citation48]. In the ANRIL non-coding RNA, Alu sequence is the key regulatory element responsible for ANRIL-mediated trans-regulation of gene expression by recruiting epigenetic effector protein at the promoter of target-genes [Citation49]. Similar epigenetic trans-regulation of gene networks might be relevant for other lncRNAs as well. It remains to be seen in the future the functional contribution of Alu sequences in LOC284454 RNA.
Differential expression of LOC284454 RNA in some of the cancer cDNA samples gave us a clue that this RNA may have important biological function(s). Towards this objective, we took the approach of both silencing as well as ectopic overexpression of this RNA in HEK293T cells. Silencing of this RNA resulted in perturbation of only a subset of genes (36 up-regulated and 59 down-regulated) among which many genes are also shown to be perturbed in breast cancer [Citation50–69]. The association of these genes in the breast cancer was further validated by RT-qPCR analysis in both breast cancer cell lines as well breast cancer tissue samples. Ectopic overexpression resulted in perturbation of a much larger set of genes (147 up-regulated and 3210 down-regulated) among which one of the class of genes belonged to focal adhesion and cell migration characteristics which were further validated by RT-qPCR analysis of breast cancer cell lines and breast cancer tissue samples. Interestingly, although the set of genes which are perturbed in loss and gain of function conditions are different, many of them are associated with breast cancer pathobiology. The transcriptome profiling of LOC284454 RNA overexpressing cells also identified focal adhesion pathway genes as one of the major group to be perturbed followed by regulation of actin skeleton. Formation of the extracellular matrix is essential for processes like growth and migration. Focal adhesions are large protein complexes organized at the basal surface of cells, which physically connect the extracellular matrix to the cytoskeleton and have long been speculated to mediate cell migration [Citation70]. Perturbation of gene expression associated with these pathways might contribute to the decrease in proliferation capacity as well as cellular migration characteristics of T47D and MCF7 cells [Citation70]. In recent years, the molecular mechanisms by which lncRNAs regulate gene expression are being worked out for many of these RNAs. In this context, it would be interesting to see how LOC284454 RNA regulates gene expression in human cells particularly since it is predominantly localized on the chromatin () which we are presently addressing.
Dysregulated expression of lncRNAs in cancer, marks the spectrum of disease progression and also serve as an independent prognostic predictor for patient survival [Citation71] as exemplified by NEAT1 and MALAT1. The lncRNA MALAT1 is up-regulated in many solid tumors and is associated with cancer metastasis and recurrence [Citation72]. NEAT1 is significantly up-regulated in breast cancer cells and is also involved in the transformation of myeloid cells into promyelocytic leukemia (APC) [Citation73]. An emerging concept in the area of lncRNA biology is that the lncRNA which is overexpressed in some cancer may behave as an oncogene and that which is under expressed may function as a tumour-suppressor gene [Citation74]. Many of these lncRNAs, whose expression is perturbed in cancer, are also being considered as potential biomarkers as well as possible targets of therapeutic intervention [Citation75]. In this context, it is interesting to point out that the expression of LOC284454 is upregulated in the colon and ovarian cancer in contrast to breast cancer the significance of which needs to be addressed in future investigations.
The expression of miR-23a∼27a∼24-2 cluster which is embedded in the LOC284454 RNA primary transcript is also perturbed in many disease phenotypes including cancer. Expression of these miRNAs are up-regulated in acute lymphoblastic leukemia, acute myeloid leukemia, chronic lymphocytic leukemia, breast cancer, gastric cancer, cholangiocarcinoma cells and hepatocellular carcinoma cells (HCC) as compared to their respective normal cells [Citation25]. Thus both the RNA products of the LOC284454 RNA locus (miRNA cluster and LOC284454 RNA) do influence biological process related to cancer phenotype. An interesting question that arises in the present context is regarding the dynamics of the biogenesis of the two distinct classes of non- coding RNAs and how they are regulated. It will also be interesting to see, if there is any functional overlap of micro RNAs of the miRNA cluster and the LOC284454 RNA in normal cellular physiology and also in cancer pathophysiology. Another major outcome of the present investigation is the identification of a complete repertoire of single exonic lncRNAs that interact with the DDX5/p68 helicase protein. Elucidation of the functional roles of these lncRNAs in association with the p68 will not only give valuable insights into the regulatory networks involving the lncRNAs but also add to the complexity of the already existing pleiotropic function of the p68 protein.
Author's contribution and disclosure of potential conflicts of interest
M.D., A.R. and M.R.S.R. designed the experiments, analysed the data and wrote the manuscript. M.D. and A.R. carried out the molecular biological, cell biological and genetic experiments. UB performed the bioinformatics analysis. A.S, G.M and P.K carried out the breast cancer tumour studies. A.R. and S.N.D. carried out the wound healing assay. Authors declare no conflict of interest and no competing financial interests.
Cell line and reagents
Human embryonic kidney cell line HEK293T, human breast cancer cell lines T47D, MCF7, MDAMB231, HCC1806, BT474 and normal breast epithelium cell lines HBL100 and HMEC were cultured in DMEM (Life Technologies) supplemented with 10% FBS (Gibco) and 1% penicillin/streptomycin (Gibco) at 37°C and 5% CO2. All fine chemicals were purchased from Sigma Aldrich and Life Technologies unless otherwise specified. Anti-p68 antibody was purchased from Novus biologicals. Following antibodies were obtained from Abcam: Anti-SF2 (ab38017), Anti-RPL7 (ab72550) and Anti-Histone H3 (ab46765). Drosha siRNAs (SASI_Hs02_00321994, SASI_Hs02_00321996) were purchased from Sigma Aldrich.
p68 RIP-seq
RIP was carried out using the protocol as described with minor modifications [Citation76,77]. Briefly, HEK293T cells were lysed in RIP buffer containing 0.5% Nonidet P-40, 150 mM NaCl, 2 mM MgCl2, 1 mM DTT, 0.1 mM EDTA, 10% glycerol, 5 mM vanadyl ribonucleoside complex (VRC), 100 U/ml RNase inhibitor and 1X protease inhibitor cocktail (Roche). The lysate was pre-cleared by centrifugation and the supernatant was incubated with anti-p68 antibodies or pre-immune IgG overnight at 4°C. RNA-protein complexes were captured with antibody coupled protein A agarose beads, washed with RIP buffer and treated with RNase free DNase I. RNAs were isolated using the Trizol method. Approximately 200 ng of RNA from both IP and control (pre immune IgG) pull-down were converted to cDNA using random hexamer primer. The cDNA pool were fragmented, end repaired and adapters were ligated to generate the cDNA libraries. Sequencing was carried out on Illumina HiSeq 2000 platform. The low quality reads, mitochondrial genome derived RNAs and adapter sequences were removed. The remaining sequences were aligned to the reference genome hg19/GRCh37 assembly using TopHat program version 2.0.8. The transcripts having reads less than 10 were filtered out. Peak calling was carried out with Piranha (version 1.2.0) [Citation20]. Reads for IP and control were increased by 2 to avoid division by zero and the enrichment ratio for the genes was calculated by counts in IP/counts in control. The classification of the RNA types was carried out as per ENSEMBLE database.
Coding potential and evolutionary conservation analysis
Coding potential of LOC284454 RNA was analysed by four online tools Coding Potential Calculator (CPC) [Citation27], Phylogenetic Codon Substitution Frequencies (PhyloCSF) [Citation29], Coding Potential Assessment Tool (CPAT) [Citation28] and PORTRAIT [Citation30].
To predict the evolutionary pattern of LOC284454 and its associated three miRNAs, first, the 26 mammalian genomes were selected whose phylogenetic relationship goes back to a common ancestor between 100 and 130 MYA [Citation78,79]. Based on the Evolinc II pipeline [Citation31] blastn was performed against the 26 selected mammalian genomes separately for LOC284454 (1774 nt) and the miR-23a∼27a∼24-2 cluster (381 nt) sequence (obtained from the region where three LOC284454 associated miRNAs resides in the Human GRCh37.p13 assembly) using word size of 8 and match/mismatch scores of 1/-2 using CoGe/CyVerse Server.
RNA fluorescence in situ hybridization
RNA-FISH was performed as described earlier with minor modifications [Citation20]. HEK293T cells cultured on poly-lysine coated glass coverslips were fixed with 4% formaldehyde and 10% acetic acid, dehydrated in 70% ethanol and permeablized with 0.01% Triton X-100. After permeabilization, cells were washed twice with PBS and prehybridized for 1 h in 2X SSC containing 10% dextran sulfate, 2 mM VRC, 0.2% BSA, 40 μg of Escherichia coli tRNA, 50% formamide, and 200 μg/ml sheared single-stranded salmon sperm DNA. 100 nM FITC-labeled LOC284454 specific LNA probes (Exiqon) were added in the same buffer and allowed to hybridize for 8 h at 45°C in a moist chamber. Cells were washed twice in 50% formamide containing 2X SSC followed by 0.5 X SSC with 50% formamide and 0.1% SDS. The cover slips were mounted subsequently on glass slides with 90% glycerol in PBS containing 1 μg/ml DAPI.
Interaction of LOC284454 with p68 in vivo
For in vivo RNA pull-down experiments, the S1 aptamer approach was used as described [Citation80]. HEK293T cells were transfected with pcDNA-LOC284454-S1 construct using Lipofectamine 2000 (Invitrogen). 24 h post-transfection, cells were harvested and lysed in buffer containing 10 mM Tris-HCl, pH 8.0, 150 mM NaCl, 5 mm MgCl2, 0.1 mM EDTA, 1 mM DTT, 0.5% Triton X-100, 5% glycerol,1 mM PMSF and protease inhibitor cocktail. The lysate was centrifuged at 20000 g at 4°C for 30 min. 20 µl streptavidin magnetic beads (Invitrogen) were added to the clarified lysate and incubated for 4 h at 4°C. Beads were washed three times with the lysis buffer, boiled with SDS gel loading dye and proteins were analyzed on 10% SDS PAGE. The presence of p68 in the pull-down fraction was ascertained by western blot analysis.
RNA stability assay
For RNA stability assay, 5 × 10⁵ HEK293T cells seeded per 10-cm-diameter dish were cultured for 24 h in regular medium; subsequently, it was replaced by fresh medium with 10μg/ml of Actinomycin D (Invitrogen) or vehicle (DMSO). At each time point (0, 1, 3, 6 and 8 h) cells from a control dish and a treated dish were harvested for RNA extraction. RT-qPCR was used for measuring LOC284454 expression and18S rRNA as a control. Half-lives were calculated by fitting a nonlinear regression model of one-phase exponential decay (constraint = plateau >0) using GraphPad Prism software version 5.04.
In vitro transcription-translation, northern blotting, chromatin oligo affinity purification (ChOP) and subcellular fractionation
The linearized pcDNA-LOC284454 was used as a template and coupled transcription-translation reaction was carried out with the Promega TnT quick-coupled transcription/translation system. Transcription was monitored by RT-PCR and translation was monitored by incorporation of 35S methionine. The reaction products were resolved on 15% SDS-polyacrylamide gel and the incorporation of 35S during translation was analysed by phosphor imaging. Northern blotting was carried out as described previously with minor modifications [Citation16]. Approximately 30 μg of total RNA from HEK293T cells were denatured for 15 min at 65°C and loaded on to 4% PAGE containing 7 M urea. Radiolabelled probes were prepared by nick translation using NEB Blot Kit (New England Biolabs) followed by hybridization overnight at 42°C. The membrane was washed twice in 2X SSC, 0.5% SDS at room temperature and once each in 1X SSC, 0.1% SDS at 42°C and 0.1X SSC, 0.1% SDS at 42°C and exposed to a Phosphor Imager screen.
ChOP analysis was performed as described previously [Citation46]. HEK293T cells over expressing LOC284454 RNA were fixed with 1% formaldehyde for 10 min at room temperature with gentle shaking. The reaction was quenched with 125 mM glycine for 5 min and the cells were further processed for oligo affinity purification using ChOP oligonucleotide (Table S14). Subcellular fractionation was carried out as described [Citation81].
Chromatin immuno precipitation (ChIP)-PCR
HEK293T cells were cross-linked with 1% formaldehyde, washed with PBS and resuspended in ChIP incubation buffer (0.1% SDS, 0.5% Triton X-100, 20 mM Tris-HCl, pH 8, and 150 mM NaCl), and sheared using a Bioruptor sonicator (Diagenode), to yield a size range of 200–600 bp. Samples were centrifuged for 15 min, precleared using protein A-agarose beads (Invitrogen) and incubated with 3 μg of histone H3 antibody or 3 µg of control IgG for 12 h at 4°C. The immune complexes were captured with protein A beads for 2 h at 4°C. The beads were washed with high salt buffer and low salt buffer followed by incubation with elution buffer (1% SDS, 0.1 M NaHCO3) supplemented with proteinase k (80 mg/ml). The RNA associated with ChIP fraction was isolated by the Trizol method and the enrichment of LOC284454 was checked by fold change relative to U1snRNA by real time PCR.
siRNA mediated silencing of LOC284454
For downregulation of LOC284454 with small interfering RNAs (siRNA), HEK293T cells were transfected with a pool of two individual siRNAs (N-189518-02-0050 and N-189518-03-0050) from Dharmacon (Thermo Scientific) targeting LOC284454 or scrambled silencing siRNA (D-001320-01-20), according to the manufacturer's transfection protocol as previously described [Citation17]. Total RNA was extracted using Trizol reagent and reverse transcription was carried out with RevertAid first strand cDNA synthesis kit (ThermoScientific, USA) according to the manufacturer's protocol.
Quantification of miRNA23a, miR-27a and miR24-2 amplification
Total RNA was extracted using Trizol reagent and reverse transcription was carried out with RevertAid first strand cDNA synthesis kit (ThermoScientific, USA) according to the manufacturer's protocol. Stem loop primers were designed for pri-miR-23a, pri-miR-27a and pri-miR-24-2 and cDNA has been amplified [Citation40]. Analyses were carried out using SensiFAST SYBR No-ROX Kit (Bioline, USA). For measurement of miRNA-23a, miRNA-27a, and miRNA-24-2, U6 snRNA was selected as a reference gene and RT-qPCR were conducted under the conditions of 40 cycles of 10-min incubation at 95°C, 15-s incubation at 95°C, and 1-min incubation at 60°C. Primers (forward and reverse) of miRNA-23a, miRNA-27a, and miRNA-24-2 for qPCR are listed in Table S14. The value of gene expression was calculated with 2–ΔΔCt method.
Expression pattern of LOC284454 in cancer cDNA panel
Expression level of LOC284454 was checked in different cancer tissue cDNAs obtained from Origene (CSRT303). The description of the tumour samples in this panel can be obtained at http://www.origene.com/qPCR/Tissue-qPCR-Arrays.aspx. Quantitative reverse transcriptase-PCR (qRT-PCR) was performed using SYBR master mixes and expression levels were normalized to β-actin expression. Quantitative expression data were acquired using ABI-Prism 7900HT Sequence Detection System (Applied Biosystems), and results were analysed by the 2–ΔΔCt method.
Patients details
Tumor samples from breast cancer patients were obtained who presented at the Kidwai Memorial Institute of Oncology (KMIO) Bangalore. The status of estrogen receptor (ER), progesterone receptor (PR), Her2/neu, and pathological data like tumor grade, size and lymph node status were obtained from the pathology records of the respective patients. Patient details and samples chosen for LOC284454 expression analysis are provided in Table S13.
Cloning of the LOC284454 RNA gene
The LOC284454 gene specific primers that incorporated 5′ BamHI and 3′ XbaI restriction sites were used to amplify the LOC284454 transcript from HEK293T cell derived cDNA which was cloned into the plasmid vector pcDNA3.1(+) vector immediately after the CMV promoter to generate pcDNA-LOC284454. To attach the S1 aptamer sequence at the 3′ end of LOC284454, a separate reverse primer was designed that contains the S1 aptamer sequence immediately after the LOC284454 complementary region. The LOC284454-S1 PCR product was subsequently cloned into pcDNA3.1 (+) to obtain pcDNA-LOC284454-S1 construct.
Transcriptome sequencing and analysis
Total RNA was isolated from HEK293T cells upon silencing of LOC284454 RNA (48h) or overexpression of LOC284454 RNA in HEK293T cells after 48 h of post transfection using TRIzol Reagent. Transcriptome sequencing was carried out using IlluminaHiSeq 2500 platform. We used bowtie2 (version 2.2.2), in-house Perl scripts and picard tools (version 1.119) to remove contamination and used TopHat (v2.0.8) with default parameters to align the sequence reads to the reference genome of Human (Hg19) downloaded from Ensembl Release 75 databases. Later, Cuffdiff (v2.2.0) program [Citation41] was used to identify the differentially expressed genes. For biological replicates, transcripts with P-adjust of < 0.05 were deemed differentially expressed between two groups.
Gene ontology and panther analysis
Gene ontology terms for mRNAs in loss and gain of function of LOC284454 RNA was performed in PANTHER [Citation82] and KEGG pathway analysis were determined using the DAVID program [Citation83].
Validation of sequencing data by qPCR
To validate the loss of function of LOC284454 RNA-sequencing data, nine most modulated genes from each downregulated and upregulated gene list related to breast cancer were chosen. For gain of function of LOC284454 RNA-sequencing data, genes related to apoptosis, focal adhesion and migration pathways were chosen and qPCR were performed using BioRad CFX96 Real-Time PCR System and SensiFAST SYBR® No-ROX Kit (Bioline Reagents Ltd). Each qPCR reaction (in 25 μL) involved 12.5 μL 2x SensiFAST SYBR No-ROX Mix, 1 μL of each primer, 2 μL cDNA and 8.5 μL H2O. The cycling conditions included an initial single cycle (95 °C for 3 min), and followed by 40 cycles (95 °C for 15 s; 57–60 °C for 15 s; 72 °C for 20 s). All amplifications were followed by dissociation curve analysis of the amplified products. Specific primers were designed using the NCBI, specificities were confirmed with BLAST and gene expression levels were normalized with β-actin or GAPDH to attain the relative expression by using 2−ΔΔCt value methods (Table S14).
Cell proliferation and migration assays
Cell proliferation was assessed by the alamarBlue (Life Technologies) assay, as per manufacturer's protocol. T47D cells and MCF7 cells were transfected with pcDNA-LOC284454 construct and pcDNA control vector in a 96-well plate. 24, 48 and 72 h post transfection, 10% alamarBlue was added to the cells and incubated for 4 h. Cell proliferation was measured by monitoring the absorbance at 570 and 600 nm using a microplate reader. For cell migration assay, cells were transfected with pcDNA-LOC284454 and pcDNA negative control vector in a 6-well plate. The cells were incubated with 10 µg/ml mitomycin C (Sigmaaldrich, USA) for 2 h prior to the scratch assay. 24 h post transfection a sterile p200 tip was used to create a scratch on the monolayer. The plate was washed once with the desired medium and cell migration was monitored at various time points. 3 scratches were made per plate and at least 3 images per scratch were taken and the distance between the sides of the scratch to other were measured by ImageJ software.
Statistical analysis
All statistical data were analysed by GraphPad Prism 5 software. Two-tailed Student's t-test and two way ANOVA tests were used as appropriate, and P < 0.05 was considered statistically significant. Bar graphs show the mean ± SEM of biological replicates.
Disclosure of potential conflicts of interest
Authors declare no conflict of interest and no competing financial interests.
suppl_table_Monalisa_Das.zip
Download Zip (976.1 KB)Suppl_mat_Monalisa_Das.docx
Download MS Word (2.3 MB)Acknowledgements
We thank Prof. Annapoorni Rangarajan of IISC for HMEC cells. We acknowledge SciGenom Labs for next generation sequencing service and data analysis. We thank Suma B.S. of the confocal imaging facility and Anitha G. of the sequencing facility at JNCASR. We thank members of M.R.S. Rao laboratory for their critical inputs and suggestions.
Additional information
Funding
Related Research Data
References
- Djebali S, Davis CA, Merkel A, et al. Landscape of transcription in human cells. Nature. 2012;489:101-8. doi:10.1038/nature11233
- Batista PJ, Chang HY. Long noncoding RNAs: cellular address codes in development and disease. Cell. 2013;152:1298-307. doi:10.1016/j.cell.2013.02.012
- Rinn JL, Chang HY. Genome regulation by long noncoding RNAs. Annual review of biochemistry. 2012;81:145-66. doi:10.1146/annurev-biochem-051410-092902
- Mercer TR, Mattick JS. Structure and function of long noncoding RNAs in epigenetic regulation. Nat Struct Mol Biol. 2013;20:300-7. doi:10.1038/nsmb.2480
- Kanduri C. Long noncoding RNAs: Lessons from genomic imprinting. Biochimica et biophysica acta. 2016;1859:102-11. doi:10.1016/j.bbagrm.2015.05.006
- Wang KC, Chang HY. Molecular mechanisms of long noncoding RNAs. Molecular cell. 2011;43:904-14. doi:10.1016/j.molcel.2011.08.018
- Pal D, Rao MRS. Long Noncoding RNAs in Pluripotency of stem cells and cell fate specification. In: Rao MRS, ed. Long noncoding RNA biology: Springer Nature Singapore Pte Ltd; 2017.
- Akhade VS, Pal D, Kanduri C. Long Noncoding RNA:Genome organization and Mechanism of Action. In: Rao MR, ed. Long noncoding RNA biology: Springer Nature Singapore Pte Ltd; 2017.
- Lunde BM, Moore C, Varani G. RNA-binding proteins: Modular design for efficient function. Nature reviews Molecular cell biology. 2007;8:479-90. doi:10.1038/nrm2178
- Linder P, Jankowsky E. From unwinding to clamping – the DEAD box RNA helicase family. Nature reviews Molecular cell biology. 2011;12:505-16. doi:10.1038/nrm3154
- Linder P, Fuller-Pace F. Happy birthday: 25 years of DEAD-box proteins. Methods in molecular biology. 2015;1259:17-33. doi:10.1007/978-1-4939-2214-7_2
- Caretti G, Lei EP, Sartorelli V. The DEAD-box p68/p72 proteins and the noncoding RNA steroid receptor activator SRA: eclectic regulators of disparate biological functions. Cell cycle. 2007;6:1172-6. doi:10.4161/cc.6.10.4228
- Caretti G, Schiltz RL, Dilworth FJ, et al. The RNA helicases p68/p72 and the noncoding RNA SRA are coregulators of MyoD and skeletal muscle differentiation. Developmental cell. 2006;11:547-60. doi:10.1016/j.devcel.2006.08.003
- Yao H, Brick K, Evrard Y, et al. Mediation of CTCF transcriptional insulation by DEAD-box RNA-binding protein p68 and steroid receptor RNA activator SRA. Genes & development. 2010;24:2543-55. doi:10.1101/gad.1967810
- Nishant KT, Ravishankar H, Rao MR. Characterization of a mouse recombination hot spot locus encoding a novel non-protein-coding RNA. Molecular and cellular biology. 2004;24:5620-34. doi:10.1128/MCB.24.12.5620-5634.2004
- Ganesan G, Rao MRS. A novel noncoding RNA processed by Drosha is restricted to nucleus in mouse. Rna. 2008;14:1399-410. doi:10.1261/rna.838308
- Arun G, Akhade VS, Donakonda S, et al. mrhl RNA, a long noncoding RNA, negatively regulates Wnt signaling through its protein partner Ddx5/p68 in mouse spermatogonial cells. Molecular and cellular biology. 2012;32:3140-52. doi:10.1128/MCB.00006-12
- Kataruka S, Akhade VS, Kayyar B, et al. Mrhl lncRNA mediates meiotic commitment of mouse spermatogonial cells by regulating Sox8 expression. Molecular and cellular biology. 2017. doi:10.1128/MCB.00632-16
- Akhade VS, Dighe SN, Kataruka S, et al. Mechanism of Wnt signaling induced down regulation of mrhl long non-coding RNA in mouse spermatogonial cells. Nucleic acids research. 2015;44:387-401. doi:10.1093/nar/gkv1023
- Uren PJ, Bahrami-Samani E, Burns SC, et al. Site identification in high-throughput RNA-protein interaction data. Bioinformatics. 2012;28:3013-20. doi:10.1093/bioinformatics/bts569
- Gutschner T, Hammerle M, Diederichs S. MALAT1 – a paradigm for long noncoding RNA function in cancer. Journal of molecular medicine. 2013;91:791-801. doi:10.1007/s00109-013-1028-y
- Bailey TL, Boden M, Buske FA, et al. MEME SUITE: Tools for motif discovery and searching. Nucleic acids research. 2009;37:W202-8. doi:10.1093/nar/gkp335
- Mann MB, Black MA, Jones DJ, et al. Transposon mutagenesis identifies genetic drivers of Braf(V600E) melanoma. Nature genetics. 2015;47:486-95. doi:10.1038/ng.3275
- Lee Y, Kim M, Han J, et al. MicroRNA genes are transcribed by RNA polymerase II. EMBO journal. 2004;23:4051-60. doi:10.1038/sj.emboj.7600385
- Chhabra R, Dubey R, Saini N. Cooperative and individualistic functions of the microRNAs in the miR-23a∼27a∼24-2 cluster and its implication in human diseases. Molecular cancer. 2010;9:232. doi:10.1186/1476-4598-9-232
- Clark MB, Johnston RL, Inostroza-Ponta M, et al. Genome-wide analysis of long noncoding RNA stability. Genome research 2012;22:885-98. doi:10.1101/gr.131037.111
- Kong L, Zhang Y, Ye ZQ, et al. CPC: assess the protein-coding potential of transcripts using sequence features and support vector machine. Nucleic acids research. 2007;35:W345-9. doi:10.1093/nar/gkm391
- Wang L, Park HJ, Dasari S, et al. CPAT: Coding-Potential Assessment Tool using an alignment-free logistic regression model. Nucleic acids research. 2013;41:e74. doi:10.1093/nar/gkt006
- Lin MF, Jungreis I, Kellis M. PhyloCSF: A comparative genomics method to distinguish protein coding and non-coding regions. Bioinformatics. 2011;27:i275-82. doi:10.1093/bioinformatics/btr209
- Arrial RT, Togawa RC, Brigido Mde M. Screening non-coding RNAs in transcriptomes from neglected species using PORTRAIT: Case study of the pathogenic fungus Paracoccidioides brasiliensis. BMC bioinformatics. 2009;10:239. doi:10.1186/1471-2105-10-239
- Nelson ADL, Devisetty UK, Palos K, et al. Evolinc: A Tool for the Identification and Evolutionary Comparison of Long Intergenic Non-coding RNAs. Frontiers in genetics. 2017;8:52. doi:10.3389/fgene.2017.00052
- Pang KC, Frith MC, Mattick JS. Rapid evolution of noncoding RNAs: lack of conservation does not mean lack of function. Trends in genetics: TIG. 2006;22:1-5. doi:10.1016/j.tig.2005.10.003
- Ulitsky I, Shkumatava A, Jan CH, et al. Conserved function of lincRNAs in vertebrate embryonic development despite rapid sequence evolution. Cell. 2011;147:1537-50. doi:10.1016/j.cell.2011.11.055
- Deininger P. Alu elements: Know the SINEs. Genome biology. 2011;12:236. doi:10.1186/gb-2011-12-12-236
- Price AL, Eskin E, Pevzner PA. Whole-genome analysis of Alu repeat elements reveals complex evolutionary history. Genome research. 2004;14:2245-52. doi:10.1101/gr.2693004
- Lorenz R, Bernhart SH, Honer Zu Siederdissen C, et al. ViennaRNA Package 2.0. Algorithms for molecular biology: AMB. 2011;6:26. doi:10.1186/1748-7188-6-26
- Renganathan A, Felley-Bosco E. Long Noncoding RNAs in Cancer and Therapeutic Potential. In: Rao MR, ed. Long noncoding RNA biology: Springer Nature Singapore Pte Ltd; 2017.
- Dai TY, Cao L, Yang ZC, et al. P68 RNA helicase as a molecular target for cancer therapy. Journal of experimental & clinical cancer research: CR. 2014;33:64. doi:10.1186/s13046-014-0064-y
- Moore HC, Jordan LB, Bray SE, et al. The RNA helicase p68 modulates expression and function of the Delta133 isoform(s) of p53, and is inversely associated with Delta133p53 expression in breast cancer. Oncogene. 2010;29:6475-84. doi:10.1038/onc.2010.381
- Kramer MF. Stem-loop RT-qPCR for miRNAs. Current protocols in molecular biology. 2011; Chapter 15:Unit 15 0.
- Trapnell C, Roberts A, Goff L, et al. Differential gene and transcript expression analysis of RNA-seq experiments with TopHat and Cufflinks. Nature protocols. 2012;7:562-78. doi:10.1038/nprot.2012.016
- Fuller-Pace FV. The DEAD box proteins DDX5 (p68) and DDX17 (p72): multi-tasking transcriptional regulators. Biochimica et biophysica acta. 2013;1829:756-63. doi:10.1016/j.bbagrm.2013.03.004
- Lanz RB, McKenna NJ, Onate SA, et al. A steroid receptor coactivator, SRA, functions as an RNA and is present in an SRC-1 complex. Cell 1999;97:17-27. doi:10.1016/S0092-8674(00)80711-4
- Watanabe M, Yanagisawa J, Kitagawa H, et al. A subfamily of RNA-binding DEAD-box proteins acts as an estrogen receptor alpha coactivator through the N-terminal activation domain (AF-1) with an RNA coactivator, SRA. EMBO journal. 2001;20:1341-52. doi:10.1093/emboj/20.6.1341
- Jung C, Mittler G, Oswald F, et al. RNA helicase Ddx5 and the noncoding RNA SRA act as coactivators in the Notch signaling pathway. Biochimica et biophysica acta. 2013;1833:1180-9. doi:10.1016/j.bbamcr.2013.01.032
- Akhade VS, Arun G, Donakonda S, et al. Genome wide chromatin occupancy of mrhl RNA and its role in gene regulation in mouse spermatogonial cells. RNA biology. 2014;11:1262-79. doi:10.1080/15476286.2014.996070
- Amaral PP, Mattick JS. Noncoding RNA in development. Mammalian genome: Official journal of the International Mammalian. Genome Society. 2008;19:454-92. doi:10.1007/s00335-008-9136-7
- Johnson R, Guigo R. The RIDL hypothesis: Transposable elements as functional domains of long noncoding RNAs. Rna. 2014;20:959-76. doi:10.1261/rna.044560.114
- Holdt LM, Hoffmann S, Sass K, et al. Alu elements in ANRIL non-coding RNA at chromosome 9p21 modulate atherogenic cell functions through trans-regulation of gene networks. PLoS genetics. 2013;9:e1003588. doi:10.1371/journal.pgen.1003588
- Chen M, Xu R, Ji H, et al. Transcriptome and long noncoding RNA sequencing of three extracellular vesicle subtypes released from the human colon cancer LIM1863 cell line. Scientific reports. 2016;6:38397. doi:10.1038/srep38397
- Li H, Wang X, Fang Y, et al,. Integrated expression profiles analysis reveals novel predictive biomarker in pancreatic ductal adenocarcinoma. Oncotarget. 2017;8(32):52571-52583. doi:10.18632/oncotarget.16732
- Cheriyath V, Kuhns MA, Jacobs BS, et al. G1P3, an interferon- and estrogen-induced survival protein contributes to hyperplasia, tamoxifen resistance and poor outcomes in breast cancer. Oncogene. 2012;31:2222-36. doi:10.1038/onc.2011.393
- Koike Folgueira MA, Brentani H, Carraro DM, et al. Gene expression profile of residual breast cancer after doxorubicin and cyclophosphamide neoadjuvant chemotherapy. Oncology reports. 2009;22:805-13. doi:10.3892/or_00000503
- Desai SD, Reed RE, Burks J, et al. ISG15 disrupts cytoskeletal architecture and promotes motility in human breast cancer cells. Exp Biol Med (Maywood. 2012;237:38-49. doi:10.1258/ebm.2011.011236
- Tsai MH, Cook JA, Chandramouli GV, et al. Gene expression profiling of breast, prostate, and glioma cells following single versus fractionated doses of radiation. Cancer research. 2007;67:3845-52. doi:10.1158/0008-5472.CAN-06-4250
- Ogony J, Choi HJ, Lui A, etal. Interferon-induced transmembrane protein 1 (IFITM1) overexpression enhances the aggressive phenotype of SUM149 inflammatory breast cancer cells in a signal transducer and activator of transcription 2 (STAT2)-dependent manner. Breast Cancer Res. 2016;18:25. doi:10.1186/s13058-016-0683-7
- Wang J, Scholtens D, Holko M, et al. Lipid metabolism genes in contralateral unaffected breast and estrogen receptor status of breast cancer. Cancer Prev Res (Phila). 2013;6:321-30. doi:10.1158/1940-6207.CAPR-12-0304
- Punj V, Matta H, Chaudhary PM. X-linked ectodermal dysplasia receptor is downregulated in breast cancer via promoter methylation. Clin Cancer Res. 2010;16:1140-8. doi:10.1158/1078-0432.CCR-09-2463
- Gilkes DM, Bajpai S, Chaturvedi P, et al. Hypoxia-inducible factor 1 (HIF-1) promotes extracellular matrix remodeling under hypoxic conditions by inducing P4HA1, P4HA2, and PLOD2 expression in fibroblasts. J Biol Chem. 2013; 288:10819-29. doi:10.1074/jbc.M112.442939
- Ko YH, Domingo-Vidal M, Roche M, et al. TP53-inducible Glycolysis and Apoptosis Regulator (TIGAR) Metabolically Reprograms Carcinoma and Stromal Cells in Breast Cancer. Journal of biological chemistry 2016; 291:26291-303. doi:10.1074/jbc.M116.740209
- Chourasia AH, Macleod KF. Tumor suppressor functions of BNIP3 and mitophagy. Autophagy 2015; 11:1937-8. doi:10.1080/15548627.2015.1085136
- Zou P, Liu L, Zheng LD, et al. Cheng Coordinated Upregulation of Mitochondrial Biogenesis and Autophagy in Breast Cancer Cells: The Role of Dynamin Related Protein-1 and Implication for Breast Cancer Treatment. Oxid Med Cell Longev. 2016;2016:4085727. doi:10.1155/2016/4085727
- Li WX, He K, Tang L, et al,. Comprehensive tissue-specific gene set enrichment analysis and transcription factor analysis of breast cancer by integrating 14 gene expression datasets. Oncotarget. 2017;8:6775-86.
- Li RH, Huang WH, Wu JD, et al. EGFR expression is associated with cytoplasmic staining of CXCR4 and predicts poor prognosis in triple-negative breast carcinomas. Oncology letters. 2017;13:695-703.
- Krzeslak A, Wojcik-Krowiranda K, Forma E, et al. Expression of GLUT1 and GLUT3 glucose transporters in endometrial and breast cancers. Pathol Oncol Res. 2012; 18:721-8. doi:10.1007/s12253-012-9500-5
- Pussinen PJ, Karten B, Wintersperger A, et al. The human breast carcinoma cell line HBL-100 acquires exogenous cholesterol from high-density lipoprotein via CLA-1 (CD-36 and LIMPII analogous 1)-mediated selective cholesteryl ester uptake. Biochemical journal. 2000;349:559-66. doi:10.1042/bj3490559
- Takakura S, Kohno T, Manda R, et al. Genetic alterations and expression of the protein phosphatase 1 genes in human cancers. International journal of oncology. 2001;18:817-24.
- Al-Hajj M, Wicha MS, Benito-Hernandez A, et al. Prospective identification of tumorigenic breast cancer cells. Proc Natl Acad Sci U S A. 2003;100:3983-8. doi:10.1073/pnas.0530291100
- Goyette S, Liang Y, Mafuvadze B, et al. Natural and synthetic progestins enrich cancer stem cell-like cells in hormone-responsive human breast cancer cell populations in vitro. Breast cancer. 2017;9:347-57.
- Kim DH, Wirtz D. Focal adhesion size uniquely predicts cell migration. FASEB J. 2013;27:1351-61. doi:10.1096/fj.12-220160
- Tu ZQ, Li RJ, Mei JZ, et al. Down-regulation of long non-coding RNA GAS5 is associated with the prognosis of hepatocellular carcinoma. Int J Clin Exp Pathol. 2014;7:4303-9.
- Lai MC, Yang Z, Zhou L, et al. Long non-coding RNA MALAT-1 overexpression predicts tumor recurrence of hepatocellular carcinoma after liver transplantation. Medical oncology 2012; 29:1810-6. doi:10.1007/s12032-011-0004-z
- Zeng C, Xu Y, Xu L, et al. Inhibition of long non-coding RNA NEAT1 impairs myeloid differentiation in acute promyelocytic leukemia cells. BMC cancer. 2014;14:693. doi:10.1186/1471-2407-14-693
- Qi P, Du X. The long non-coding RNAs, a new cancer diagnostic and therapeutic gold mine. Mod Pathol. 2013;26:155-65. doi:10.1038/modpathol.2012.160
- Fatima R, Akhade VS, Pal D, et al. Long noncoding RNAs in development and cancer: Potential biomarkers and therapeutic targets. Molecular and cellular therapies. 2015;3:5. doi:10.1186/s40591-015-0042-6
- Zhao J, Sun BK, Erwin JA, et al. Polycomb proteins targeted by a short repeat RNA to the mouse X chromosome. Science. 2008;322:750-6. doi:10.1126/science.1163045
- Zhao J, Ohsumi TK, Kung JT, et al. Genome-wide identification of polycomb-associated RNAs by RIP-seq. Molecular cell. 2010;40:939-53. doi:10.1016/j.molcel.2010.12.011
- Glazko GV, Nei M. Estimation of divergence times for major lineages of primate species. Mol Biol Evol. 2003; 20:424-34. doi:10.1093/molbev/msg050
- Arnason U, Adegoke JA, Gullberg A, et al. Mitogenomic relationships of placental mammals and molecular estimates of their divergences. Gene. 2008;421:37-51. doi:10.1016/j.gene.2008.05.024
- Srisawat C, Engelke DR. Streptavidin aptamers: affinity tags for the study of RNAs and ribonucleoproteins. Rna. 2001;7:632-41. doi:10.1017/S135583820100245X
- Porro A, Feuerhahn S, Reichenbach P, et al. Molecular dissection of telomeric repeat-containing RNA biogenesis unveils the presence of distinct and multiple regulatory pathways. Molecular and cellular biology. 2010;30:4808-17. doi:10.1128/MCB.00460-10
- Thomas PD, Campbell MJ, Kejariwal A, et al. PANTHER: A library of protein families and subfamilies indexed by function. Genome research. 2003;13:2129-41. doi:10.1101/gr.772403
- Huang DW, Sherman BT, Tan Q, et al. DAVID Bioinformatics Resources: Expanded annotation database and novel algorithms to better extract biology from large gene lists. Nucleic acids research. 2007;35:W169-75. doi:10.1093/nar/gkm415