
ABSTRACT
mRNA based therapies hold great promise for the treatment of genetic diseases. However, this therapeutic approach suffers from multiple challenges including the short half-life of exogenously administered mRNA and subsequent protein production. Modulation of untranslated regions (UTR) represents one approach to enhance both mRNA stability and translation efficiency. The current studies describe and validate screening methods using a diverse set of 5′UTR and 3′UTR combinations for improved expression of the Arginase 1 (ARG1) protein, a potential therapeutic mRNA target. Data revealed a number of critical aspects which need to be considered when developing a screening approach for engineering mRNA improvements. First, plasmid-based screening methods do not correlate with protein expression driven by exogenously expressed mRNA. Second, improved ARG1 protein production was driven by increased translation and not improved mRNA stability. Finally, the 5′ UTR appears to be the key driver in protein expression for exogenously delivered mRNA. From the testing of the combinatorial library, the 5′UTR for complement factor 3 (C3) and cytochrome p4502E1 (CYP2E1) showed the largest and most consistent increase in protein expression relative to a reference UTR. Collectively, these data provide important information for the development and optimization of therapeutic mRNAs.
Introduction
The ability to therapeutically affect mRNA expression holds great promise for the treatment of rare genetic diseases. To date, a number of approaches for reducing cellular mRNA levels including siRNA and antisense oligonucleotides have reached the clinic [Citation1,Citation2]. However, the ability to upregulate mRNA or increase protein production remains challenging. One approach has been to replace a defective or mutated mRNA with a systemically delivered mRNA encoding the protein target of interest. For example, Zangi et al. used intra-myocardial injection of exogenous luciferase or VEGF-A mRNA to increase local protein production in the heart and improved survival in a preclinical myocardial infarction model [Citation3]. Moreover, lipid nanoparticle formulated mRNA has been successfully delivered to the liver, spleen and lung in preclinical models [Citation4–Citation6]. One major drawback of mRNA based therapy is the relatively short half-life of exogenously delivered mRNA in vivo. For example in the study by Zangi et al., protein expression driven by exogenously administered mRNA returned to baseline within 48–72 hours post-injection [Citation3]. Similar findings were reported with intravenously administered mRNA [Citation4]. Unlike small RNAs, such as siRNA, that can be synthesized to have extended half-lives, in vitro transcribed mRNA is not as amenable to stability conferring chemical modifications. One approach to address this challenge is to optimize the sequence of the exogenously delivered mRNA to increase the stability or translation efficiency within cells.
mRNA untranslated regions (UTR), including the 5′ UTR and 3′UTR, contain multiple regulatory elements and are critical for the stability and translation of mRNA into protein. For example, Warren et al. used an artificial 5′ UTR containing a strong Kozak translation signal and the alpha globin 3′UTR to improve protein production during reprogramming of fibroblasts to induced pluripotent stem cells [Citation7]. Use of the globin 3′UTR represents a logical approach to improve mRNA stability as the globin mRNAs produce large amount of protein and have long half-life [Citation8–Citation10]. However, the cellular context and biology of the target open reading frame may influence overall stability and/or translatability of mRNA. Therefore, use of a single universal UTR to improve protein production from exogenously administered mRNA across different cells types and tissues may or may not be feasible. To this end, no screening approaches have been reported to rapidly identify alternative 5′ and 3′ UTRs to improve mRNA stability for therapeutic mRNA of interest. The purpose of the present studies was to establish a screening approach to identify alternative UTRs with improved expression relative to a reference UTR [Citation7] to improve the stability of arginase I (ARG1) mRNA in multiple cell types. ARG1 deficiency represents a rare genetic disease whereby loss of the ARG1 gene leads to disease pathology and replacement of the ARG1 protein may have clinical benefit [Citation11], therefore, use of ARG1 mRNA open reading frame (ORF) may have clinical utility. Using a UTR combinatorial library two 5′ UTRs were identified, complement factor 3 (C3) and cytochrome p4502E1 (CYP2E1), which improved ARG1 protein expression. Moreover these 5′UTRs showed improved protein expression independent of different 3′ UTRs suggesting the 5′ UTR is critical in driving protein expression from designed mRNAs. Collectively, these data provide important information for the development and optimization of therapeutic mRNAs.
Results
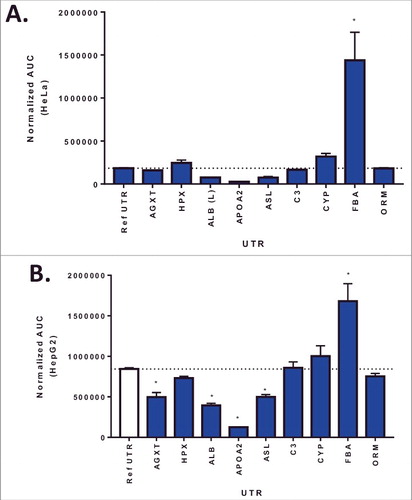
A library of 10 UTR variants containing the ARG1 ORF was selected based on a number of variables including, liver expression levels, 5′ UTR and 3′UTR length, Kozak sequence and functional role (). ARG1 UTR variants were designed and assembled as described in Methods section. To rapidly evaluate the impact of these UTR variants on ARG1 expression, HeLa or HepG2 cells were transiently transfected with plasmid containing the ARG1 construct and protein levels determined 72 hrs post transfection. In both HeLa and HepG2 cells, Fibrinogen alpha (FGA) UTR showed the largest increase in protein expression over the humanized reference UTR [Citation7] (). Interestingly, even though the expression levels in HepG2 cells were higher overall; there was a strong correlation between protein levels in HeLa and HepG2 cells (p = 0.0007; R2 = 0.78) suggesting the cellular context does not impact the rank order of UTR variants in these cell lines.
Table 1. UTRs selected for initial assay validation.
Figure 1. Arginase I protein expression 72hr following plasmid transfection in HeLa (Panel A) or HepG2 cells (Panel B). Columns represent the mean area under the curve as determined by capillary electrophoresis (± 1STDEV). * = p<0.05 vs reference UTR.
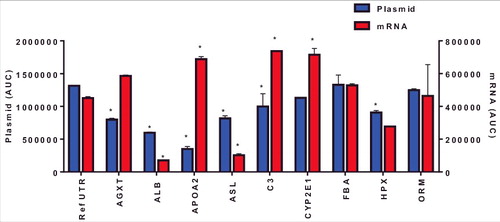
Using plasmids to test mRNA UTR variants represents a faster screening approach as in vitro mRNA production can be cost and time prohibitive for screening. However, the mRNA produced in vitro utilizes modified nucleotides, lacks binding of nuclear proteins and contains an exogenous 5′ modification. Therefore, we sought to evaluate the rank order of ARG1 UTR variant expression between plasmids and in vitro transcribed mRNA. HepG2 cells were transfected with mRNA UTR constructs and ARG1 protein evaluated 72 hrs post-transfection. Data presented in show a different pattern of ARG1 protein expression when compared to plasmid driven expression. Importantly, there was no correlation between protein expression driven by plasmid and in vitro generated mRNA in HepG2 cells (p = 0.23; R2 = 0.17). To determine if this lack of correlation was due to difference in the timing of protein expression between plasmid and mRNA, comparisons were made 24 hrs post-transfection using both mRNA and plasmid (). Similar to data in , mRNA-driven expression of ARG1 containing C3, CYP2E12e1 and APOA2 UTRs showed a significant improvement whilst ASL and ALB UTRs showed reduced expression vs. the reference UTR at this earlier time point. Also critical was that again there was no correlation between protein expression driven by plasmid or exogenously administered mRNA at 24 hrs. (p = 0.63; R2 = 0.029). Collectively these data suggest that using in vitro generated mRNA to drive expression yields differing results, regardless of the time point, when compared to protein expression driven by plasmids and has significant impact on how these UTR variants should be evaluated experimentally.
Figure 2. Arginase I protein expression 72 hr following mRNA transfection in HepG2 cells. Columns represent the mean area under the curve as determined by capillary electrophoresis (± 1STDEV). * = p<0.05 vs reference UTR.
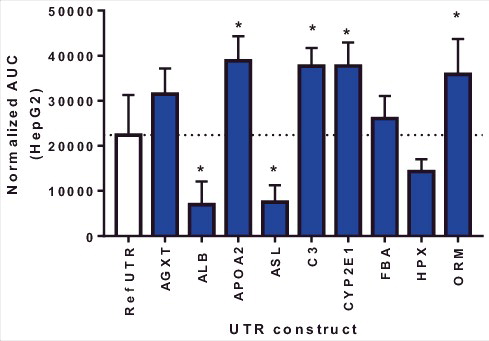
Figure 3. Arginase I protein expression 24 hrs following mRNA or plasmid transfection in HepG2 cells. Columns represent the mean area under the curve as determined by capillary electrophoresis (± 1STDEV). * = p<0.05 vs reference UTR.
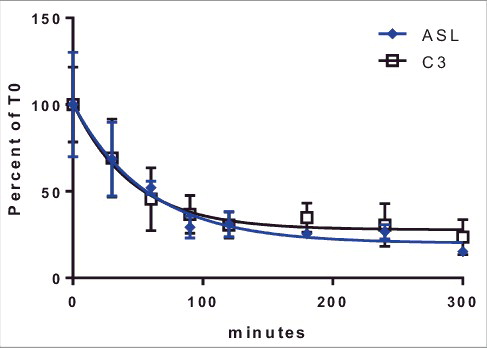
Multiple UTRs were shown to improve protein production from exogenously transfected mRNA. Increased protein production can result from improved mRNA stability, improved translation efficiency or a combination of both factors. To evaluate the impact of UTRs on ARG-1 mRNA stability, half-life studies were done using two UTRs, C3 and ASL. These were selected based on the differential effects vs. the reference UTR. No differences in mRNA half-life were seen between these two constructs () suggesting the differences in protein production were likely due to effects on translation efficiency and not changes in mRNA stability.
Figure 4. Stability of ARG-1 constructs containing ASL or C3 UTRs. Cells were transfected (see Methods Section) with mRNA and incubated for 1 hr. mRNA was removed and cell incubated for indicated time points. mRNA half-life for Arg1 containing C3 (32 min) and ASL (40 min) UTRs was calculated using GraphPad prism. Lines represent Percent change from time 0 (after removal of mRNA from cells) ± 1STDEV.
Having observed the impact of these UTRs on increasing protein expression, we next systematically evaluated the role of the 5′ and 3′ UTRs independently by generating a combinatorial UTR library whereby each 5′UTR was paired with all combinations of 3′UTR from the selected genes (). To improve throughput, protein levels were quantified using a FLAG-based HRTF assay. This allowed for plate based screening of large numbers of UTR variants. HepG2 cells were transfected with mRNA constructs and protein levels were evaluated 72 hrs post transfection. Constructs were ranked based on the relative expression compared to the reference UTR construct (≥1.2 fold = increased expression [+], 0.8–1.9 fold = comparable expression [0], ≤0.79 fold = lower expression [−] vs. reference UTR). Consistent with previous finding (), constructs containing the C3 and CYP2E1 UTR showed the largest and most consistent increase in expression across all of the UTR combination (). In addition, all UTR constructs containing ASL or ALB 5′ UTR showed lower expression vs the reference UTR.
Table 2. Screening results for UTR combinatorial library.
Discussion
The present studies represent the first published report of a systematic evaluation of the impact of alternative UTRs to influence protein production from an exogenously designed mRNA therapeutic. From a drug screening perspective, there were a number of key findings. First, protein production from plasmids containing ARG1 UTR variants differed from that seen with ARG1 UTR from exogenously delivered mRNA. Second, improved protein production was due to increased protein translation efficiency and not improved mRNA stability. Third, modification of the 5′ UTR appears to have the largest impact of protein production. Finally, a higher-throughput screening assay was established to rapidly identify and optimize UTRs for improved protein production from therapeutic mRNAs.
Protein translation is a complex process involving multiple protein-protein and protein-mRNA interactions. This includes a number of RNA binding proteins which bind to the mRNA transcript prior to export from the nucleus [Citation12]. Therapeutic mRNAs which are synthesized in vitro then administered systemically and ultimately delivered to the cytosol, would bypass these traditional mRNA modifications which occur in the nucleus. This may explain the differences in relative protein expression of ARG1 UTR variants based on exogenous mRNA delivery and nuclear mRNA production (e.g. from plasmids). For example, mRNA produced in the nucleus is bound to multiple mRNA export binding proteins which can impact protein production [Citation13]. In addition, mRNA produced ex vivo and optimized for therapeutic applications contains chemical modifications which may impact RNA thermodynamics and structure and subsequent protein translation [Citation14]. No modified mRNA failed to produce protein (data not shown) likely own to the raid degradation on the mRNA transcript.
Another interesting finding is that a majority of the 5′UTR containing C3 and CYP2e1 were able to improve protein translation regardless of the 3′ UTR modification. These data would suggest that the 5′UTR is the primary driver for protein translation from exogenously administered mRNA. This statement is supported by the fact the increase in protein production was not due to improved mRNA stability (). The 5′ UTR plays a critical role in protein translation efficiency as it represents the site of binding for the preinitiation complex initiation of protein translation [Citation15,Citation16]. For example, the eukaryotic initiation factor-4A (eIF4A) binding to the 5′ UTR is important in the unwinding initiation of protein translation [Citation17] and the secondary structure of the 5′ UTR plays a critical role in binding of eIF1A to mRNA [Citation18]. Although the secondary structure of these 5′ UTR is difficult to predict based on the presence of modified nucleotides, it is interesting to speculate that these UTRs may share a common secondary structure which can impact protein translation.
The six nucleotides upstream of the start ATG are known as the Kozak initiation site and greatly impact the efficiency of protein translation and are located at the junction of the 5′ UTR and the open reading frame [Citation19]. As the ARG-1 ORF in all of these constructs was the same starting from the start ATG, the upstream sequence, which differed, may impact the efficiency of protein translation. Interestingly C3 and CYP2E12e1 showed very similar Kozak sequences (GCACCATG; see ) suggesting this Kozak sequence may be optimal for ARG1 expression from this exogenously administered mRNA. Further support for the critical role of the Kozak site in these UTRs is that both of these UTRs showed improved protein expression regardless of the 3′UTR that was added in the combinatorial library ().
Although the current studies provide a framework for design and optimization of UTR for therapeutic mRNAs there are some limitations. For example, the current UTR optimization was carried out using a therapeutically relevant ORF, ARG-1. It is unclear if these optimized UTRs would translate across different open reading frames. A different ORF may affect the mRNA secondary structure and therefore impact RNA translation efficiency. As a caveat, microRNA binding sites were not evaluated in choosing the UTRs for testing, and for some of the constructs we used alternative 3′UTRs so some of the constructs from the same gene may have different microRNA binding sites. However, the current studies provide the experimental framework for a high throughput, plate-based screening assay to simultaneously evaluate hundreds of UTR combinations and modifications to address not only the impact of different ORFs but also minor modification to the protein regulatory sites (e.g. Kozak modification).
In summary, the current studies provide important information regarding the optimization of UTRs, highlight the critical role of the 5′UTR in improving protein translation and define a screening approach to identify and optimize mRNA protein translation for therapeutic mRNA drug development.
Methods
Vector design
All mRNA constructs were designed to start with a GGGA prior to the initiation of the 5′UTR. For cloning, BSMS1 sites in the UTR and ARG1 ORF (NM_000045) were altered to retain protein coding sequence but eliminate the restriction site. ARG1 sequence was inserted based on the start ATG. For assay development and protein detection both a c-myc and Flag tag were added at the end of the ARG1 ORF. To terminate protein translation, three in-frame stop codons were added downstream of the FLAG insert. A 100NT poly A repeat was added to the end of the 3′UTR. All mRNA constructs were synthesized and cloned into a proprietary CMV and T7 containing vector by GeneWiz (Cambridge, MA).
mRNA synthesis
mRNA was transcribed with T7 RNA polymerase from SAPI-linearized plasmid DNA templates including a T7 RNA polymerase promoter and ∼100 bp-long poly dA/dT template sequence. An expected >85% 7mGppp-capping (Cap 0) was completed co-transcriptionally with the inclusion of cap analog and reduced GTP concentration. Where uridine-modifications were included, the modified UTP replaced UTP in the transcription reaction at 100%. Transcription reactions were run for 3 hrs at 37°C, with NTP concentrations ranging from 3 mM to 6 mM. Following treatment with DNase I for 1 hour at 37°C, full-length mRNA transcripts were purified from transcription components and truncated products by oligo-dT affinity purification.
Plasmid transfection
Cells were plated in 24 well tissue culture plates (Hela 50,000 cells per well; HepG2 100,000 cells per well) in MEM with 10% FBS prior to day of transfection. The following day cells were transfected with 1.25 µg of plasmid DNA with 2 µl of Lipofectamine 2000 (Hela; Thermo Fisher Scientific, Waltham, MA) or 6 µl of Viafect (HepG2; Promega, Madison, WI) per well following the manufacture's protocol. Appropriate volume of plasmid was dissolved in OptiMEM to make up to 100 µl. All cells were harvested at 24 or 72 hrs post transfection and processed for protein analysis.
mRNA transfection
Cells were plated in 24 well tissue culture plates (Hela 50,000 cells per well; HepG2 100,000 cells per well) in MEM with 10% FBS prior to day of transfection. The following day cells were transfected with 125 ng of mRNA with 4 ul of Messenger Max (ThermoFisher Scientific, Waltham, MA) per well following the manufacture's protocol. Appropriate volume of mRNA was dissolved in OptiMEM to make up to 100 ul. All cells were harvested at 24 or 72 hrs post transfection and processed for protein analysis.
Protein detection
Cells were collected at 24 h and 72 h in lysis buffer (Tris HCl, 250 mM, pH 8; NaCl, 750 Mm; EDTA, 5 Mm; NP-40, 5%). Total protein concentration was determined using BCA assay (ThermoFisher Scientific, Waltham, MA) and following the manufacturer's protocol. After determining the protein concentration, 0.05 µg/ml protein was loaded to be run on simple western capillary electrophoresis WES machine (Protein Simple, San Jose, CA) and protein detected by ARG1 specific primary antibody (Abcam, Cambridge, MA). Band intensities were quantified by determination of area under curve of ARG1 for each sample and the values were normalized to housekeeper vinculin (Cell Signaling Technology, Danvers, MA).
HTRF assay
For high throughput screening of UTR variants Flag HTRF competition assay (Cisbio, Bedford, MA) was used. Cells were collected in lysis buffer (Tris HCl, 250 mM, pH 8; NaCl, 750 Mm; EDTA, 5 Mm; NP-40, 5%)). Total protein concentration was determined using BCA kit. After determining protein concentration; 6.25 µg/ml of protein was diluted in lysis buffer and 10 µl sample was used in the experiment and the assay was performed as per manufacture's protocol. Bacterially produced flag tagged arginase I protein was used to determine a standard curve for the assay to ensure linearity of results. Samples were incubated at room temperature in dark for 2 hours, after which plate was read in Synergy Neo plate reader according to manufacturer's specification. The reading was obtained as a ratio and was analyzed by normalizing all data to reference UTR.
RT-PCR
mRNA levels and stability was determined in a 96 well format using Cell-CT (Thermo Fisher Scientific, Waltham, MA) RT-PCR reagent. HeLa cells grown plated at 5000 cells per well the day prior to transfection in MEM with 10% FBS. The following day cells were transfected with 125 ng per well of mRNA using mRNA-in (MTI GlobalStem, Gaithersburg, MD) transfection reagent according to the manufacturer's protocol. Briefly, a stock master transfection mix was prepared for each mRNA and, after a 5 min incubation, the transfection reaction was aliquot to each well and the plate incubated at 37oC for 1 hr. Following the 1 hr incubation, all media was removed and all wells washed 4 times with 1X PBS. After the final wash, 100 µL of fresh 37oC media was added and the plate returned to the incubator. For each selected time point, media was removed by pipette and 50 µL of lysis regent from Cells-CT kit was added. RNA extraction and rt-PCR was performed according to manufacturer's protocol. For 0 time point, cells were washed after 1 hr incubation with transfection and cells immediately lysed. PCR was run using an ARG1 and PPIB (housekeeper control for normalization) TaqMan primers (ThermoFisher, Waltham, MA). Expression changes were calculated using delta-delta CT.
Statistical analysis
Group comparisons were made using a standard one-way ANOVA followed by a Dunnett's post-hoc analysis vs. reference UTR. Statistical significance was set at p≤0.05. All statistical analysis and graphing was done using GraphPad Prism (La Jolla, CA).
Disclosure of potential conflicts of interest
No potential conflicts of interest were disclosed.
Additional information
Funding
References
- Bobbin ML, Ross JJ. RNA Interference (RNAi)-Based Therapeutics: Delivering on the Promise? Annu Rev Pharmacol Toxicol. 2016;56:103–122.
- Stein C, Castanotto D. FDA-Approved Oligonucleotide Therapies in 2017. Mol Ther. 2017;25:1069–1075.
- Zangi L, Lui KO, von Gise A, et al. Modified mRNA directs the fate of heart progenitor cells and induces vascular regeneration after myocardial infarction. Nat Biotechnol. 2013;31:898–907.
- Pardi NS, Tuyishime H, Muramatsu K, et al. Expression kinetics of nucleoside-modified mRNA delivered in lipid nanoparticles to mice by various routes. J Control Release. 2015;217:345–351.
- Kaczmarek JC, Patel AK, Kauffman KJ, et al. Polymer-Lipid Nanoparticles for Systemic Delivery of mRNA to the Lungs. Angew Chem Int Ed Engl. 2016;55:13808–13812.
- Kauffman KJ, Mir FF, Jhunjhunwala S, et al. Efficacy and immunogenicity of unmodified and pseudouridine-modified mRNA delivered systemically with lipid nanoparticles in vivo. Biomaterials. 2016;109:78–87.
- Warren L, Manos PD, Ahfeldt T, et al. Highly efficient reprogramming to pluripotency and directed differentiation of human cells with synthetic modified mRNA. Cell Stem Cell. 2010;7:618–630.
- Lodish HF, Small B. Different lifetimes of reticulocyte messenger RNA. Cell. 1976;7:59–65.
- Volloch V, Housman D. Stability of globin mRNA in terminally differentiating murine erythroleukemia cells. Cell. 1981;23:509–514.
- Ross J, Sullivan TD. Half-lives of beta and gamma globin messenger RNAs and of protein synthetic capacity in cultured human reticulocytes. Blood. 1985;66:1149–1154.
- Burrage LC, Sun Q, Elsea SH, et al. 2015; Human recombinant arginase enzyme reduces plasma arginine in mouse models of arginase deficiency. Hum Mol Genet. 24:6417–6427.
- Müller-McNicoll M, Neugebauer KM. How cells get the message: dynamic assembly and function of mRNA-protein complexes. Nat Rev Gene. 2013;14:275–287.
- Wickramasinghe VO, Laskey RA. Control of mammalian gene expression by selective mRNA export. Nat Rev Mol Cell Biol. 2015;16:431–442.
- Harcourt EM, Kietrys AM, Kool ET. Chemical and structural effects of base modifications in messenger RNA. Nature. 2017;541:339–346.
- Hinnebusch AG, Ivanov IP, Sonenberg N. Translational control by 5′-untranslated regions of eukaryotic mRNAs. Science. 2016;352:1413–1416.
- Sonenberg N, Hinnebusch AG. Regulation of translation initiation in eukaryotes: mechanisms and biological targets. Cell. 2009;136:731–745.
- Jaramillo M, Dever TE, Merrick WC, et al. RNA unwinding in translation: assembly of helicase complex intermediates comprising eukaryotic initiation factors eIF-4F and eIF-4B. Mol Cell Biol. 1991;11:5992–5997.
- Svitkin YV, Pause A, Haghighat A, et al. The requirement for eukaryotic initiation factor 4A (elF4A) in translation is in direct proportion to the degree of mRNA 5′ secondary structure. RNA. 2001;7:382–394.
- Kozak M. An analysis of 5′-noncoding sequences from 699 vertebrate messenger RNAs. Nucleic Acids Res. 1987;15:8125–8148.