
ABSTRACT
Deregulation of tRNAs, aminoacyl-tRNA synthetases and tRNA modifying enzymes are common in cancer, raising the hypothesis that protein synthesis efficiency and accuracy (mistranslation) are compromised in tumors. We show here that human colon tumors and xenograft tumors produced in mice by two epithelial cancer cell lines mistranslate 2- to 4-fold more frequently than normal tissue. To clarify if protein mistranslation plays a role in tumor biology, we expressed mutant Ser-tRNAs that misincorporate Ser-at-Ala (frequent error) and Ser-at-Leu (infrequent error) in NIH3T3 cells and investigated how they responded to the proteome instability generated by the amino acid misincorporations. There was high tolerance to both misreading tRNAs, but the Ser-to-Ala misreading tRNA was a more potent inducer of cell transformation, stimulated angiogenesis and produced faster growing tumors in mice than the Ser-to-Leu misincorporating tRNA. Upregulation of the Akt pathway and the UPR were also observed. Most surprisingly, the relative expression of both misreading tRNAs increased during tumor growth, suggesting that protein mistranslation is advantageous in cancer contexts. These data highlight new features of protein synthesis deregulation in tumor biology.
Introduction
Cancer is a multifactorial disease driven by the accumulation of DNA mutations, chromosomal aberrations and epigenetic alterations [Citation1]. Transcriptional, post-transcriptional and translational deregulations are also well established, however little is known about the contribution of translational errors to tumor initiation and growth. Eukaryotic cells translate mRNA with average basal error levels of 10−3 to 10−4 amino acid misincorporations per codon, resulting in at least one misincorporated amino acid in 15% of average length proteins [Citation2–Citation4]. Cells cope relatively well with this level of aberrant protein synthesis and it is controversial whether such errors play any role in cell degeneration, aging or disease [Citation4–Citation7]. However, recent mistranslation studies carried out in model organisms show that translational error rates marginally above the normal background level lead to accumulation of misfolded proteins [Citation4, Citation8–Citation10], saturation of protein quality control (PQC) systems, proteotoxic stress, re-wiring of chaperone-clients interaction networks and to wide deregulation of cellular functions [Citation9]. Whether mistranslation is elevated in tumors and produces phenotypes related to these observed in model systems is not yet clear, but translational fidelity depends on tight regulation of tRNAs, aminoacyl-tRNA synthetases (aaRSs), RNA modifying enzymes (RNAmod), translation elongation factors (eEFs), ribosomal RNA (rRNA) processing, ribosome assembly and amino acid supply, which are frequently deregulated in tumors [Citation11–Citation18]. Interestingly, such deregulation results in the misincorporation of amino acids with similar chemical properties explaining, at least in part, the high tolerance of various organisms to high levels of protein synthesis errors [Citation7]. Moreover, the cellular responses to conservative (frequent) and disruptive protein mutations (less frequent) are different in human cells, with disruptive mutations being associated with increased cell death and proliferation inhibition [Citation19].
Protein mutations arising from translational errors trigger the unfolded protein response (UPR) and autophagy [Citation20]. In general, mistranslated proteins sequester BiP, activate the UPR sensors PERK, IRE-1 and ATF6, upregulating molecular chaperones lipid synthesis and Endoplasmic Reticulum Associated Degradation (ERAD) pathways. Degradation of misfolded proteins is essential for tumor initiation and maintenance [Citation21] and tumor cells highjack the endoplasmic reticulum (ER) adaptive measures to thrive [Citation22], explaining the role of the UPR in tumor malignancy, aggressiveness and therapy resistance [Citation23–Citation25].
Despite those putative connections between protein mistranslation and cancer, technical difficulties in the identification and quantification of protein mistranslation events have prevented the clarification of the role of mistranslation in cancer and other human diseases [Citation7]. Indeed, protein mistranslation events, whose frequency ranges from 10−4 to 10−3, produce low number of mutant peptides whose detection is highly complex. In addition, mixtures of these rare peptides produced by trypsin diggestion of proteomes are truly challenging to detect, even when the most sophysticated mass spectrometry instruments and software methods are used [Citation26]. Moreover, radioactive and/or chemiluminescence methods normally used to quantify protein synthesis errors in cell cultures are not applicable to solid tumors or tissue biopsies [Citation9, Citation27–Citation31] complicating this issue even further. To circumvent those technical limitations, we have used highly sensitive MS/MS methods, and MS/MS spectra searching engines that are able to identify rare peptides in proteins whose occurrence depends on the rules that govern mRNA decoding by the ribosome (knowledge based targeted searches). These approaches allowed us to demonstrate that: 1) tumors mistranslate at higher level than normal tissue; 2) codon misreading tRNAs are selected during tumor evolution, and; 3) translational errors alone increase cell transformation and promote tumor growth. To achieve these results, we have determined the relative level of amino acid misincorporations in tumors and engineered NIH3T3 cell lines that misincorporate Ser at both Ala (frequent mistranslation event in tumors) and Leu (infrequent mistranslation event in tumors) codon sites. In vitro data showed no visible effects on cell viability, but cell transformation, angiogenesis, tumor growth, activation of the UPR and other cancer-related pathways, were evident in vivo in chicken and mouse models.
Results
Tumors mistranslate at higher rates than normal tissues
To clarify whether translational fidelity is deregulated in tumors, we carried out a detailed analysis of the relative amino acid misincorporation frequencies, in both normal and susbtitute for tumors human samples, as well as in mouse xenograft tumors derived from two human epithelial cancer cell lines (NCI-H460 and MKN74). For this, we have implemented a mass spectrometry data analysis pipeline to identify peptides containing amino acid misincorporations in complex MS/MS label free raw data sets of normal colon, colon adenocarcinoma (COAD) and xenograft tumor samples. We used MS/MS data sets produced by the National Cancer Institute Clinical Proteomic Tumor Analysis Consortium (CPTAC) (https://cptac-data-portal.georgetown.edu/cptacPublic/) and our own MS/MS data sets produced with xenograft tumors. Normal colon samples were randomly selected, while COAD samples were grouped in disease stages (I and IV) to represent tumors in early and advanced stages. All MS/MS datasets were analyzed using the same bioinformatics pipeline (Fig. S1).
We started by analyzing independently the global error rate of normal colon samples and tumor samples from COAD patients. The global error rate of normal samples was 1.92 × 10⁻³ ± SEM per amino acid decoded. While the error rate of Stage I and Stage IV COAD samples was 4.42 × 10⁻³ ± SEM (p < 0.01) and 4.67 × 10⁻³ ± SEM, respectively. For Stage IV, data showed high dispersion of values likely reflecting the high heterogeneity in cell type composition present in advanced tumors, including tumor, stromal, support and immune cells in different proportions. To clarify whether tumor cells were the main contributors to the global error rate detected, and whether the error values obtained for COAD tumors could be extrapolated to other tumor types, we determined the error rate of tumors derived from two different human cancer cell lines grown in mice, namely MKN-74 (Gastric tubular adenocarcinoma) and H460 (Non-Small Cell Lung Cancer), in which more than 90% of the tumor mass is composed of tumor cells. The mistranslation rate of the MKN74-derived tumors was 6.85 × 10⁻³ ± SEM and that of H460-derived tumors was 7.81 × 10⁻³ ± SEM; i.e., 3.4-fold (p < 0.05) and 4.2-fold (p < 0.01) higher that the average error observed in normal tissue samples (). The frequency of misincorporation of different amino acids at the protein sites corresponding to each codon family was also determined. Stage I COAD samples present a clear error elevation at all codon family sites, relative to normal tissue, which was significant for Ala (A) and Asn (N) (p < 0.01 and p < 0.001, respectively). On the other hand, we observed an increase in error frequency at all protein primary sites except for Asn in Stage IV COAD samples, relative to normal tissue (). Interestingly, Asn sites were the most error prone sites in both tumors and normal tissue ().
Figure 1. Tumors mistranslate at higher rates than normal tissue. A) Normal colon samples and colon adenocarcinoma (COAD) samples from patients and xenograft tumors derived from two epithelial cancer cell lines H460 and MKN74 cell lines were analysed (n = 3). For each sample we counted the total number of mutations in the proteome, obtained using a blind search approach with the SPIDER tool in PEAKS8 software against Homo sapiens reference proteome. The misincorporation count was normalized for the total number of amino acids in the sample. The data show that these tumors have higher error rates, than the normal samples analyzed. Normal Colon Samples and COAD samples raw MS/MS data was generated by the CPTAC consortium. B) Analysis of amino acids misincorporated at protein primary structure sites (codon/amino acid family sites) showing that Stage I COAD samples had a clear error elevation at all codon family sites, relative to normal tissue, especially for Ala (A) and Asn (N). Also, on Stage IV COAD samples we observed an increase in error frequency at all protein primary sites except for Asn (N), relative to normal tissue. The total number of amino acids misincorporated at each protein site was normalized to the total number of peptides present in each sample dataset. Letters in the X axis represent the 20 amino acids and errors correspond to the total number of non-cognate amino acids misincorporated. For example N = total number of Asn sites present in the dataset that contain at least one misincorporation. Data was analyzed by two-tailed unpaired Student's t-test. Significant p-values are shown (*p < 0.05; ** p < 0.01; *** p < 0.001). Graphics depicts average +/- SEM (n = 3-5). C) Misincorporations of Serine at Alanine sites were the most frequent found in tumor xenograft samples and misincorporations of Serine at Leucine sites were among the least common. We determined the number of specific misincorporations and normalized them to the total number of peptides present in each sample data set. Graphics B and C depict average +/- SEM (n = 3).
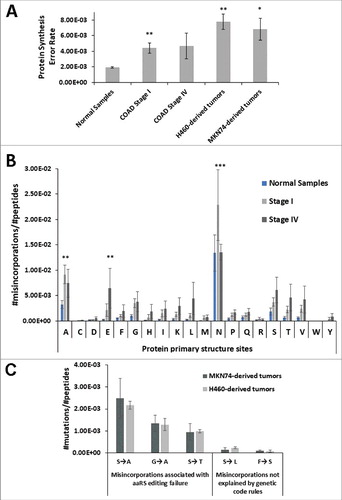
We next analyzed the frequency of specific misincorporations in MKN74- and H460-derived tumors, where more than 90% of the tumor mass is composed of tumor cells. As the complexity of the MS/MS data space was very high, we focused our efforts on the identification of a sub-group of errors associated with tRNA misacylation by Class II aaRS (probable errors that involve chemically similar amino acids) and in errors that cannot be explained by tRNA misacylation, near-cognate codon decoding, or other genetic code rules (improbable errors). Our expectation was that the theoretically probable errors predicted by genetic code rules would occur in proteins at much higher frequency than the theoretically improbable errors. We verified that, among errors associated with tRNA misacylation by Class II aaRS, Ser misincorporations at Ala codon sites were the most frequent errors found in proteins from xenograft tumors (). Misincorporations of Phe at Ser and Ser at Leu codon sites, that do not conform with genetic code rules, were present at much lower level in the proteins of our dataset (rare misincorporation), confirming previous data showing that mistranslation rates are amino acid and codon specific [Citation27, Citation33].
We then evaluated the relevance of both frequent (probable) and infrequent (improbable) errors in cancer. Since evolutionary optimization of the genetic code minimizes the impact of mistranslation on protein structure [Citation4], we reasoned that theoretically probable misincorporations should be less deleterious (involving chemically similar amino acids; conservative and semi-conservative mutations), than those involving theoretically unlikely errors (involving chemically distinct amino acids; non-conservative mutations). To address this hypothesis, we decided to alter the anticodon of a Ser-tRNA to produce mutant Ser tRNAs that incorporate Ser at Ala (frequent) and at Leu (infrequent) codon sites on a proteome wide scale. The Ser-tRNA was chosen as proof of concept because its anticodon can be mutated to multiple anticodons, without affecting its acylation specificity by the SerRS [Citation19].
Mammalian cell lines are highly tolerant to codon misreading tRNAs
We constructed mutant tRNAs that decode Ala-GCU/GCC (tRNASerAla), and Leu-CUU/CUC (tRNASerLeu) codons ) as Ser. These Ser misincorporating tRNA genes were then cloned into the pIRES2-DsRed and were transfected into NIH3T3 cells. Cell lines stably expressing the engineered tRNAs were then selected for phenotypic characterization ). Cells transfected with the empty vector (Mock) were used as control. The transfection efficiency was determined by Real-Time PCR, using the pIRES2 DsRed gene as a readout probe and the data showed 100% transfection efficiency for the Mock and tRNASer(Ala) cell lines, and 72% for the tRNASer(Leu) cell line. The integration of the misreading tRNA genes into the genome the genome of the transfected cells was further confirmed by PCR and Sanger sequencing (Fig. S2A). tRNA expression was determined using a primer extension assay (SNaPshot analysis) that permitted the detection of each mutant misreading tRNA and also the endogenous WT tRNASer gene. The expression level of the endogenous WT tRNASer was 19.4-fold higher than the mutant tRNASer(Ala) and 49.5-fold higher than the mutant tRNASer(Leu) ().
Figure 2. I n vitro phenotypic effects induced by misreading tRNAs. A) Schematic tRNA model. Left panel) The human tRNASer AGA gene (Chr6 tRNA#5), was cloned into pIRES2-DsRed plasmid and misreading constructs were generated by site-directed mutagenesis (green: Ala(AGC) and red: Leu(AAG)). Domains highlighted in grey are important for tRNASer recognition by SerRS. Right panel) Serylated misreading tRNAs misincorporate Ser at the non-cognate codons indicated. B) Expression of misreading tRNAs on stably expressing cells was confirmed using SNaPshot. Samples were sequenced and analyzed using Peak Scanner software. The endogenous copies of tRNASer were 32 and 49.5-fold more expressed than tRNASer(Ala) and tRNASer(Leu) respectively. Grey: Non-mutated Serine tRNA; Black: Misreading Serine tRNA. C) Percentage of cells in necrosis, early and late apoptosis were determined by flow cytometry using AnnexinV-FITC (1:100) and Propidium iodide (2.5µg/ml) staining. D) The number of foci arising from NIH3T3 cells was counted after 13–21 days after transfection. Data represents average ± SEM (n = 2-3) and was analyzed with Kruskal-Wallis with Dunnett's post-test using Mock cell line as control. There are no significant differences among cell lines (p > 0.05).
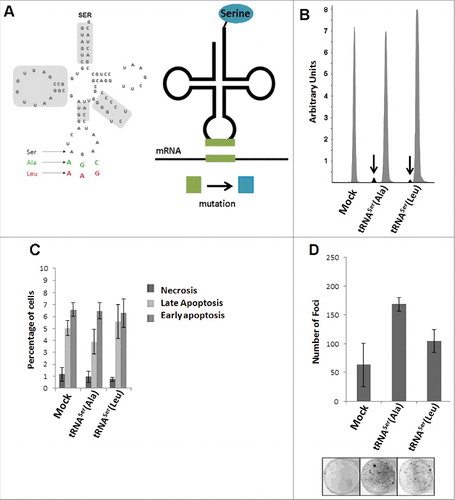
We used cell viability, proliferation and apoptosis assays to evaluate the phenotypic consequences of substitute for expressing the mutant misreading tRNAs in the NIH3T3 cells. Trypan Blue staining showed no impact on viability (Fig. S2B) and the Annexin V Apoptosis assay showed a basal necrosis level (≤1% of cells) and low percentage of cells in late (ca. 5% of cells) and early apoptosis (7-8% of cells) (). Cell proliferation was also not significantly affected (Fig. S2C), and cell cycle progression demonstrated a similar pattern in all cell lines (Fig. S2D), indicating that NIH3T3 cells tolerated well the mutant misreading tRNAs. However, these mutant tRNAs increased the production of foci in vitro (), raising the hypothesis that they have the potential to transform NIH3T3 cells.
Phenotypic traits induced by misreading tRNAs are exposed by cancer microenvironment stimuli
Previous works carried out in our laboratory, using yeast as a mistranslation model, showed that mistranslation is mostly deleterious under normal growth conditions, but can be advantageous if cells are exposed to environmental stress [Citation31]. Since, in the present work the mutant misreading tRNAs were well tolerated and did not produce advantageous or deleterious phenotypes in vitro, we reasoned that external stimuli could be necessary to reveal putative adaptive phenotypic variation. To clarify this issue, we exposed the NIH3T3 cell lines expressing Mock and the mutant misreading tRNAs to the pro-inflammatory tumor necrosis factor alpha (TNF-α) for different time periods and used Akt and p38 phosphorylation as phenotypic readouts (Akt-P/Akt and p38-P/p38) (Figs. 3 and S3). The p38 pathway was activated in tRNASer(Leu) cells after 30 minutes and persisted up to 4 hours of exposure (3.43 and 2.1-fold change, respectively). A slight activation was also observed in tRNASer(Ala) expressing cells at 30 minutes, but was lost after 4h (). The Akt pathway was only significantly activated in tRNASer(Ala) expressing cells after 30 minutes (2.6-fold change) (). This responsiveness to external stimuli and the tendency to increase transformation ability in vitro, lead us to hypothesize that cells expressing misreading tRNAs could have a growth advantage if inoculated in vivo.
Figure 3. Pathways activated by TNFα induction. A) Treatment of cells expressing the misreading tRNAs with TNFα (30ng/ml) for 30 minutes. Upper panel) Relative activation ratios of p38 in cell lines exposed to TNFα. Middle pannel) Relative activation ratios of Akt in cell lines exposed to TNFα. Lower panel) Representative immunoblots of p38-P, total p38, Akt-P and total Akt in cell lines. β-tubulin was used as a loading control. B) Treatment of cells expressing the misreading tRNAs expressing cell lines with TNFα (30ng/ml) for 4 hours. Upper panel) Relative activation ratios of p38 in cell lines exposed to TNFα. Middle panel) Relative activation ratios of Akt in cell lines exposed to TNFα. Lower panel) Representative Immunoblots of p38-P, total p38, Akt-P and total Akt in cells lines. β-tubulin was used as a loading control. Data represents average ± SEM (n = 3) and was analyzed using Kruskal-Wallis with Dunnett's post-test and relevant p-values are displayed (*p < 0.05; **p < 0.01).
Expression of misreading tRNAs promotes tumor growth in vivo
We tested the behavior of the cells expressing the mutant misreading tRNAs in the in vivo chick chorioallantoic membrane assay (CAM), taking particular attention to their effect in angiogenesis and growth (tumorigenic potential) relative to Mock cells. Only cells expressing tRNASerAla produced larger tumors and had stronger angiogenic response in the CAM assay ). These results were further confirmed by inoculating cells expressing tRNASer(Ala), tRNASer(Leu) or K-rasV12 (positive control for tumorigenesis) on the left dorsal flank of at least five mice (for each cell line) and control cells (Mock) on the corresponding right dorsal flank of every mice. Within 14 to 21 days post-inoculation (p.i.), tumors were produced by cells expressing K-rasV12 (5/5 mice), tRNASer(Ala) (6/6 mice) and tRNASer(Leu) (5/5 mice) (). At day 27 p.i., 11/16 (68.8%) mice inoculated with Mock cells developed smaller sized tumors. At this stage (day 27 p.i.), tumors produced by cells expressing tRNASer(Ala) were the largest. At day 31 p.i., the experiment was terminated; tRNASer(Ala) and K-rasV12 tumors were similar in size distribution and were statistically different from Mock tumors (p<0.01) (). This experiment showed that the mutant tRNASer(Ala) mimicked the effect of K-rasV12, and accelerated significantly tumor growth, while Ser misincorpoartion at Leu resulted in tumors that were marginally larger than those produced by control Mock cells.
Figure 4. Impact of mistranslation on angiogenesis and tumor formation in vivo. A) CAM assay. Upper panel) Representative images of tumors and vessels produced by cell lines expressing Mock, tRNASer(Ala) and tRNASer(Leu). Lower panel, left) Quantitative evaluation of new vessels' formation. Lower panel, right) Relative tumor area. Data is presented as the percentage relative to Mock. Graphics depict average ± SEM (n = 12-14). Data was analyzed by two-tailed paired Student's t test (*p < 0.05; **p < 0.01). B) Tumorigenic capacity of misreading tRNAs in mice. Upper panel) Kinetics of tumor growth determined after inoculation of cells expressing Mock plasmid, the tRNASer(Ala), tRNASer(Leu) and K-rasV12 (positive control) constructs. Middle panel) Quantitative evaluation of tumor area at 31 days p.i.. Graphics depict the average ± SEM (n = 5-11). Data was analyzed by Kruskal-Wallis with Dunnett's post-test (**p<0.01). Lower panel) Photographs of representative tumors, H&E and Ki67 staining (40x amplification) from each condition. C) Expression of misreading tRNAs in mice tumors measured by SNaPshot. Samples were sequenced and analyzed using Peak Scanner software. Expression of the misreading tRNASer(Ala) and tRNASer(Leu) were 4 and 5.9-fold lower than the endogenous tRNASer, respectively. Grey: Non-mutated Serine tRNA; Black: Misreading Serine tRNA.
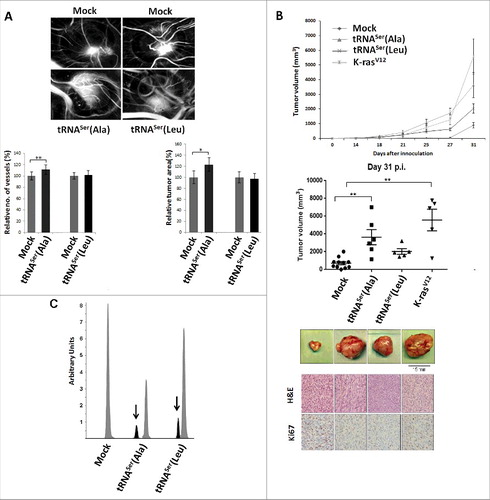
Histological characterization of resected tumors unveiled high grade sarcomas with high proliferative index, as determined by Ki67 labeling (, Fig. S4C). Histopathological analysis of murine organs (ganglion, lung, kidney, liver, bladder, pleura and stomach), collected at day 31 p.i., revealed the presence of lung metastases in K-rasV12 expressing tumors, and no metastases in all other mice.
DNA extracted from tumors, from both CAM and mice experiments, was sequenced and genomic incorporation of all plasmids was validated (Fig. S4A,B). tRNA expression in mice tumors was determined using the primer extension assay described above. Surprisingly, expression levels of misreading tRNAs was much higher in tumors recovered from mice than in the corresponding cell lines cultured in vitro, i.e., 8- and 8.4-fold higher for the tRNASer(Ala) and tRNASer(Leu), respectively when compared to the endogenous WT tRNA genes ). In other words, expression of misreading tRNAs increased during tumor evolution, suggesting that codon misreading is advantageous for tumor cells, and supporting the above findings that phenotypic traits induced by misreading tRNAs are exposed by microenvironment stimuli present in vivo (,).
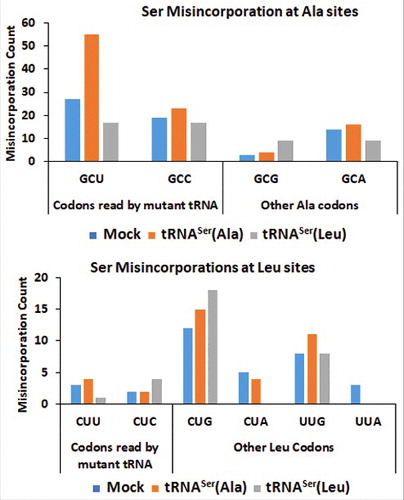
To confirm that the mutant misreading tRNAs mediated the elevation of Ser misincorporation into proteins, we analyzed the soluble protein fraction (SF) of the tumors recovered from mice, resourcing to the MS/MS data analysis approaches used before. To further validate our methodology, we investigated whether Ser was misincorporated at the codon sites decoded by our mutant tRNAs. As expected, the data confirmed the increase in the incorporation of Ser at Ala sites (GCU codon) in the cell line containing the misreading tRNASer(Ala) (). But, we could only detect a small increase of Ser misincorporation at the near-cognate Leu CUC codon sites. Since Ser (polar amino acid) misincorporation at Leu sites (hydrophobic amino acid) is highly disruptive, we postulate that Ser-Leu mistranslated proteins are mainly degraded by the proteasome, making the detection of Ser-to-Leu misincorporations by MS/MS much harder to achieve ().
Figure 5. – Misreading tRNAs misincorporate Ser at Ala and Leu coon sites. Upper Panel) Graphic depicts the absolute number of misincorporations of Ser detected at Ala sites in the soluble fraction of proteins extracted from tumors derived from our cell lines. There was a relative increase in the incorporation of Ser at Ala sites in the cell line expressing the misreading tRNASer(Ala) at the cognate codon GCT only. tRNASer(Leu) expressing cell line was used as a negative control to show that the increase in misincorporations is induced by tRNASer(Ala). Lower Panel) Graphic depicts the absolute number of misincorporations of Ser detected at Leu sites in the soluble fraction of proteins extracted from tumors derived from our cell lines. We detected an increase of Ser to Leu misincorporations at the near-cognate codon CTC. tRNASer(Ala) expressing cell line was used as a negative control to show that the increase in misincorporations is induced by tRNASer(Leu).
Expression of misreading tRNAs activates the UPR
Since our heterologous tRNAs were able to increase amino acid misincorporation levels in tumors, it is likely that PQC mechanisms were upregulated to mitigate protein misfolding. One of the pathways that was proven to be of utmost importance to tumor cell survival during proteotoxic stress is the UPR. This pathway is both frequently activated in cancer and is also an endpoint of protein mistranslation [Citation9, Citation34], therefore, we have tested whether it was activated in our models, by monitoring IRE-1, PERK and ATF6 UPR branches. Activation of the IRE-1 pathway was evaluated by determining splicing levels of the XBP-1 transcription factor, using RT-PCR. The data showed activation of the IRE-1 pathway by 7% and 14% in tumors expressing tRNASer(Ala) and tRNASer(Leu), respectively (Fig. S5). ATF6 activation was 3.1-fold higher in tumors expressing tRNASer(Ala) than in Mock tumors (,). We next assessed the phosphorylation status of eIF2α, the downstream target of PERK, to confirm UPR activation and also to clarify whether these tRNAs affected translation initiation rate. The levels of eIF2α-P (the inactive form of eIF2α) were 77% lower in tRNASer(Ala) tumors relative to Mock controls, and did not change in other tumors (,), raising the hypothesis that PERK could be downregulated or that the catalytic subunit of the PP1α phosphatase was upregulated. Western blot analysis showed 2-fold upregulation of the PP1α catalytic subunit (,), indicating that the fast growth rate of tRNASer(Ala) tumors was likely due to upregulation of protein synthesis rate, through dephosphorylation of eIF2α by the PP1α-GADD34 phosphatase complex.
Figure 6. Activation of the UPR by misreading tRNAs in vivo. A) Activation of ATF6 in tumors harboring the wild-type and misreading tRNAs. Total ATF6 and ATF6 fragment were detected by immunoblotting. B) eIF2α-P and PP1Α catalytic subunit levels in each tumor lysate were analyzed by immunoblotting and relative expression values are shown. β-tubulin levels served as protein loading control. C) Representative immunoblots for total ATF6, ATF6 fragment, total eiF2α, eIF2α-P, PP1α catalytic subunit and β-tubulin for each membrane. Graphics depict average ± SEM (n = 3). Data was analyzed by One-way ANOVA with Dunnett's post-test and significant p-values are shown (*p < 0.05).
Expression of misreading tRNAs influences cancer-associated signaling pathways
Serine, Threonine and Tyrosine tRNAs are among the most overexpressed tRNAs in breast cancer [Citation15]. The respective amino acids can be phosphorylated and their misincorporation at non-cognate sites may cause aberrant phosphorylation and alteration of signaling transduction pathways [Citation15]. This lead us to hypothesize that the Ras/Raf/MEK/ERK and the Ras/PI3K/PTEN/Akt signaling pathways could be affected in our model of Ser misincorporation, promoting unrestrained cellular growth, proliferation and tumor formation [Citation35]. Indeed, global Ser phosphorylation was increased in tRNASer(Ala) and tRNASer(Leu) expressing tumors (1.53 and 1.71-fold, respectively) (), confirming that cell signaling could be deregulated. We then analyzed the activation of Akt, ERK1/2 and p38 in the same tumors and observed activation of the Akt pathway in all tRNA misreading tumors () and downregulation of the ERK1 (64%) and ERK2 (54%) pathways in tumors expressing tRNASer(Leu) (Fig. S6A,C). p38 activation was unchanged in the tumors expressing the misreading tRNAs when compared to the control (Fig. S6B,C). Therefore, tumorigenesis induced by misreading tRNAs is likely associated with activation of the Akt pathway, while growth rate differences between tumors could be linked to differential activation of the ERK1/2 pathways.
Figure 7. Classical cancer-associated pathways activated in mice tumors. A) Evaluation of total phosphoserine levels in tissue lysates from mice tumors. B) Relative activation ratio of Akt in tumor lysates compared to the Mock and representative immunoblots of Akt-P, total Akt and β-tubulin (loading control) from tumor lysates. Graphics depict average ± SEM (n = 3). Data was analyzed by One-way ANOVA with Dunnett's post-test and significant p-values are shown (*p < 0.05; **p < 0.01).
Discussion
Imbalance of tRNA pools promotes the formation of non-cognate tRNA-aaRS pairs and tRNA mischarging [Citation36]. Pavon et al. reported increased expression of certain tRNAs associated with malignant phenotypes and Gingold et al. reported enrichment of tRNAs required for fast translation of proliferation genes in cancer [Citation15, Citation16, Citation37], suggesting that protein synthesis accuracy could be deregulated in tumors. Since mistranslation impacts proteostasis and produces important phenotypic diversification, drug tolerance and resistance in other biological models [Citation38–Citation40], we have hypothesized that it may also interfere with tumor growth, heterogeneity and response to therapy. In this first attempt to tackle these issues, we have expressed mutant misreading tRNAs, that recapitulate both frequent and rare amino acid misincorporations detected in tumors of human patients, in near-normal NIH3T3 cell lines.
Our mutant misreading tRNAs were well tolerated in vitro and did not produce visible effects on cell viability, apoptosis, proliferation and cell cycle progression, but induced foci formation and promoted angiogenesis and tumor growth in vivo. In particular, the mutant misreading tRNA that misincorporated Ser at Ala codon sites (tRNASerAla), produced tumors that grew as fast as K-rasV12 tumors in nude mice. Previous studies have shown that Ser misincorporation at Ala codon sites, due to an inactivating mutation of the editing site of the AlaRS, induces rapid loss of purkinge cells, ataxia and premature death in mice [Citation32], contradicting our tumor results. Therefore, it is likely that tRNA misreading effects are cell type dependent, i.e., they may lead to apoptosis in purkinge cells and to transformation and neoplasia in other cell types.
The selection and increased expression of the mutant misreading tRNAs in mice tumors () indicates that tRNA misreading is adaptive in tumor contexts and depends on the tumor microenvironment. These data are in agreement with previous works showing that mistranslation increases yeast tolerance to stress and allows for growth in the presence of lethal doses of drugs and chemicals [Citation41, Citation43]. Yeast mistranslating cells adapt to the deleterious effects of mistranslation by altering genomic architecture, increasing protein synthesis, protein degradation and glucose uptake rates [Citation10]. In other words, the deleterious effects of tRNA misreading are rapidly mitigated through genomic, metabolic and proteomic changes, raising the hypothesis that mistranslation may have consequences for tumor biology that go beyond the expected proteome instability.
The impressive growth rate of the tumors expressing the tRNASer(Ala) is likely due to decreased levels of eIF2α-P () since the relative increase of eIF2α levels alone is sufficient to transform NIH3T3 cells [Citation43]. This requires upregulation of the PP1α catalytic activity by cancer signaling pathways, namely the MAPK pathway or recruitment of active PP1α to its eIF2α-P substrate by the regulatory subunit GADD34 [Citation44, Citation45]. Since there was no difference in the activation status of the ERK1/2 downstream effectors of the MAPK, it is likely that eIF2α-P dephosphorylation is mediated by the UPR through activation of the ATF4 transcription factor, which upregulates GADD34. The observed activation of the other UPR mediators ATF6 and IRE-1 may also contribute to the fast growth of those tumors as they are associated with cellular protection and growth stimulation [Citation24, Citation46, Citation47]. Moreover, UPR coupled with induced tumor dormancy protects neoplasic cells from apoptosis and permits recurrence once favorable growth conditions are restored [Citation48].
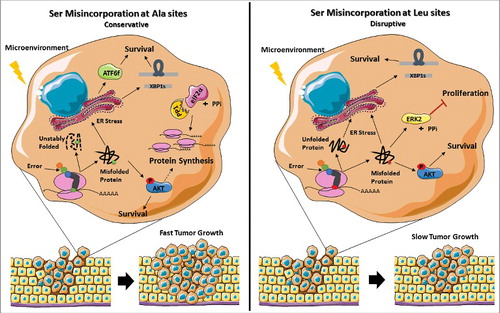
It is well established that tumor development needs genetic and epigenetic changes as well as cooperation of microenvironment components to promote adaptation and growth [Citation49]. Common adaptive responses include enhanced plasticity, cell motility, resistance to apoptosis and survival in hostile environments where hypoxia, acidity, amino acid deprivation, inflammatory cytokines and induction of the UPR are common [Citation50, Citation51]. Importantly, PERK activity and eIF2α-P levels are reduced in mouse breast tumors, where Akt is activated [Citation52]. In line with these results, tumors expressing both types of misreading tRNAs showed concomitant activation of the Akt pathway and UPR induction, increasing the cells capacity to thrive. In tRNASer(Ala) expressing cells where eIF2α-P is downregulated by upregulation of PP1α catalytic subunit, protein synthesis may be upregulated, contributing to fast tumor growth. On the other hand, downregulation of ERK2 on tRNASer(Leu) expressing tumors, is expected to impair or delay tumor growth ().
Figure 8. Representation of the stress response induced by misreading tRNAs. The mutant misreading tRNAs expressed in NIH3T3 cells exposed to microenvironment stimuli in vivo induce ER stress and activation of the Akt pathway. These events lead to UPR activation, increasing the cells capacity to thrive under stress. In tRNASer(Ala) expressing cells where eIF2α-P is downregulated by upregulation of PP1α catalytic subunit there is derepression of protein synthesis which accelerates tumor growth. On the other hand, tRNASer(Leu) show downregulation of ERK2, which has been correlated with decreased cellular proliferation, leading to slow tumor growth. Adapted from Servier Medical Art collection (http://www.servier.com).
Although remarkable progress has been made on the elucidation of the molecular basis of cancer, the etiology of most cancers is still unknown. In the past few years, new molecular links between cancer and translation deregulation have been unraveled, highlighting this setting as etiopathogenic [Citation53]. Our model supports and extends this link by disclosing unexpected selection and upregulation of mutant misreading tRNAs in tumors, and by demonstrating that mistranslation alone is sufficient to accelerate tumor growth. It will be fascinating to clarify in future studies if the proteome instability and heterogeneity produced by mistranslation generates tumor heterogeneity and increases resistance to anti-cancer drugs, as is the case in yeast.
Materials and Methods
Cell culture
The Mouse Embryo Fibroblast cell line (NIH3T3) was obtained from the American Type Culture Collection (Manassas, VA, USA) and maintained in culture as recommended by the suppliers. ATCC regularly tests its cell lines by STR profiling. In house cell maintenance involves regular mycoplasma testing.
Construction of plasmids for expression of mistranslating tRNAs
A DNA fragment of 248kb corresponding to part of the gene encoding human wild-type tRNAser AGA (Chr6 tRNA #5) and its flanking region was amplified by PCR from genomic DNA and cloned into the modified vector pIRES2-DsRed. Site-directed mutagenesis was carried out to change the anticodon of the tRNAser AGA to other anticodons.
Generation of mistranslating cell lines
Mouse Embryo Fibroblast cell line (NIH3T3) was transfected with 1 µg DNA plasmid using Lipofectamine 2000 (Invitrogen), following the manufacturer's instructions. Stably transfected cell lines were established with 1000 µg/ml G418, after 72h transfection, for 1 month before the experiments. Cells were transfected with the empty vector (Mock), and the misreading tRNASer AGC(Ala) and tRNASer AAG(Leu).
Polymerase chain reaction analysis
Genomic DNA was used as template for PCR amplification across the fragment of pIRES2-DsRed plasmid containing the tRNA insert. A 297 bp amplicon was generated, which corresponds to part of the pIRES2-DsRed vector without the tRNA insert (Mock) and a 547 bp amplicon, which corresponds to part of the pIRES2-DsRed plasmid with the tRNA inserted [tRNASer AGC(Ala), tRNASer AAG(Leu)]. PCR products were analyzed in 1% agarose gels and sequenced using Sanger sequencing.
Confirmation of misreading tRNA expression in cell lines and tumors
Amplification of the cDNA of interest was done by PCR. Due to the high level of sequence identity between the serine tRNAs genes the primers amplified both the exogenous tRNAs and other 24 endogenous copies of serine tRNA genes. PCR products were analyzed on 2% agarose gels and bands were excised and purified using Ilustra™ GFX™ PCR DNA and Gel Band purification Kit (GE). SNaPshot reactions were performed using SNaPshot Multiplex Ready Reaction Mix (Applied Biosystems). The SNaPshot product was purified with FastAp. Samples were then sequenced and analyzed using Peak Scanner software (Applied Biosystems).
Cell assays
To quantify cell viability, the number of viable cells was counted after trypan blue staining. Cell proliferation was determined by incubating stable cells with Bromodeoxyuridine (BrdU). Subsequently, cover slips were incubated with 1:10 mouse anti-BrdU (Roche) and 1:500 goat anti-mouse Ig Alexa Fluor 488 (Invitrogen). Fluorescence images were digitally recorded and positive cells were scored. Total number of cells was determined by DAPI staining.
For cell death assays (Annexin V Apoptosis Assay), stable cell lines were incubated with 1:100 of Annexin V-FITC and 2.5 µg/ml of propidium iodide (Invitrogen), and measured by flow cytometry.
For cell-cycle analysis, stable cells were fixed and then re-suspended in RNase A (Sigma, 100 mg/ml) and propidium iodide (PI, Sigma, 1 mg/ml), and incubated in the dark, at room temperature, for 15 min before flow cytometry (BD Immunocytometry Systems FACS Calibur). All flow cytometry results were analyzed using the FlowJo software.
Focus formation assay
NIH3T3 cells were transfected using Lipofectamine 2000 (Invitrogen) with a total of 1 µg of plasmid DNA, according to the manufacturer instructions. Seventy-two hours later, 1 × 10⁵ cells were plated in three 100 mm dishes and maintained in DMEM plus 5% (v/v) FBS (Hyclone) and 1% penicillin–streptomycin (Invitrogen). The medium was renewed every 3 days thereafter. After 13 (only cells expressing K-RasV12 vector) or 21 days, cells were fixed with ice-cold methanol and stained with 0.5% crystal violet in methanol to count the foci and photograph the dishes. The pEGFP vector containing K-rasV12 was used as positive control [Citation54].
TNFα induction assay
3.45 × 10⁵ cells were plated in 6-well plates the day before the induction. Cells were then incubated with 30ng/ml of TNFα (PeproTech) for 30 minutes and 4 hours. After incubation cells were recovered for protein extraction.
Chick embryo CAM assay
The chicken embryo chorioallantoic membrane (CAM) model was used to evaluate the angiogenic response and growth capability of cells containing the empty vector (Mock) in comparison with the misreading tRNASer(Ala) and tRNASer(Leu) expressing cells. Briefly, fertilized chick (Gallus gallus) eggs obtained from commercial sources were incubated horizontally at 37.8°C in a humidified atmosphere. Two rings were placed in each CAM, one was filed with Mock cell suspension and the second with one of the tRNAs transfected cells (1 × 10⁶ cells). After 3 days, the CAM was excised from the embryos, photographed ex ovo under a stereoscope, at 20x magnification (Olympus, SZX16 coupled with a DP71 camera). The number of new vessels was counted and the area of the tumors was determined using the Cell^A Olympus program.
Tumor induction assay
Six to eight-week-old male nude mice (N:NIH(s)II:nu/nu) were used for in vivo experiments. Animal experiments were carried out in accordance with the Guidelines for the Care and Use of Laboratory Animals, directive 2010/63/EU. To measure tumorigenic potential in vivo, NIH3T3 cell lines harboring the empty vector (Mock) and the misreading tRNASer(Ala) and tRNASer(Leu) were subcutaneously injected in the dorsal flanks. A total of 5 mice per group were used, except for misreading tRNASer(Ala) for which 6 mice were used. Each mouse was injected in the right flank with the Mock variant and in the left flank with the cells misexpressing the WT variant or misreading variants of each previously described clone. Mice were weighted, and tumor width and length were measured. Tumor volumes were calculated assuming ellipsoid growth patterns.
RNA and DNA isolation
Total RNA and DNA were isolated from mouse and CAM frozen tumors and stable cell lines using the AllPrep DNA/RNA/Protein Mini Kit (Qiagen) according to the manufacturer's protocol. RNA quantity and integrity were assessed using the Nanodrop 1000 Spectrophotometer (Thermo Scientific) and Agilent 2100 Bioanalyser system, respectively.
Isolation of protein fractions for mass spectrometry analysis
25 mg of tumor tissue (H460- (n = 3), MKN74- (n = 3), and NIH3T3-derived tumors (n = 1)) were homogenized in Protein Lysis Buffer (0.5% Triton X-100, 50mM HEPES, 250mM NaCl, 1mM DTT, 1mM NaF, 2mM EDTA, 1mM EGTA, 1mM PMSF, 1mM Na3VO4 supplemented with a cocktail of protease inhibitors (Complete, EDTA-free, Roche). Cells were sonicated with a probe sonicator in 5 pulses of 5 seconds, incubated on ice for 30min and centrifuged at 5000rpm for 15min at 4°C. 10 µL of the supernatant (total protein fraction) were stored to measure protein concentration with BCA assay (Thermo Fisher Scientific). 300 µg of total protein were centrifuged again at 12000rpm for 20min at 4°C to isolate the Soluble Fraction of the protein extract present in the supernatant. The supernatant was concentrated under vacuum (SpeedVac®, Thermo Savant, USA) until a volume of 20 µL was reached. The total volume was then resolved in a 10% SDS-PAGE gel.
Protein identification and characterization by mass spectrometry
Complete lanes of were manually cut out of the SDS-PAGE gel and sliced into 8 sections, destained with 25 mM ammonium bicarbonate/50% acetonitrile and dried under vacuum (SpeedVac®, Thermo Savant, USA). The dried gel pieces were rehydrated with 25 μL of 10 µg/mL trypsin (Promega V5111) in 50 mM ammonium bicarbonate and digested overnight at 37°C. Tryptic peptides were extracted from the gel with 10% formic acid/ 50% acetonitrile and were then dried in a vacuum concentrator and re-suspended in 10 µL of a 50% acetonitrile/0.1% formic acid solution. Separation of tryptic peptides by nano-HPLC was performed on the module separation Proexeon EASY-nLC 1000 from Thermo equipped with a 50-cm EASY C18 column with particle size 2-µm. Each sample was separated over a gradient of 5–32 % ACN in 90 at 250 nl/min. Peptide cations were converted to gas-phase ions by electrospray ionization and analyzed on a Thermo Orbitrap Fusion Lumos mass spectrometer. Precursor scans were performed from 300 to 1,500 m/z at 120K resolution (at 445 m/z) using a 1 × 10⁵ AGC target. Precursors selected for tandem MS were isolated at 1 Th with the quadrupole, fragmented by HCD with a normalized collision energy of 30, and analyzed using rapid scan in the ion trap. The maximum injection time for MS2 analysis was 50 ms, with an AGC target of 1 × 10⁴. Precursors with a charge state of 2–5 were sampled for MS2. Dynamic exclusion time was set at 60 seconds, with a 5 ppm tolerance around the selected precursor.
We used MS/MS data sets produced by the National Cancer Institute Clinical Proteomic Tumor Analysis Consortium (CPTAC) (https://cptac-data-portal.georgetown.edu/cptacPublic/) and our own MS/MS data sets produced using xenograft tumors, prepared as described above. Normal colon samples were randomly selected (Sample codes: JX0008, JX0025A, JX0030A) while COAD samples were selected to represent advanced stages of the disease by analyzing the metadata available (Sample codes: TCGA-AA-3695-01A-22-2150-27, TCGA-AA-A02E-01A-23-A20O-27, TCGA-AA-A02H-01A-32-A20O-27). Normal samples MS/MS raw data was downloaded from https://cptac-data-portal.georgetown.edu/cptac/s/S019 and COAD samples MS/MS raw data downloaded from https://cptac-data-portal.georgetown.edu/cptac/s/S016. All MS/MS datasets were analyzed using the same bioinformatics pipeline.
The raw files were searched directly against the Mus musculus or Homo sapiens reference proteomes obtained from UniprotKB, using PEAKS8 software and mutations in the proteome were found using the SPIDER tool [Citation55]. Searches were carried using a precursor search tolerance of 5 ppm. Search criteria included a static modification of +57.0214 Da on cysteine residues, variable modification of +15.9949 Da on oxidized methionine to reduce false positives; some misincorporations and amino acid modifications may produce similar spectra. Searches were performed with semi-tryptic digestion and allowed a maximum of three missed cleavages on peptides analyzed by the sequence database. False discovery rates (FDR) were estimated with decoy-fusion and then set to 1% for each analysis, as previously reported [Citation56]. The sequences of the mutated peptides observed in this analysis were used to generate a modified database, containing new entries with the proteins harboring those mutations; to rule out false positives. These samples were re-analyzed using the PEAKS software, but this time against the modified databases, validating only the mutated peptides which aligned with the mutated sequence. Data was filtered so that each protein was represented by a single entry to avoid overestimation of protein mistranslation events. The number of spectra for each peptide was taken into account to calculate the total number of misincorporations in the samples.
Reverse transcriptase PCR and quantitative real-time PCR
cDNA used as template for PCR was obtained by reverse-transcription using the SuperScript II RT system (Invitrogen). PCR amplification was performed across the fragment of the XBP-1 cDNA bearing the intron target of IRE-1α ribonuclease activity. A 289 bp amplicon was generated from unspliced XBP-1 (XBP-1un); a 263 bp amplicon was generated from spliced XBP-1 (XBP-1s) and a 315 bp amplicon was generated from hybrid XBP-1 (XBP-1H). PCR products were resolved on QIAxcel DNA Fast Screening Kit (20-50 bp resolution)/ agarose gel 4% (Qiagen). Quantification of XBP-1 activation (in percentage) was performed using the following formula: 100 x [XBP-1s + 0.5 XBP-1H] / [XBP-1s + XBP-1H + XBP-1un], as previously described (Shang 2011). Actin β was used as a loading control.
TaqMan assays were performed to determine the expression of the mRNA by quantitative real-time PCR (qRT-PCR). The probes used to evaluate the expression of mouse DsRED and Gapdh mRNAs were obtained commercially from Integrated DNA Technologies. All assays including no template controls were carried out in triplicate. The threshold cycle data (CT) and baselines were determined using auto settings. Gapdh mRNA levels served as an internal normalization standard to determine expression levels of DsRED in each sample. The 2−ΔΔCT analysis method was applied in all experiments.
Western blot analysis
Total protein lysates were immunoblotted onto nitrocellulose membranes with antibodies against phoshoserine (1:500; Invitrogen); eIF2α (1:1000; Cell signalling); phospho-eIF2α (1:1000; Abcam); ATF6 (1:400; Stressgen); PP1α catalytic subunit (1:400; ThermoFisher Scientific); Akt (1:1000; Cell signaling); phospho-Akt (1:1000; Cell signaling); ERK1/2 (1:1000; Cell signaling); phospho-ERK1/2 (1:1000; Cell signaling); phospho-p38 (1:1000; Cell signaling); p38 (1:1000; Cell signaling) and β-tubulin(1:1000; Invitrogen). IRDye680 goat anti-rabbit or IRDye800 goat anti-mouse secondary antibodies (1:10000, Li-cor Biosciences) were used and the signal was detected using an Odyssey Infrared Imaging system (Li-cor Biosciences).
Ki67 immunohistochemistry
Heat-induced antigen retrieval was performed using citrate buffer solution, pH 6.0. Slides were incubated with Ki67 antibody (1:400, clone SP6; Thermo Scientific) and labeled with Envision Detection System Anti-Rabbit/Mouse (Dako, CA, USA) followed by hematoxilin staining using the standard protocol.
Statistical analysis
For all the assays, except for the in vivo experiments, our data represents 3 replicates and 2–3 independent experiments. Data are reported as the average values + SEM (standard error of the mean). Statistical significance was determined using One-way ANOVA with Dunnett's post-test. The CAM experiments were analyzed using paired two-tailored Student's t-test.
For more details regarding methods and protocols please consult Supplemental Information.
Disclosure of Potential Conflicts of Interest
No potential conflicts of interest were disclosed.
Authors' Contributions
Conceptualization: Patrícia M. Pereira, Mafalda Santos, Carla Oliveira, Manuel Santos
Methodology: Patrícia M. Pereira, Mafalda Santos, A. Sofia Varanda, Joana Carvalho, Mafalda Azevedo, Denisa Mateus, Nuno Mendes, Marta Teixeira Pinto, Rui Vitorino
Validation: Patrícia M. Pereira, Mafalda Santos, A. Sofia Varanda, Patrícia Oliveira, Carla Oliveira
Formal Analysis: Patrícia M. Pereira, Mafalda Santos, A. Sofia Varanda, Nuno Mendes, Marta Teixeira Pinto, Fátima Carneiro, Carla Oliveira, Manuel Santos
Investigation: Patrícia M. Pereira, Mafalda Santos, A. Sofia Varanda, Mafalda Azevedo, Denisa Mateus, Joana Carvalho, Nuno Mendes, Marta Teixeira Pinto, Renata Bordeira Carriço
Resources: Nuno Mendes, Carla Oliveira, Manuel Santos
Analysis and interpretation of data: Patrícia M. Pereira, Mafalda Santos, A. Sofia Varanda, Nuno Mendes, Patrícia Oliveira, Carla Oliveira, Manuel Santos
Writing – Original Draft: Patrícia M. Pereira, Mafalda Santos, A. Sofia Varanda, Carla Oliveira, Manuel Santos
Writing – Review and Editing: Patrícia M. Pereira, Mafalda Santos, A. Sofia Varanda, Carla Oliveira, Manuel Santos
Supervision: Carla Oliveira, Manuel Santos
Project administration: Carla Oliveira, Manuel Santos
Fund raising: Carla Oliveira, Manuel Santos
Grant Support
Ipatimup integrates the i3S Research Unit, i3S and iBiMED Research Units are partially supported by the Portuguese Foundation for Science and Technology (FCT). This work was funded by: 1) FEDER – Fundo Europeu de Desenvolvimento Regional funds through the COMPETE 2020 – Operacional Programme for Competitiveness and Internationalization (POCI), Portugal 2020, and by Portuguese funds through FCT – Foundation for Science and Technology/Ministério da Ciência, Tecnologia e Inovação in the framework of the projects: “Institute for Research and Innovation in Health Sciences”(POCI-01-0145-FEDER-007274), and “PEst-C/SAU/LA0003/2013”; 2) NORTE-01-0145-FEDER-000029, supported by Norte Portugal Regional Programme (NORTE 2020), under the PORTUGAL 2020 Partnership Agreement, through the European Regional Development Fund (ERDF); 3) The Aveiro Institute of Biomedicine – iBiMED is supported by FCT grant UID/BIM/04501/2013, the Ilídio Pinho Foundation and the University of Aveiro. 4) This project was supported directly by grant FCT/FEDER PTDC/BEX-BCM/2121/2014 and FCT Fellowships [SFRH/BPD/26611/2006-PMP; SFRH/BPD/89764/2012-PO; SFRH/BPD/86543/2012-JC; SFRH/BD/91020/2012-MS and SFRH/BD/76417/2011-ASV).
Impact Statement
Protein mistranslation events that occur frequently in tumors are potent accelerators of tumor growth.
Acknowledgments
The authors wish to thank: Paulo Matos and Peter Jordan for the plasmid pEGFP containing K-rasV12 used in this study; Tiago Pedrosa for helping with flow cytometry analysis; Hugo Osório for technical support with MS/MS tentative approach; Ana Maria Magalhães for help with TNF-α assay; Andreia Reis for the development of tools to analyze the Mass Spectrometry data; IPATIMUP group (ERIC) and RNA Biology group, especially Ana Soares.
Additional information
Funding
References
- You JS, Jones PA. Cancer genetics and epigenetics: two sides of the same coin? Cancer Cell. 2012;22:9–20.
- Jakubowski H, Goldman E. Editing of errors in selection of amino acids for protein synthesis. Microbiol Rev. 1992;56:412–429.
- Loftfield R, Vanderjagt D. The frequency of errors in protein biosynthesis. Biochem J. 1972;128:1353–6.
- Allan Drummond D, Wilke CO. The evolutionary consequences of erroneous protein synthesis. Nat Rev Genet. 2009;10:715–724.
- Silva RM, Duarte ICN, Paredes JA, et al. The Yeast PNC1 longevity gene Is up-regulated by mRNA mistranslation. PLoS One. 2009;4:e5212.
- Pan T. Adaptive translation as a mechanism of stress response and adaptation. Annu Rev Genet. 2013;47:121–37.
- Ribas de Pouplana L, Santos M a S, Zhu JH, et al. Protein mistranslation: Friend or foe? Trends Biochem Sci. 2014;39:355–362.
- Bloom JD, Labthavikul ST, Otey CR, et al. Protein stability promotes evolvability. Proc Natl Acad Sci U S A. 2006;103:5869–5874.
- Paredes JA, Carreto L, Simões J, et al. 2012; Low level genome mistranslations deregulate the transcriptome and translatome and generate proteotoxic stress in yeast. BMC Biol.10:55.
- Kalapis D, Bezerra AR, Farkas Z, et al. Evolution of Robustness to Protein Mistranslation by Accelerated Protein Turnover. PLoS Biol. 2015;13:
- Bjornsti MA, Houghton PJ. Lost in translation: Dysregulation of cap-dependent translation and cancer. Cancer Cell. 2004;5:519–523.
- Mamane Y, Petroulakis E, Rong L, et al. eIF4E–from translation to transformation. Oncogene. 2004;23:3172–9.
- Pandolfi PP. Aberrant mRNA translation in cancer pathogenesis: an old concept revisited comes finally of age. Oncogene. 2004;23:3134–3137.
- Park SG, Schimmel P, Kim S. Aminoacyl tRNA synthetases and their connections to disease. Proc Natl Acad Sci U S A. 2008;105:11043–9.
- Pavon-Eternod M, Gomes S, Geslain R, et al. tRNA over-expression in breast cancer and functional consequences. Nucleic Acids Res. 2009;37:7268–80.
- Pavon-Eternod M, Gomes S, Rosner MR, et al. Overexpression of initiator methionine tRNA leads to global reprogramming of tRNA expression and increased proliferation in human epithelial cells. RNA. 2013;19:461–6.
- Ruggero D, Pandolfi PP. Does the ribosome translate cancer? Nat Rev Cancer. 2003;3:179–192.
- White RJ. RNA polymerase III transcription and cancer. Oncogene. 2004;23:3208–16.
- Geslain R, Cubells L, Bori-Sanz T, et al. Chimeric tRNAs as tools to induce proteome damage and identify components of stress responses. Nucleic Acids Res. 2010;38:e30.
- Clarke HJ, Chambers JE, Liniker E, et al. Endoplasmic Reticulum Stress in Malignancy. Cancer Cell. 2014;25:563–573.
- Chen L, Brewer MD, Guo L, et al. Enhanced Degradation of Misfolded Proteins Promotes Tumorigenesis. Cell Rep. 2017;18:3143–3154.
- Maas NL, Diehl JA. The PERKs and Pitfalls of Targeting the Unfolded Protein Response in Cancer. Clin Cancer Res. 2015;21:675–679.
- Papandreou I, Denko NC, Olson M, et al. Identification of an Ire1alpha endonuclease specific inhibitor with cytotoxic activity against human multiple myeloma. Blood. 2011;117:1311–4.
- Schewe DM, Aguirre-Ghiso JA. ATF6alpha-Rheb-mTOR signaling promotes survival of dormant tumor cells in vivo. Proc Natl Acad Sci U S A. 2008;105:10519–10524.
- Bi M, Naczki C, Koritzinsky M, et al. ER stress-regulated translation increases tolerance to extreme hypoxia and promotes tumor growth. EMBO J. 2005;24:3470–3481.
- Wang X, Pan T. Stress Response and Adaptation Mediated by Amino Acid Misincorporation during Protein Synthesis. Adv Nutr. 2016;7:773S–779S.
- Moghal A, Mohler K, Ibba M. Mistranslation of the genetic code. FEBS Lett. 2014;588:4305–4310.
- Bezerra AR, Simões J, Lee W, et al. Reversion of a fungal genetic code alteration links proteome instability with genomic and phenotypic diversification. Proc Natl Acad Sci U S A. 2013;110:11079–84.
- Netzer N, Goodenbour JM, David A, et al. Innate immune and chemically triggered oxidative stress modifies translational fidelity. Nature. 2009;462:522–526.
- Reverendo M, Soares AR, Pereira PM, et al. TRNA mutations that affect decoding fidelity deregulate development and the proteostasis network in zebrafish. RNA Biol. 2014;11:1199–213.
- Simões J, Bezerra AR, Moura GR, et al. The fungus Candida albicans tolerates ambiguity at multiple codons. Front Microbiol. 2016;31:401.
- Lee JW, Beebe K, Nangle LA, et al. Editing-defective tRNA synthetase causes protein misfolding and neurodegeneration. Nature. 2006;443:50–5.
- Mohler K, Ibba M. Translational fidelity and mistranslation in the cellular response to stress. 2017;2:17117.
- Wang S, Kaufman RJ. The impact of the unfolded protein response on human disease. J Cell Biol. 2012;197:857–67.
- Chappell WH, Steelman LS, Long JM, et al. Ras/Raf/MEK/ERK and PI3K/PTEN/Akt/mTOR inhibitors: rationale and importance to inhibiting these pathways in human health. Oncotarget. 2011;2:135–164.
- Dittmar KA, Sørensen MA, Elf J, et al. Selective charging of tRNA isoacceptors induced by amino-acid starvation. EMBO Rep. 2005;6:151–157.
- Gingold H, Tehler D, Christoffersen NR, et al. A Dual Program for Translation Regulation in Cellular Proliferation and Differentiation. Cell. 2015;158:1281–1292.
- Bezerra AR, Simões J, Lee W, et al. Reversion of a fungal genetic code alteration links proteome instability with genomic and phenotypic diversification. Proc Natl Acad Sci U S A. 2013;110:11079–84.
- Gomes AC, Miranda I, Silva RM, et al. A genetic code alteration generates a proteome of high diversity in the human pathogen Candida albicans. Genome Biol. 2007;8:R206.
- Javid B, Sorrentino F, Toosky M, et al. Mycobacterial mistranslation is necessary and sufficient for rifampicin phenotypic resistance. Proc Natl Acad Sci. 2014;111:1132–1137.
- Silva RM, Paredes JA, Moura GR, et al. Critical roles for a genetic code alteration in the evolution of the genus Candida. EMBO J. 2007;26:4555–4565.
- Santos M a S, Cheesman C, Costa V, et al. Selective advantages created by codon ambiguity allowed for the evolution of an alternative genetic code in Candida spp. Mol Microbiol. 1999;31:937–947.
- Perkins D, Barber G. Defects in Translational Regulation Mediated by the Subunit of Eukaryotic Initiation Factor 2 Inhibit Antiviral Activity and Facilitate the Malignant Transformation of Human Fibroblasts. Mol Cell Biol. 2004;24:2025–2040.
- Monick MM, Powers LS, Gross TJ, et al. Active ERK Contributes to Protein Translation by Preventing JNK-Dependent Inhibition of Protein Phosphatase 1. J Immunol. 2006;177:1636. LP-1645.
- Urra H, Dufey E, Avril T, et al. Endoplasmic Reticulum Stress and the Hallmarks of Cancer. Trends in Cancer. 2017;2:252–262.
- Romero-Ramirez L, Cao H, Nelson D, et al. XBP1 is essential for survival under hypoxic conditions and is required for tumor growth. Cancer Res. 2004;64:943–7.
- Belmont PJ, Tadimalla A, Chen WJ, et al. Coordination of growth and endoplasmic reticulum stress signaling by regulator of calcineurin 1 (RCAN1), a novel ATF6-inducible gene. J Biol Chem. 2008;283:14012–14021.
- Dong D, Stapleton C, Luo B, et al. A critical role for GRP78/BiP in the tumor microenvironment for neovascularization during tumor growth and metastasis. Cancer Res. 2011;71:2848–57.
- Taddei ML, Giannoni E, Comito G, et al. Microenvironment and tumor cell plasticity: An easy way out. Cancer Lett. 2013;341:80–96.
- Clarke R, Cook KL, Hu R, et al. Endoplasmic reticulum stress, the unfolded protein response, autophagy, and the integrated regulation of breast cancer cell fate. Cancer Res. 2012;72:1321–1331.
- Fels DR, Koumenis C. The PERK/eIF2??/ATF4 module of the UPR in hypoxia resistance and tumor growth. Cancer Biol Ther. 2006;5:723–728.
- Mounir Z, Krishnamoorthy JL, Wang S, et al. Akt determines cell fate through inhibition of the PERK-eIF2α phosphorylation pathway. Sci Signal. 2011;4:ra62.
- Sang Won L, Young Sun K, Kim S. Multifunctional Proteins in Tumorigenesis: Aminoacyl-tRNA Synthetases and Translational Componentse. Curr Proteomics. 2006;3:233–247.
- Matos P, Oliveira C, Velho S, et al. B-Raf(V600E) cooperates with alternative spliced Rac1b to sustain colorectal cancer cell survival. Gastroenterology. 2008;135:899–906.
- Han Y, Ma B, Zhang K. SPIDER: software for protein identification from sequence tags with de novo sequencing error. Proc IEEE Comput Syst Bioinform Conf. 2004;3:206–15.
- Zhang J, Xin L, Shan B, et al. PEAKS DB: De Novo Sequencing Assisted Database Search for Sensitive and Accurate Peptide Identification. Mol Cell Proteomics. 2012;