
 ?Mathematical formulae have been encoded as MathML and are displayed in this HTML version using MathJax in order to improve their display. Uncheck the box to turn MathJax off. This feature requires Javascript. Click on a formula to zoom.
ABSTRACT
Adenosine deaminases acting on RNA (ADARs) catalyze the deamination of adenosine (A) to inosine (I). A-to-I RNA editing targets double-stranded RNA (dsRNA), and increases the complexity of gene regulation by modulating base pairing-dependent processes such as splicing, translation, and microRNA (miRNA)-mediated gene silencing. This study investigates the genome-wide binding preferences of the nuclear constitutive isoforms ADAR1-p110 and ADAR2 on human miRNA species by RNA immunoprecipitation of ADAR-bound small RNAs (RIP-seq). Our results suggest that secondary structure predicted by base-pairing probability in the mainly double-stranded region of a pre-miRNA or mature miRNA duplex may determine ADAR isoform preference for binding distinct subpopulations of miRNAs. Furthermore, we identify 31 unique editing sites with statistical significance, 19 sites of which are novel editing sites. Editing sites are enriched in the seed region responsible for target recognition by miRNAs, and isoform-specific nucleotide motifs in the immediate vicinity and opposite of editing sites are consistent with previous studies, and further reveal that ADAR2 may edit A/C bulges more frequently than ADAR1-p110 in the context of miRNA.
1. Introduction
Single-nucleotide RNA editing is one of the processes involved in post-transcriptional modification [Citation1–Citation3]. In particular, adenosine deaminases acting on RNA (ADARs) mediate the hydrolytic deamination of adenosine (A) to inosine (I) on double-stranded RNA (dsRNA), a process known as A-to-I editing. Inosine preferentially base pairs to cytosine (C), and is subsequently interpreted as guanosine (G) during translation or sequencing. Although A-to-I editing is known to target coding sequences, recent transcriptome analyzes have shown that the majority of editing sites are found within noncoding regions, such as introns, or in repetitive Alu elements [Citation1,Citation4–Citation7]. Structurally, A-to-I editing destabilizes dsRNA structures by introducing I:U mismatches, which are recognized and cleaved by the inosine-specific endonucleases Tudor-SN and ENDOV [Citation8–Citation10]. Perfect stretches of dsRNA are known to be hyper-edited in a sequence-independent manner [Citation11,Citation12]. In contrast, editing events tend to show some sequence specificity on imperfect dsRNA containing bulges and loops, but the precise determinants for editing preference remain elusive [Citation2].
Precursor microRNAs (pre-miRNAs) typically present a hairpin structure with a dsRNA region that may contain various mismatches and bulges. Furthermore, ADAR proteins happen to affect the biogenesis and maturation of microRNA (miRNA) through editing-dependent and independent mechanisms [Citation13–Citation17]. They therefore constitute an ideal biological target to study ADAR binding and editing specificity. MiRNAs are important post-transcriptional regulators of protein expression that act via sequence complementarity to a subset of target mRNAs [Citation18], and single-nucleotide changes regulate miRNA activity through retargeting [Citation19] and modulation of silencing efficiency [Citation20]. MiRNAs are first generated as primary miRNAs (pri-miRNAs) by RNA polymerase II-dependent transcription, and processed in the nucleus by Drosha-DGCR8 into pre-miRNA, consisting of the ~ 70 nucleotide (nt) hairpin structure mentioned above [Citation21]. These are then exported to the cytoplasm via exportin-5, and further processed by Dicer to yield ~ 22 nt-long miRNA duplexes [Citation22]. ADARs are thought to intervene at several steps during miRNA biogenesis. The screening of 209 select human pri-miRNAs revealed 86 editing sites on 47 pri-miRNA species [Citation15], and RNA editing activity was shown to either inhibit or promote cleavage by Drosha and/or Dicer in human cells [Citation15,Citation16,Citation23]. A-to-I editing may also regulate loading onto AGO or RISC [Citation24] and selection of the guide strand by altering the stability of the miRNA duplex [Citation25]. Elucidating the binding and editing targets of distinct ADAR isoforms on human pre-miRNA and mature miRNA duplexes is expected to bring new insights into the RNA sequence and structure specificity of these enzymes, both in terms of binding and editing activity.
This study investigates the genome-wide binding and editing patterns of the constitutively expressed, mainly nuclear isoforms ADAR1-p110 and ADAR2 on human pre- and mature miRNAs by small RNA immunoprecipitation sequencing (RIP-seq). 31 unique editing sites were identified, and assigned to ADAR1-p110, ADAR2, or both. The base-pairing probability (BPP) reflects the average local secondary structure of a group of miRNAs. ADAR1-p110-bound pre-miRNA showed a high BPP in the dsRNA region opposite from the loop (root region), while pre- and mature miRNA duplex with a high BPP on both sides of the stem were preferentially bound by ADAR2. Our results suggest that BPP more strongly affects the editing, as ADAR1-p110-dependent editing occurred significantly more often on pre-miRNA or miRNA duplexes with an overall higher BPP, with ADAR2 preferring targets with a high BPP in the root region. Consistent with prior studies [Citation26], the seed regions responsible for target mRNA recognition were significantly more edited than non-seed regions for both ADARs. Sequence motif alignments further revealed a difference in the breadth of the recognition sequence around editing sites for ADAR1-p110 and ADAR2 that is consistent with their activity, as well as more active editing at A/C mismatches by ADAR2 relative to ADAR1-p110.
2. Results
2.1. Subcellular localization of GFP-tagged ADAR isoforms
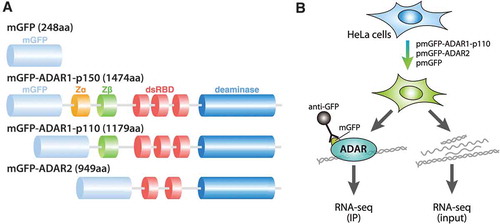
In order to identify and compare the binding preferences of the constitutive isoforms ADAR1-p110 and ADAR2, we overexpressed each separately as mycGFP (mGFP)-tagged constructs (, see Materials and methods). Each expression construct, along with the expression construct of an interferon-inducible ADAR1 isoform (ADAR1-p150), was transfected into human HeLa cells, and GFP signals were monitored by fluorescence microscopy in live cell cultures (Figure S1A). Consistent with previous reports [Citation27,Citation28], mGFP-ADAR1-p150 protein was detected mainly in the cytoplasm, whereas mGFP-ADAR1-p110 and mGFP-ADAR2 signals appeared as a few discrete nuclear spots, which likely correspond to the nucleolus. On the other hand, control mGFP was ubiquitously expressed. The correct size of the overexpressed proteins was checked by Western blot on total cell lysates and anti-GFP immunoprecipitates (IP), confirming that the GFP signal observed in Fig. S1A is due to successful expression of full-length mGFP-tagged ADARs (Figure S1B). shows the experimental workflow for RIP-seq analysis for the constitutive nuclear isoforms ADAR1-p110 and ADAR2. For each construct, the corresponding RNA purified from total cell lysates (input) was used as a control. RNA immunoprecipitation using the anti-GFP antibody allowed the recovery of a substantially higher amount of RNA than with the control IgG, showing that the IP was successful (Figure S1C, Table S1B and C). In addition, since a negligible amount of RNAs was immunoprecipitated with mGFP tag alone (Table S1), RIP-seq was not performed for these control samples.
Figure 1. Domain organization of human ADAR isoforms, and procedure for the RNA sequencing experiments. (a) Schematic representation of the domain structures of three expression constructs of human ADAR isoforms and their control. mGFP indicates mycGFP-tag, Zα, Z-DNA binding domain α; Zβ, Z-DNA binding domain β; dsRBD, double-stranded RNA binding domain; R, an arginine-rich single-stranded RNA binding domain. (b) Schematic representation of RNA sequencing of the ADAR-bound small RNAs and input RNAs in cells transfected with pmGFP-ADAR1-p110 or pmGFP-ADAR2.
2.2. Computational identification of full precursor, partial precursor, and mature miRNA reads
The first step was to elucidate the binding preferences of ADAR1-p110 and ADAR2 on human miRNAs. The pipeline for binding analysis is illustrated in . Precursor and mature miRNAs were recovered simultaneously by size selecting for 15–110 nt RNAs after pull-down of GFP-tagged ADAR1-p110 and ADAR2. Ribosomal RNA (rRNA) was removed prior to sequencing to increase target RNA coverage, and ADAR1-p150 was not investigated because it is known to bind to rRNA [Citation29], and the amount of RNA remaining after IP and rRNA removal was similar to that of immunoprecipitation by control IgG (Table S1). Paired-end sequencing with a read length of 101 nucleotide (nt) was performed using Illumina HiSeq2000, and 19–25 million pair-end reads (2 × 101 nt) obtained for the IP and 15–22 million for the input samples (Table S2). To analyze miRNA expression and binding, these reads were first mapped with bowtie allowing up to two mismatches (see Materials and methods). In both the ‘no mismatch’ and ‘A-to-G mismatch only’ samples, the majority of reads were 18–24 nt, corresponding to the size of most mature miRNAs described in miRBase release 20 [Citation30]. On the other hand, three peaks at 28, 42 and 57 nt were observed in the reads with no mismatches (). The length distribution of longer reads (≥ 25 nt) with only A-to-G mismatches was similar, although the tendency was less clear ().
Figure 2. Length distribution of all reads mapped to annotated miRNA regions. (a) Pipeline for the quantification of miRNA abundance and its classification, and schematic representation of the secondary structure of ADAR-bound miRNAs. Distribution of miRNAs mapped to annotated miRNA regions with no mismatches (b) or with only A-to-G mismatches (c) in ADAR1-p110 input and IP, ADAR2 input and IP, and GFP input samples, respectively. Horizontal axis indicates read length. Vertical axis, fraction of reads. (d) Four classes of miRNAs mapped to annotated miRNA regions. Pri-miRNA fragment: < 90% overlap with the pre-miRNA annotation and size ≥ 25 nt. Pre-miRNA: ≥ 90% overlap with the pre-miRNA annotation and size ≥ 40 nt. MiRNA manqué: ≥ 90% overlap with the pre-miRNA annotation and size 25–39 nt (usually contains one mature miRNA sequence and part of the loop region). Mature miRNA: size ≤ 24 nt (most reads almost completely overlap with mature miRNA annotations). Enrichment of pri-miRNA fragments, pre-miRNAs, miRNA manqué, and mature miRNAs in no mismatched reads (e) and only A-to-G mismatched reads (F) in the total IP samples of ADAR1-p110 and ADAR2 compared to the corresponding input samples. Horizontal axis indicates the fraction of reads. **p-value < 0.05, ***p-value < 0.01 (Welch’s t-test).
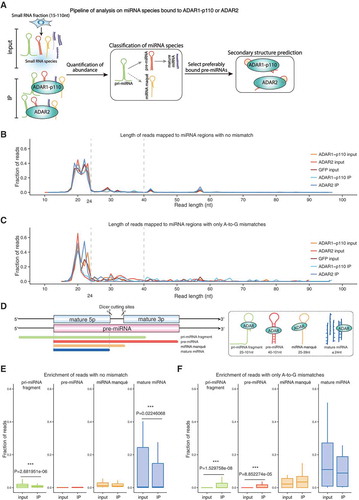
All the reads that mapped to annotated miRNA regions were displayed with their respective genome coordinates (Figure S2). Most of the 18–24 nt reads shown in mapped almost precisely to annotated mature miRNA regions, while the longer reads (≥ 25 nt) constituted of a mixture of reads corresponding to pre-miRNAs and reads that only partially overlap with pre-miRNA regions. To distinguish between them, we calculated for each longer read the percentage of overlap with the corresponding pre-miRNA region. The majority of them overlapped more than 90% (Figure S3A). Next, we checked the nucleotide length distribution of reads with more (Figure S3B) or less than (Figure S3C) 90% overlap. The reads with a good overlap (≥ 90%) were divided into two groups according to nucleotide length: 25–39 nt and 40–101 nt. Since most pre-miRNAs registered in miRBase are 40 nt or longer, the latter were considered to be full-length precursors, and could be classified as pre-miRNAs; there were two sharp peaks at 42 and 57 nt. The reads between 25 and 39 nt were broadly distributed and considered as partial fragments of pre-miRNAs. We chose to designate these as mature ‘miRNA manqué’ (), a word originally coming from French meaning ‘failed (to become); to be lacking’ that is sometimes used in the medical field. On the other hand, the reads with less than 90% overlap with pre-miRNA annotations were scattered broadly from 25 to 101 nt. These reads were discriminated as pri-miRNA fragments, that may originate either from genuine pri-miRNAs that were longer than the correctly processed read length, or from post-transcriptionally processed fragments. Altogether, the reads were divided into four categories: pri-miRNA fragments (overlap < 90%; length ≥ 25 nt), pre-miRNA (overlap ≥ 90%; length ≥ 40 nt), miRNA manqué (overlap ≥ 90%; 25 nt ≤ length ≤ 39 nt), mature miRNA (length ≤ 24 nt).
To find out which of these categories may be preferentially bound by the ADAR family double stranded RNA binding proteins ADARs, a box plot was generated to test the enrichment in the IP compared to the input for the ‘no mismatch’ () or ‘A-to-G only’ reads (). The four groups of reads defined above were not equally enriched in the ADAR1-p110 and ADAR2 IP samples compared to input (). Instead, pri-miRNA fragments and mature miRNAs were significantly reduced in the IP with no mismatch reads (p = 2.68 × 10⁻⁶ and p = 0.02, respectively, Welch’s t-test). A significant enrichment was also observed for pri-miRNA fragments (p = 1.53 × 10⁻⁸) and pre-miRNAs (p = 8.85 × 10⁻⁵) contained in reads that exclusively contain A-to-G mismatches. These results suggest that miRNA species containing dsRNA features, such as pri- and pre-miRNAs (see ), are enriched in A-to-G mismatched reads compared to input. This is expected considering that ADARs’ interact with their targets via dsRNA-binding domains.
2.3. ADAR1-p110 and ADAR2 bind to different subsets of miRNAs
To assess the effect of ADAR overexpression on global miRNA expression, the expression levels of pre- and mature miRNAs in ADAR1-p110 input or ADAR2 input were compared to those of the control GFP input (Figure S4A and C) and to each other (Figure S4B and D). The normalized pre-miRNA reads count (RPKM) in the ADAR1-p110 input or ADAR2 input was strongly correlated with that in the GFP input for both pre-miRNAs (R ≥ 0.88) and mature miRNAs (R ≥ 0.91), although their regression lines were slightly angled towards the ADAR input samples. These results suggest that the overexpression of ADAR1-p110 and ADAR2 has little effect on the global expression patterns of mature miRNA.
Next, we investigated the binding preferences of ADAR1-p110 and ADAR2 by comparing the logarithmic ratio of ADAR1-p110 IP versus ADAR2 IP for pre- and mature miRNA, and plotted it against the logarithmic ratio of ADAR1-p110 input versus ADAR2 input (). As such, any dots appearing in the upper part of the graph correspond to miRNA species that are preferentially bound by ADAR1-p110, and those in the lower part are bound more by ADAR2. Furthermore, the dots in the left part correspond to miRNA species that are expressed more highly in the ADAR2 input compared to the ADAR1-p110 input sample, and the right part to those more highly expressed in ADAR1-p110 input. In order to pick up miRNA species bound to a specific ADAR isoform while ruling out secondary effects on miRNA expression, we further set the threshold for the difference in IP signal to > 2-fold and input signal to < 1.5-fold, respectively. Venn diagrams show the numbers of pre-miRNAs () and mature miRNAs () bound by ADAR1-p110 or ADAR2. All in all, 10 pre- and 43 mature miRNA species were enriched in the ADAR1-p110-bound fraction, and 13 pre- and 15 mature miRNA species in the ADAR2-bound fraction (). Among them, 276 pre- and 279 mature miRNA species were enriched in both ADARs-bound fractions. These results combined suggest that a large subset of pre- and mature miRNAs bound to ADAR1-p110 and ADAR2 overlapped, but some miRNAs specifically bound to either ADAR isoform.
Figure 3. miRNA expression levels and binding preferences of each ADAR isoform to miRNAs. (a) Relative enrichment of pre-miRNAs (left) or mature miRNAs (right) in input samples (x-axis) and IP samples (y-axis) of ADAR1-p110 compared to those of ADAR2. The ratio of RPKM was expressed as log2-transformed values. Red dots: pre-miRNAs (left) or mature miRNAs (right) with absolute log2 ratios of RPKMs: log2 (RPKM in ADAR1-p110 IP/RPKM in ADAR2 IP) ≥ 1.0, log2 (RPKM in ADAR1-p110 input/RPKM in ADAR2 input) ≤ log2 (1.5) ≈ 0.58. Orange dots: opposite strand mature miRNA (5p or 3p) present in the same IP sample as the enriched mature miRNAs (red dots). Blue open circles: miRNA species for which an editing site was detected, regardless of miRNA maturation step (). Red arrow indicates pre-miRNA with editing site found on non-mature (hsa-mir-140) and blue arrows indicate pre-miRNAs with editing sites found on mature miRNA species (hsa-mir-7d and hsa-mir-181d-2). The remaining pre-miRNAs (left) or mature miRNAs (right) were shown as gray dots. Dashed lines of light gray color show the log2 ratio thresholds described above. Venn diagrams showing the numbers of pre-miRNA (b) and mature miRNAs (c) bound by ADAR1-p110 or ADAR2 isoform. (d) The pre-miRNAs (left) and mature miRNAs (right) corresponding to the red dots in (a) and ordered according to their log2 ratio. Pre-miRNAs (left) and mature miRNAs (right) enriched in the ADAR1-p110 and ADAR2 IP samples are shown in green and purple, respectively. Red arrow: ADAR1-p110-bound pre-miRNA that was found to be edited as non-mature by ADAR1-p110 (hsa-mir-140). Blue arrows: pre-miRNAs with editing site on the mature form in ADAR1-p110 (hsa-mir-181d-2) or ADAR2 (hsa-mir-7d) fractions (). Orange squares: mature miRNAs for which the opposite strand (5p or 3p) was also present in the same IP fraction, corresponding to the orange dots in (a).
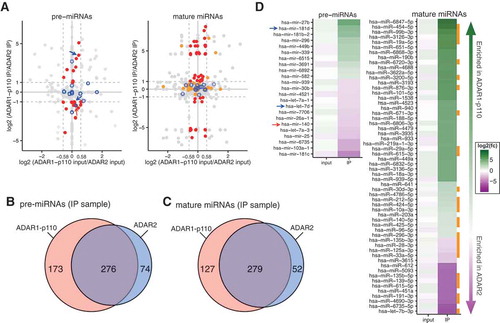
Figure 4. Predicted secondary structure of ADAR-bound pre-miRNAs. Distribution of estimated ∆G (kcal.mol−1) (a), longest double-stranded region with perfect complementarity in pre-miRNAs (b), and loop length (c) in different pre-miRNAs groups. Red box indicates “ADAR1-p110“-bound pre-miRNAs; blue, “ADAR2“-bound pre-miRNAs; green, ‘Expressed pre-miRNAs’ indicates all pre-miRNAs registered in miRBase which have both 5p and 3p annotations and expressed in both ADAR1-p110 and ADAR2 input samples. Error bars indicate standard deviation. BPP of pre-miRNAs (d) or mature miRNA duplexes (f) enriched in either ADAR1-p110 (red) or ADAR2 (blue) IP samples estimated by CentroidFold. All pre-miRNAs (d) or candidate mature miRNA duplexes (f) are shown in green. The abscissa indicates the relative distance measured from the loop middle point (set as 0, with −1 as the 3ʹ end of 5p miRNA, and + 1 as the 5ʹ end of 3p miRNA) in each individual pre-miRNA, defined by the output of secondary structure prediction. Numbers in parentheses indicate the number of miRNA species in each category. Green circles indicate the positions at which average BPPs significantly differ from those of ‘expressed pre-miRNAs’ (d) and ‘mature miRNA duplexes’ (f), respectively (Bootstrap-t method, Figure S7). Schematic secondary structures of pre-miRNAs (e) and candidate mature miRNA duplexes (g) enriched in the ADAR1-p110 IP or ADAR2 IP fractions, respectively. Red and blue lines: regions with significantly high BPPs compared to control; red and blue dotted lines: with significantly low BPPs in either 5p or 3p; gray lines: positions with no significance; gray dotted lines: positions with no significance for which the mean BPP of both 5p or 3p was lower than control.
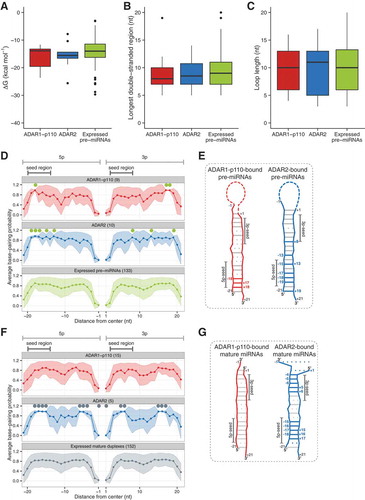
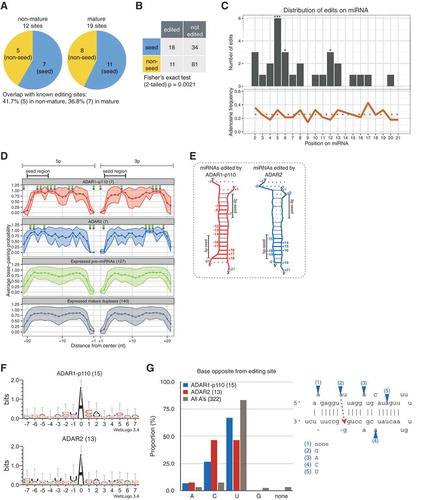
Figure 5. Positional, structural, and sequence editing preferences for each ADAR isoform on non-mature and mature miRNA. (a) Editing sites observed within non-seed (yellow) or seed (blue) regions of edited non-mature and mature miRNAs. Note that there is no overlap of editing sites between non-mature and mature miRNAs. (b) 2 × 2 contingency table describing the total number of edited or non-edited adenosines in the seed or non-seed regions (Fisher’s exact test, p < 0.01). (c) Top: distribution of editing sites along miRNA; Fisher’s exact test was performed by comparing the proportion of edited adenosines at each position compared to all the other positions (*** p < 0.01; ** p < 0.05; * p < 0.1); bottom: proportion of adenosines at each position along edited miRNA species from + 1 to + 21; dotted line: average frequency of adenosine. BPPs of edited ‘mature miRNA duplexes’ (d) and their predicted secondary structures (e) estimated by CentroidFold. (f) Editing motifs for each ADAR isoform generated using WebLogo version 3.4 (39) from sequences ranging from positions −7 to + 7 centered around the editing site. Bit score (log2) was normalized to the global nucleotide frequencies within human miRNA hairpin sequences obtained from miRBase. (g) Left: composition of nucleotides opposite from editing sites for ADAR1-p110 (red), ADAR2 (blue), and all adenosines within duplex regions (dark gray); left: schematic representation of the way opposite bases were assessed.
The pre- and mature miRNAs which carried editing sites were identified (Table S3 and 4) by our previously published method [Citation31] that exploits overlapped pair-end sequencing of small RNAs to enable the identification of statistically significant editing sites regardless of their editing frequency. The edited pre- and mature miRNAs are indicated by blue circles (). As for hsa-mir-140, editing was detected on the non-mature (red arrow in Fid. 3D and Table S4), but not on the mature form (Table S3), suggesting that editing may impair processing into mature miRNA in some cases, as described previously [Citation16]. The blue arrows indicate hsa-mir-181d and hsa-let-7d which were edited on the mature form ( and Table S3). The successful binding of miRNAs to ADARs and immunoprecipitation by anti-GFP antibody was confirmed using real-time PCR (Figure S6). Both pri-mir-21 and pri-mir-22 were more abundant than β-actin and GAPDH mRNA controls in the IP samples of both ADAR1-p110 and ADAR2, and were not enriched in the control IP, indicating that the procedure effectively immunoprecipitated these species.
2.4. Pre-miRNA structural features are important determinants of ADAR binding specificity
The results in indicate that a large subset of miRNAs bound to both ADAR1-p110 and ADAR2, but some were specific to either isoform. Speculating that pre-miRNA secondary structure may be responsible for the binding preferences of these two ADAR isoforms, we averaged the BPP for each position along pre-miRNA regions using the CentroidFold algorithm [Citation32] (see Materials and methods), since the secondary structure is expected to reflect the BPP. It is already common knowledge that pre-miRNAs adopt a stem-loop structure; this may limit the number of possible structural variants and makes the computational prediction of RNA secondary structure more reliable than for unknown or longer RNAs. The predicted structure for each pre-miRNA is displayed in Figure S5.
The distribution of ΔG values (kcal mol−1) for the ADAR1-p110- and ADAR2-bound pre-miRNAs described in was compared to that of all ‘expressed pre-miRNAs’ which were expressed in both ADAR1-p110 and ADAR2 input samples, and for which the 5p and 3p regions were both annotated in miRBase (); the ΔG distribution was not statistically different between pre-miRNAs bound by ADAR1-p110 (median = −13.9 kcal mol−1), ADAR2 (median = −15.6 kcal mol−1), and the controls that were expressed in both ADAR1-p110 and ADAR2 input (median = −14.0 kcal mol−1) ()). The differences were also not statistically significant for the length of the longest perfectly double-stranded region () and the loop length () of pre-miRNAs bound to each ADAR isoform, suggesting that the binding preference of ADAR isoforms to pre-miRNAs is unlikely to be affected by dsRNA length or loop length.
For a more in-depth analysis, we examined the differences in BPP within restricted portions of the duplex (stem) region of pre-miRNAs bound by each ADAR, relative to expressed pre-miRNAs (). In all expressed pre-miRNAs, the average BPP output by CentroidFold was higher in the center, and lower at both ends, consistent with previous knowledge that pre-miRNAs have a loop at one end, and low-stability overhangs at the other end (see ).
To find out which positions on ADAR1-p110- or ADAR2-bound pre-miRNAs are significantly more or less likely to form a base pair, a statistical test was performed on each position individually. To rule out potential bias due to large differences in sample size between ADAR-bound pre-miRNA and control expressed pre-miRNAs (Table S5), p-values were estimated using Monte Carlo simulation based on 10,000 iterations of bootstrap sampling (Figure S7, see Materials and methods). BPP was significantly high at positions −18 (p = 0.0004), + 17 (p = 0.0001), and + 18 (p = 0.0001) for ADAR1-p110-bound pre-miRNAs (, S7A). Interestingly, these positions are contained within the region that is furthest away from the loop on pre-miRNA annotations, and we will hereby refer to this as the ‘root region’ for clarity purposes. This pattern was even more obvious in the root region of pre-miRNAs preferentially bound to ADAR2 (). Indeed, the BPP was significantly high at positions −19 (p = 0.0005), −18 (p = 0.0037), −17 (p = 0.0039), −15 (p = 0.0155), −13 (p = 0.0002), + 8 (p = 0.0139), + 13 (p = 0.0001), and + 19 (p = 0.0107) (Figure S7B). These results are not only consistent with ADAR proteins’ binding to dsRNA, but they suggest that pre-miRNAs with imperfect base-pairing in the root region may be less prone to binding by ADAR2 than by ADAR1-p110.
The same analysis was performed for mature miRNAs. Since ADARs do not bind to single-stranded RNA molecules, three scenarios are possible: (1) ADARs bind to mature miRNA in their 5p:3p duplex form after Dicer processing; (2) ADARs pull-down miRNA strands that are bound to another target RNA, which may not have passed the size selection for small RNAs carried out before sequencing; (3) ADARs bind to mature miRNAs indirectly through protein-protein interaction with RISC components. Since (2) and (3) are beyond the scope of this experiment, we tested hypothesis (1) by looking for mature miRNAs that were enriched in ADAR1-p110 IP versus ADAR2 IP, or vice-versa (), for which the opposite strand (5p or 3p) was also present in the same IP fraction (RPKM ≥ 10). We found 15 candidate ‘mature miRNA duplexes’ for ADAR1-p110 IP, and 5 for ADAR2 IP, respectively (Table S6). As shown in , the BPPs were significantly high at positions −18 (p = 0.0072), −17 (p = 0.0001), −16 (p = 0.0001), −15 (p = 0.0001), −6 (p = 0.0001), −5 (p = 0.0001), −4 (p = 0.0417), + 5 (p = 0.0001), + 6 (p = 0.0001), + 15 (p = 0.0001), + 16 (p = 0.0008), and + 17 (p = 0.0312) for ADAR2-bound mature miRNA duplexes (Figure S7D). In contrast, no significance was observed at any position for ADAR1-P110-bound mature miRNA duplexes (). These results suggest a difference in the manner ADARs may handle binding to mature miRNAs.
2.5. Using the overlap of pair-end reads for high-confidence calling and statistical validation of a-to-i editing sites on miRNA
To identify the editing sites for small RNAs correctly, we used our procedure reported previously [Citation31] (Figure S8) which combines the method of high-confidence calling by pair-end sequencing of small RNAs and the previously described ‘collapse mapping’ strategy that enables the mapping of edited reads regardless of the number or distribution of a given mismatch type within the read [Citation14]. In this procedure, we took advantage of the short length of mature and pre-miRNA to use the overlap between the forward and reverse part of the same pair-end read. By doing this, we were able to select for editing sites that appeared at the same position on both strands of the pair, drastically reducing the chance of picking up sequencing errors (less than 10−6 for a QV cut-off of 30).
In this procedure, A-to-I editing is detected as A-to-G mismatch. After initial calling of A-to-G mismatches, we selected potential editing sites with a total raw coverage of at least 5 single-end equivalents (translating to more than 3 overlapping pair-ends) and an editing ratio above 0.1% and filtered out known SNPs (see Materials and methods and Figure S8A). To rule out false positives that may pass these thresholds, we tested the statistical significance of each candidate site over the error rate predicted by the sequence quality value using the previously described log-likelihood ratio test [Citation33]. For subsequent analyzes, longer reads (≥ 25 nt) were pooled into a ‘non-mature miRNA’ category, containing all types of miRNA biogenesis intermediates. Furthermore, since our computational strategy involved trimming the 5ʹ and 3ʹ ends of reads (see Materials and methods), we checked the total coverage for each individual position from the 5ʹ to the 3ʹ end of pre- and mature miRNAs as annotated in miRBase, to ensure that each position was similarly and reasonably covered [Citation34]. As expected, the results showed relatively low coverage at position + 1, corresponding to the 5ʹ-most base of mature miRNA annotation (Figure S9), which was therefore omitted from further analysis. Among the miRNAs identified in our data set, the minimum mature length was 21 nucleotides, and given that the total coverage was optimal between + 2 and + 21 on both mature and pre-miRNA, we decided to focus on this region only. In the end, we found 19 unique editing sites on mature miRNA, and 12 unique editing sites on non-mature miRNA between positions + 2 and + 21 (). There was no overlap between the editing sites on non-mature and mature miRNAs. The involved ADAR isoform(s), candidate editing sites, and their respective editing ratios in IP and input samples are summarized in Tables S3 and S4.
Editing in the seed (nucleotides + 2 to + 8) is involved in the retargeting of miRNA to a different set of mRNAs [Citation19,Citation20]. Speculating that an enrichment of editing sites in the seed may point towards a major biological function of ADARs in miRNA retargeting, we investigated the preferences in editing positions along non-mature and mature miRNAs. Edited and non-edited adenosines were counted for all edited miRNA species in the seed and non-seed regions, respectively, and summed up in a 2 × 2 contingency table (). The seed region was statistically more likely to carry an edited adenosine compared to the non-seed region (Fisher’s exact test, p = 0.0021). These results are corroborated by other studies [Citation26,Citation35], and are representative of the biological role of ADARs in the retargeting of miRNAs. The local distribution of A-to-I editing events along miRNA reveals that positions + 5, + 6 in the seed, and + 12 outside of the seed, are statistically more likely to be edited (). This was determined by comparing the number of edited and non-edited adenosines at each position with the respective total numbers at all other positions (Fisher’s exact test). Interestingly, position + 12 is physically close to the cleavage site of targets, which is usually positioned between + 10 and + 11 in the case of siRNA, suggesting that RNA editing may also regulate the efficiency of silencing through local modulation of base-pairing affinity.
2.6. A-to-i editing is correlated with high base-pairing stability in the seed duplex
To investigate the correlation between editing activity and average per-position BPP predicted by CentroidFold, we analyzed all edited miRNA species using the same procedure shown in . BPPs were significantly high at positions −17 (p = 0.0016), −16 (p = 0.0025), −14 (p = 0.0001), −13 (p = 0.005), −12 (p = 0.0008), −8 (p = 0.0275), −7 (p = 0.0001), + 7 (p = 0.0002), + 16 (p = 0.0025), + 17 (p = 0.0035) and + 18 (p = 0.0001) for edited mature miRNAs that were found exclusively in the ADAR1-p110 IP and input samples, and high at positions −19 (p = 0.0182), −18 (p = 0.0002), −15 (p = 0.0016), + 14 (p = 0.0001), + 15 (p = 0.0003), + 16 (p = 0.0004), and + 19 (p = 0.0001) for edited mature miRNAs that were exclusive to the ADAR2 samples. Moreover, significant positions remained the same whether compared to either expressed pre-miRNAs or mature miRNAs (). On the other hand, the terminal positions −21 (p = 0.0002), −1 (p = 0.0002) and + 1 (p = 0.0001) for ADAR1-p110, and positions −2 (p = 0.0001), −1 (p = 0.0001) and + 2 (p = 0.0324) for ADAR2 were less likely to be base-paired compared to control (Figure S7E and F). The results suggest that the likelihood of base-pairing throughout the pre-miRNA duplex is relatively more important for A-to-I editing than it is for binding by ADAR1-p110 but not by ADAR2 (). Given that mature miRNA duplexes hardly displayed any significant difference in BPP for ADAR1-p110 (), yet more than half of the editing events were detected on mature miRNAs, it seems reasonable to expect that the editing occurred on a precursor form that was subsequently processed into mature miRNA. In contrast, a high likelihood of base-pairing may be a major factor for binding by ADAR2. In either case, however, the BPP is high around the seed regions of both 5p and 3p miRNAs in the case of ADAR1-p110, and of 5p miRNAs for ADAR2 (, vertical gray bars). Thus, the enrichment of editing events in the seed region described in may be attributed to structural features that concentrate ADAR activity on miRNA duplexes with stable seed duplexes.
2.7. Sequence features in the vicinity and opposite of editing sites reveal potentially divergent roles of ADAR1-p110 and ADAR2 in miRNA regulation
To identify sequence preferences of ADAR isoforms around editing sites, we aligned 15 nt-long sequences centered on the candidate editing sites and calculated the Shannon entropy of each nucleotide position using the command line version of WebLogo 3.4 [Citation36]. Comparison between miRNA editing events associated to either ADAR1-p110 or ADAR2 revealed that the sequence motif is slightly broader for ADAR1-p110. In standard nomenclature, the motif would be U[A]SW (S for ‘strong’ = G or C, W for ‘weak’ = A or U) for ADAR1-p110 and U[A] for ADAR2 (). Editing sites that were detected in both ADAR samples were omitted in this analysis. These results are consistent with previous reports that ADAR2 edits dsRNA in a more sequence-independent manner (2), whereas the activity of ADAR1-p110 is more specific. Motif calculations were corrected for the average nucleotide frequencies found in the miRNA stem-loop regions annotated in miRBase (see Materials and methods).
We also checked the types of bases that were opposite to the editing sites visible in miRBase secondary structures. The majority of editing events are thought to occur at A:U sites, and this was corroborated by our results. However, this information needs to be put into perspective with the fact that the majority (83.2%) of A’s in miRNA duplex regions are paired with an U (). For the remaining A’s assumed to be within a bulge, interior loop, or non-Watson-Crick wobble base pair, both ADARs showed a preference for A/C bulges, and no editing sites occurred at A/G mismatches. The preference for A/C was particularly striking for ADAR2, which edited A/C and A:U pairs equally often (46.2%), despite the overwhelming majority of potential A:U substrates in miRNA duplex regions. Given that editing at A:U sites is expected to result in the formation of a I-U wobble base pair, whereas editing at A/C bulges changes an unpaired position into an I-C wobble base pair. We have previously confirmed that the melting temperature of A/C is much lower than I-C within dsRNA [Citation20], so it is reasonable to expect that the marked preference of ADAR2 for A/C bulges reflects a certain degree of functional divergence with ADAR1-p110, where ADAR2 might play a stabilizing role in the context of miRNA duplex regions.
3. Discussion
This study provides the first comprehensive analysis of ADAR1-p110 and ADAR2 isoform-specific binding and editing focused on miRNAs. Our RIP-seq analysis using overexpressed mGFP-tagged ADAR constructs simultaneously enabled the visualization of intracellular localization, discrimination between ADAR isoforms, and the identification of isoform-specific miRNA binding. The RIP-seq approach constitutes a complementary approach to previous studies using RNA-seq on total RNA [Citation5–Citation7], or even CLIP-seq [Citation35]. The main reason why we chose overexpression instead of pulling down of the endogenous protein of ADAR1-p110 or ADAR2 was the unavailability of antibodies that distinguish ADAR1-p110 from its longer isoform ADAR1-p150. Using this procedure, we successfully revealed the differential binding of two ADAR isoforms to coding and long noncoding transcripts [Citation37]. Two popular methods for investigating RNA-protein interactions are RNA immunoprecipitation (RIP) and cross-linking immunoprecipitation (CLIP). Coupled with high-throughput sequencing, the CLIP methodology has been successfully used to identify miRNA-protein interactions [Citation34]. However, traditional UV cross-linking is inefficient for dsRNA, as nucleic acids are less available for cross-link formation due to poor accessibility of the A-form helix major groove [Citation38]. In the improved method referred to as Photoactivatable-Ribonucleoside-Enhanced Crosslinking and Immunoprecipitation (PAR-CLIP), thymidine (T) to cytidine (C) or guanosine (G) to adenine (A) transitions are often observed at the crosslinking sites [Citation39]. It makes difficult to discriminate true editing sites from cross-linking-induced errors. Methylene blue (MB) as a photoreactive intercalating agent was successfully used to induce cross-linking of dsRNA to protein by visible light [Citation40,Citation41], but MB also mediates heavy oxidative damage to purines [Citation42], making downstream next-generation sequencing applications difficult. Out of these concerns, we opted for RIP-sequencing and compared mGFP-tagged ADAR overexpression with mGFP alone as a control for background editing by endogenous ADARs.
We manually curated the literature and found a total of 111 miRNAs that are edited in previous studies (Table S8), among which 47 miRNA species were detected in the HeLa cells used for our experiment (coverage ≥ 6 single-end equivalents). Among these, 20 miRNA species were significantly edited, 12 of which were edited at the same position as in previous studies. A-to-G mismatches that failed the LLR significance test were detected on 7 of the 27 remaining unedited miRNA species; among these, 3 were edited at the same positions as reported previously (miR-641-5p + 2 and + 3; miR-589-3p + 3 and + 6; miR-155-5p + 18) and may represent false negatives. A-to-I editing on the remaining 20 miRNAs previously reported but unedited in our study may be cell-line or tissue specific. All in all, when considering miRNAs that were expressed in HeLa, our RIP-seq experiment was able to detect significant editing in almost half of known edited miRNAs (Tables S3 and S4, Table S8).
Here, RIP-seq on size-selected small RNA (15–115 nt) enabled a distinction between several types of miRNA intermediate species based on insert length and on the percentage of overlap with annotated miRNA regions. Furthermore, our results highlight characteristic BPPs in the context of miRNA for the binding and editing of either ADAR1-p110 or ADAR2. The results may reflect the different configurations of dsRBDs: ADAR1-p110 has three dsRBDs but only two dsRBDs are present in ADAR2. We found that ADARs are more likely to bind pre-miRNAs with fewer mismatches or unpaired bases in the root region located opposite from the loop, and confirmed that editing sites tend to be enriched in the seed region of miRNA involved in mRNA targeting. Finally, ADAR1-p110-mediated editing tends to be more sequence-specific than ADAR2, and a marked preference of ADAR2 for A/C sites was observed in the context of miRNA, suggesting somewhat divergent roles of ADAR1-p110 and ADAR2 in miRNA regulation.
3.1. miRNA manqué: a potential new player in gene regulation?
We identified a new type of miRNA-related molecule, which we call miRNA manqué. They comprise either the 5p or 3p mature miRNA sequence and the intervening pre-miRNA loop region (). Previous evidence suggests that they may be a consequence of the asymmetrical cleavage by Dicer at only one site. Such Dicer cleavage intermediates were first revealed by an in vitro processing experiment using recombinant Dicer alone without its usual partner proteins, AGO2, PACT and TRBP [Citation43], suggesting that partner proteins may improve synchronization between the two RNase III domains of Dicer during pre-miRNA cleavage. Although the less interesting possibility remains that they are artefacts produced somehow during the preparation of sequencing libraries, a non-negligible fraction of reads corresponding to our definition of miRNA manqué with non-random sequences of miRNA manqué fragments were also found in the ENCODE small RNA-seq data of different cell lines (Figure S10), meaning that they are not specific to our experiment. Recent studies have reported the presence of RNA fragments generated by asymmetrical processing of tRNA, miRNA and snoRNA [Citation44]. For instance, the snoRNA (ACA45) is processed in a Dicer-dependent manner, and the resulting fragment is then able to carry out a function similar to miRNA [Citation45]. miRNA manqué may also be generated by asymmetrical Dicer processing and play a role in gene regulation. Interestingly, it was recently shown that miRNA precursors themselves can serve as post-transcriptional regulators of miRNA activity and are not always mere biogenesis intermediates [Citation46]. Thus, the possibility remains that some miRNA manqué may serve as silencing regulators. The mechanism leading to asymmetrical cleavage of miRNA by Dicer is not known, but is likely to depend on pre-miRNA structure rather than sequence [Citation47,Citation48]. Dicer is also known to sense the distance from the pre-miRNA 3ʹ-end, so that terminal modifications may also influence cleavage activity, as was observed for Lin-28 [Citation49].
3.2. miRNA structural determinants for binding and editing by specific ADARs
The sequence context of binding and deamination of RNA substrates by ADARs has been the subject of heavy investigation in vitro and in vivo, but little is known about the preferences in terms of secondary structure for each ADAR isoform. Our study explores for the structural features of precursor and mature miRNAs bound by either ADAR1-p110 or ADAR2. Although no significant differences were observed in terms of average ΔG, longest double-stranded region, and pre-miRNA loop length, we found that both the pre-miRNAs bound by ADAR1-p110 and ADAR2 tend to have a higher likelihood of base pairing in the root regions, especially for ADAR2 (). These observations are compatible with previous reports that relatively short dsRNA regions are sufficient for binding by ADARs, and that RNA structure such as bulges and internal loops regulate ADAR specificity [Citation2,Citation50].
Do ADARs also bind mature miRNA duplexes? Recently, mature miRNAs were found in the nucleus as well as in the cytoplasm due to shuttling of TNRC6A interacting with AGO [Citation51,Citation52] meaning that mature single-stranded miRNAs loaded onto AGO are not exclusively cytoplasmic as previously assumed. If these mature miRNAs form a duplex with target RNAs in the nucleus, they may immunoprecipitate with ADARs, for example indirectly through the interaction of ADAR1-p110 with RISC components [Citation16]. Unlike ADAR1-p110, ADAR2 does not physically interact with RISC [Citation17], leading to the possibility that it may bind mature miRNA duplexes directly before loading of one of the strands to AGO. The inability of ADAR2 to form protein-protein interactions with RISC may also position it as a competitor of RISC for binding of the miRNA:target duplex. Any of these two hypotheses could explain the large difference between BPP of candidate mature miRNA duplexes in the ADAR1-p110 and ADAR2 IP fractions (), and the topic is worthy of further investigation.
The relationship between miRNA structure and likelihood of editing remains unclear. In order to investigate the binding substrate preferences of each ADAR isoform, the data in and compare the binding between ADAR1-p110 and ADAR2 for miRNAs whose expression levels were relatively unchanged between ADAR1-p110- and ADAR2-overexpressing cells. Among these, one pre-miRNA (hsa-mir-140) was found to be both edited (Figure S5) and enriched for binding (Table S5) in the ADAR2 IP sample, whereas for two of the pre-miRNAs that were enriched for binding in either the ADAR2 IP (hsa-let-7d) or ADAR1-p110 IP (hsa-mir-181d) (Table S5), editing sites were detected on the mature forms instead (Table S7), suggesting that editing occurred at the pre-miRNA stage. In contrast, there was no overlap between mature miRNA species harboring editing sites (Table S7) and the mature miRNA duplexes suggested from the corresponding ADAR IP (Table S6). Furthermore, none of the edited mature miRNAs displayed any specific enrichment in any ADAR IP fraction (, right panel), confirming that ADARs do not edit mature miRNA directly. Another study previously suggested that ADAR knockdown in mice is correlated with reproducible changes in the expression levels of some miRNAs, but observed very little overlap between bound species and edited species [Citation53]. Further enzymology evidence on the kinetics of ADARs and their substrates is necessary, but these past findings and our results are consistent with a transient nature of binding for editing by ADARs. All in all, our results indicate that most editing events occur at the pre-miRNA stage, followed by miRNA processing, and that most of the ADARs binding enrichment observed for some mature miRNAs may happen indirectly via protein-protein interaction with RISC components or on miRNA:target duplexes as discussed above. However, the binding enrichment of mature miRNAs may happen in different manner between each ADAR isoform: ADAR1-p110 may bind mature miRNAs indirectly via protein-protein interaction with RISC components or on miRNA:target duplexes, but ADAR2 may bind mature miRNAs directly or via protein-protein interaction other than with RISC components. Alternatively, mature miRNAs are generated in the cytoplasm by Dicer, but ADAR1-p110 and ADAR2 are mainly localized in the nucleus. Furthermore, mature miRNAs are known to be transported back into the nucleus by GW-182 family protein [Citation51]. Thus, it is currently impossible to rule out that mature miRNA duplexes may be edited in the nucleus, and we are looking forward to future studies investigating this hypothesis.
3.3. Role of ADAR in miRNA function and significance
Our study presents a comprehensive map of candidate editing sites associated with specific ADAR isoforms. Comparing our results with those of twelve older studies in total, 12 of the 31 unique sites identified in this study (39%) were previously reported [Citation7,Citation15,Citation16,Citation26,Citation52–Citation63], and most sites corresponded to the adenosine that is most likely to be edited locally according to InosinePredict, an algorithm based on experimental data [Citation64]. Although the degree of significance may vary depending on the local base calling quality and coverage, these parameters were taken into account by the log-likelihood ratio (LLR) test [Citation65], which makes use of Bayesian statistics to estimate the probability of error versus the probability of a genuine editing site, combined with our small RNA paired-end technique to increase the signal-to-background ratio [Citation31]. Out of the 12 previously confirmed editing sites, three editing sites described by previous studies had editing ratios below 1%: miR-22-3p + 15 (0.214 ~ 0.518%), miR-210-5p + 12 (0.412%), and miR-151a-3p + 3 (0.690%). This suggests that our method can reliably detect low-level editing of genuine editing sites with an editing ratio threshold of 0.1%, and that the level of editing is likely to vary between cell types.
Although further study is warranted, the lack of overlap between editing sites in precursors and mature forms could be a consequence of either inhibition or enhancement of the miRNA maturation process, examples of which have been described by other studies [Citation15,Citation16,Citation23]. For instance, pri-mir-142 was the first example of ADAR-induced miRNA processing inhibition, as its editing interferes with cleavage by Drosha-DGCR8 in the nucleus and prevents the formation of mature miRNA [Citation23]. A subsequent study estimated the prevalence of such a mechanism by screening more than 209 pri-miRNAs, and reached the conclusion that up to ~ 16% of pri-miRNAs are subjected to A-to-I editing [Citation16]. Despite one example of editing on pri-mir-203 that enhanced processing efficiency, the study suggested that A-to-I editing would constitute a mechanism to prevent the maturation of miRNAs. In our study, out of 6 editing sites on mature miRNA which overlapped precisely with previous studies (Tables S3 and S4), 4 were previously described on pri- or pre-miRNA [Citation15,Citation16,Citation55,Citation56,Citation62], suggesting that processing by Drosha-DGCR8 or Dicer may not be impaired at those sites.
3.4. Enrichment of editing sites in the seed region of miRNAs
The miRNA seed region is the key sequence for target recognition, regulating the nature of target transcripts [Citation65,Citation66] and silencing efficiency [Citation67,Citation68]. A-to-I editing in the seed region has interesting consequences, the first example of which was the downregulation of a different subset of genes by an edited version of miR-376a-5p [Citation19]. Indeed, our recent study found that changing an adenosine to an inosine in the seed systematically results in genome-wide retargeting of mRNAs, and that the extent of downregulation differs between inosine and guanosine [Citation20]. While we were putting the present results together, two other studies suggested that editing sites are enriched in the seed [Citation26,Citation35]. Our conclusions are in line with these results, and further suggest that editing sites happen most frequently in the middle of the seed region, at position + 5 (, Fisher’s exact test p = 0.0023). The first five bases heavily influence silencing efficiency, most likely by changing the efficacy of unwinding of the miRNA duplex upon loading onto AGO [Citation68]. The enrichment at position + 5 therefore suggests an ambivalent role of A-to-I editing at the levels of miRNA loading and targeting. Most importantly, the finding that editing events preferably occur in the seed region () strongly indicates a general function of ADARs in the regulation of miRNA silencing efficiency. How ADARs evolved this function is an open question, and the mechanism by which A-to-I editing activity mainly targets seed sequences is yet unknown. Nevertheless, the RNA structural analysis shown in this study reveals that ADARs, and especially ADAR2, preferentially bind miRNAs with a higher likelihood of base-pairing in their seed regions, suggesting that miRNA duplex structure is an important determinant of ADAR activity ().
3.5. Differences between ADAR1-p110 and ADAR2 for miRNA editing site preference
Here, we show that previously reported editing motifs for ADAR1-p110 and ADAR2 also hold true in the context of miRNA (). In the immediate proximity of the editing site, both ADARs favor A’s that are immediately flanked in 5ʹ by an U. Interestingly, the motif was broader for ADAR1-p110, indicating higher sequence specificity, with a pattern that alternates weak and strong nucleotide pairs: SU[A]SW (W: weak, A or U; S: strong, G or C). Additionally, although the base opposite to the editing site was usually an U, as expected for mostly dsRNA sequences, the editing occurred extensively at A/C bulges, and was totally absent from A/G mismatches (). Since the conversion of A:U to an I-U wobble is expected to destabilize, and that of A/C to I-C to stabilize dsRNA, ADAR should play a major dual role in the regulation of miRNA duplex stability, which in turn may influence downstream processes such as unwinding by AGO and silencing efficiency [Citation20,Citation67,Citation68]. The preference exhibited by ADARs for A/C over other mismatches and the deleterious effect of A/G on editing is corroborated by other studies [Citation61,Citation69], and reflect a dual role of ADARs in regulating the stability of dsRNA. This result is also consistent with the observation that miRNAs edited by ADAR1-p110 tend to have higher BPP than those edited by ADAR2 (). Our results newly demonstrate that ADAR2 edited A/C pairs twice as frequently than ADAR1-p110, and further studies will investigate the consequences of this functional divergence on the regulation of miRNA duplex stability and gene regulation.
4. Materials and methods
4.1. Cell culture and transfection
3.0 × 10⁶ HeLa cells were inoculated on a 9-cm dish and incubated with Dulbecco’s modified Eagle medium (DMEM) (Invitrogen) supplemented with 10% heat-inactivated fetal bovine serum (SIGMA) at 37°C overnight with 5% CO2. Cells were transfected at < 50% confluency with each construct (5.5 μg/dish) mixed with Lipofectamine 2000 (Invitrogen) in Opti-MEM I (Invitrogen). Fluorescence microscopy, sample collections for RNA immunoprecipitation, western blotting, and silver staining were carried out two days after transfection at 37°C.
4.2. RNA immunoprecipitation
Immunoprecipitation (IP) and total RNA purification were performed with the RiboCluster Profiler RIP-Assay Kit (MBL, RN1001). HeLa cells transfected with mGFP-tagged expression constructs of ADAR isoforms [Citation37] were washed in PBS(-) five times, and immunoprecipitated with anti-GFP antibody (Clonetech) or normal rabbit IgG as a control. For Western blotting and silver staining, 2 μl of lysate and 100 μl of final wash mixture were used as input and IP samples, respectively. Total RNA was purified from the remaining samples according to the manufacturer’s protocol, and treated with 0.88U TURBOTM DNase (Invitrogen).
4.3. Construction of small RNA libraries and sequencing
RNA libraries were prepared according to established protocols (Illumina TruSeq Small RNA Sample Prep Kit, Part #15004197 Rev. C) after removal of rRNA sequences with the RiboZeroTM Magnetic Gold Kit (epicentre, MRZE706). cDNA sized 133–228 bp was cut out from a polyacrylamide gel, corresponding to 15–110 bp of genomic sequence without linkers, which should include most pre- and mature miRNAs. The libraries were sequenced by HiSeq2000 101 nt in pair-end mode. The sequencing reads in FASTQ format were generated by CASAVA version 1.8.2.
4.4. Quantification of relative pre- and mature miRNA expression levels
Adapter-trimmed reads with an average Phred-scaled quality score above 25 were uniquely aligned to the UCSC human genome (hg19) with bowtie version 0.12.7 [Citation70] with the following command line arguments (seed length: 18; allowed mismatches: 2): ‘bowtie – best – strata – all -m 1 -l 18 – chunkmbs 1024ʹ. After counting raw read coverage per pre- or mature miRNA annotation with the HTSeq package [Citation71], reads corresponding to miRNAs were normalized by ‘reads per kilobase per million reads’ (RPKM). In order to visualize all samples and their respective ‘no mismatch’ and ‘A-to-G mismatch only’ reads, we developed a command line-based small RNA-seq visualizer named cligb which automatically displays the reads aligned to a given genomic region [https://github.com/soh-i/cligb]. It is a Python wrapper of the Gviz (version 1.10.2) Bioconductor package [Citation72].
4.5. Computational prediction of base-pairing probability within pre-miRNA sequences
The BPPs of individual nucleotides within pre-miRNA sequences were calculated by CentroidFold version 0.0.15 [Citation32] with default parameters and the following command line: ‘centroid_fold – posteriors 0.0001 – oposteriors’. The pre-miRNA sequences registered as ‘stem-loop’ sequences in miRBase release 20 [Citation30] contain several nucleotides of extra sequences overlapping with pri-miRNA regions at both the 5ʹ and 3ʹ ends. These sequences were carefully truncated based on mature −3p and −5p annotations to compile theoretically true pre-miRNA sequences. The command line version of CentroidFold outputs a BPP matrix (BPPM) for every possible pair of bases in the input sequence. The BPP for a given base i in the nucleotide sequence was calculated as the sum of all pairing probabilities for i. Calculation of BPP from the output of each BPPM was performed with a custom script available at [https://github.com/soh-i/centroid_bpp]. The base-pairing profile for each pre-miRNA was estimated by computing the average BPP for each position along pre-miRNA, centered on the middle of the loop region. The secondary structure predicted by CentroidFold is also output as a dot-bracket format representing single- or double-stranded regions of pre-miRNA structures. We parsed this information to extract secondary structure features such as loop length, and maximum length of dsRNA without bulges. For statistical evaluation of BPP difference for each position, we estimated the bootstrap p-value using Monte Carlo simulation. BPP matrix for each miRNAs were extracted by bootstrap sampling with B times (B = 10,000), and the T-statistics (T*1, T*2, …, T*B) for each bootstrapped sample was then calculated. The P-values (P = Pr{t* ≥ T}) were then estimated based on the bootstrap distribution of T* at each position.
4.6. Read mapping and calling of editing sites
This analysis was conducted independently from the expression analyzes ( and ) of miRNAs. Accurate miRNA sequencings were selected using strategy filter out sequencing errors by paired-end sequencing procedure, and combined with collapse mapping procedure. While the expression analysis simply applied standard bowtie mapping, for genuine editing site calling we took advantage of the overlap between paired-end reads on small RNAs to rule out sequencing error [Citation31], and applied the previously described collapse mapping procedure designed for unbiased detection of A-to-G mismatches [Citation14]. The analysis pipeline is shown in Figure S8A. Briefly, following removal of adapter sequences for sequencing, reads were trimmed by 1 base at the 5ʹ-end and 2 bases at the 3ʹ-end of the pair. The terminal bases with a quality value below 30 were trimmed off, and reads under 10 nucleotides long were discarded. The remaining reads were aligned to the UCSC human genome (hg19) using SOAP2 (version 2.21) [Citation73]. For ‘normal mapping’, no mismatches were allowed and we kept only the reads that mapped uniquely to the genome. To retrieve the reads that had A-to-G modifications, we performed ‘collapse mapping’ on the subset of reads that were unmapped by normal mapping [Citation14] (Figures S8B and C). Both the reference genome and the unmapped reads were ‘collapsed’ to a three-base system as follows: both (+) and (-) strand reads were A-to-G collapsed, and aligned to the A-to-G or T-to-C collapsed reference genomes, respectively. Multiple hits were allowed (less than 21), but mismatches were not. In the end, all reads were reverted back to their original sequences and compared to the original genome. Reads with any type of misalignment other than A-to-G, and reads that aligned to multiple sites were discarded. To further increase read quality, pair-end reads for which the 5ʹ and 3ʹ sequences did not perfectly match were discarded, and the overlap was merged as a ‘high-confidence read’. The number of reads containing all types of mismatches (A-to-G, A-to-C, A-to-U, G-to-C, G-to-U, G-to-A, C-to-U, C-to-A, C-to-G, U-to-A, U-to-G, and U-to-C) in each sample were calculated (Figure S11A). A-to-G mismatches were present in 55.8% of these reads for the ADAR1-p110 IP sample, 48.5% in ADAR1-p110 input, 59.1% in ADAR2 IP, 48.4% in ADAR2 input, and 50.2% in GFP input, and the number of reads in which both strands of paired-end reads contained single A-to-G mismatched sites were 27–29%. The numbers of reads discarded were shown in Figure S11B, and their percentages of reads discarded were 72% for ADAR1-p110 IP sample, 73% for ADAR1-p110 input sample, 73% for ADAR2 IP sample, 72% for ADAR2 input sample, and 71% for GFP input control sample (Figure S11C). Since all individual bases have a QV > 30, it is expected that the same position covered twice by pair-end sequencing should have QV > 60 (1 error in 106 bases). Aftercalling of A-to-G mismatches in the miRNA regions and selection of sites with an editing ratio > 0.1% and a coverage ≥ 6 single-end equivalents for non-mature miRNAs (cf. below), SNPs listed in the 1000 Genomes database, release 16 [Citation74] were filtered out, resulting in the removal of just one site (miR-339-3p + 15, SNP number rs72631820; A > G) (Table S3). The same threshold levels of an editing ratio and a coverage were used for mature miRNAs, but the result was not changed when the coverage was increased up to 12 pair end reads (Table S4). Statistical validation of the editing sites versus sequencing error rate was performed on a single-base level based on the coverage and quality values at each position using the log-likelihood ratio (LLR) test described previously (LLR > 2) [Citation33]. The ‘editing ratio’ (ER) for each A-to-G site was calculated from the single-base coverage of collapse and normal mapping using the following formula:
where N-collapse and N-normal are defined as the per-nucleotide coverage for a given base type.
4.7. Sequence motifs around editing sites
To explore nucleotide preferences around A-to-I editing sites by each ADAR isoform, we used WebLogo version 3.4 [Citation36] to generate sequence logos. WebLogo allows normalization to the base composition of the genome or gene family of interest. The base composition of all human miRNA hairpin sequences registered in miRBase (release 21) was thus input to the command line version of WebLogo as follows: – composition {A: 22.70, C: 23.90, G: 27.22, T: 26.18}.
5. Data availability statement
The RIP-seq data generated in this study have been submitted to the DNA Data Bank of Japan (DDBJ; http://www.ddbj.nig.ac.jp, accession number xxxxxxxx).
Supplemental Material
Download Zip (5.8 MB)Acknowledgments
We thank Kenji Nishi from KU-T laboratory for providing the pmyc-GFP-TNRC6A plasmid and technical advice, and all members of KU-T laboratory for helpful discussions. SI, JG, and RI performed the bulk of experimental and computational work and earned equal contribution. YS carried out next-generation sequencing. SK and MO-H participated in computational analyzes. The manuscript was drafted by JG, SI, and KU-T, and figures prepared by SI and JG. MT and KU-T were involved in reviewing the manuscript. KU-T designed the study, and is responsible for scientific correspondence. All authors read and approved the final manuscript.
Disclosure statement
No potential conflict of interest was reported by the authors.
Supplementary Material
Supplemental data for this article can be accessed here.
Additional information
Funding
Related Research Data
References
- Nishikura K. Functions and regulation of RNA editing by ADAR deaminases. Annu Rev Biochem. 2010;79:321–349.
- Barraud P, Allain FH. ADAR proteins: double-stranded RNA and Z-DNA binding domains. Curr Top Microbiol Immunol. 2012;353:35–60.
- Savva YA, Rieder LE, Reenan RA. The ADAR protein family. Genome Biol. 2012;13:5–10.
- Li JB, Levanon EY, Yoon J, et al. Genome-wide identification of human RNA editing sites by parallel DNA capturing and sequencing. Science. 2009;324:1210–1213.
- Bahn JH, Lee JH, Li G, et al. Accurate identification of A-to-I RNA editing in human by transcriptome sequencing. Genome Res. 2012;22:142–150.
- Peng Z, Cheng Y, Tan BC, et al. Comprehensive analysis of RNA-Seq data reveals extensive RNA editing in a human transcriptome. Nat Biotechnol. 2012;30:253–260.
- Ramaswami G, Lin W, Piskol R, et al. Accurate identification of human Alu and non-Alu RNA editing sites. Nat Methods. 2012;9:579–581.
- Scadden ADJ. The RISC subunit Tudor-SN binds to hyper-edited double-stranded RNA and promotes its cleavage. Nat Struct Mol Biol. 2005;12:489–496.
- Morita Y, Shibutani T, Nakanishi N, et al. Human endonuclease V is a ribonuclease specific for inosine-containing RNA. Nat Commun. 2013;4:2273.
- Vik ES, Nawaz MS, Strøm Andersen P, et al. Endonuclease V cleaves at inosines in RNA. Nat Commun. 2013;4:2271.
- Nishikura K, Yoo C, Kim U, et al. Substrate specificity of the dsRNA unwinding/modifying activity. EMBO J. 1991;10:3523–3532.
- Polson AG, Bass BL. Preferential selection of adenosines for modification by double-stranded RNA adenosine deaminase. EMBO J. 1994;13:5701–5711.
- Heale BSE, Keegan LP, McGurk L, et al. Editing independent effects of ADARs on the miRNA/siRNA pathways. EMBO J. 2009;28:3145–3156.
- Wu D, Lamm AT, Fire AZ. Competition between ADAR and RNAi pathways for an extensive class of RNA targets. Nat Struct Mol Biol. 2011;18:1094–1101.
- Kawahara Y, Zinshteyn B, Chendrimada TP, et al. RNA editing of the microRNA‐151 precursor blocks cleavage by the Dicer–TRBP complex. EMBO Rep. 2007;8:763–769.
- Kawahara Y, Megraw M, Kreider E, et al. Frequency and fate of microRNA editing in human brain. Nucleic Acids Res. 2008;36:5270–5280.
- Ota H, Sakurai M, Gupta R, et al. ADAR1 forms a complex with Dicer to promote microRNA processing and RNA-Iinduced gene silencing. Cell. 2013;153:575–589.
- Bushati N, Cohen SM. microRNA functions. Annu Rev Cell Dev Biol. 2007;23:175–205.
- Kawahara Y, Zinshteyn B, Sethupathy P, et al. Redirection of silencing targets by adenosine-to-inosine editing of miRNAs. Science. 2007;315:1137–1140.
- Kume H, Hino K, Galipon J, et al. A-to-I editing in the miRNA seed region regulates target mRNA selection and silencing efficiency. Nucleic Acids Res. 2014;42:10050–10060.
- Han J, Lee Y, Yeom KH, et al. The Drosha-DGCR8 complex in primary microRNA processing. Genes Dev. 2004;18:3016–3027.
- Zeng Y, Cullen BR. Structural requirements for pre-microRNA binding and nuclear export by Exportin 5. Nucleic Acids Res. 2004;32:4776–4785.
- Yang W, Chendrimada TP, Wang Q, et al. Modulation of microRNA processing and expression through RNA editing by ADAR deaminases. Nat Struct Mol Biol. 2006;13:13–21.
- Iizasa H, Wulff BE, Alla NR, et al. Editing of Epstein-Barr virus-encoded BART6 microRNAs controls their dicer targeting and consequently affects viral latency. J Biol Chem. 2010;285:33358–33370.
- Kawamata T, Seitz H, Tomari Y. Structural determinants of miRNAs for RISC loading and slicer-independent unwinding. Nat Struct Mol Biol. 2009;16:953–960.
- Warnefors M, Liechti A, Halbert J, et al. Conserved microRNA editing in mammalian evolution, development and disease. Genome Biol. 2014;15:R83.
- Poulsen H, Nilsson J, Damgaard CK, et al. CRM1 mediates the export of ADAR1 through a nuclear export signal within the Z-DNA binding domain. Mol Cell Biol. 2001;21:7862–7871.
- Desterro JM, Keegan LP, Lafarga M, et al. Dynamic association of RNA-editing enzymes with the nucleolus. J Cell Sci. 2003;116:1805–1818.
- Feng S, Li H, Zhao J, et al. Alternate rRNA secondary structures as regulators of translation. Nat Struct Mol Biol. 2011;18:169–176.
- Kozomara A, Griffiths-Jones S. miRBase: annotating high confidence microRNAs using deep sequencing data. Nucleic Acids Res. 2014;42:D68–D73.
- Galipon J, Ishi R, Ishiguro S, et al. High-quality overlapping paired-end reads for the detection of A-to-I editing on small RNA. Methods Mol Biol. 2018;1823:167–183.
- Sato K, Hamada M, Asai K, et al. CENTROIDFOLD: a web server for RNA secondary structure prediction. Nucleic Acids Res. 2009;37:W277–80.
- Chepelev I. Detection of RNA editing events in human cells using high-throughput sequencing. Methods Mol Biol. 2012;815:91–102.
- Licatalosi DD, Mele A, Fak JJ, et al. HITS-CLIP yields genome-wide insights into brain alternative RNA processing. Nature. 2008;456:464–469.
- Bahn JH, Ahn J, Lin X, et al. Genomic analysis of ADAR1 binding and its involvement in multiple RNA processing pathways. Nat Commun. 2015;6:6355.
- Crooks GE, Hon G, Chandonia JM, et al. WebLogo: a sequence logo generator. Genome Res. 2004;14:1188–1190.
- Galipon J, Ishii R, Suzuki Y, et al. Differential binding of three major human ADAR isoforms to coding and long non-coding transcripts. Genes. 2017;8:E68.
- Weeks KM, Crothers DM. Major groove accessibility of RNA. Science. 1993;261:1574–1577.
- Hafner M, Landthaler M, Burger L, et al. Transcriptome-wiede identification of RNA-binding protein and microRNA target sites by PAR-CLIP. Cell. 2010;141:129–141.
- Liu ZR, Sargueil B, Smith CW. Methylene blue-mediated cross-linking of proteins to double-stranded RNA. Methods Enzymol. 2000;318:22–33.
- Liu ZR, Wilkie AM, Clemens MJ, et al. Detection of double-stranded RNA-protein interactions by methylene blue-mediated photo-crosslinking. RNA. 1996;2:611–621.
- Tuite EM, Kelly JM. Photochemical interactions of methylene blue and analogues with DNA and other biological substrates. J Photochem Photobiol. 1993;21:103–124.
- Takahashi T, Miyakawa T, Zenno S, et al. Distinguishable in vitro binding mode of monomeric TRBP and dimeric PACT with siRNA. PLoS ONE. 2013;8:e63434.
- Li Z, Ender C, Meister G, et al. Extensive terminal and asymmetric processing of small RNAs from rRNAs, snoRNAs, snRNAs, and tRNAs. Nucleic Acids Res. 2012;40:6787–6799.
- Ender C, Krek A, Friedländer MR, et al. A human snoRNA with microRNA-like functions. Mol Cell. 2008;32:519–528.
- Roy-Chaudhuri B, Valdmanis PN, Zhang Y, et al. Regulation of microRNA-mediated gene silencing by microRNA precursors. Nat Struct Mol Biol. 2014;21:825–832.
- Feng Y, Zhang X, Graves P, et al. A comprehensive analysis of precursor microRNA cleavage by human Dicer. RNA. 2012;18:2083–2092.
- Gu S, Jin L, Zhang Y, et al. The loop position of shRNAs and pre-miRNAs is critical for the accuracy of Dicer processing in vivo. Cell. 2012;151:900–911.
- Heo I, Joo C, Cho J, et al. Lin28 mediates the terminal uridylation of let-7 precursor microRNA. Mol Cell. 2008;32:276–284.
- Ohman M, Källman AM, Bass BL. In vitro analysis of the binding of ADAR2 to the pre-miRNA encoding the GluR-B R/G site. RNA. 2000;6:687–697.
- Nishi K, Nishi A, Nagasawa T, et al. Human TNRC6A is an Argonaute-navigator protein for microRNA-mediated gene silencing in the nucleus. RNA. 2013;19:17–35.
- Nishi K, Takahashi T, Suzawa M, et al. Control of the localization and function of a miRNA silencing component TNRC6A by Argonaute protein. Nucleic Acids Res. 2015;43:9856–9873.
- Vesely C, Tauber S, Sedlazeck FJ, et al. Adenosine deaminases that act on RNA induce reproducible changes in abundance and sequence of embryonic miRNAs. Genome Res. 2012;22:1468–1476.
- Alon S, Mor E, Vigneault F, et al. Systematic identification of edited microRNAs in the human brain. Genome Res. 2012;22:1533–1540.
- Luciano DJ, Mirsky H, Vendetti NJ, et al. RNA editing of a miRNA precursor. RNA. 2004;10:1174–1177.
- García-López J, Hourcade J, del Mazo J. Reprogramming of microRNAs by adenosine-to-inosine editing and the selective elimination of edited microRNA precursors in mouse oocytes and preimplantation embryos. Nucleic Acids Res. 2013;41:5483–5493.
- Kiran A, Baranov PV. DARNED: a DAtabase of RNA Editing in humans. Bioinformatics. 2010;26:1772–1776.
- Ekdahl Y, Farahani HS, Behm M, et al. A-to-I editing of microRNAs in the mammalian brain increases during development. Genome Res. 2012;22:1477–1487.
- Ramaswami G, Zhang R, Piskol R, et al. Identifying RNA editing sites using RNA sequencing data alone. Nat Methods. 2013;10:128–132.
- Ramaswami G, Li JB. RADAR: a rigorously annotated database of A-to-I RNA editing. Nucleic Acids Res. 2013;42:D109–113.
- Blow M, Futreal PA, Wooster R, et al. A survey of RNA editing in human brain. Genome Res. 2004;14:2379–2387.
- Tomaselli S, Galeano F, Alon S, et al. Modulation of microRNA editing, expression and processing by ADAR2 deaminase in glioblastoma. Genome Biol. 2015;16:5.
- Wang Y, Xu X, Yu S, et al. Systematic characterization of A-to-I RNA editing hotspots in microRNAs across human cancers. Genome Res. 2017;27:1112–1125.
- Eggington JM, Greene T, Bass BL. Predicting sites of ADAR editing in double-stranded RNA. Nat Commun. 2011;2:319.
- Grimson A, Farh KK, Johnston WK, et al. MicroRNA targeting specificity in mammals: determinants beyond seed pairing. Mol Cell. 2007;27:91–105.
- Lim LP, Lau NC, Garrett-Engele P, et al. Microarray analysis shows that some microRNAs downregulate large numbers of target mRNAs. Nature. 2005;433:769–773.
- Ui-Tei K, Naito Y, Nishi K, et al. Thermodynamic stability and Watson-Crick base pairing in the seed duplex are major determinants of the efficiency of the siRNA-based off-target effect. Nucleic Acids Res. 2008;36:7100–7109.
- Hibio N, Hino K, Shimizu E, et al. Stability of miRNA 5′terminal and seed regions is correlated with experimentally observed miRNA-mediated silencing efficacy. Sci Rep. 2012;2:996.
- Riedmann EM, Schopoff S, Hartner JC, et al. Specificity of ADAR-mediated RNA editing in newly identified targets. RNA. 2008;14:1110–1118.
- Langmead B, Trapnell C, Pop M, et al. Ultrafast and memory-efficient alignment of short DNA sequences to the human genome. Genome Biol. 2009;10:R25.
- Anders SP, Huber W. HTSeq–a Python framework to work with high-throughput sequencing data. Bioinformatics. 2015;31:166–169.
- Hahne F, Durinck S, Ivanek R, et al. Gviz: plotting data and annotation information along genomic coordinates. R Package Version. 2013;1(4).
- Li R, Yu C, Li Y, et al. SOAP2: an improved ultrafast tool for short read alignment. Bioinformatics. 2009;25:1966–1967.
- 1000 Genomes Project Consortium, Abecasis GR, Auton A, Brooks LD, et al. An integrated map of genetic variation from 1,092 human genomes. Nature. 2012;491:56–65.