
 ?Mathematical formulae have been encoded as MathML and are displayed in this HTML version using MathJax in order to improve their display. Uncheck the box to turn MathJax off. This feature requires Javascript. Click on a formula to zoom.
ABSTRACT
The development and progression of numerous complex human diseases have been confirmed to be associated with microRNAs (miRNAs) by various experimental and clinical studies. Predicting potential miRNA-disease associations can help us understand the underlying molecular and cellular mechanisms of diseases and promote the development of disease treatment and diagnosis. Due to the high cost of conventional experimental verification, proposing a new computational method for miRNA-disease association prediction is an efficient and economical way. Since previous computational models ignored the hubness phenomenon, we presented a novel computational model of Bipartite Local models and Hubness-Aware Regression for MiRNA-Disease Association prediction (BLHARMDA). In this method, we first used known miRNA-disease associations to calculate the Jaccard similarity between miRNAs and between diseases, then utilized a modified kNNs model in the bipartite local model method. As a result, we effectively alleviated the detriments from ‘bad’ hubs. BLHARMDA obtained AUCs of 0.9141 and 0.8390 in the global and local leave-one-out cross validation, respectively, which outperformed most of the previous models and proved high prediction performance of BLHARMDA. Besides, the standard deviation of 0.0006 in 5-fold cross validation confirmed our model’s prediction stability and the averaged prediction accuracy of 0.9120 showed the high precision of our model. In addition, to further evaluate our model’s accuracy, we implemented BLHARMDA on three typical human diseases in three different types of case studies. As a result, 49 (Esophageal Neoplasms), 50 (Lung Neoplasms) and 50 (Carcinoma Hepatocellular) out of the top 50 related miRNAs were validated by recent experimental discoveries.
Introduction
MicroRNAs (miRNAs) are one kind of short endogenous non-coding RNAs (ncRNAs) with the length of 20 ~ 25 nucleotides [Citation1]. They can bind to the 3′ untranslated regions (UTRs) of the target messenger RNAs (mRNAs) and suppress the expression of their target mRNAs at post-transcriptional level through sequence-specific base pairing [Citation1–Citation4]. By this way, miRNAs can influence various biological processes including cell proliferation [Citation5], development [Citation6], differentiation [Citation7], and apoptosis [Citation8], metabolism [Citation9,Citation10], aging [Citation9,Citation10], signal transduction [Citation11], viral infection [Citation7] and so on. In the recent several years, thousands of miRNAs have been detected based on various experimental methods and computational models since the first two miRNAs (Caenorhabditis elegans lin-4 and let-7) were discovered more than twenty years ago [Citation12–Citation15]. There are 26,845 entries in the latest version of miRBase, including more than 1000 human miRNAs [Citation16]. As accumulating experiments on miRNAs had been conducted, it was observed that miRNAs with similar sequences or secondary structures tend to play roles in similar biological processes [Citation15]. Furthermore, the dysregulations of the miRNAs have been confirmed to be associated with the development and progression of various complex human diseases [Citation17–Citation19]. Recently, plenty of studies have found that miRNAs are associated with various cancers or cancer related processes [Citation20]. For example, Chandramouli et al. [Citation21] illustrated that there was an inverse correlation between the levels of miR-101 and EP4 receptor protein in colon cancer. The co-transfection of EP4 receptor could rescue colon cancer cells from the tumor suppressive effects of miR-101. However, EP4 receptor is negatively regulated by miR-101. Thus, the ectopic expression of miR-101 could markedly reduce the proliferation and motility of colon cancer cells. Otsubo et al. [Citation22] demonstrated that miR-126 inhibited SRY (sex-determining region Y)-box 2 (SOX2) expression by targeting two binding sites in the 3′-UTR of SOX2 mRNA in multiple cell lines. SOX2 plays important roles in growth inhibition through cell cycle arrest and apoptosis. However, the SOX2 expression is frequently down-regulated in gastric cancers. One reason is that the highly expression of miR-126 in some cultured and primary gastric cancer cells leads to the low levels of SOX2 protein in gastric cancer cells. Besides, Nathans et al. [Citation23] found that highly abundant miR-29a was identified in HIV-1-infected human T lymphocytes. The miR-29a specifically targets the HIV-1 3ʹ-UTR region. Specific interactions between miR-29a and HIV-1 mRNA enhance viral mRNA association with RNA-induced silencing complexes and P-body Proteins. Thus, inhibiting miR-29a enhanced HIV-1 viral production and infectivity, whereas expressing a miR-29a suppressed viral replication.
Therefore, the identifying of disease-related miRNAs could help us better understand the mechanism of complex human diseases, thus promoting the development of the diagnosis, treatment, and prevention of diseases [Citation24–Citation26]. However, identifying the associations between miRNAs and diseases by traditional experimental methods is demanding and costly. Therefore, finding a more economical and efficient way to predict the potential disease-related miRNAs is necessary. Today, with more and more reliable biological datasets, developing a high-efficiency computational method to uncover the potential associations between miRNAs and diseases has become a good way to overcome the drawbacks of traditional experimental methods [Citation27–Citation34].
In the past few years, remarkable progresses have been made in the development of prediction models for identifying potential miRNA-disease associations. Moreover, numerous computational methods have been developed based on different biological networks, systems and perspectives. Those methods could be further divided into the four categories, score function-based, machine learning-based, complex network algorithm based and multiple biological information based models [Citation35]. Furthermore, most models were constructed based on the assumption that functionally similar miRNAs usually have connection with phenotypically similar diseases [Citation36–Citation38].
Lots of previous models were constructed based on network analysis algorithms. Chen et al. [Citation30] proposed the RWRMDA model by implementing random walk with restart on the miRNA functional similarity network to make prediction for the associations. However, this model can’t make prediction for new diseases without known related miRNAs. Then, Xuan et al. [Citation39] proposed the method named Human Disease-related MiRNA Prediction (HDMP) by integrating the known miRNA-disease associations, the miRNA functional similarity, the disease semantic similarity and the disease phenotype similarity. Furthermore, miRNAs in the same miRNA family or cluster were assigned higher weight. Then the prediction for potential miRNA-disease association was made based on the information of each miRNA’s k most similar neighbors. However, HDMP still fails to overcome the problem of making prediction for new diseases, but nonetheless it is a global method which can be used to predict all miRNA-disease associations simultaneously. Mørk et al. [Citation40] proposed miRPD in which miRNA-Protein-Disease associations were explicitly inferred. A scoring scheme which involved the scores of miRNA-disease associations was constructed by combining the text-mining scores of miRNA-protein associations and the protein-disease associations. Xuan et al. [Citation41] further proposed the MIRNAs associated with Diseases Prediction (MIDP) model based on random walk on the network by exploiting the more useful information from the miRNA functional similarity network, the disease semantic similarity network, and the edges between the two networks to predict reliable disease miRNA candidates. This model overcame the limitation of previous models which were unable to make association predictions for diseases without known related miRNAs by an extended walk on the network. Moreover, the negative effect of noisy data was relieved by controlling the distance the walkers go away from the labeled nodes via restarting the walking.
In order to obtain a better prediction accuracy, Chen et al. [Citation42] proposed the Within and Between Score for MiRNA–Disease Association prediction (WBSMDA) model by integrating the known miRNA-disease associations, the miRNA functional similarity, the disease semantic similarity and the Gaussian interaction profile kernel similarity for diseases and miRNAs into a composite network. According to the network analysis, they calculated and combined the within-score and between-score to obtain the final score for potential miRNA-disease association prediction. Chen el al [Citation43]. further presented the Heterogeneous graph inference for miRNA-disease association prediction (HGIMDA) model based on a heterogeneous graph which was constructed by the same information as WBSMDA. Then an iteration equation was constructed on the heterogeneous graph to further infer the potential miRNA-disease associations. HGIMDA could be effectively applied to new diseases and new miRNAs without any known associations. Later, Li et al. [Citation44] proposed the Matrix Completion for MiRNA-Disease Association prediction (MCMDA) model by utilizing the matrix completion algorithm to update the adjacency matrix of known miRNA-disease associations. Through iteratively calculating the predictive scores for the candidate miRNA-disease associations, they obtained a highly reliable outcome. Then, Pasquier et al. [Citation45] proposed the MiRAI model by representing distributional information on miRNAs and diseases in a high-dimensional vector space and defining associations between miRNAs and diseases in terms of their vector similarity in order to reveal the information attached to miRNAs and diseases by distributional semantics. Yu et al. [Citation46] proposed the MaxFlow model based on the network information of flow model. In this method, they constructed a miRNAome-phenome network built by combining the miRNA functional similarity network, the disease semantic and phenotypic similarity network and the miRNA-disease associations network, thus uncovering the accurate miRNA-disease associations.
Additionally, there are also some computational models based on machine learning. Chen et al. [Citation34] proposed the Regularized Least Squares for MiRNA-Disease Association (RLSMDA) method to make prediction for miRNA-disease associations. RLSMDA, a semi-supervised model, could suffice the model-training without negative samples. Then, Chen et al. [Citation32] further proposed the Restricted Boltzmann Machine for Multiple types of MiRNA-Disease Association prediction (RBMMMDA) model which is the first model that can obtain not only new miRNA-disease associations, but also corresponding association types. This model used Restricted Boltzmann machine to predict four different types of miRNA-disease associations from a two-layered undirected miRNA-disease graph with visible and hidden units. Finally, Chen et al. [Citation47] proposed the Ranking-based kNN for MiRNA-Disease Association prediction (RKNNMDA) model which integrated numerous information to search for k-nearest-neighbors both for miRNAs and diseases by using k-Nearest Neighbors (kNN) algorithm. In RKNNMDA, the nearest neighbors were obtained based on a descending order from the similarity scores between other miRNAs or diseases and the central miRNA or disease. Then they reranked these k-nearest-neighbors according to SVM Ranking model and implemented weighted voting to reduce the prediction bias.
The above models have their own strengths and uniqueness, but nonetheless some of them have obvious weaknesses. Moreover, although most models exhibited a sound prediction accuracy, there are still some ways to further improve those methods. To be specific, machine learning in high dimensional data spaces is particularly challenging and one of the challenges is the bad hubs. Hubness is an aspect of the curse of dimensionality. As dimensionality increases, the distribution of the number of times a point occurs among the k nearest neighbors of all other points in the dataset becomes considerably skewed to the right according to some distance measure, resulting in the emergence of hubs, that is, points which appear in many more kNN lists than other points, effectively making them ‘popular’ nearest neighbors. To be more specific, high-dimensional points that are closer to the data mean have increased the probability appearing in kNN lists of other points, even for small values of k [Citation48]. Unfortunately, some of the hubs are bad in the sort of sense that they may mislead classification algorithms. The kNN classifier is negatively affected by the presence of ‘bad’ hubs. Although ‘bad hubs’ tend to carry more information about the location of class boundaries than other points, the ‘model’ created by the kNN classifier places the emphasis on describing non-borderline regions of the space occupied by each class. For this reason, it can be said that ‘bad’ hubs are truly bad for kNN classification, creating the need to penalize their influence on the classification decision [Citation48]. However, the previous models failed to realize the fact that the bad hubs phenomenon which may negatively influence the prediction performance might occur under the circumstances of complex data. Furthermore, the association data between miRNAs and diseases will be widely expanded to improve the prediction accuracy in the future. Thus, there are still some challenges about how to excavate more useful information from the association data and how to overcome those undesirable problems in the complex dataset. Therefore, in this study we presented a novel model named Bipartite Local models and Hubness-Aware Regression for MiRNA-Disease Association prediction (BLHARMDA) to meet those challenges. In our model, we firstly used Jaccard-similarity to represent the similarity between the investigated miRNA (disease) and the other miRNAs (diseases) in the dataset. Then we combined it with the integrated similarity in order to describe the enhanced similarity for miRNAs and disease. In addition, it is noteworthy that combining two models to compute the semantic similarity between diseases provides a more accurate way to express the similarity between disease pairs. After that, we utilized the similarity data and miRNA-disease association data to train the Bipartite Local Model (BLM) which used an hubness-aware regression of Error Corrected k-Nearest Neighbors (ECkNN) as its local model. Consequently, we made the final prediction by utilizing this model combined with a data dimension reducing method. To evaluate our model’s effectiveness of prediction, global and local leave-one-out cross validation (LOOCV) as well as 5-fold cross validation were implemented. BLHARMDA obtained an AUC of 0.9136 and 0.8390 in global and local LOOCV respectively, which proved the high prediction accuracy of our model. Besides, the average AUC of 0.9120 ± 0.0006 in 5-fold cross validation indicated BLHARMDA’s stability in prediction. In addition, we carried out three different types of case studies on three important human diseases to further evaluate the prediction ability of BLHARMDA. We first used HMDD v2.0 database to train our model and predict for Esophageal Neoplasms. The result showed that 49 out of the top 50 potential miRNAs were validated by dbDEMC and miR2Disease [Citation16,Citation49]. Then we made prediction for Lung Neoplasms without any known miRNAs for this disease and 50 out of the top 50 predicted miRNAs were verified by dbDEMC, miR2Disease and HMDD v2.0. Finally, we used the known miRNA-disease associations in the HMDD v1.0 as training data and made prediction for Carcinoma Hepatocellular. As a result, 50 out of the top 50 associations were confirmed by databases and experimental literatures.
Results
Performance evaluation
We first tested the hubness in our dataset. In , we could see that the distribution of Nk (the number of times a point occurs among the k nearest neighbors of all other points) skewed to right. In other words, few points appeared in many more kNN lists than other points. Then, to evaluate the prediction accuracy of BLHARMDA, we took advantage of the HMDD v2.0 database which offered 5430 miRNA-disease associations between 383 diseases and 495 miRNAs. We implemented global LOOCV, local LOOCV and 5-fold cross validation methods based on the known miRNA-disease associations in the HMDD v2.0. In LOOCV, we picked out one known association without repetition as the test sample at each time and considered the other known associations as training examples until all known associations were evaluated. The difference between global LOOCV and local LOOCV was that all unknown miRNA-disease pairs were considered as the candidate samples in the global LOOCV while only those miRNA-disease pairs in which the miRNAs without any known associations with the investigated disease were considered as the candidate samples in the local LOOCV. As for 5-fold cross validation, we randomly split our data set, the known miRNA-disease associations, into 5 disjoint subsets with equal size. Then we took out one subset without repetition as the test sample at each time and the rest four subsets were regarded as training samples. Besides, in 5-fold cross validation, all unknown miRNA-disease pairs were considered as candidate samples in the same way as global LOOCV. Subsequently, we implemented BLHARMDA to obtain a predicted association score matrix, and ranked the score of each test sample against the score of the candidate samples. The whole process was repeated 100 times to obtain an evaluation of BLHARMDA’s prediction accuracy. As a result, for both LOOCV and 5-fold cross validation, we obtained the ranking for each sample. Based on the rankings obtained from cross validation, the model we proposed would be considered to successfully predict an association if the ranking of a test sample was above a given threshold. Then we drew the receiver operating characteristics (ROC) curves through plotting the true positive rate (TRR sensitivity) versus the false positive rate (FRR 1-specificity) at different thresholds, and calculated the area under the ROC curves (AUC) which was an evaluation metric widely used in the description of the prediction accuracy of a computational model. Specifically, sensitivity refers to the percentage of the true positive samples whose rankings are higher than the given threshold in the whole positive samples. Meanwhile, specificity denotes the percentage of negative samples with rankings lower than the threshold in the whole negative samples. The AUC of 1 indicated that all test samples were correctly predicted, and the AUC of 0.5 indicated that the model randomly predicted the test samples. The illustrated that, BLHARMDA achieved an AUC of 0.9141 in Global LOOCV whose performance was superior to RLSMDA (0.8426), WBSMDA (0.8030), MCMDA (0.8749), MaxFlow (0.8624) and RKNNMDA (0.7159). In Local LOOCV, BLHARMDA achieved an AUC of 0.8390 while RLSMDA, WBSMDA, MCMDA, MaxFlow, RKNNMDA, RWRMDA, MiRAI and MIDP obtained AUCs of 0.6953, 0.8031, 0.7718, 0.7774, 0.8221, 0.7891, 0.6299 and 0.8196, respectively. RWRMDA, MiRAI and MIDP were not applicable to global LOOCV since they were based on the local method which could only be used to make prediction for one disease at a time. In our evaluation, MiRAI did not achieve the performance as in literature [Citation45] since this method was based on collaborative filtering which did not perform well in sparse data set. Our data set was sparse in which the average associations for one disease were only 14 while the MiRAI was tested on the dataset in which one disease was associated with at least 20 miRNAs in literature [Citation45]. Thus, we could consider that our model achieved more reliability in the prediction of miRNA-disease associations.
Figure 1. The distribution of the number of kNN lists a point showed for the miRNAs and diseases in our dataset. Nk means the number of kNN lists a point showed, P(Nk) means the number of points showed in Nk kNN lists.
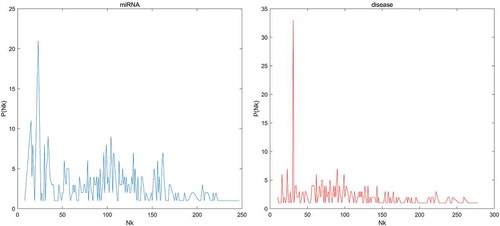
Figure 2. Performance comparison between BLHARMDA and seven classical disease-miRNA association prediction models (MCMDA, HGIMDA, WBSMDA, HDMP, RLSMDA, MaxFlow and RKNNMDA) in terms of ROC curves and AUCs based on global LOOCV and comparison of AUCs based on the local LOOCV between BLHARMDA and above seven models and three local models (RLSMDA, MiRAI, MIDP). As a result, BLHARMDA outperformed other models by achieving an AUC of 0.9141 in global LOOCV and an AUC of 0.8390 in local LOOCV.
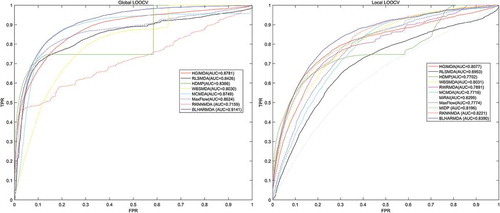
In the case of 5-fold cross evaluation, BLHARMDA obtained an averaged AUC of 0.9120+/-0.0006 which was superior to RLSMDA (0.8569+/-0.0020), WBSMDA (0.8185+/-0.0009), MCMDA (0.8767+/-0.0011), MaxFlow (0.8579+/-0.0010) and RKNNMDA (0.6723+/-0.0027). RWRMDA, MiRAI and MIDP were still not included in this evaluation since this evaluation was only applicable to global models. It was noticeable that both the average AUC and the standard deviation of AUC of BLHARMDA performed better than other models, which indicated that BLHARMDA had good stability and low predication variance.
Since the performance of our model in local LOOCV is marginally higher than those compared methods, we did a Kolmogorov-Smirnov test between our algorithm and the other ten algorithms compared in local LOOCV (see ). The p-value in all test are quite low and lower than 0.01 which means there are significant difference between the results of BLHARMDA and other ten models in local LOOCV.
Table 1. Kolmogorov-Smirnov test based on the local LOOCV results between BLHARMDA and other ten algorithms compared in local LOOCV.
Case studies
In order to evaluate the predictive ability of BLHARMDA and verify the correctness and reasonableness of the predicting outcome obtained by our model in realistic cases, we implemented 3 different types of case studies on three important human complex diseases.
In the first case study, we used the known miRNA-diseases associations in the HMDD v2.0 database as the training set of our model, then we ranked the candidate miRNAs for each disease respectively according to their predicted scores. In order to further promote experimental validation, we produced a complete prediction list for all the 383 diseases in HMDD v2.0 predicted by BLHARMDA (See ). Consequently, we verified the top 50 candidate miRNAs in two databases, dbDEMC and miR2Disease. After comparing the entries between HMDD v2.0 and dbDEMC/miR2Disease, we found that 546 of the 5430 known associations in HMDD v2.0 also existed in dbDEMC and 232 associations in HMDD v2.0 also existed in miR2Disease. However, there was no overlap between the training samples and the predicted results because in case studies only candidate miRNAs which have no known associations with the investigated disease according to HMDD v2.0 were ranked and confirmed. Thus, the detriment from the overlap could be eliminated and it avoided the situation that the miRNAs associated with the investigated disease were easier to be evaluated if there existed overlap between the training database and the validation databases. Therefore, it guaranteed that a believable validation could be obtained when we evaluated our outcome by dbDEMC/miR2Disease. Esophageal Neoplasms (EN) was investigated in our first case study. Esophageal cancer is the eighth most common incident cancer in the world and sixth in cancer mortality [Citation50]. In the United States, 4–10 in 100,000 persons succumb to the disease per year [Citation51]. We used BLHARMDA to predict the potential related miRNAs for EN and 49 out of the top 50 (see ) and 9 out of the top 10 potential miRNAs were confirmed by dbDEMC or miR2Disease. For example, miR-21 (1st in the prediction list) targets PDCD4 at the posttranscriptional level and regulates cell proliferation and invasion in esophageal squamous cell carcinoma (ESCC) [Citation52]; miR-17 (2nd in the prediction list) can serve as potential prognostic biomarkers in ESCC which are associated with some clinicopathologic factors [Citation53]; Downregulated expressions of miR-155 (3rd in the prediction list) in plasma were significantly associated with increasing risks of esophageal cancer [Citation54]. Further, since miR-155 displayed significantly lower expression in plasma of patient with esophageal cancer and serum miR-155 is associated with lymphocyte-mediated immune responses, the expression of circulating miR-155 may reflect compromised immunoreactivity in patients with esophageal cancer [Citation55].
Table 2. Prediction of the top 50 potential Esophageal Neoplasms-related miRNAs based on known associations in HMDD v2.0 database. The first column records top 1–25 related miRNAs. The third column records the top 26–50 related miRNAs. The evidences for the associations were either dbDEMC and miR2Disease.
In our second case study, we hid all known related miRNAs of each investigated disease. Then we trained the model and ranked all candidate miRNAs for each investigated disease. After that, we especially investigated the Lung Neoplasms (LN) in this case study. Lung cancer is the most common cause of cancer deaths worldwide in both man and woman [Citation56]. According to the American Cancer Society, LN account for about 13% of all new cancers and 27% of all cancer deaths [Citation56]. There are estimated 1.4 million deaths of lung cancer each year [Citation56–Citation59]. Especially, lung cancer has become the first cause of death among people with malignant tumors in China and the registered lung cancer mortality rate in China has increased by 464.84% in the past three decades [Citation60]. The five-year survival rate of lung cancer is much lower than many other leading cancers [Citation56,Citation59,Citation61–Citation63]. We used BLHARMDA to uncover the potential related miRNAs for LN. As a result, 50 out of the top 50 (see ) and 10 out of the top 10 potential related miRNAs were confirmed by dbDEMC or miR2Disease or HMDD v2.0. For example, in a study performed on 48 pairs of non-small cell lung cancer (NSCLC) specimens, the overexpression of miR-21 (1st in the prediction list) was inversely correlated with overall survival of the patients, suggesting that a high level of miR-21 is an independent negative prognostic factor for survival in NSCLC patients [Citation64]. High expression of miR-155 (2nd in the prediction list) was correlated with poor survival of lung cancer by univariate analysis as well as multivariate analysis for miR-155. The miRNA expression signature on the outcome of a study indicated that miRNA expression profiles were diagnostic and prognostic markers of lung cancer [Citation65]. MiR-17-5p (3rd in the prediction list) have been found to be continuously expressed in small-cell lung cancer (SCLC) cells. The overexpression of miR-17-5p may serve as a fine-tuning influence to counterbalance the generation of DNA damage in RB-inactivated SCLC cells, thus reducing excessive DNA damage to a tolerable level and consequently leading to genetic instability [Citation66].
Table 3. Prediction of the top 50 potential Lung Neoplasms-related miRNAs based on known associations in HMDD v2.0 database. In this case study, we hided all known related miRNAs for each investigated disease before the prediction process. The first column records top 1–25 related miRNAs. The third column records the top 26–50 related miRNAs. The evidences for the associations were either HMDD v2.0, dbDEMC and miR2Disease.
Lastly, in the third case study, we trained our model based on the known miRNA-disease associations in the HMDD v1.0 and then used the model to predict the scores of the miRNAs related with each investigated disease to examine the applicability of BLHARMDA to different datasets other than in HMDD v2.0. After that we evaluated the top 50 related miRNAs for each investigated disease by HMDD v2.0, dbDEMC and miR2Disease. In particular, we investigated Hepatocellular carcinoma (HCC) in this case study. HCC is one of the most common malignancies worldwide, and is the fourth most common cause of mortality [Citation67]. In addition, its incidence is increasing in many countries [Citation68,Citation69]. HCC is difficult to manage, as compared with other common malignant diseases due to the high percentage of co-existing liver cirrhosis. The impaired liver function caused by liver cirrhosis often restricts treatment options, even for early HCC. We implemented BLHARMDA to find the potential related miRNAs for HCC. As a result, all out of the top 50 (see ) potential miRNAs were confirmed by dbDEMC or miR2Disease or HMDD. Among the top 10 potential miRNAs, most of them were confirmed by experiments. For example, a study [Citation70] showed that the miR-21 (1st in the prediction list), the miR-17–92 polycistron which mainly includes miR-17-5p (2nd in the prediction list) and miR-20a (3rd in the prediction list) exhibited increased expression in HCC cell lines than those observed in normal liver.
Table 4. Prediction of the top 50 potential Carcinoma Neoplasms-related miRNAs based on known associations in the HMDD v1.0 database. The first column records top 1–25 related miRNAs. The third column records the top 26–50 related miRNAs. The evidences for the associations were either HMDD v2.0, dbDEMC and miR2Disease.
Moreover, since the HMDD v2.0 database used in our research was released in August 2013, we added a Table for the case study 1 by using the studies published after 2014 in PubMed to further evaluate the top 50 potential Esophageal Neoplasms-related miRNAs. Here, we only collected the literatures after 2014 in order to provide a fairer evaluation. The result showed that 46 out of the top 50 predictions were confirmed by the experimental literatures published after 2014 in PubMed (see ).
Table 5. Here, we used the studies published after 2014 in PubMed to further evaluate the top 50 potential Esophageal Neoplasms-related miRNAs. We provided the PMID and published year of these studies in the table. The result showed that 46 out of the top 50 predictions were confirmed by the experimental literatures published after 2014 in PubMed.
Discussion
The investigating of the miRNA-disease associations has produced plenty of potential diagnostic methods since an increasing number of models have been proposed to uncover the relationship between miRNAs and diseases. In this paper, we proposed a novel computational model based on bipartite local models with error corrected k-nearest neighbors as the local model to predict the potential miRNA-disease associations. BLHARMDA firstly processed the data by integrating the miRNA functional similarity or disease semantic similarity with the miRNA or disease Gaussian interaction profile kernel similarity to obtain the integrated miRNA or disease similarity. Then we calculated the Jaccard-similarity for miRNAs and diseases and combined the integrated similarity and the Jaccard-similarity to construct the enhanced similarity-based representation. After that, we used the BLM to predict the associations to obtain our final prediction. Moreover, we carried out cross validation for BLHARMDA, and obtained an AUC of 0.9141 in Global LOOCV which outperformed some previous models such as RLSMDA, WBSMDA, MCMDA, MaxFlow and RKNNMDA. In Local LOOCV, BLHARMDA obtained an AUC of 0.8390 which still outperforms the above models as well as the RWRMDA, MiRAI and MIDP. Then we used the 5-fold cross validation to evaluate the prediction stability of BLHARMDA. The low standard derivation as well as the high mean value in the result showed high stability and the high accuracy of BLHARMDA. Furthermore, we carried out three types of case study to demonstrate the prediction accuracy of BLHARMDA. As a result, a majority of the top 50 potential related miRNAs for each disease were confirmed by the databases or experimental literatures.
The high precision and stability of BLHARMDA are based on three factors. Firstly, we made use of both the intrinsic similarity of miRNAs and diseases and the association information between miRNAs and diseases by combining the integrated similarity and the Jaccard similarity. Secondly, we used an hubness-aware regression as the local model in BLM which enables the model to effectively alleviate the negative influence from the presence of the bad-hubs. Since bad hubs are expected in the complex data such as the miRNA-disease association database we used in this study, overcoming the bad-hubs problem can help us improve the prediction accuracy of the model. Last, we used the experimentally confirmed miRNA-disease associations from the highly reliable HMDD v2.0 database to train our model to predict potential associations between miRNAs and diseases. Furthermore, plenty of biological information database such as the functional similarity between miRNAs and the Directed Acyclic Graph of the diseases were utilized to improve the prediction accuracy. By combining biological knowledge, the model could obtain a better accuracy since the biological information could help us make use of some intrinsic differences and connections involved in dataset which are helpful in solving some biological problems. Moreover, nowadays biologists have produced massive research results and brought about a lot of biological information datasets which are convenient to be used in the models.
However, there are still some limitations in BLHARMDA which need to be improved in the future. Firstly, the miRNA and disease enhanced similarity representation in this study may not be the perfect similarity calculation method. The Jaccard similarity we used to represent the interaction information between miRNAs and diseases can still excavate the connection between them at a basic level. Developing a better similarity calculation method to make use of the association information in a more efficient way may produce a better outcome from this model. Secondly, the local model in BLM in this study is based on k-nearest neighbors regression. The performance of the algorithm might be further improved by using other hubness-aware regression models based on support vector machines, neural network, etc. Thirdly, integrating more information about the miRNAs and diseases to the input data could also facilitate the prediction since we only used the miRNA’s functional similarity and disease’s semantic similarity in this study. Therefore, BLHARMDA could still be developed better in the future.
Materials and methods
Human miRNA-disease associations
Recently, more and more miRNA-disease associations have been discovered by biological experiments. In this paper, the known miRNA-disease associations dataset was acquired from HMDD v2.0 which contained 5430 associations between 495 miRNAs and 383 diseases [Citation71]. We further constructed an adjacency matrix A to store the information of known miRNAs-disease associations from HMDD v2.0. In the adjacency matrix, A(i, j) equal to 1 means the i-th miRNA is related to the j-th disease
, otherwise A(i, j) equal to 0. Furthermore, we used nm to denote the number of miRNAs and nd denote the number of diseases.
MiRNA functional similarity
We attained the miRNA functional similarity scores from http://www.cuilab.cn/files/images/cuilab/misim.zip. Wang et al. [Citation72] proposed the calculation method of miRNA functional similarity based on the assumption that the miRNAs with a high functional similarity are more likely to correlate with diseases with a high phenotypical similarity. Thus, we could construct the functional similarity matrix FS. The FS(i, j) entry ranging from zero to one denotes the functional similarity score between
and
.
Disease MeSH descriptors and directed acyclic graph
According to the U.S. National Library of Medicine (MeSH) at https://www.nlm.nih.gov/mesh/[39], we constructed a Directed Acyclic Graph (DAG) to describe the semantic information of a disease. The DAG obtained from MeSH provided a strict system for disease classification for the research of the relationship among various diseases [Citation73]. MeSH descriptors included 16 categories: Category A for anatomic terms, Category B for organisms, Category C for diseases, Category D for drugs and chemicals and so on. We used MeSH descriptor of Category C for each disease in this paper.
The nodes in DAG represent disease MeSH descriptors and all the MeSH descriptors in the DAG are connected by a direct edge from a more general term (parent node) to a more specific term (child node). Each MeSH descriptor has one or more tree numbers to numerically define its location in the DAG. The tree numbers of a child node are defined as the codes of its parent nodes appended by the child’s information. For the disease, its DAG was defined as DAG(
) = (
D(
),E(
)), where D(
) denotes the node set include the
and its ancestor diseases and E(
) is the set of corresponding direct edges from a parent node to a child node which represent the relationship between these two nodes.
Then, we used DAG to construct the disease semantic similarity matrix. Since there are two models to calculate the semantic similarity between disease pairs, we used both the two models and average them as the semantic similarity matrix in this study.
Disease semantic similarity 1
In the first disease semantic similarity model, as described in the former algorithm [Citation72], the contribution of disease t in to the semantic value of
and the semantic value of
could be computed by the following equations respectively.
Here, is the semantic contribution delay factor, and this factor was set to 0.5 according to the previous literatures [Citation74–Citation77] in our experiment. For disease
, the contribution to itself is 1 and the contribution from its children decreased as the distance between them increased. Since disease
lies in the most inner layer of its DAG, it is the most specific disease term whose contribution to semantic value of itself is defined as 1. Disease located on the outer layer is considered to be a more general disease, so its contribution is multiplied by the semantic contribution decay factor.
Then, through summing up all contributions from’s ancestors, we got the semantic value of
. It is obvious that two diseases will get a greater similarity score when they have a larger shared part of their DAGs. Thus, we could define the
disease semantic similarity matrix 1 between disease
and
as follows:
Here, the (i, j) entry of SS1 denotes the semantic similarity score between and
.
Disease semantic similarity 2
According to the existing computational model [Citation39], we calculated the diseases semantic similarity in the second semantic similarity model.
However, it is obvious that different disease terms in the same layer of DAG() may also appear in some other diseases’ DAG. For example, if two diseases appear in the same layer of DAG(
) and the first disease appears in less disease DAGs than the second disease, we could conclude that the first disease is more specific than the second disease. Thus, according to the above consideration, assigning the same contribution value to these two diseases may not completely accurate since a more specific disease should have a greater contribution to the semantic value of disease
. Therefore, the contribution of semantic value to disease
from the first disease should be higher than the second disease. The contribution of disease t to the semantic value of disease
in DAG(
) was calculated as:
Then, we used the semantic value of disease and
,
and
, to compute the semantic similarity
between disease
and
based on the second model. And the semantic value DV2 was calculated by the same way as the first disease semantic similarity model by Equation (2). Further, the corresponding disease semantic similarity matrix SS2 was constructed as follows:
Finally, we combined the two semantic similarity matrixes SS1 and SS2 by averaging them to obtain the disease sematic similarity matrix SS in this study.
Gaussian interaction profile kernel similarity for miRNAs
As explained in the previous literature [Citation78], the Gaussian interaction profile kernel similarity between miRNA and miRNA
is constructed as follows based on the assumption that similar diseases tend to be associated with functionally similar miRNAs. The binary interaction profile vectors IP(
) and IP(
) are respectively defined as the i-th row vector and the j-th row vector of the matrix A which means whether two miRNAs are related to each disease or not. Then, we constructed the Gaussian interaction profile kernel similarity Matrix KM as follows:
Here, the is used to control the kernel bandwidth which is defined by normalizing a bandwidth parameter
divided by the average number of diseases associated with each miRNA. To simplify our calculation, we set the value of
to 1 in our study as in the former literatures [Citation33,Citation78].
Gaussian interaction profile kernel similarity for diseases
Based on the assumption that functionally similar miRNAs tend to be associated with similar diseases, we could use the similar method as above to calculate the disease’s Gaussian interaction profile kernel similarity matrix KD as:
where binary interaction profile vectors IP() and IP(
) are defined as the i-th column vector and the j-th column vector of the matrix A. The
in the equation is defined by normalizing a bandwidth parameter
divided by the average number of miRNAs associated with each disease. Likewise, we still set the value of
to 1 in our study as in the literatures [Citation33,Citation78].
Integrated similarity for miRNAs and diseases
Based on the consideration that the miRNA functional similarity scores do not cover all miRNAs, we integrated the miRNA functional similarity matrix FS and the miRNA Gaussian interaction profile kernel similarity matrix KM to form a more comprehensive similarity repression. In detail, if a miRNA pair has miRNA functional similarity score, we directly considered the score as integrated similarity. On the contrary, if a miRNA pair has no miRNA functional similarity score, we utilized the Gaussian interaction profile kernel similarity score as integrated similarity. Thus, we calculated an integrated similarity matrix SM for miRNAs as:
In the same way, we integrated the disease semantic similarity matrix SS and the disease Gaussian interaction profile kernel similarity matrix KD. If disease and
have their own DAGs (i.e. these two diseases have semantic similarity), then the final integrated similarity is the average between two semantic similarity matrixes SS1 and SS2. Otherwise, the integrated disease similarity equals to the value of Gaussian interaction profile kernel similarity between them. Therefore, the integrated similarity matrix SD for disease was calculated as:
Jaccard-similarity for miRNAs
The previous research [Citation79] showed that, for recommender systems, the interaction data about customers and products could be more informative than the metadata about consumers and products. As mentioned above, the Gaussian interaction profile kernel similarity was calculated based on the known miRNA-disease association data in our study. Here we further introduced another way to represent the information of known association data.
We additionally constructed a miRNA Jaccard-similarity JM to present the similarity between two miRNAs based on their association information to diseases. The Jaccard-similarity between and
is computed by the number of intersection divided by the number of union between sets of their associated diseases.
where denotes the set of associated diseases for miRNA
.
Jaccard-similarity for diseases
Similar to the miRNAs, in order to present the similarity between diseases based on their association to miRNAs, we computed the Jaccard-similarity between and
by the number of intersection divided by the number of union between the sets of their associated miRNAs. Thus, the disease Jaccard-similarity JD can be constructed as:
where denotes the set of associated miRNAs for disease
.
Enhanced similarity-based representation for miRNAs and diseases
In order to represent both the integrated miRNA similarity and the miRNA Jaccard-similarity, we combined these two similarities together by expanding our integrated similarity matrix with the dimensionality of to a bigger matrix of
. The left
square matrix was the integrated similarity matrix while the right
square matrix was the Jaccard similarity matrix. Thus, we constructed a new similarity representation – miRNA enhanced similarity-based representation matrix M.
Then, similar to the miRNAs, we combined the integrated disease similarity SD and disease Jaccard-similarity JD together to obtain disease enhanced similarity-based representation matrix D. The enhanced similarity-based representation matrix M and D will be used as the feature matrices for our model.
Bipartite local models (BLMs)
BLMs [Citation80] consider the miRNA-disease prediction problem as a link prediction problem in bipartite graphs. There are two vertex classes in the graph: one corresponds to miRNAs while the other corresponds to diseases. An edge in the graph corresponds to the known association between miRNA
and disease
. Thus, we trained two independent local models respectively based on the miRNA perspective and disease perspective to predict the likelihood score for an unknown miRNA-disease pair
. Subsequently, we further aggregated these two predictions.
To be specific, we first predicted the potential association from the miRNA perspective. The prediction is based on a specific miRNA and the diseases in the graph. Each disease except
which was being predicted was labeled as 1 or 0 depending on whether or not the
already had a known association with it. Then we used these labeled data to train our model to classify diseases into 1-labeled or 0-labeled classes. Subsequently, we used this model to predict the likelihood score of the investigated miRNA-disease pair
. The predicted outcome for the potential association between the miRNA
and the disease
from this first model was denoted by
.
Similar to the first prediction, we then predicted the potential association from the disease perspective based on a specific disease and the miRNAs in the graph. However, we instead used the labeled miRNAs except
which are obtained according to their known association with
to train the model. Consequently, we used this model to predict the likelihood score of the unknown association between
and
. The predicted outcome from this second model is denoted by
.
Finally, we needed an aggregation function such as maximum or minimum and so on to obtain the final outcome. In this study, we chose to average the outcome from the above two models to obtain our final prediction score of the BLM for the potential association between the and
.
Prediction based on weighted profiles
The BLM method has a shortcoming that it can’t handle the new diseases or miRNAs which have no known associations with miRNAs or diseases in the training data. Thus, for a new miRNA, all diseases except the predicted disease will be labeled as 0, and the local model will fail to make a prediction in this case. Similar to the new miRNA, a new disease will face the same problem that the local model can’t work with the all-0-labeled training data.
To solve this problem, when we predicted for a new miRNA, we used the assumption that similar miRNAs are likely to be associated with same diseases. Thus, we used the similarity between
and other miRNAs which have known associations with
to calculate the likelihood score between miRNA
and disease
. Therefore, the prediction score
from miRNA perspective can be computed by the weighted average of the known association between each miRNA except
and the disease
which is weighted by the similarity between
and other miRNAs.
where M denotes the set of all miRNAs in the training set, means one of all other miRNAs except
,
means the similarity between miRNA
and
which could be obtained by the matrix M, and
means whether or not the miRNA
has a known association with the disease
which is presented in the adjacency matrix A.
Similar to the case of the new miRNA, we predicted for a new disease by the weighted average of the known association between each disease except
and the miRNA
which is weighted by the similarity between
and other diseases.
where D denotes the set of all diseases in the training set, means one of all other diseases except
,
means the similarity between disease
and
which could be obtained by the matrix D, and
means whether or not the miRNA
has a known association with the disease
which is presented in the adjacency matrix A.
k-nearest neighbor regression with error correction (ECkNN)
BLM is a generic framework in which various regressors or classifiers can be used as local models. Bleakley et al. and Yamanishi et al. [Citation80] used support vector machines with a domain-specific kernel in their study. In our study, we chose a hubness-aware regression model, ECkNN [Citation81], as our local model. The algorithm of k-nearest neighbors is one of the most popular regression techniques. When using kNN to predict potential association between a miRNA and a disease from the miRNA perspective, we first determined the k-nearest neighbors of this miRNA by the ‘distance’ between them, and then use the k-nearest miRNAs to compute the predicted score of this association.
However, although the k-nearest neighbor regression has numerous advantages as described above, the algorithm has recently been found to have a drawback. The presence of ‘bad hubs’ will have negative influence on the performance of the kNN. Therefore, we used an error correction technique to alleviate the negative influence of bad hubs. Firstly, we defined the corrected label of a training instance x as:
where denotes the original label of x which is uncorrected. The uncorrected original labels are directly obtained from the known miRNA-disease associations in the database. For the known miRNA-disease associations, the values of the labels were set to 1.0, and the values of the labels of other miRNA-disease associations were set to 0.
is the set of the ‘reversed neighbors’ of x which means the set of instances whose k-nearest neighbors include x.
Then, we used the corrected labels to make prediction by the ECkNN. The predicted label for an unlabeled instance
could be computed using the formula below:
where means the set of the k-nearest neighbors of
. And the k was set to 100 in our experiment according to the literature [Citation81] that the mean absolute error gradually decreased and eventually converged as the k increased in their experiment.
Blharmda
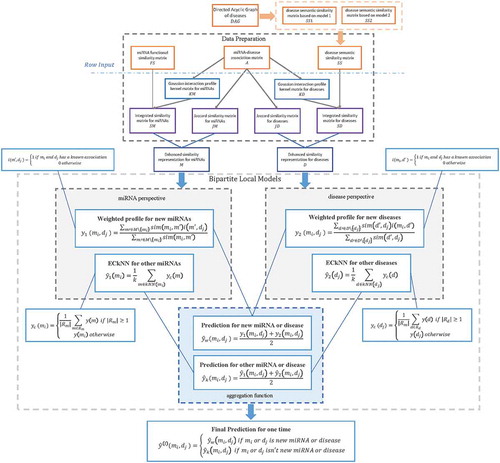
In this study, we developed BLHARMDA to predict potential miRNA-disease associations. Our model could be divided into three steps. The whole process was illustrated in . The first step of this model is preparing the data for the following prediction. Then, the second step of our model is using the data we obtained in the first step to predict the potential associations by BLM or weighted profile method. We only used weighted profile method on the new miRNAs or diseases without any known related diseases or miRNAs. For other miRNAs or diseases with known related diseases or miRNAs, we made predictions based on the BLM method with a hubness-aware regression, ECkNN regression, as its local model.
Figure 3. Flowchart of potential miRNA-disease association prediction based on the computational model of BLHARMDA: 1) data preparation, where enhanced similarity representation for miRNAs and diseases were constructed in this step; 2) Training the BLM with ECkNN as the local model and making predictions for the miRNAs or diseases with known associations by the BLM we trained. Then, using the weighted profile method to make prediction for new miRNAs and diseases.
In the BLM method, we predicted the associations by two models based on the miRNA perspective and disease perspective respectively. Subsequently, through using the aggregating function of arithmetical average on the two prediction outcomes above, we obtained our final prediction score of an association by BLM with ECkNN as the local model.
In the weighted profile method for new miRNAs and diseases, we also predicted the associations by two models from the miRNA perspective and disease perspective respectively. Still, we only used the selected features of matrix M and D to obtain our two prediction outcomes. Then, our final prediction score of this association can be obtained by averaging these two outcomes.
Thereafter, by integrating the prediction scores from the BLM and the prediction scores of new miRNAs and diseases obtained by the weighted profile method, we could get a global prediction of the associations between all miRNAs and diseases. Thus, the prediction outcome can be computed as follows:
In order to promote further research of biologists, we published our source code in https://github.com/BLHARMDA/Bipartite-Local-Models-and-hubness-aware-regression.
Supplemental Material
Download Zip (3.7 MB)Disclosure statement
No potential conflict of interest was reported by the authors.
Supplementary material
Supplemental data for this article can be accessed here.
Additional information
Funding
Related Research Data
References
- Ambros VR. microRNAs: tiny regulators with great potential. Cell. 2001;107(7):823–826.
- Bartel DP. MicroRNAs: genomics, biogenesis, mechanism, and function. Cell. 2004;116(2):281–297.
- Ambros VR. The functions of animal microRNAs. Nature. 2004;431(7006):350–355.
- Meister G, Tuschl T. Mechanisms of gene silencing by double-stranded RNA. Nature. 2004;431(7006):343–349.
- Cheng AM, Byrom M, Shelton J, et al. Antisense inhibition of human miRNAs and indications for an involvement of miRNA in cell growth and apoptosis. Nucleic Acids Res. 2005;33(4):1290–1297.
- Karp X, Ambros VR. Encountering MicroRNAs in cell fate signaling. Science. 2005;310(5752):1288–1289.
- Miska EA. How microRNAs control cell division, differentiation and death. Curr Opin Genet Dev. 2005;15(5):563–568.
- Xu P, Guo M, Hay BA. MicroRNAs and the regulation of cell death. Trends Genet. 2004;20(12):617–624.
- Alshalalfa M, Alhajj R. Using context-specific effect of miRNAs to identify functional associations between miRNAs and gene signatures. BMC Bioinformatics. 2013;14(12):1–13.
- Bartel DP. MicroRNAs: target recognition and regulatory functions. Cell. 2009;136(2):215–233.
- Cui Q, Yu Z, Purisima EO, et al. Principles of microRNA regulation of a human cellular signaling network. Mol Syst Biol. 2006;2(1):46.
- Lee RC, Feinbaum RL, Ambros VR, et al. elegans heterochronic gene lin-4 encodes small RNAs with antisense complementarity to lin-14. Cell. 1993;75(5):843–854.
- Wightman B, Ha I, Ruvkun G. Posttranscriptional regulation of the heterochronic gene lin-14 by lin-4 mediates temporal pattern formation in C. elegans. Cell. 1993;75(5):855–862.
- Griffithsjones S, Grocock RJ, Van Dongen S, et al. miRBase: microRNA sequences, targets and gene nomenclature. Nucleic Acids Res. 2006;34(90001):140–144.
- Kozomara A, Griffithsjones S. miRBase: integrating microRNA annotation and deep-sequencing data. Nucleic Acids Res. 2011;39(1):D152–157.
- Griffithsjones S, Saini HK, Van Dongen S, et al. miRBase: tools for microRNA genomics. Nucleic Acids Res. 2007;36(1):D154–158.
- Latronico MVG, Catalucci D, Condorelli G. Emerging role of MicroRNAs in cardiovascular biology. Circ Res. 2007;101(12):1225–1236.
- Esquelakerscher A, Slack FJ. Oncomirs–microRNAs with a role in cancer. Nat Rev Cancer. 2006;6(4):259–269.
- Lu M, Zhang Q, Deng M, et al. An analysis of human MicroRNA and disease associations. PLoS One. 2008;3(10):e3420.
- Yu Z, Li Z, Jolicoeur N, et al. Aberrant allele frequencies of the SNPs located in microRNA target sites are potentially associated with human cancers. Nucleic Acids Res. 2007;35(13):4535–4541.
- Chandramouli A, Onyeagucha BC, Mercadopimentel ME, et al. MicroRNA-101 (miR-101) post-transcriptionally regulates the expression of EP4 receptor in colon cancers. Cancer Biol Ther. 2012;13(3):175–183.
- Otsubo T, Akiyama Y, Hashimoto Y, et al. MicroRNA-126 inhibits SOX2 expression and contributes to gastric carcinogenesis. PLoS One. 2011;6(1):e16617.
- Nathans RS, Chu C, Serquina AK, et al. Cellular microRNA and P bodies modulate host-HIV-1 interactions. Mol Cell. 2009;34(6):696–709.
- Jiang Q, Hao Y, Wang G, et al. Prioritization of disease microRNAs through a human phenome-microRNAome network. BMC Syst Biol. 2010;4(1):1–9.
- Jiang Q, Wang G, Jin S, et al. Predicting human microRNA-disease associations based on support vector machine. Int J Data Min Bioinform. 2013;8(3):282–293.
- Calin GA, Croce CM. MicroRNA signatures in human cancers. Nat Rev Cancer. 2006;6(11):857–866.
- Chen X. Predicting lncRNA-disease associations and constructing lncRNA functional similarity network based on the information of miRNA. Sci Rep. 2015;5(1):13186.
- Chen X. KATZLDA: KATZ measure for the lncRNA-disease association prediction. Sci Rep. 2015;5(1):16840.
- Chen X, Liu M, Cui Q, et al. Prediction of disease-related interactions between microRNAs and environmental factors based on a semi-supervised classifier. PLoS One. 2012;7(8):e43425.
- Chen X, Liu M, Yan G. RWRMDA: predicting novel human microRNA–disease associations. Mol Biosyst. 2012;8(10):2792–2798.
- Chen X, Yan CC, Luo C, et al. Constructing lncRNA functional similarity network based on lncRNA-disease associations and disease semantic similarity. Sci Rep. 2015;5(1):11338.
- Chen X, Yan CC, Zhang X, et al. RBMMMDA: predicting multiple types of disease-microRNA associations. Sci Rep. 2015;5(1):13877.
- Chen X, Yan G. Novel human lncRNA-disease association inference based on lncRNA expression profiles. Bioinformatics. 2013;29(20):2617–2624.
- Chen X, Yan G. Semi-supervised learning for potential human microRNA-disease associations inference. Sci Rep. 2015;4(1):5501.
- Chen X, Xie D, Zhao Q, et al. MicroRNAs and complex diseases: from experimental results to computational models. Brief Bioinform. 2017;bbx130–bbx.
- Pereziratxeta C, Wjst M, Bork P, et al. G2D: a tool for mining genes associated with disease. BMC Genet. 2005;6(1):45.
- Aerts S, Lambrechts D, Maity S, et al. Gene prioritization through genomic data fusion. Nat Biotechnol. 2006;24(5):537–544.
- Pereziratxeta C, Bork P, Andrade MA. Association of genes to genetically inherited diseases using data mining. Nat Genet. 2002;31(3):316–319.
- Xuan P, Han K, Guo M, et al. Prediction of microRNAs associated with human diseases based on weighted k most similar neighbors. PLoS One. 2013;8(8):e70204.
- Mork S, Pletscherfrankild S, Caro AP, et al. Protein-driven inference of miRNA-disease associations. Bioinformatics. 2014;30(3):392–397.
- Xuan P, Han K, Guo Y, et al. Prediction of potential disease-associated microRNAs based on random walk. Bioinformatics. 2015;31(11):1805–1815.
- Chen X, Yan CC, Zhang X, et al. WBSMDA: within and between score for MiRNA-disease association prediction. Sci Rep. 2016;6(1):21106.
- Chen X, Yan CC, Zhang X, et al. HGIMDA: heterogeneous graph inference for miRNA-disease association prediction. Oncotarget. 2016;7(40):65257–65269.
- Li JQ, Rong ZH, Chen X, et al. MCMDA: matrix completion for MiRNA-disease association prediction. Oncotarget. 2017;8(13):21187–21199.
- Pasquier C, Gardes J. Prediction of miRNA-disease associations with a vector space model. Sci Rep. 2016;6(1):27036.
- Yu H, Chen X, Lu L. Large-scale prediction of microRNA-disease associations by combinatorial prioritization algorithm. Sci Rep. 2017;7:43792.
- Chen X, Wu Q-F, Yan G-Y. RKNNMDA: ranking-based KNN for MiRNA-disease association prediction. RNA Biol. 2017;14(7):952–962.
- Radovanovic M, Nanopoulos A, Ivanovic M. Hubs in space: popular nearest neighbors in high-dimensional data. J Machine Learn Res. 2010;11:2487–2531.
- Jiang Q, Wang Y, Hao Y, et al. miR2Disease: a manually curated database for microRNA deregulation in human disease. Nucleic Acids Res. 2009;37:D98–104.
- Dawsey SP, Tonui S, Parker RK, et al. Esophageal cancer in young people: a case series of 109 cases and review of the literature. PLoS One. 2010;5(11):e14080.
- Bosetti C, Levi F, Ferlay J, et al. Trends in oesophageal cancer incidence and mortality in Europe. Int J Cancer. 2007;122(5):1118–1129.
- Hiyoshi Y, Kamohara H, Karashima R, et al. MicroRNA-21 regulates the proliferation and invasion in esophageal squamous cell carcinoma. Clin Cancer Res. 2009;15(6):1915–1922.
- Xu X, Jiang Y, Feng J, et al. MicroRNA-17, MicroRNA-18a, and MicroRNA-19a are prognostic indicators in esophageal squamous cell carcinoma. Ann Thorac Surg. 2014;97(3):1037–1045.
- Liu R, Liao J, Yang M, et al. Circulating miR-155 expression in plasma: a potential biomarker for early diagnosis of esophageal cancer in humans. J Toxicol Environ Health. 2012;75(18):1154–1162.
- Wang G, Tam L-S, Li E, et al. Serum and urinary cell free MiR-146a and MiR-155 in patients with systemic lupus erythematosus. J Rheumatol. 2010;37(12):2516–2522.
- Xue Z, Wen J, Chu X, et al. A microRNA gene signature for identification of lung cancer. Surg Oncol. 2014;23(3):126–131.
- Jemal A, Siegel RL, Xu J, et al. Cancer statistics, 2010. CA Cancer J Clin. 2010;60(5):277–300.
- Brambilla E, Travis WD, Colby TV, et al. The new World Health Organization classification of lung tumours. Eur Respir J. 2001;18(6):1059–1068.
- Wang J, Zhao YC, Lu YD, et al. Integrated bioinformatics analyses identify dysregulated miRNAs in lung cancer. Eur Rev Med Pharmacol Sci. 2014;18(16):2270.
- She J, Yang P, Hong Q, et al. Lung cancer in China: challenges and interventions. Chest. 2013;143(4):1117–1126.
- Siegel RL, Naishadham D, Jemal A. Cancer statistics, 2013. CA Cancer J Clin. 2013;63(1):11–30.
- Scott WJ, Howington J, Feigenberg S, et al. Treatment of Non-Small Cell Lung Cancer Stage I and stage II: ACCP evidence-based clinical practice guidelines (2nd Edition). Chest. 2007;132(3):234S-242S.
- Van Zandwijk N. Neoadjuvant strategies for non-small cell lung cancer. Lung Cancer. 2001;34:S145-S150.
- Markou A, Tsaroucha EG, Kaklamanis L, et al. Prognostic value of mature MicroRNA-21 and MicroRNA-205 overexpression in non–small cell lung cancer by quantitative real-time RT-PCR. Clin Chem. 2008;54(10):1696–1704.
- Yanaihara N, Caplen NJ, Bowman ED, et al. Unique microRNA molecular profiles in lung cancer diagnosis and prognosis. Cancer Cell. 2006;9(3):189–198.
- Ebi H, Sato T, Sugito N, et al. Counterbalance between RB inactivation and miR-17-92 overexpression in reactive oxygen species and DNA damage induction in lung cancers. Oncogene. 2009;28(38):3371–3379.
- Sato F, Hatano E, Kitamura K, et al. MicroRNA profile predicts recurrence after resection in patients with hepatocellular carcinoma within the Milan Criteria. PLoS One. 2011;6(1):e16435.
- Taylorrobinson SD, Foster GR, Arora S, et al. Increase in primary liver cancer in the UK, 1979–94. Lancet. 1997;350(9085):1142–1143.
- Elserag HB, Mason AC. Rising incidence of hepatocellular carcinoma in the United States. N Engl J Med. 1999;340(10):745–750.
- Connolly E, Melegari M, Landgraf P, et al. Elevated expression of the miR-17-92 polycistron and miR-21 in hepadnavirus-associated hepatocellular carcinoma contributes to the malignant phenotype. Am J Pathol. 2008;173(3):856–864.
- Li Y, Qiu C, Tu J, et al. HMDD v2.0: a database for experimentally supported human microRNA and disease associations. Nucleic Acids Res. 2014;42:D1070–1074.
- Wang D, Wang J, Lu M, et al. Inferring the human microRNA functional similarity and functional network based on microRNA-associated diseases. Bioinformatics. 2010;26(13):1644–1650.
- Lipscomb CE. Medical subject headings (MeSH). Bull Med Libr Assoc. 2000;88(3):265–266.
- Chen X, Wang L, Qu J, et al. Predicting miRNA-disease association based on inductive matrix completion. Bioinformatics. 2018;bty503–bty.
- Chen X, Xie D, Wang L, et al. BNPMDA: bipartite network projection for MiRNA–disease association prediction. Bioinformatics. 2018;bty333–bty.
- Chen X, Huang L. LRSSLMDA: laplacian regularized sparse subspace learning for MiRNA-disease association prediction. PLoS Comput Biol. 2017;13(12):e1005912.
- You Z, Huang Z, Zhu Z, et al. PBMDA: A novel and effective path-based computational model for miRNA-disease association prediction. PLoS Comput Biol. 2017;13(3):e1005455.
- Van Laarhoven T, Nabuurs SB, Marchiori E. Gaussian interaction profile kernels for predicting drug–target interaction. Bioinformatics. 2011;27(21):3036–3043.
- Pilaszy I, Tikk D, editors. Recommending new movies: even a few ratings are more valuable than metadata. conference on recommender systems; 2009.
- Bleakley K, Yamanishi Y. Supervised prediction of drug-target interactions using bipartite local models. Bioinformatics. 2009;25(18):2397–2403.
- Buza K, Nanopoulos A, Nagy G. Nearest neighbor regression in the presence of bad hubs. Knowl Based Syst. 2015;86:250–260.