
ABSTRACT
Most small noncoding RNAs (sRNAs) are known to base pair with target mRNAs and regulate mRNA stability or translation to trigger various changes in the cell metabolism of Escherichia coli. The SdsR sRNA is expressed specifically during the stationary phase and represses tolC and mutS expression. However, it was not previously known whether the growth-phase-dependent regulation of SdsR is important for cell growth. Here, we ectopically expressed SdsR during the exponential phase and examined cell growth and survival. We found that ectopic expression of SdsR led to a significant and Hfq-dependent cell death with accompanying cell filamentation. This SdsR-driven cell death was alleviated by overexpression of RyeA, an sRNA transcribed on the opposite DNA strand, suggesting that SdsR/RyeA is a novel type of toxin-antitoxin (T/A) system in which both the toxin and the antitoxin are sRNAs. We defined the minimal region required for the SdsR-driven cell death. We also performed RNA-seq analysis and identified 209 genes whose expression levels were altered by more than two-fold following pulse expression of ectopic SdsR at exponential phase. Finally, we found that that the observed SdsR-driven cell death was mainly caused by the SdsR-mediated repression of yhcB, which encodes an inner membrane protein.
Introduction
More than 100 small noncoding RNAs (sRNAs) have been identified in E. coli [Citation1–Citation8]. Functions have been identified for some, but not all. Most of the known sRNA-mediated functions are accomplished by the base pairing of sRNAs with mRNAs, which leads to gene repression or activation [Citation9–Citation17]. Functional studies have shown that most sRNAs are encoded in trans and regulate translation or mRNA stability by base pairing with their target mRNAs, usually with the help of the Hfq protein [Citation18–Citation24]. E. coli also has cis-encoded RNAs, another class of sRNAs, that are encoded on the opposite strand and exhibit extended complementarity to their target mRNAs [Citation25–Citation30]. Some cis-encoded sRNAs act as antitoxins by repressing the translation and/or promoting the degradation of mRNAs encoding toxin proteins that cause cell death or growth inhibition [Citation31–Citation33].
Two sRNAs, SdsR (also known as RyeB) and RyeA, are encoded by opposing DNA strands of the same locus [Citation1,Citation4,Citation5]. The sequence of SdsR is entirely contained within the opposite strand of the larger ryeA gene. SdsR acts as a multi-targeting sRNA in trans by repressing tolC and mutS in E. coli and many genes including ompD, crp,stpA and tolC in Salmonella [Citation34–Citation37]. In contrast, the physiological roles of RyeA remain unknown.
SdsR is a member of the RpoS regulon [Citation34,Citation36,Citation38,Citation39]. In E. coli, it abundantly expressed during the stationary phase but is not detected during the exponential phase [Citation4,Citation5,Citation36]. No previous study has examined whether this growth phase-dependent regulation is important for cell growth and/or survival. Here, we ectopically expressed SdsR during the exponential phase and found that this deregulation of the growth-phase-dependent expression of SdsR causes cell death with accompanying cell filamentation. This SdsR-driven cell death is relieved by overexpression of RyeA, suggesting that SdsR/RyeA may represent a novel type of toxin-antitoxin (T/A) system in which both the toxin and the antitoxin are sRNAs. To determine the cause of the observed SdsR-driven cell death, we defined its minimal required region and performed RNA-seq analysis to identify genes whose expression levels were severely altered by the ectopic expression of SdsR during the exponential phase. We used RNA-seq data to predict target mRNAs and applied bioinformatics to the minimal region of SdsR. This combined strategy enabled us to identify the major SdsR mRNA target whose repression led to cell death: yhcB, which encodes an inner membrane protein involved in biogenesis of the cell envelope and the maintenance of cell shape [Citation40–Citation42].
Results
Ectopic expression of SdsR during the exponential phase causes significant cell death
Since SdsR is known to be expressed only during the stationary growth phase [Citation4,Citation5,Citation36], we questioned how cell physiology would be affected by its expression during the exponential phase. To test this, we used an IPTG-inducible SdsR expression plasmid to ectopically express SdsR during the exponential phase. We inoculated plasmid-containing E. coli cells into liquid media, incubated the cells for 1 h, added 1 mM IPTG and monitored cell growth and survival at different time points thereafter ()). Comparison of SdsR-overexpressing and control cells revealed that there was little between-group difference in growth, as reflected by OD600, during the exponential and stationary phases ()). However, we observed cell lysis when some of SdsR-overexpressing cells were diluted with fresh medium for OD600 readings and the reading times were delayed ()). The lysis occurred within 10 min after dilution. To assess the vulnerability to lysis, we diluted cells grown for various durations with fresh medium and waited for 10 min before taking the OD600 readings. This analysis revealed that lysis was observed in cells grown for more than 4 h post-inoculation ()). The lysis levels increased as the incubation proceeded and peaked at 8 h post-inoculation. However, this vulnerability to lysis was not observed in cells grown for 24 h post-inoculation. We also examined cell viability by plating the cell cultures and counting viable cells as colony forming units (cfu). The cfu of SdsR-expressing cells were decreased at all growth phases relative to control cells, and only 1 ~ 2% of cells survived in SdsR-overexpressing cultures grown for 24 h ()). We were rather surprised that cells grown for 24 h post-inoculation did not show an increased vulnerability to lysis despite displaying the most severe viability defect. This suggests that the lytic process might require cellular activities present in the cells that had been overexpressing SdsR for 8, 10, or 12 h, but not 24 h. When we diluted the growing culture in spent LB medium instead of fresh medium, lysis did not occur although cell death (evaluated by cfu assays) still occurred as diluted in fresh medium (Figure S1), suggesting that specific medium conditions might trigger lysis. Therefore, cell lysis appears not directly related to cell death, but rather would be an event that could occur under the cell death circumstances. Alternatively, the lytic process might result from induction of lytic cycle of a certain template phage because Balbontin et al reported that the last 23 bp of the sdsR gene can act as an attachment site for bacteriophages in Salmonella enterica [Citation43]. When we plated the culture for phages, no plaque formation was observed. We also examined cell growth and survival of sdsR/ryeA deletion mutant cells overexpressing SdsR (Figure S2). The mutant cells showed lysis and cell death by SdsR overexpression, as the wild type cells did. These results indicate that the lytic phenotype was not derived from induction of lytic cycle of a template phage by SdsR.
Figure 1. Growth defects are triggered by ectopic expression of SdsR during the exponential phase. (a) Ectopic SdsR expression was induced with 1 mM IPTG at a growth time point of 1 h. The IPTG induction and cell collection times are indicated by downward and upward arrows, respectively. (b) OD600 values of cells were determined right after and 10 min after cells were diluted 1:10 with fresh medium. (c) Lysis of pSdsR-containing cells grown for 10 h, but not pHM4T vector-containing control cells was observed after 10 min from a 1:10 dilution with fresh LB medium for OD600 readings. (d) Cell viability was assessed by measuring cfu per OD600 of cells. (e) Cell morphology and average cell length were analyzed under microscopy at 400× magnification. AL, average length. pHM4T, control vector; pSdsR, SdsR-overexpressing plasmid. Scale bar: 10 μm.
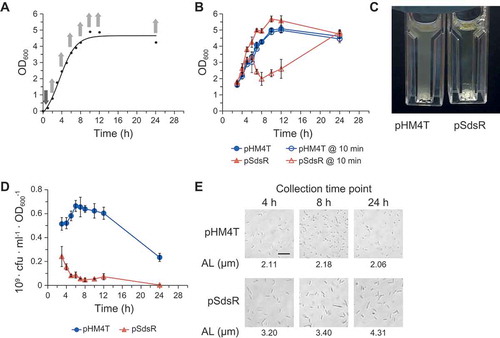
Interestingly, we found that 24 h-grown SdsR-overexpressing cells showed a filamentous phenotype with an elongated morphology, while wild-type cells exhibited the classical rod-shaped morphology ()). This elongated morphology was observed even in SdsR-overexpressing cells grown for 4 h post-inoculation.
Next, we induced SdsR expression at different times after inoculation and examined lysis (at 10 h post-inoculation) and cfu (at 24 h post-inoculation) to determine when during the growth phase ectopic SdsR induction was most effective in triggering growth defects ()). Induction at growth time points of 1 h and 2 h led to similar growth defects ()), while smaller defects were seen for induction at later growth time points. Induction at the 8-h growth point (late exponential phase) did not cause any growth defect. These findings suggest that ectopic expression of SdsR during the early exponential phase is required for the observed cell growth defect. We also examined the morphologies of cells induced to overexpress SdsR at different growth time points ()). Only cell groups that showed the growth defect exhibited an elongated morphology, suggesting that this morphology is related to the cell growth defect.
Figure 2. Growth defects in cells subjected to IPTG induction at different growth time points. (a) Ectopic SdsR expression was induced with 1 mM IPTG at different growth time points (arrows). (b) Lysis ratio was calculated as the ratio of OD600 measured at 10 min after 1:10 cell dilution to that right after dilution. Viability (%) was calculated as the ratio of cfu per OD600 of pSdsR-containing cells to that of pHM4T-containing cells with IPTG induction at different time points. Lysis ratio and viability (%) were determined with cells collected at 10 h post-inoculation and 24 h post-inoculation, respectively (mean ± SD; n = 3; *P ≤ 0.05 by Student’s t-test). Cells grown for 2 h after IPTG induction were collected for RNA analysis. The collection time represents the actual growth time. SdsR levels were analyzed by Northern blotting. The quantity of SdsR in a cell was estimated using known amounts of in vitro transcribed SdsR as standards. The spliced image from the same Northern membrane was shown with the insertion of a dividing line between spliced lanes. SdsR(p), the processed form of SdsR. (c). Cell morphology and average cell length were analyzed with cells grown for 10 h. AL, average length. Scale bar: 10 μm.
We also analyzed SdsR levels at different growth time points ()). Since SdsR is expressed as two forms: a full-length RNA transcript of 103 nt (major species) and a processed species of 73 nt (minor species), both the full-length and processed species were counted for estimation of the SdsR levels. The ectopic expression level of SdsR when induced with 1 mM IPTG at the 1-h growth time point was about five-fold higher than the endogenous level in 10-h grown control cells (about 0.023 pmole per μg of total RNA) ()). To determine the level of ectopic expression required for the growth defect, we altered the IPTG concentration. We found that the extent of cell death was correlated with the cellular concentration of SdsR (,)). The growth defect and cell elongation were first observed in cultures induced with 0.01 mM IPTG (,)). The level of SdsR in cells induced with 0.01 mM IPTG (about 0.019 pmole of SdsR per μg of total RNA) was comparable to the endogenous level seen in 10-h grown control cells ( and ). Together, these findings indicate that ectopic expression of SdsR at physiological levels during the exponential phase can cause growth defects and trigger cell death.
Figure 3. Concentration-dependent effects of ectopically expressed SdsR on cell phenotypes. (a) Cells were exposed to the indicated concentrations of IPTG and lysis and viability were measured as in ) (mean ± SD; n = 3; *P ≤ 0.05 by Student’s t-test). V, control vector pHM4T. S, pSdsR. SdsR levels in cells were analyzed as in ). In vitro RNA, in vitro SdsR transcripts used as standards for the quantitation of in vivo SdsR levels. (b) Lysis ratio and viability are presented for various cellular concentrations of SdsR. (c) Cell morphology and average cell length were analyzed as in ). AL, average length. Scale bar: 10 μm.
Suppression of SdsR-driven cell death by RyeA coexpression
RyeA is encoded on the DNA strand opposite the SdsR locus [Citation1,Citation4,Citation5], and the larger ryeA covers the entire SdsR ()). The expression of RyeA is reciprocally related to that of SdsR in that RyeA is abundantly expressed in the exponential phase [Citation1,Citation4,Citation5]. Expression of RyeA as well as SdsR was analyzed during growth ()). SdsR was abundantly expressed upon entry into stationary phase. Coincidently a shorter RyeA species of about 60 nt appeared, suggesting that this RNA species would be a degradation product by an antisense mechanism through SdsR-RyeA base pairing. The similar reciprocal expression pattern as a function of growth phase was previously reported by Vogel et al [Citation5]. We also analyzed endogenous levels of SdsR in the presence of RyeA ectopic expression during growth and vice versa ()). SdsR (both the full-length and processed forms) and RyeA disappeared upon overexpression of RyeA and SdsR over all the growth phases, respectively, supporting the presence of the reciprocal control between biosynthesis of two sRNAs.
Figure 4. Analysis of cellular levels of SdsR and RyeA during growth. (a) Schematic presenting the genomic orientation of SdsR and its nearby genes. (b) Overnight cultures of MG1665 cells were diluted 1:100 in LB medium and grown at 37°C. Aliquots of cells were sampled from the cultures at specific time intervals and total cellular RNAs were isolated. Cellular levels of SdsR and RyeA were analyzed by Northern blotting. The membrane was probed with an anti-RyeA oligonucleotide and analyzed for RyeA signals. Then the membrane was briefly washed and reprobed with an anti-SdsR oligonucleotide. The remaining RyeA signals in the anti-SdsR probed membrane were indicated by asterisks. Relative band intensities of each RNA are also shown with growth times (right). pSdsR, SdsR-expressing plasmid derived from vector pHM4T. SdsR(p), the processed form of SdsR. RyeA(d), a degradation product of RyeA. (c) MG1665 cells containing pASdsR or pRyeA were treated with 1mM IPTG to induce ectopic SdsR or RyeA expression at a growth time point of 1 h. Total cellular RNAs were isolated and analyzed for cellular levels of SdsR and RyeA as in (b). pHM4T and pAKA, control vectors. pRyeA, RyeA-expressing plasmid derived from vector pHM4T. pASdsR, SdsR expressing plasmid from vector pAKA. (d) SDF204 (rnc+) and SDF205 (rnc−) cells were analyzed for cellular levels of SdsR and RyeA as in (b).
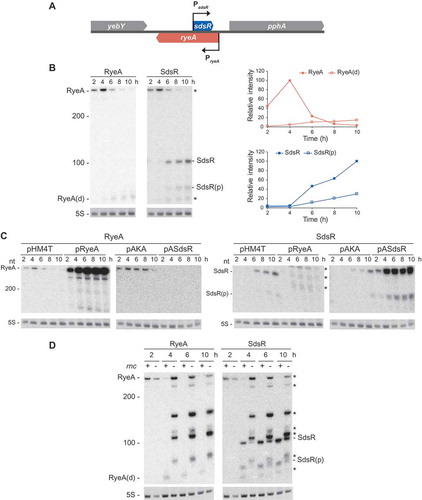
We examined changes of expression patterns of SdsR and RyeA during growth in rnc− cells lacking RNase III ()). In rnc− cells, RyeA remained longer at high levels during growth and SdsR was still present despite of the presence of high levels of RyeA. Furthermore, the RyeA degradation product of about 60 nt was not observed in rnc− cells, These results suggest that SdsR and RyeA are reciprocally involved to degrade each other through the action of RNase III. Interestingly, the rnc− mutation generated many shorter RyeA transcripts (major species: about 150 nt, 110 nt, and 80 nt), suggesting that RyeA would be metabolized through different pathways in the absence of RNase III.
Then we co-overexpressed RyeA with SdsR. We found that the growth defect was alleviated ()), indicating that RyeA coexpression suppresses SdsR-driven cell death in our system. We speculated that since RyeA can mediate SdsR decay, it could act as an antitoxin by reducing the cellular concentration of SdsR. Indeed, we found that the RyeA overexpression decreased the level of overexpressed SdsR ()).
Figure 5. RyeA suppresses SdsR-driven cell death. (a) Viability, presented as cfu per OD600, in cells coexpressing SdsR and RyeA (mean ± SD; n = 3; *P ≤ 0.05 by Student’s t-test). SdsR and RyeA were induced with 1 mM IPTG at 1 h post-inoculation. pHM4T and pAKA, control vectors. pRyeA, RyeA-expressing plasmid derived from vector pHM4T. pASdsR, SdsR expressing plasmid from vector pAKA. (b) Degradation of SdsR by RyeA. Total RNAs were analyzed by Northern blotting. In vivo levels of SdsR and RyeB were estimated using known amounts of in vitro transcribed SdsR and RyeA as standards. In each panel the spliced image from the same Northern membrane was shown with the insertion of a dividing line between spliced lanes.
To get further information about the reciprocal control between biosynthesis of SdsR and RyeA, we measured the stability of SdsR and RyeA using rifampicin chase experiments (Figure. S3) These experiments were conducted at growth time points (3 h for SdsR and 10 h for RyeA) where each RNA species was predominantly expressed. SdsR (both the full and processed forms) has a longer half-life of > 100 min and RyeA has a shorter half-life of 3.4 min. This reciprocal stability between two sRNAs could contribute to high accumulation of SdsR when necessary.
SdsR sequences essential for the observed growth defect
To identify the SdsR sequences that affect cell growth, we constructed plasmids expressing SdsR derivatives that were sequentially truncated from the 5′ end and evaluated their effects on cell lysis, death, and filamentation (). A 28-nt deletion at the 5′ end of SdsR (i.e., 29–103) did not alter the ability of SdsR overexpression to confer growth defects. However, further deletion to nt 36 (i.e., 37–103) blocked the lytic effect and almost removed the ability of SdsR overexpression to cause cell death. These results indicate that nt 29 to 103 are essential for the ability of SdsR to cause cell lysis and death. Interestingly, SdsR(45–103) showed a rather unexpected phenotypic change: cells expressing this derivative exhibited a severe filamentous phenotype, moderate lysis and a mild reduction of cell viability (,)). These phenotypic changes by SdsR(45–103) were puzzling because SdsR(37–103) led to almost no growth defects. We assumed that certain target recognition sequences between positions 45 and 103 should be responsible for the moderate growth defects, but those target recognition sequences might not be effective in SdsR(37–103). In secondary structure models of SdsR(37–103) predicted by M-fold program, the 43–48 sequences are paired with the 55–60 sequences with a free energy of −26.00 kcal/mol, while the corresponding base-paired region in SdsR(45–103) is 2 bp shorter with a free energy of −16.19 kcal/mol (Figure. S4). Therefore, the 45–60 sequences in SdsR(45–103) could have more chance to maintain a high degree of single-strandedness, which is highly required to access mRNA target sites, than in SdsR(37–103). If the 45–60 sequences are essential for target recognition sequence, target mRNAs would be more effectively recognized by SdsR(45–103) than SdsR(37–103). However, this interpretation remains to be experimentally demonstrated.
Figure 6. Phenotypic changes triggered by expression of various SdsR derivatives. (a) Nucleotide sequences of SdsR. Nucleotide sequence encoding SdsR is shown. The sdsR terminator sequence is open boxed. The sibC terminator sequence is in the grey box, indicated by T(sibC), above the sdsR terminator sequence. The 5-nt complementary mutant sequence in derivative M(29–33) is shown in the red box. (b) Schematic representation of SdsR derivatives. Various 5-nt complementary mutations are indicated by red rectangulars. The grey boxes indicate the sibC terminator replaced for the sdsR terminator. (c) Lysis ratio and viability of cells expressing the various SdsR derivatives were measured as in ) (mean ± SD; n = 2–3; *P ≤ 0.05, **P ≤ 0.001 by Student’s t-test). The prefix ‘p’ denotes plasmids expressing the SdsR derivatives. (d) SdsR levels in cells grown for 2 h after IPTG induction were analyzed by Northern blotting. The spliced image from the same Northern membrane was shown with the insertion of a dividing line between spliced lanes. (e) Cell morphology and average cell length were analyzed as in ). AL, average length. Scale bar: 10 μm.
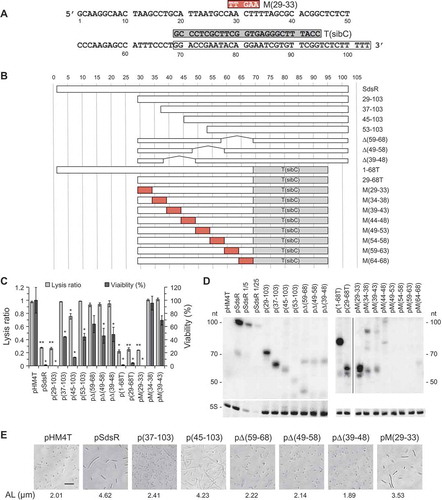
To test the importance of 3′ sequences in the observed growth defects, we replaced the sdsR terminator sequence (nt 69–103) with that of sibC, which encodes a cis-encoded sRNA (,)). The resulting chimeric RNA, 1-68T, caused cell death, suggesting that the sdsR terminator sequence is dispensable for target recognition ()). Expression of 29–68T also led to cell death, showing that the region of nt 29 to 68 is sufficient to cause the SdsR-driven growth defect. To further define the minimal region, we introduced several 5-bp deletions or mutations within the nt 29-68 sequences of 29–103 or 29-68T (,)). We found that only mutant M(29–33) among them caused severe cell death and filamentation (,)). However, although the other derivatives triggered no or only minor growth defects, most of them were poorly expressed ()). Thus, it remains unclear whether these deleted or mutated regions are necessary for target recognition. On the basis of our deletion and mutational analyses, we conclude that the target recognition site lies in the region between nt 34–68.
Target genes involved in SdsR-driven cell death
To identify target genes involved in the observed SdsR-driven cell death, we first performed RNA-seq analysis. E. coli cells expressing ectopic SdsR or SdsR(45–103) were grown for 3 h post-inoculation (OD600 of 1.5 ~ 1.7) and induced with 1mM IPTG for 10 min before the cell harvest, and total RNAs were collected. RNA-seq was performed, and the data were searched for genes that showed a greater than two-fold change and a p-value below 0.05. We identified 209 genes (93 upregulated and 116 downregulated) and 169 genes (30 upregulated and 139 downregulated) for SdsR and SdsR(45–103), respectively (Tables S1-S4). Selected downregulated genes were confirmed by qRT-PCR analysis (Table S5), which showed that RNA-seq data were reliable. Seventeen upregulated genes and 58 downregulated genes were shared between SdsR and SdsR(45–103), suggesting that their expression levels were affected by the nt 45–103 sequence. Likewise, 26 upregulated and 58 downregulated genes were not shared, and thus might reflect the influences of nt 1–44 (Tables S1-S4). One of the non-shared downregulated genes was tolC, which was previously reported to interact with nt 33–40 of SdsR [Citation35]. On the other hand, mutS, which interacts with nt 15–40 of SdsR in vitro [Citation34], was among the shared downregulated genes, suggesting that it may not be a primary target of SdsR in vivo. Gene ontology analysis showed that many (20–30%) of the altered genes either downregulated or upregulated are involved in transport (,)), and that about half of them are located in membranes (,)), suggesting that transport and their membrane localization could be closely related to the observed SdsR-driven growth defects. Since we revealed that the target recognition sequence lies between nt 34 and nt 68, we searched target mRNAs with this sequence. Using the CopraRNA program, we identified nine putative target mRNAs among the genes identified as being downregulated by more than two-fold in our RNA-seq analysis (). These target mRNAs included the known target, tolC. The program predicted that yfaZ and pryL could be targeted through the nt 34–41 sequence; however, these genes were also repressed by SdsR(45–103), which lacked the 34–41 sequence, and thus are not likely to be primary target mRNAs. Based on the hypothesis that the remaining seven mRNAs might include direct target gene(s) whose repression would lead to cell death, we repressed the expression of each using artificial sRNAs (afsRNAs) and examined changes in cell phenotype (,)). We found that expression of ARyhcB, an afsRNA targeting yhcB, yielded the same cell phenotypes as ectopic SdsR overexpression: vulnerability to lysis, cell death and cell filamentation. The yhcB gene is a thermo-tolerant gene that encodes an inner membrane protein involved in biogenesis of the cell envelope and the maintenance of cell shape [Citation40–Citation42,Citation44]. While the nt 34–41 sequence of SdsR can base pair with the yhcB coding sequence at nt + 15 to + 22 relative to the start codon, ARyhcB can make base-pair interactions with the yhcB mRNA sequence at nt −19 to + 1 ()). As expected from target recognition sequences of each sRNA, SdsR repressed expression of both yhcB and tolC, but ARyhcB repressed only yhcB expression ()). These results suggest that SdsR causes cell death by repressing yhcB expression.
Table 1. Putative mRNA targets of the 34–68 sequence of SdsR, as screened by RNA-seq and CopraRNA.
Figure 7. RNA-seq analysis of SdsR-driven changes. Ontology diagram of genes up/downregulated by ectopic expression of SdsR. (a, b) Categories of biological process. (c, d) Cellular components of up/downregulated genes, respectively.
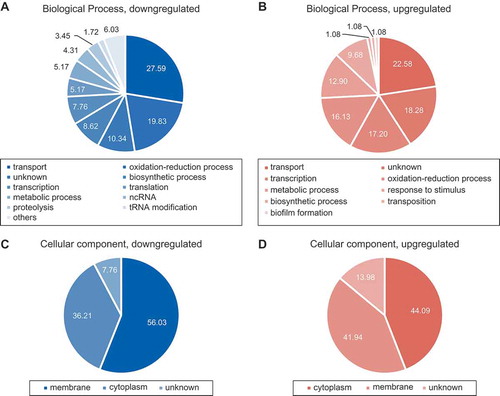
Figure 8. Identification of SdsR target genes that govern SdsR-driven phenotypic changes. (a) Lysis ratio and viability of cells expressing afsRNA repressing predicted target genes were measured as in ). Plasmids pARgpt, pARyhcB, pARnhaB, pARdcuA, pARtamA, pARtolC, and pARinfA express afsRNAs that can repress gpt, yhcB, nhaB, dcuA, tamA, tolC, and infA, respectively. (b) Cell morphology and average cell length were analyzed as in ). AL, average length. Scale bar: 10 μm. (c) Computational prediction of base-pairings between yhcB mRNA and SdsR or ARyhcB. The pairing region between SdsR and yhcB mRNA is shown. The mutant containing a G to C mutation at position 37 of SdsR was designed SdsRm and the compensatory mutation at position + 19 of the yhcB coding sequence in the yhcB-lacZ fusion is indicated by yhcBm. The yhcB pairing regions for SdsR and AryhcB are nt + 15 to + 22 and nt −19 to + 1 relative to the start codon, respectively. (d) qRT-PCR analysis of changes in yhcB and tolC mRNA levels upon ectopic expression of SdsR or ARyhcB. (e) SdsRm was assayed for growth defects as in (a). (f) pSdsR and pSdsRm were transformed into the yhcB-lacZ fusion (JS201) and compensatory yhcBm-lacZ mutant fusion (JS202). Cells were treated with 1 mM IPTG and β-galactosidase activities were measured. β-Galactosidase activities were expressed as LacZ activities relative to that of cells containing the vector and treated with 1mM IPTG as a control. In b, d, e and f, mean ± SD; n = 3; *P ≤ 0.05, **P ≤ 0.01, ***P ≤ 0.001 by Student’s t-test.
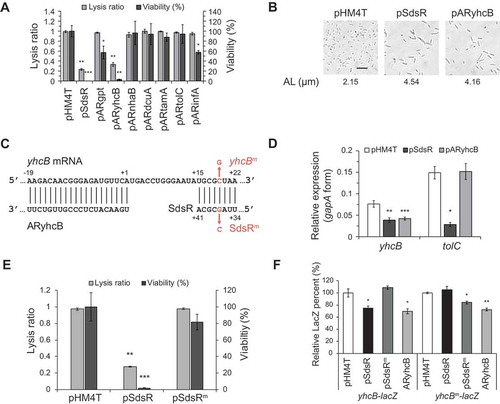
To see whether the base-pairing between the nt 34–41 sequence of SdsR and the + 15-+ 22 sequence of yhcB mRNA respective to the AUG start codon is responsible for yhcB repression, we introduced a G-C mutation at nt 37 of SdsR ()). This SdsR mutant (SdsRm) did not cause growth defects ()). We also examined the involvement of the base-pairing by using a yhcB-lacZ translational fusion. SdsR reduced LacZ activity, while SdsRm did not ()). When we introduced a C-G compensatory mutation at nt + 19 of yhcB mRNA in the yhcB-lacZ fusion, this mutation restored the ability of SdsRm to reduce LacZ activity, while SdsR lost its ability (,)). These results suggest that yhcB repression by SdsR was due to base pairing between SdsR and yhcB mRNA.
SdsR(37–103) can interact with yhcB mRNA through only 5 base-pairs, shorter than 8 base-pairs of SdsR and much shorter than 20 base-pairs of ARyhcB ()). This short base-paring would be ineffective to repress yhcB gene expression, consequently not leading to cell death.
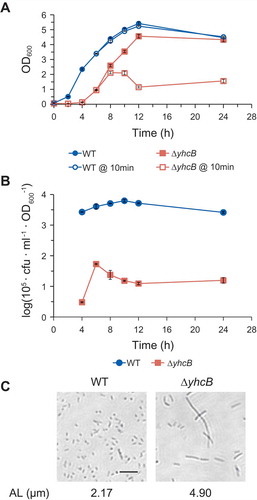
To further confirm that SdsR-mediated yhcB repression is a main cause of the observed SdsR-driven cell death, we constructed a yhcB deletion mutant and examined its growth phenotypes (). The mutant cells displayed growth defects similar to those of cells in which yhcB was repressed by either SdsR or ARyhcB: a vulnerability to lysis, very low cfu/OD600 values at all growth phases and extreme cell filamentation.
Figure 9. Growth defects of yhcB deletion cells. (a) Growth of yhcB deletion strain. Vulnerability to lysis was assessed by comparing OD600 values right after and 10 min after cells were diluted 1:100 with fresh medium. WT, wild type strain. ΔyhcB, yhcB deletion strain. (b) Viability of yhcB deletion cells was assessed by measuring cfu per OD600 of cells. The cfu values are represented in log scale on the y-axis. (c) Cell morphology and average cell length of yhcB deletion cells were analyzed as in ). AL, average length. Scale bar: 10 μm.
Effects of Hfq on SdsR-driven cell death
Since Hfq is known to participate in the functions of sRNAs [Citation18,Citation23,Citation24], we examined whether the observed SdsR-driven cell death is Hfq-dependent. We did not observe SdsR-driven cell death in Δhfq cells, indicating that this phenomenon is Hfq-dependent (,)). Although Hfq is known to bind to SdsR [Citation1,Citation20,Citation37,Citation45], it was not clear what sequence of SdsR is involved in this binding. We performed EMSA with Hfq and SdsR or its 5ʹ truncated derivatives ()), and found that Hfq bound well to SdsR and SdsR(29–103) but not to SdsR(37–103), indicating that the SdsR sequence of nt 29 to nt 36 is essential for Hfq binding. The nt 29–36 sequence forms an A/U-rich stretch (AACUUUUA), to which Hfq preferentially binds [Citation46,Citation47] (see also )). Interestingly, M(29–33) triggered SdsR-driven cell death even though it harbored a mutation in the nt 29–33 sequence of SdsR (-)). However, this mutation (AACUU to UUGAA) could provide a new A/U-rich stretch (UUGAAUUA) for Hfq binding.
Figure 10. Hfq dependency of SdsR-driven phenotypic changes. (a) Lysis ratio and viability of SdsR– or ARyhcB-expressing Δhfq cells were measured as in ). (b) Cell morphology and average cell length of SdsR – or ARyhcB-expressing Δhfq cells were analyzed as in ). AL, average length. Scale bar: 10 μm. (c) Electrophoretic mobility Shift Assay (EMSA) against Hfq and in-vitro synthesized SdsR or its derivatives, 29–103 and 37–103. 32P-labeled RNA (4 nM) was incubated with the indicated concentrations of Hfq.
Finally, we examined whether the absence of Hfq could affect the growth defects triggered by ARyhcB. We found that ARyhcB-induced cell death and lysis were still observed in Δhfq cells ()). We also observed an increase of cell length in ARyhcB-treated Δhfq cells ()). The presence of ARyhcB-mediated growth defects in Δhfq cells might indicate that the silencing of yhcB by ARyhcB is Hfq-independent. This could be logical, as ARyhcB was constructed by embedding the target recognition sequence in an RNA scaffold that lacked Hfq binding sites. Therefore, it seems likely that the Hfq-dependency of SdsR for inducing growth defects is due to Hfq-dependent repression of yhcB by SdsR. The growth defects by ARyhcB were slightly reduced in Δhfq cells compared to those in hfq+ cells ()), however, suggesting that Hfq may be required for subsequent downstream cellular processes leading to cell death and lysis.
Discussion
Under laboratory culture conditions, E. coli cells do not express SdsR during the exponential phase, but highly express it during the stationary phase [Citation1,Citation4,Citation5]. However, it was previously unknown whether this growth-phase-dependent regulation of SdsR was relevant to cell growth. Here, we show that ectopic expression of SdsR during the exponential phase caused cell death accompanied by cell filamentation, whereas the same ectopic expression during the stationary phase had no apparent effect on cell survival. Thus, the observed SdsR-driven cell death appeared to be caused by perturbation of cell division [Citation48,Citation49]. RyeA, which is encoded on the DNA strand opposite that of sdsR, can base pair with the entire SdsR sequence [Citation1,Citation5,Citation43]. Although SdsR is known to bind with Hfq and several target mRNAs [Citation1,Citation20,Citation37,Citation45], the role of RyeA has not previously been determined. We herein show that RyeA, as a cis-encoded sRNA, inhibited the observed SdsR-driven cell death by facilitating the degradation of SdsR. Since RyeA is highly expressed during the exponential phase, it could conceivably contribute to balancing the cellular level of SdsR during this phase.
Toxin-antitoxin (T/A) systems are ubiquitous genetic elements found in bacteria [Citation31,Citation32,Citation50–Citation56]. A toxin genes is one whose expression negatively regulates cellular growth and may trigger cell death by inhibiting essential cellular processes, such as cell division, DNA synthesis, protein synthesis and/or membrane integrity [Citation50,Citation52–Citation56]. Antitoxins, which are expressed from a T/A operon as a protein or an sRNA, neutralize the activity of their cognate toxin via various mechanisms [Citation31,Citation32,Citation51]. In the present case, SdsR can be considered to act as a toxin and RyeA as an antitoxin. As the previously reported toxins have all been proteins, SdsR/RyeA may represent a novel type of T/A system in which both the toxin and the antitoxin are sRNAs. In type I and type III T/A systems, the toxin is a peptide and the antitoxin is sRNA [Citation32,Citation51,Citation57]. Type I antitoxin sRNAs interact with toxin mRNAs, while type III antitoxin sRNAs bind toxin proteins directly. Considering that RyeA can base-pair with SdsR, the sdsR/ryeA gene pair is similar to type I T/A systems although the toxin itself is also an sRNA, not a protein. Like all currently known T/A systems, the antitoxin RyeA is short-lived and the toxin SdsR is long-lived [Citation58–Citation60]. Thus, if SdsR is upregulated during the exponential phase, the short-lived RyeA could be rapidly degraded and SdsR could be easily accumulated, eventually causing cell death.
Homologous SdsR/RyeA elements are also found in many enterobacterial species [Citation36,Citation37], suggesting that this type of T/A system may be widespread throughout the enterobacteria.
Since we observed SdsR-driven cell death when SdsR was ectopically overexpressed during the exponential phase, it would be intriguing to speculate about the conditions under which cells might express a higher level of SdsR during exponential growth. High-level expression of SdsR during the exponential phase could be achieved by its transcriptional activation. SdsR transcription is dependent on RpoS [Citation34,Citation36], which is required for cells to survive various environmental stresses, including osmotic shock, and oxidative stress, starvation, low pH and high temperatures [Citation61,Citation62]. We speculate that if rpoS expression is highly activated during the exponential phase under certain stresses, SdsR could be synthesized at toxic levels. For example, rpoS-activating sRNAs can be triggered in the exponential phase under various stress conditions (e.g., osmotic stress), leading to the active translation of RpoS [Citation17,Citation63,Citation64]. A study showed that rpoS expression increased four- to five-fold following acid challenge during the exponential phase, and that this occurred via the induction of rpoS-activating sRNAs [Citation64]. It has been proposed that T/A systems can engage in stress management by making cells sacrifice a large fraction of their population or enter dormancy [Citation53,Citation65,Citation66]. Therefore, the SdsR/RyeA T/A system could be a part of the RpoS-mediated stress-survival response.
SdsR is known to target the tolC and mutS genes in E. coli [Citation34,Citation35], and more target mRNAs are expected given that SdsR in the related enterobacterium, Salmonella enterica represses many target mRNAs, including ompD, crp, stpA, hupB, tolC and rtsA/B [Citation36,Citation37]. Indeed, our RNA-seq analysis showed that pulse expression of SdsR downregulated more than 100 genes, indicating that there are many candidate SdsR targets in E. coli. To predict which SdsR-targeted mRNAs could contribute to SdsR-driven cell death, we performed a combined analysis using bioinformatic predictions, the minimal functional domain of SdsR, and its RNA-seq data. We then examined whether repression of translation of each predicted target mRNA could cause the observed SdsR-driven growth defects, and found that the SdsR-driven cell death seen in our system was mainly caused by the SdsR-mediated repression of yhcB, which encodes an inner membrane protein. The Vogel group previously identified yhcB as a candidate target of SdsR in S. enterica [Citation37].
The encoded YhcB was initially proposed to be a putative third subunit of cytochrome bd-type ubiquinol oxidase (CydAB) [Citation42,Citation67], but a subsequent study showed that it is dispensable for the assembly and function of CydAB [Citation41]. A recent study showed that the yhcB and rodZ double-deletion was lethal while strains with either single deletion were viable, and the authors suggested that YhcB helps maintain the cell shape by joining RodZ in contributing to cell envelope biogenesis [Citation40]. Here, we report that yhcB deletion cells show severe filamentous phenotypes consistent with the yhcB knockdown phenotype.
Although our work identifies yhcB as a major target of SdsR for cell death, we cannot exclude the possibility that additional targets are involved in this process. We found that the cell death or vulnerability to lysis caused by yhcB repression alone was less severe than that triggered by ectopic overexpression of SdsR. Thus, the observed SdsR-driven phenotypic changes may be caused by the combined effects of alterations in the expression levels of several different genes. In this regards, it is noteworthy that SdsR(45–103), which does not repress yhcB, caused mild cell death but a severe filamentous phenotype.
Finally, we showed that SdsR-driven cell death occurs in an Hfq-dependent manner. Our EMSA experiments revealed that the major Hfq binding site lies in the AT-rich sequence between nt 29 and nt 36 of SdsR, suggesting that ability of SdsR to repress yhcB could be Hfq-dependent. The Hfq-dependency of SdsR for repressing yhcB is also supported by our finding that repression of yhcB with its afsRNA, Hfq-independent ARyhcB, still yielded growth defects in Δhfq cells. Since the growth defects by ARyhcB were rather moderate, however, it seems likely that Hfq is required not only for the targeting of SdsR to yhcB, but also for subsequent downstream cellular processes that lead to cell death.
In summary, we herein show for the first time that the ectopic expression of SdsR during the exponential phase triggers a significant and Hfq-dependent cell death in E. coli. This SdsR-driven cell death is alleviated by overexpression of RyeA, an sRNA transcribed on the opposite DNA strand, suggesting that SdsR/RyeA may represent a novel type of T/A system in which both the toxin and the antitoxin are sRNAs. Analysis of predicted target mRNAs suggests that the cell death is caused by SdsR-mediated repression of yhcB, which encodes an inner membrane protein. Our findings provide new insight into the highly diverse roles of the sRNA, SdsR, in the cell physiology of E. coli.
Materials and methods
Bacterial strains, plasmids and growth conditions
All utilized bacterial strains and plasmids are listed in Table S6. The ryeA/sdsR and yhcB deletion strain were constructed by substituting the −109 to + 221 region of sdsR (relative to the transcription start site) and ORF of yhcB, respectively, with the kanamycin-resistance gene using plasmid pKD46, which contained the lambda red recombinase-encoding gene [Citation68]. For the construction of a strain carrying the yhcB-lacZ translational fusion, the 5ʹ UTR and the coding sequence of + 1 to + 30 respective to the ATG translation start codon of yhcB was fused to the 10th codon of the lacZ coding sequence, as described previously [Citation69]. The resulting translational fusion are annotated JS201(yhcB-lacZ). Since the transcription start of yhcB was not known, 200 nt upstream chromosomal sequences of the AUG start codon were used as the 5ʹ UTR sequence. A + 19 C to G mutation in the yhcB coding sequence in the lacZ fusion was introduced using overlapping PCR to generate JS202(yhcBm-lacZ), as described previously [Citation70]. Plasmids pHM4T and pAKA, which were derived from pACYC184 and pBR322, respectively, were used as cloning vectors to generate RNA expression plasmids, as described previously [Citation33]. RNA expression plasmids for afsRNAs, which can bind to the translation initiation region of each target mRNA, were constructed as described previously [Citation10,Citation71]. Primers and oligonucleotides used for plasmid and strain construction are shown in Table S7.
Assays for vulnerability to lysis and cell viability
E. coli cells were grown overnight in LB broth, with antibiotics as needed. Overnight cultures were diluted 1:100 in fresh LB medium and cells were grown further at 37°C. Vulnerability to lysis was assessed by comparing OD600 values right after and 10 min after cells were diluted 1:10 with fresh LB medium. When necessary, lysis was also tested with cells diluted with spent LB medium. The spent medium was prepared from cultures of 10-h grown cells containing the control vector pMH4T. The cultures were centrifuged at 16,000 × g for 15 min. The supernatant medium was filtered through a 0.2 µm filter for sterilization and was kept 4 °C until used. Phage assays were also performed by serially diluting 6-h grown cells and plating them on LB plates. Cell viability was assessed by measuring the cfu of cells.
Microscopy and cell length measurement
The shape of SdsR-induced cells was observed by light microscopy. The average cell length was measured by CellProfiler image analysis program (http://cellprofiler.org).
RNA extraction and northern blot analysis
E. coli cells were grown overnight in LB broth, with antibiotics as needed. Overnight cultures were diluted 1:100 in fresh LB medium and cells were grown further at 37°C. Total cellular RNAs were extracted at the desired time points using the acidic hot-phenol method, as described previously [Citation72]. To generate RNAs in vitro, the T7 RiboMAX™ Express Large Scale RNA Production System (Promega) was used. Northern blot analysis was carried out as described previously [Citation72]. Briefly, 5–10 μg of total RNAs were fractionated on a 5% polyacrylamide gel containing 7 M urea and electrotransferred to a HybondTM-XL membrane (Amersham Biosciences). Membranes were hybridized with 32P-labeled DNA probes in PerfectHyb™ Plus Hybridization Buffer (Sigma Aldrich) and analyzed using an Image Analyzer FLA 7000 (Fuji).
RNA stability assay
RNA stability assay was performed, as described previously [Citation5]. Briefly, Overnight cultures were diluted (1:100) into fresh medium and grown at 37°C for 3 h for exponential phase and 10 h for stationary phase. Rifampicin was added to the culture at a final concentration of 500 μg/ml. Cultures were collected at time intervals. Total cellular RNAs were prepared and subjected to Northern blot analysis.
EMSA
Electrophoretic mobility shift assays (EMSAs) were performed as described previously [Citation37]. The Hfq protein was purified as described previously [Citation73]. For the expression of Hfq, BL21-Gold(DE3) (Invitrogen) strain was used. SdsR and its mutant transcripts were prepared using T7 RNA polymerase (Promega) with PCR-amplified DNA fragments containing the T7 promoter sequence as templates. 32P-Labeled RNAs (4 μM each) were incubated with Hfq protein in 10 x sequencing buffer (Ambion) at 37°C for 10 min. The reaction mixtures were analyzed on a 5% (v/v) non-denaturing polyacrylamide gel at 4°C, and the gel was analyzed using an Image Analyzer FLA 7000.
RNA-seq
E. coli cells containing pHM4T, pSdsR, or pSdsR(45–103) were grown at 37°C to an OD600 of 1.5 ~ 1.7. A final volume of 1 mM IPTG was added to the cell culture, followed by another 10 min and total RNAs were extracted using an RNeasy mini kit (Qiagen). For DNase treatment of 10 μg of total RNA, a Turbo DNA free kit (Ambion) was used according to the manufacturer’s guidelines. The isolated RNA was stored at −80°C until use. All RNA sequencing and alignment procedures were conducted by ChunLab. The Ribo-Zero rRNA removal kit (Epicentre) was used for ribosomal RNA depletion according to manufacturer instructions. Libraries for Illumina sequencing were generated using a TruSeq Stranded mRNA sample prep kit (Illumina) according to the manufacturer’s protocol. RNA sequencing was performed on the Illumina HiSeq 2500 platform using single-end 50 bp sequencing. The sequence data for the reference genome were retrieved form the NCBI database. Quality-filtered reads were aligned to the reference genome sequence using Bowtie2.
The relative transcript abundance was measured in Relative Log Expression (RLE). To screen for mRNAs whose levels differed by more than two-fold versus that wild-type cells, we filtered for mRNAs with EdgeR p values < 0.05. For gene ontology analysis, the 209 genes found to be up- or downregulated by pulsed expression of SdsR were sorted according to their Gene Ontology (GO) categories (http://amigo.geneontology.org) [Citation74]. For filtration of target mRNAs of SdsR from the downregulated genes, a target prediction program CopraRNA was used (http://rna.informatik.uni-freiburg.de/CopraRNA/Input.jsp) [Citation75].
LacZ activity assays
Three colonies for each strain were cultured in LB medium containing ampicillin (100 μg/ml) and the overnight culture was diluted to 1:100 and cultured with the fresh medium containing 0.02% arabinose and 1mM IPTG. The culture was incubated for 4 h. LacZ activity was assayed as described previously [Citation76].
qRT-PCR
RNA extraction and DNase treatment were performed as described for the RNA-seq section above. cDNA was synthesized using 2x SuPrime Reverse Transcriptase with random hexamers (Genet Bio). For qPCR, the Prime Q-master mix (Genet Bio) was used. Real-Time PCR was performed using Exicycler™ 96 (Bioneer). The qRT-PCR values of each mRNA were normalized to that of a gapA gene [Citation77]. All experiments were performed according to the manufacturer’s instructions.
Data availability
RNA-seq raw data for this study have been deposited in the National Center for Biotechnology Information Gene Expression Omnibus (GEO) and are accessible through the GEO Series accession number GSE116435. All other relevant data are available from the corresponding author on request.
Disclosure of interest
The authors declare no competing financial interests.
Supplemental Material
Download MS Word (1.2 MB)Acknowledgments
This study was supported by a National Research Foundation of Korea (NRF) Grant from the Korean government (MSIT) (NRF-2017R1A2B4010713) and the Intelligent Synthetic Biology Center of Global Frontier Project funded by MSIT (2013M3A6A8073557). We would like to thank NBRP-E.coli at NIG for providing E. coli strains containing the Keio knockout library and Prof. S. A. Woodson for providing a vector expressing Hfq.
Supplementary materials
Supplemental data for this article can be accessed here
Additional information
Funding
Related Research Data
References
- Wassarman KM, Repoila F, Rosenow C, et al. Identification of novel small RNAs using comparative genomics and microarrays. Genes Dev [Internet]. 2001 [cited 2014 May 27];15:1637–1651. Available from: http://www.ncbi.nlm.nih.gov/pubmed/11445539
- Storz G. An expanding universe of noncoding RNAs. Science [Internet]. 2002 [cited 2014 May 19];296:1260–1263. Available from: http://www.sciencemag.org/content/296/5571/1260.long
- Altuvia S. Identification of bacterial small non-coding RNAs: experimental approaches. Curr Opin Microbiol [Internet]. 2007 [cited 2018 Jun 18];10:257–261. Available from: https://www.sciencedirect.com/science/article/pii/S1369527407000501
- Argaman L, Hershberg R, Vogel J, et al. Novel small RNA-encoding genes in the intergenic regions of Escherichia coli. Curr Biol [Internet]. 2001 [cited 2014 May 27];11:941–950. Available from: http://www.ncbi.nlm.nih.gov/pubmed/11448770
- Vogel J, Bartels V, Tang TH, et al. RNomics in Escherichia coli detects new sRNA species and indicates parallel transcriptional output in bacteria. Nucleic Acids Res [Internet]. 2003 [cited 2014 May 14];31:6435–6443. Available from: http://nar.oxfordjournals.org/lookup/doi/10.1093/nar/gkg867
- Bak G, Lee J, Suk S, et al. Identification of novel sRNAs involved in biofilm formation, motility, and fimbriae formation in Escherichia coli. Sci Rep [Internet]. 2015 [cited 2017 Jan 3];5:15287. Available from: http://www.nature.com/articles/srep15287
- Vogel J, Sharma CM. How to find small non-coding RNAs in bacteria. Biol Chem [Internet]. 2005 [cited 2018 Jun 18];386:1219–1238. Available from: http://www.ncbi.nlm.nih.gov/pubmed/16336117
- Chen S, Lesnik EA, Hall TA, et al. A bioinformatics based approach to discover small RNA genes in the Escherichia coli genome. Biosystems [Internet]. 2002 [cited 2018 Jan 31];65:157–177. Available from: https://www.sciencedirect.com/science/article/pii/S0303264702000138
- Rice JB, Balasubramanian D, Vanderpool CK. Small RNA binding-site multiplicity involved in translational regulation of a polycistronic mRNA. Proc Natl Acad Sci U S A [Internet]. 2012 [cited 2014 May 14];109:E2691–8. Available from: http://www.pubmedcentral.nih.gov/articlerender.fcgi?artid=3479541&tool=pmcentrez&rendertype=abstract
- Park H, Bak G, Kim SC, et al. Exploring sRNA-mediated gene silencing mechanisms using artificial small RNAs derived from a natural RNA scaffold in Escherichia coli. Nucleic Acids Res [Internet]. 2013 [cited 2014 Jun 4];41:3787–3804. Available from: http://www.pubmedcentral.nih.gov/articlerender.fcgi?artid=3616725&tool=pmcentrez&rendertype=abstract
- Storz G, Vogel J, Wassarman KM. Regulation by small RNAs in bacteria: expanding frontiers. Mol Cell [Internet]. 2011 [cited 2014 Apr 30];43:880–891. Available from: http://www.sciencedirect.com/science/article/pii/S1097276511006435
- Gottesman S. Micros for microbes: non-coding regulatory RNAs in bacteria. Trends Genet [Internet]. 2005 [cited 2014 May 8;21:399–404. Available from: http://www.sciencedirect.com/science/article/pii/S0168952505001381
- Gottesman S. The small RNA regulators of Escherichia coli: roles and mechanisms. Annu Rev Microbiol [Internet]. 2004 [cited 2014 May 2];58:303–328. Available from: http://www.annualreviews.org/doi/10.1146/annurev.micro.58.030603.123841
- Morita T, Mochizuki Y, Aiba H. Translational repression is sufficient for gene silencing by bacterial small noncoding RNAs in the absence of mRNA destruction. Proc Natl Acad Sci USA [Internet]. 2006 [cited 2018 Jun 19];103:4858–4863. Available from: http://www.ncbi.nlm.nih.gov/pubmed/16549791
- Henderson CA, Vincent HA, Stone CM, et al. Characterization of MicA interactions suggests a potential novel means of gene regulation by small non-coding RNAs. Nucleic Acids Res [Internet]. 2013 [cited 2014 Apr 28];41:3386–3397. [cited: http://www.pubmedcentral.nih.gov/articlerender.fcgi?artid=3597676&tool=pmcentrez&rendertype=abstract
- Storz G, Opdyke JA, Zhang A. Controlling mRNA stability and translation with small, noncoding RNAs. Curr Opin Microbiol [Internet]. 2004 [cited 2018 Jun 18];7:140–144. Available from: https://www.sciencedirect.com/science/article/pii/S1369527404000281
- Fröhlich KS, Vogel J. Activation of gene expression by small RNA. Curr Opin Microbiol [Internet]. 2009 [cited 2018 Jun 19];12:674–682. Available from: https://www.sciencedirect.com/science/article/pii/S136952740900143X
- Valentin-Hansen P, Eriksen M, Udesen C. The bacterial Sm-like protein Hfq: a key player in RNA transactions. Mol Microbiol [Internet]. 2004 [cited 2014 Jun 4];51:1525–1533. Available from: http://www.ncbi.nlm.nih.gov/pubmed/15009882
- Aiba H. Mechanism of RNA silencing by Hfq-binding small RNAs. Curr Opin Microbiol [Internet]. 2007 [cited 2014 May 27];10:134–139. Available from: http://www.ncbi.nlm.nih.gov/pubmed/17383928
- Zhang A, Wassarman KM, Rosenow C, et al. Global analysis of small RNA and mRNA targets of Hfq. Mol Microbiol [Internet]. 2003 [cited 2018 Jun 18];50:1111–1124. Available from: http://doi.wiley.com/10.1046/j.1365-2958.2003.03734.x
- Peng Y, Curtis JE, Fang X, et al. Structural model of an mRNA in complex with the bacterial chaperone Hfq. Proc Natl Acad Sci [Internet]. 2014 [cited 2017 Jan 2];111:17134–17139. Available from: http://www.ncbi.nlm.nih.gov/pubmed/25404287
- Kim T, Bak G, Lee J, et al. Systematic analysis of the role of bacterial Hfq-interacting sRNAs in the response to antibiotics. J Antimicrob Chemother [Internet]. 2015 [cited 2017 Jan 2];70:1659–1668. Available from: http://www.ncbi.nlm.nih.gov/pubmed/25724987
- Melamed S, Peer A, Faigenbaum-Romm R, et al. Global mapping of small RNA-target interactions in bacteria. Mol Cell [Internet]. 2016 [cited 2016 Dec 6];63:884–897. Available from: http://linkinghub.elsevier.com/retrieve/pii/S1097276516304130
- Geissmann TA, Touati D. Hfq, a new chaperoning role: binding to messenger RNA determines access for small RNA regulator. EMBO J [Internet]. 2004 [cited 2014 May 27];23:396–405. Available from: http://www.pubmedcentral.nih.gov/articlerender.fcgi?artid=1271764&tool=pmcentrez&rendertype=abstract
- Georg J, Hess WR. cis-antisense RNA, another level of gene regulation in bacteria. Microbiol Mol Biol Rev [Internet]. 2011 [cited 2018 Jan 31];75:286–300. Available from: http://www.ncbi.nlm.nih.gov/pubmed/21646430
- Brantl S. Regulatory mechanisms employed by cis-encoded antisense RNAs. Curr Opin Microbiol [Internet]. 2007 [cited 2018 Jan 31];10:102–109. [cited: https://www.sciencedirect.com/science/article/pii/S136952740700029X
- Kawano M, Reynolds AA, Miranda-Rios J, et al. Detection of 5ʹ- and 3ʹ-UTR-derived small RNAs and cis-encoded antisense RNAs in Escherichia coli. Nucleic Acids Res [Internet]. 2005 [cited 2018 Jan 31];33:1040–1050. Available from : https://academic.oup.com/nar/article-lookup/doi/10.1093/nar/gki256
- Massé E, Salvail H, Desnoyers G, et al. Small RNAs controlling iron metabolism. Curr Opin Microbiol [Internet]. 2007 [cited 2018 Jan 31];10:140–145. [cited: https://www.sciencedirect.com/science/article/pii/S1369527407000306
- Darfeuille F, Unoson C, Vogel J, et al. An antisense RNA inhibits translation by competing with standby ribosomes. Mol Cell [Internet]. 2007 [cited 2018 Jun 19];26:381–392. Available from : https://www.sciencedirect.com/science/article/pii/S1097276507002195
- Opdyke JA, Kang J-G, Storz G. GadY, a small-RNA regulator of acid response genes in Escherichia coli. J Bacteriol [Internet]. 2004 [cited 2018 Jan 31];186:6698–6705. Available from: http://www.ncbi.nlm.nih.gov/pubmed/15466020
- Gerdes K, Wagner EGH. RNA antitoxins. Curr Opin Microbiol [Internet]. 2007 [cited 2018 Jan 31];10:117–124. Available from: https://www.sciencedirect.com/science/article/pii/S1369527407000203
- Fozo EM, Hemm MR, Storz G. Small toxic proteins and the antisense RNAs that repress them. Microbiol Mol Biol Rev [Internet]. 2008 [cited 2018 Jan 31];72:579–589. Table of contents. Available from: http://www.ncbi.nlm.nih.gov/pubmed/19052321
- Han K, Kim K, Bak G, et al. Recognition and discrimination of target mRNAs by Sib RNAs, a cis-encoded sRNA family. Nucleic Acids Res [Internet]. 2010 [cited 2018 Jan 31];38:5851–5866. Available from: http://www.ncbi.nlm.nih.gov/pubmed/20453032
- Gutierrez A, Laureti L, Crussard S, et al. β-lactam antibiotics promote bacterial mutagenesis via an RpoS-mediated reduction in replication fidelity. Nat Commun [Internet]. 2013 [cited 2018 Jun 22];4:1610. Available from: http://www.nature.com/articles/ncomms2607
- Parker A, Gottesman S. Small RNA regulation of TolC, the outer membrane component of bacterial multidrug transporters. J Bacteriol [Internet]. 2016 [cited 2016 Dec 29];198:1101–1113. Available from: http://jb.asm.org/lookup/doi/10.1128/JB.00971-15
- Fröhlich KS, Papenfort K, Berger AA, et al. A conserved RpoS-dependent small RNA controls the synthesis of major porin OmpD. Nucleic Acids Res [Internet]. 2012 [cited 2013 Nov 12];40:3623–3640. Available from: http://www.pubmedcentral.nih.gov/articlerender.fcgi?artid=3333887&tool=pmcentrez&rendertype=abstract
- Fröhlich KS, Haneke K, Papenfort K, et al. The target spectrum of SdsR small RNA in Salmonella. Nucleic Acids Res [Internet]. 2016 [cited 2018 Jan 31];44:10406–10422. Available from: http://www.ncbi.nlm.nih.gov/pubmed/27407104
- Peano C, Wolf J, Demol J, et al. Characterization of the Escherichia coli σS core regulon by Chromatin Immunoprecipitation-sequencing (ChIP-seq) analysis. Sci Rep [Internet]. 2015 [cited 2018 Jun 15];5:10469. Available from: http://www.nature.com/articles/srep10469
- Lévi-Meyrueis C, Monteil V, Sismeiro O, et al. Expanding the RpoS/σS-Network by RNA Sequencing and Identification of σS-Controlled Small RNAs in Salmonella. PLoS One [Internet]. 2014 [cited 2018 Jun 27];9:e96918. Available from: http://dx.plos.org/10.1371/journal.pone.0096918
- Li G, Hamamoto K, Kitakawa M. Inner membrane protein YhcB interacts with RodZ involved in cell shape maintenance in Escherichia coli. ISRN Mol Biol [Internet]. 2012 [cited 2018 May 26];2012:304021. Available from: http://www.ncbi.nlm.nih.gov/pubmed/27335665
- Mogi T, Mizuochi-Asai E, Endou S, et al. Role of a putative third subunit YhcB on the assembly and function of cytochrome bd-type ubiquinol oxidase from Escherichia coli. Biochim Biophys Acta - Bioenerg [Internet]. 2006 [cited 2018 May 26];1757:860–864. Available from: http://www.ncbi.nlm.nih.gov/pubmed/16863643
- Stenberg F, Chovanec P, Maslen SL, et al. Protein complexes of the Escherichia coli cell envelope. J Biol Chem [Internet]. 2005 [cited 2018 May 26];280:34409–34419. Available from: http://www.ncbi.nlm.nih.gov/pubmed/16079137
- Balbontín R, Figueroa-Bossi N, Casadesús J, et al. Insertion hot spot for horizontally acquired DNA within a bidirectional small-RNA locus in Salmonella enterica. J Bacteriol [Internet]. 2008 [cited 2018 Feb 18];190:4075–4078. Available from: http://www.ncbi.nlm.nih.gov/pubmed/18390661
- Murata M, Ishii A, Fujimoto H, et al. Update of thermotolerant genes essential for survival at a critical high temperature in Escherichia coli. PLoS One [Internet]. 2018 [cited 2018 May 23];13:e0189487. Available from: http://dx.plos.org/10.1371/journal.pone.0189487
- Sittka A, Lucchini S, Papenfort K, et al. Deep sequencing analysis of small noncoding RNA and mRNA targets of the global post-transcriptional regulator, Hfq. PLoS Genet [Internet]. 2008 [cited 2018 Jun 19];4:e1000163. Available from: http://www.ncbi.nlm.nih.gov/pubmed/18725932
- Vytvytska O, Moll I, Kaberdin VR, et al. Hfq (HF1) stimulates ompA mRNA decay by interfering with ribosome binding. Genes Dev [Internet]. 2000 [cited 2018 Jun 29];14:1109–1118. Available from: http://www.ncbi.nlm.nih.gov/pubmed/10809669
- Zhang A, Wassarman KM, Ortega J, et al. The Sm-like Hfq protein increases OxyS RNA interaction with target mRNAs. Mol Cell [Internet]. 2002 [cited 2018 Jun 29];9:11–22. Available from: http://www.ncbi.nlm.nih.gov/pubmed/11804582
- Kohanski MA, Dwyer DJ, Collins JJ. How antibiotics kill bacteria: from targets to networks. Nat Rev Microbiol [Internet]. 2010 [cited 2018 Jun 22];8:423–435. Available from: http://www.ncbi.nlm.nih.gov/pubmed/20440275
- Dwyer DJ, Camacho DM, Kohanski MA, et al. Antibiotic-induced bacterial cell death exhibits physiological and biochemical hallmarks of apoptosis. Mol Cell [Internet]. 2012 [cited 2018 Jun 22;46:561–572. Available from: https://www.sciencedirect.com/science/article/pii/S1097276512003498
- Yarmolinsky MB. Programmed cell death in bacterial populations. . Science (80-) [Internet]. 1995 [cited 2018 May 27];267:836–837. Available from: http://www.sciencemag.org/cgi/doi/10.1126/science.7846528
- Fineran PC, Blower TR, Foulds IJ, et al. The phage abortive infection system, ToxIN, functions as a protein-RNA toxin-antitoxin pair. Proc Natl Acad Sci USA [Internet]. 2009 [cited 2018 May 27];106:894–899. Available from: http://www.ncbi.nlm.nih.gov/pubmed/19124776
- Brown JM, Shaw KJ. A novel family of Escherichia coli toxin-antitoxin gene pairs. J Bacteriol [Internet]. 2003 [cited 2018 May 27];185:6600–6608. Available from: http://www.ncbi.nlm.nih.gov/pubmed/14594833
- Wang X, Lord DM, Cheng H-Y, et al. A new type V toxin-antitoxin system where mRNA for toxin GhoT is cleaved by antitoxin GhoS. Nat Chem Biol [Internet]. 2012 [cited 2018 May 27];8:855–861. Available from: http://www.nature.com/articles/nchembio.1062
- Markovski M, Wickner S. Preventing bacterial suicide: a novel toxin-antitoxin strategy. Mol Cell [Internet]. 2013 [ cited 2018 May 27];52:611–612. Available from: https://www.sciencedirect.com/science/article/pii/S109727651300868X
- Yamaguchi Y, Inouye M. Regulation of growth and death in Escherichia coli by toxin-antitoxin systems. Nat Rev Microbiol [Internet]. 2011 [ [cited 2014 May 1];9:779–790. Available from: http://www.ncbi.nlm.nih.gov/pubmed/21927020
- Aakre CD, Phung TN, Huang D, et al. A bacterial toxin inhibits DNA replication elongation through a direct interaction with the β sliding clamp. Mol Cell [Internet]. 2013 [cited 2018 May 27];52:617–628. Available from: http://www.ncbi.nlm.nih.gov/pubmed/24239291
- Van Melderen L, Saavedra De Bast M. Bacterial toxin–antitoxin systems: more than selfish entities? PLoS Genet [Internet]. 2009 [cited 2018 Sep 5];5:e1000437. Available from: http://www.ncbi.nlm.nih.gov/pubmed/19325885
- Yamaguchi Y, Inouye M. Regulation of growth and death in Escherichia coli by toxin–antitoxin systems. Nat Rev Microbiol [Internet]. 2011 [cited 2018 Sep 6];9:779–790. Available from: http://www.ncbi.nlm.nih.gov/pubmed/21927020
- Van Melderen L. Toxin–antitoxin systems: why so many, what for? Curr Opin Microbiol [Internet]. 2010 [ [cited 2018 Sep 6];13:781–785. [cited: http://www.ncbi.nlm.nih.gov/pubmed/21041110
- Brantl S. Bacterial type I toxin-antitoxin systems. RNA Biol [Internet]. 2012 [cited 2018 Sep 6];9:1488–1490. Available from: http://www.tandfonline.com/doi/abs/10.4161/rna.23045
- Battesti A, Majdalani N, Gottesman S. The RpoS-mediated general stress response in Escherichia coli. Annu Rev Microbiol [Internet]. 2011 [ cited 2018 Jun 19];65:189–213. Available from: http://www.ncbi.nlm.nih.gov/pubmed/21639793
- Suh SJ, Silo-Suh L, Woods DE, et al. Effect of rpoS mutation on the stress response and expression of virulence factors in Pseudomonas aeruginosa. J Bacteriol [Internet]. 1999 [ cited 2018 Jun 19];181:3890–3897. Available from: http://www.ncbi.nlm.nih.gov/pubmed/10383954
- Mandin P, Gottesman S. Integrating anaerobic/aerobic sensing and the general stress response through the ArcZ small RNA. EMBO J [Internet]. 2010 [ cited 2013 Dec 12];29:3094–3107. Available from: http://www.pubmedcentral.nih.gov/articlerender.fcgi?artid=2944060&tool=pmcentrez&rendertype=abstract
- Bak G, Han K, Kim D, et al. Roles of rpoS-activating small RNAs in pathways leading to acid resistance of Escherichia coli. Microbiologyopen [Internet]. 2014 [ [cited 2018 May 26];3:15–28. Available from: http://www.ncbi.nlm.nih.gov/pubmed/24319011
- Lewis K. Persister cells, dormancy and infectious disease. Nat Rev Microbiol [Internet]. 2007 [ cited 2018 Jun 19];5:48–56. Available from: http://www.nature.com/articles/nrmicro1557
- Hayes F. Toxins-antitoxins: plasmid maintenance, programmed cell death, and cell cycle arrest. Science (80-) [Internet]. 2003 [cited 2018 Jun 22];301:1496–1499. Available from: http://www.ncbi.nlm.nih.gov/pubmed/12970556
- Maddalo G, Stenberg-Bruzell F, GöTzke H, et al. Systematic analysis of native membrane protein complexes in Escherichia coli. J Proteome Res [Internet]. 2011 [cited 2018 May 26];10:1848–1859. Available from: http://pubs.acs.org/doi/abs/10.1021/pr101105c
- Baba T, Ara T, Hasegawa M, et al. Construction of Escherichia coli K-12 in-frame, single-gene knockout mutants: the Keio collection. Mol Syst Biol [Internet]. 2006 [cited 2014 Apr 29];2:2006.0008. Available from: http://www.ncbi.nlm.nih.gov/pubmed/16738554
- Mandin P, Gottesman S. A genetic approach for finding small RNAs regulators of genes of interest identifies RybC as regulating the DpiA/DpiB two-component system. Mol Microbiol [Internet]. 2009 [ cited 2018 May 26];72:551–565. Available from: http://www.ncbi.nlm.nih.gov/pubmed/19426207
- Ho SN, Hunt HD, Horton RM, et al. Site-directed mutagenesis by overlap extension using the polymerase chain reaction. Gene [Internet]. 1989 [cited 2018 Sep 6];77:51–59. Available from: http://www.ncbi.nlm.nih.gov/pubmed/2744487
- Bak G, Choi JS, Kim W, et al. An effective method for specific gene silencing in Escherichia coli using artificial small RNA. Methods Mol Biol [Internet]. 2015 [cited 2015 Sep 4];1316:211–225. Available from: http://link.springer.com/10.1007/978-1-4939-2730-2_17
- Kim S, Kim H, Park I, et al. Mutational analysis of RNA structures and sequences postulated to affect 3ʹ processing of M1 RNA, the RNA component of Escherichia coli RNase P. J Biol Chem [Internet]. 1996 [ cited 2018 Jan 31];271:19330–19337. Available from: http://www.ncbi.nlm.nih.gov/pubmed/8702618
- Santiago-Frangos A, Kavita K, Schu DJ, et al. C-terminal domain of the RNA chaperone Hfq drives sRNA competition and release of target RNA. Proc Natl Acad Sci [Internet]. 2016 [cited 2016 Dec 29];113:E6089–96. Available from: http://www.pnas.org/lookup/doi/10.1073/pnas.1613053113
- Gene Ontology Consortium. The Gene Ontology (GO) database and informatics resource. Nucleic Acids Res [Internet]. 2004 [cited 2018 May 26];32:258D–261. Available from: https://academic.oup.com/nar/article-lookup/doi/10.1093/nar/gkh036.
- Wright PR, Georg J, Mann M, et al. CopraRNA and IntaRNA: predicting small RNA targets, networks and interaction domains. Nucleic Acids Res [Internet]. 2014 [ cited 2018 Jun 28];42:W119–23. Available from: http://www.ncbi.nlm.nih.gov/pubmed/24838564
- Zhang X, Bremer H. Control of the Escherichia coli rrnB P1 promoter strength by ppGpp. J Biol Chem [Internet]. 1995 [cited 2018 Sep 4];270:11181–11189. Available from: http://www.ncbi.nlm.nih.gov/pubmed/7538113
- Sedlyarova N, Shamovsky I, Bharati BK, et al. sRNA-Mediated Control of Transcription Termination in E. coli. Cell [Internet]. 2016 [ cited 2018 Jun 28];167:111–121.e13. Available from: http://www.ncbi.nlm.nih.gov/pubmed/27662085