
ABSTRACT
PreQ1 riboswitches regulate the synthesis of the hypermodified tRNA base queuosine by sensing the pyrrolopyrimidine metabolite preQ1. Here, we use single-molecule FRET to interrogate the structural dynamics of apo and preQ1-bound states of the preQ1-II riboswitch from Lactobacillus rhamnosus. We find that the apo-form of the riboswitch spontaneously samples multiple conformations. Magnesium ions and preQ1 stabilize conformations that sequester the ribosome-binding site of the mRNA within the pseudoknotted structure, thus inhibiting translation initiation. Our results reveal that folding of the preQ1-II riboswitch is complex and provide evidence favoring a conformational selection model of effector binding by riboswitches of this class.
Riboswitches are cis-acting mRNA sequences that regulate gene expression in response to changes in intracellular concentrations of second messengers, ions, or small metabolites, such cyclic di-GMP, Mg2+ or preQ1 ()) [Citation1–Citation3]. The preponderance of riboswitches are found in bacteria and are located in the 5´-leader sequences of mRNA where they fold into mutually exclusive structures that regulate downstream genes or operons [Citation4,Citation5]. The riboswitch architecture comprises a ‘sensing’ domain known as the aptamer, and a regulatory region known as the expression platform, which harbors gene-regulatory sequences [Citation6]. Riboswitches modulate gene expression by adopting a conformation that is stabilized by the binding of a specific effector. In the case of transcriptional riboswitches, effector-mediated conformational changes can promote or destabilize the formation of a transcriptional terminator [Citation7]. By contrast, translational riboswitches alter the accessibility of the ribosome binding (Shine-Dalgarno, SD) site by formation of stable intramolecular structures that mask or unfurl the mRNA’s SD sequence [Citation8]. Because the SD site must be accessible to pair with the 3´-end of the 16S rRNA to engage the ribosome, translational riboswitches can regulate translation initiation in bacteria [Citation9].
Figure 1. Queuosine biosynthesis, the preQ1-II riboswitch structure and experimental construct for smFRET. (a) The queuosine (Q) base is a hypermodified base that is widespread in prokaryotes and eukaryotes. However, Q is only synthesized de novo in bacteria. Q production starts with GTP and proceeds by several enzymatic steps (arrow) to the last free intermediate preQ1 (7-aminomethyl-7-deazaguanine), which is then inserted into specific tRNAs followed by additional in situ modifications [Citation16]. (b) Ribbon diagram depicting the global HLout pseudoknot fold of the preQ1-II riboswitch from Lactobacillus rhamnosus (Lrh) (PDB entry 4jf2) [Citation13]. The riboswitch comprises three co-axially stacked pairing regions (P1, P2 and P3) with a fourth (P4) flanking the P2-P3 interface. The three-helix junction binds preQ1 to complete P2-P3 coaxial helical stacking. Two nearby Mg2+ ions are shown as purple spheres. The co-crystal structure reveals that the pseudoknot buries the entire Shine-Dalgarno sequence (SDS). The SDS nucleotides are filled (yellow) and preQ1 is drawn as a CPK model (green). Pairing (P) and (J) junction regions are shown in distinct colors. (c) Secondary structure of the wild-type Lrh preQ1-II riboswitch construct used for this investigation based on the known crystal structure in b. The P1 helix is dispensable for effector sensing and was modified to hybridize with a biotinylated DNA oligonucleotide (inset box). The 3´-end comprises the wild-type sequence of the naturally occurring, downstream queT gene that is regulated by the riboswitch. The start codon (AUG) is highlighted. FRET (Dy547) and acceptor (Cy3) labels are depicted as green and red stars.
![Figure 1. Queuosine biosynthesis, the preQ1-II riboswitch structure and experimental construct for smFRET. (a) The queuosine (Q) base is a hypermodified base that is widespread in prokaryotes and eukaryotes. However, Q is only synthesized de novo in bacteria. Q production starts with GTP and proceeds by several enzymatic steps (arrow) to the last free intermediate preQ1 (7-aminomethyl-7-deazaguanine), which is then inserted into specific tRNAs followed by additional in situ modifications [Citation16]. (b) Ribbon diagram depicting the global HLout pseudoknot fold of the preQ1-II riboswitch from Lactobacillus rhamnosus (Lrh) (PDB entry 4jf2) [Citation13]. The riboswitch comprises three co-axially stacked pairing regions (P1, P2 and P3) with a fourth (P4) flanking the P2-P3 interface. The three-helix junction binds preQ1 to complete P2-P3 coaxial helical stacking. Two nearby Mg2+ ions are shown as purple spheres. The co-crystal structure reveals that the pseudoknot buries the entire Shine-Dalgarno sequence (SDS). The SDS nucleotides are filled (yellow) and preQ1 is drawn as a CPK model (green). Pairing (P) and (J) junction regions are shown in distinct colors. (c) Secondary structure of the wild-type Lrh preQ1-II riboswitch construct used for this investigation based on the known crystal structure in b. The P1 helix is dispensable for effector sensing and was modified to hybridize with a biotinylated DNA oligonucleotide (inset box). The 3´-end comprises the wild-type sequence of the naturally occurring, downstream queT gene that is regulated by the riboswitch. The start codon (AUG) is highlighted. FRET (Dy547) and acceptor (Cy3) labels are depicted as green and red stars.](/cms/asset/cf2b693c-e986-4185-aa25-990ae03ab1e5/krnb_a_1536591_f0001_oc.jpg)
At present, a number of X-ray crystal structures are known that reveal how elegant RNA folds recognize effectors in the context of transcriptional and translational riboswitches [Citation2]. However, there is a paucity of structural information for ligand-free riboswitch conformations [Citation10], and a dearth of molecular detail on effector-induced ‘switching’ between gene-activating and gene-repressive states of riboswitches. Here, we examined the dynamics of apo and effector-bound forms of the preQ1-II (class II) riboswitch from bacterium Lactobacillus rhamnosus (Lrh) using single-molecule Förster resonance energy transfer (smFRET) and total internal reflection (TIRF) microscopy. Our work demonstrates the stabilizing effect of Mg2+ ions and preQ1 upon riboswitch conformations that sequester the SD sequence within the core structure. Such effects can be interpreted in the context of the crystal structure, which reveals the molecular level details of Mg2+ and effector binding. Our data further reveal a complex folding landscape of the riboswitch and provide additional support for prior analysis that suggested effector binding entails conformational selection [Citation11].
PreQ1 is the last small-molecule intermediate on the metabolic pathway that produces the hypermodified base queuosine, which is incorporated at the wobble position of anti-codon stem-loops in certain tRNAs ()) [Citation16]. Three phylogenetically and structurally distinct classes of preQ1-binding riboswitches have emerged through evolution to regulate synthesis of queuosine [Citation3,Citation17]. Class II preQ1 riboswitches are ~ 80 nucleotides long and are found exclusively in the Firmicutes phylum, which includes the Lactobacillales [Citation17,Citation12]. These riboswitches fold as HLout pseudoknots that ‘sense’ preQ1 through bases in the J2-3 and J3-2 loops that position the ligand between pairing regions 2 (P2) and 3 (P3), forming a stable coaxial helical stack () [Citation13]. PreQ1-II riboswitches are posited to regulate translation initiation by sequestering the entire SD sequence into P3 of the pseudoknotted structure, wherein the floor of the preQ1 binding pocket is the first base of the SD sequence () [Citation13,Citation14].
To follow sequestration of the SD sequence into P3 during structural rearrangement of the Lrh preQ1-II riboswitch, we used FRET between a donor fluorophore (Dy547) attached to the 3´-end of an RNA transcript that extends 17 nucleotides downstream of the SD sequence and includes the start codon of the associated queT gene (). The acceptor fluorophore (Cy5) was introduced into the junction between P2 and P3 (J2-3). To label J2-3 with an acceptor fluorophore an adenine residue (position 33 using ) numbering) was replaced with aminoallyluridine. The A33 nucleotide is bulged into solution in the crystal structure and is distant from the binding pocket (). Hence, fluorophores were placed outside the core riboswitch fold and not expected to perturb preQ1 binding. To immobilize the riboswitch onto the microscope slide for smFRET measurements, a biotinylated DNA oligonucleotide complementary to one of the P1 strands was annealed to the RNA aptamer domain ().
The biotinylated DNA capture strand was 28 nucleotides long (5´- GGACTCGCCAACAACAACAACAACAACA-Biotin-3´). The riboswitch was comprised of two chemically synthesized strands (Dharmacon Inc.) joined by DNA splinted ligation using T4 RNA ligase II (NEB). The 5´-end harboring aminoallyl-U was: 5´-GGCGAGUCCACGACGAUACUU-(aminoallyl-U)-UUUCCUUUGAUC-3´. The 3´-end labeled strand was ordered with a 5´-phosphate for ligation; the sequence is: 5´-pGUCGUUAUUACUGGCAAAGCCACAAAGG-AGAAACAAUAUGUUCUACU-Dy547-3´. The ligated oligonucleotide was purified by denaturing PAGE [Citation15]. NHS-Cy5 (GE Healthcare) was conjugated to the aminoallyl-uridine residue of RNA according to standard procedures [Citation18]. Doubly-labeled RNA was purified using denaturing PAGE. 1 μM biotin-DNA oligo was annealed to 1 μM doubly-labeled riboswitch in 50 mM Hepes, pH 7.5 and 100 mM KCl by heating to 70 °C followed by incubation at 37 °C for 20 min. DNA-RNA aptamer was aliquoted and snap-frozen in liquid nitrogen.
Prism-based TIRF microscopy was used to measure fluorescence in individual riboswitch molecules as previously described [Citation19–Citation21]. An Olympus IX71 inverted microscope, equipped with a UPlanApo 60x/1.20w objective lens, and a 532 nm laser (Spectra-Physics) for excitation of Cy3 (Dy547) dyes was used. Fluorescence emission was split into Cy3 (Dy547) and Cy5 fluorescence using a dual view imaging system DV2 (Photometrics) equipped with a 630 nm dichroic mirror and recorded via an Andor iXon+ EMCCD camera.
The DNA-RNA riboswitch transcript was immobilized on quartz slides pre-treated with dichlorodimethylsilane (DDS)/Tween-20, BSA-biotin and neutravidin [Citation22]. The exposure time was set at 100 ms. Data acquisition was carried out at room temperature. Collected datasets were processed with IDL and Matlab, using scripts downloaded from a freely available source: http://ha.med.jhmi.edu/resources/#1464200861600-0fad9996-bfd4 [Citation19]. Apparent FRET efficiencies (Eapp) were calculated from the emission intensities of donor (ICy3) and acceptor (ICy5) as follows: Eapp = ICy5/[ICy5+ ICy3]. The FRET distribution histograms were built from traces that showed single-step disappearance for both Cy3 and Cy5 fluorescence intensities. Single-step disappearance of the acceptor signal, which was due to photobleaching, resulting in a reciprocal increase in donor fluorescence indicated the presence of an energy transfer before acceptor signal disappearance. All histograms were smoothed with a five-point window and fitted to Gaussian distributions using Origin software (Origin Lab Co). Fitting residuals were random. To determine rates of transitions between distinct FRET states, smFRET traces were fit using hidden Markov modeling (HMM) via HaMMy software [Citation23]. Idealized FRET traces obtained by HMM were examined using transition density plot (TDP) analysis [Citation23]. To construct TDPs, the range of FRET efficiencies from 0 to 1 was separated into 200 bins. The resulting TDP heat map was normalized to the most populated bin in the plot. The lower- and upper-bound thresholds were set to 10% and 100% of the most populated bin.
Riboswitch molecules imaged in the absence of Mg2+ ions and preQ1 exhibited ~ 0.35, 0.7 and 0.8 FRET values. These observations indicate that the apo form of the Lrh preQ1-II riboswitch adopts multiple conformations (). The 0.35 FRET state, which was observed in 54% of all recorded FRET frames, likely corresponds to the unfolded or partially folded conformation of the riboswitch, wherein the SD sequence is not base paired with the P3 (expression platform) region. As such, the SD sequence, J2-3, J2-4, J4-2, J3-2, and P4 regions that flank the binding pocket do not productively interact to compose the riboswitch core. By contrast, the 0.7 and 0.8 FRET states likely correspond to riboswitch conformations resulting from productive Watson Crick base pairing of the SD sequence to compose the P3 helix (e.g., ), thereby bringing the donor and acceptor fluorophores into close proximity to yield high FRET.
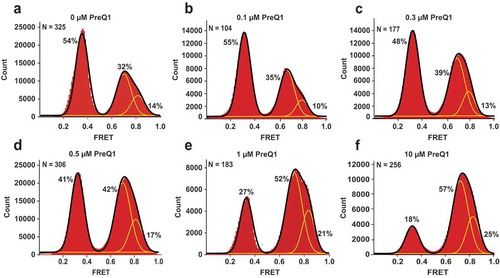
Figure 2. PreQ1 stabilizes preQ1-II riboswitch conformations that sequester the SD sequence into intramolecular core structure. Histograms compiled from hundreds of smFRET traces show the distribution of the FRET values for the riboswitch imaged in the absence of Mg2+. PreQ1 concentration was varied as follows: (a) no preQ1, (b) 0.1 μM, (c) 0.3 μM, (d) 0.5 μM, (e) 1.0 μM and (f) 10 μM. Yellow lines represent individual Gaussian fits; black lines indicate the sum of Gaussians. The fraction of the riboswitch in each FRET state derived from Gaussian fits is shown next to respective individual Gaussian peaks. N equals the number of single-molecule traces compiled.
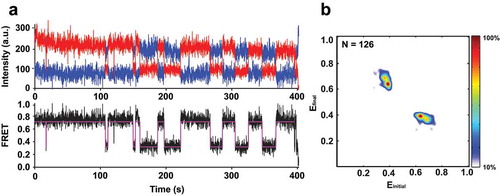
Hidden Markov Model (HHM) and Transition Density Plot (TDP) analyses showed that 43% of molecules fluctuated between the low (~ 0.35) and high (0.7) FRET states at a rate of ~ 0.1 s−1 for both low-to-high and high-to-low FRET transitions (). Hence, the aptamer domain can spontaneously sample both folded, closed and partially unfolded, open conformations. Notably, ~ 57% of molecules did not show apparent fluctuations and were observed in either the 0.35, 0.7 or 0.8 FRET states. The preQ1-III riboswitch from Faecalibacterium prausnitzii displayed a similar behavior, wherein both dynamic and static FRET states co-existed in the population with changes in response to added effector [Citation24].
Figure 3. Apo form of the preQ1-II riboswitch imaged in the absence of Mg2+ and preQ1 spontaneously fluctuates between low (~ 0.35) and high (~ 0.7) FRET states. (a) Representative smFRET trace showing fluctuations between the 0.35 and 0.7 FRET states. Observed intensities of donor and acceptor fluorescence and the calculated apparent FRET efficiency are shown in blue, red, and black, respectively. The Hidden Markov Model fit is shown in magenta. (b) Transition density plot (TDP) analysis of 1,277 fluctuations between different FRET states in 126 HMM-idealized FRET traces. The frequency of transitions from the starting FRET value (x axis) to the ending FRET value (y axis) is represented by a heat map. The range of FRET efficiencies from 0 to 1 was separated into 200 bins. The resulting heat map was normalized to the most populated bin in the plot; the lower- and upper-bound thresholds were set to 10% and 100% of the most populated bin.
We then asked how the addition of preQ1 influences riboswitch folding and dynamics. smFRET measurements performed in the absence of Mg2+ ions and in the presence of 0.1–10 μM preQ1 revealed decreases in the fraction of molecules showing the low (0.35) FRET state (from 54% at 0 µM preQ1 to 18% at 10 µM preQ1) with a reciprocal increase in the fraction displaying high (0.70 and 0.8) FRET states (from 46% at 0 µM preQ1 to 82% at 10 µM preQ1) (). Analysis of the fraction of the riboswitch observed in the 0.7 FRET state as a function of preQ1 concentration showed that the half-maximal effective concentration (EC50) of preQ1 required for high-FRET folding is 0.7 μM (). This value is relatively close to the ~ 300 nM apparent equilibrium dissociation constant of preQ1 binding to the Lrh preQ1-II riboswitch determined in the absence of Mg2+ [Citation13]. Therefore, consistent with the hypothesis that preQ1 downregulates translation initiation, preQ1 stabilizes compact conformations of the riboswitch, wherein the SD sequence is sequestered into the core fold (). Interestingly, addition of preQ1 did not significantly affect rates of fluctuations between high and low FRET states in riboswitch molecules that remained dynamic. Therefore, fluctuating molecules likely correspond to the apo form of the riboswitch.
Figure 4. The Lrh preQ1-II riboswitch senses the preQ1 concentration to yield a compact fold. The fraction of the riboswitch in a compact conformation, determined by the area under the 0.7 FRET peak in , was plotted as a function of preQ1 concentration and fitted to a hyperbola (red line; y = A*[preQ1]/(EC50+[preQ1])+ B, where EC50 is the half maximal effective concentration of preQ1 and B is the fraction of 0.7 FRET observed in the absence of preQ1).
![Figure 4. The Lrh preQ1-II riboswitch senses the preQ1 concentration to yield a compact fold. The fraction of the riboswitch in a compact conformation, determined by the area under the 0.7 FRET peak in Fig (2a-f), was plotted as a function of preQ1 concentration and fitted to a hyperbola (red line; y = A*[preQ1]/(EC50+[preQ1])+ B, where EC50 is the half maximal effective concentration of preQ1 and B is the fraction of 0.7 FRET observed in the absence of preQ1).](/cms/asset/a8ba60b8-5b01-4439-b141-1916bdb555d3/krnb_a_1536591_f0004_oc.jpg)
In addition to monovalent cations, free (unbound) Mg2+ ions are also present in living cells at 0.5 −1 mM concentrations [Citation1] and were previously shown to stabilize the effector-bound conformation of riboswitches [Citation11,Citation13,Citation24,Citation25]. To test the effect of Mg2+ ions on preQ1 riboswitch dynamics, smFRET was measured in the absence of preQ1 and in the presence of 0.5 mM Mg2+. Addition of Mg2+ ions significantly elevated the fraction 0.8 FRET in smFRET traces from 14% (in the absence of Mg2+) to 50% (in the presence of 0.5 mM Mg2+) (). The crystal structure of the Lrh preQ1-II riboswitch reveals two Mg2+ ions coordinated in the core of the aptamer domain that make inner sphere contacts with the non-bridging oxygens of U41 and G42, which line the binding pocket. These ions make key contacts within the P2-P3-P4 helical junction that appear to promote a stable and compact RNA core ()). This observation is supported by our results, which indicate that Mg2+ ions strongly stabilize the folded conformation of the riboswitch. In addition, the presence of Mg2+ ions resulted in the appearance of a 0.5 FRET state in a small number molecules (6% of all FRET frames) (), Suppl. ). The 0.5 FRET state likely indicates the compaction of the SD sequence, J3-4, P4 and J2-4 regions of the aptamer domain in the open conformation, in which the SD sequence does not form base paring interactions within the P3 region.
Figure 5. Mg2+ stabilizes Lrh preQ1-II riboswitch conformations that sequester the SD sequence into intramolecular core structure. Histograms compiled from hundreds of smFRET traces show the distribution of the FRET values for the riboswitch imaged in the presence of 0.5 mM Mg2+ (a-b) or 6 mM Mg2+(c-d). Measurements were taken either in the absence (a,c) or the presence of 1 μM preQ1 (b,d). Yellow lines represent individual Gaussian fits; black lines indicate the sum of Gaussians. The fraction of the riboswitch in each FRET state derived from Gaussian fits is shown next to respective individual Gaussian peaks. N equals the number of single-molecule traces compiled.
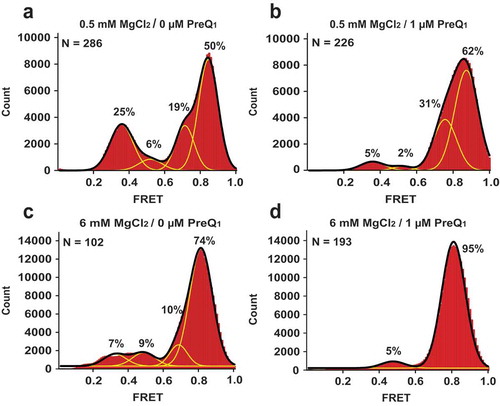
When 1 μM preQ1 was added to the Lrh riboswitch in the presence of 0.5 mM Mg2+, the fraction of molecules exhibiting 0.35 FRET state decreased 5-fold from 25% (in the absence of preQ1) to 5% (in the presence of preQ1) (). 1 μM concentration of preQ1 is ~ 10-fold higher than the KD, App of ~ 75 nM determined for a 3´-extended Lrh preQ1-II riboswitch in the presence of Mg2+ ions [Citation13]. In the presence of preQ1, the fraction of molecules in the 0.5 FRET state decreased from 6 to 2%. By contrast, the fractions of molecules in 0.7 and 0.8 FRET states showed increases to 31% and 62% (). These results imply that preQ1 binding to the riboswitch significantly decreases availability of the SD sequence for interactions with the ribosome by stabilizing the closed, folded conformations of the riboswitch core corresponding to compact 0.7 and 0.8 FRET states.
Our prior X-ray crystallographic structure determination of the Lrh preQ1-II riboswitch was conducted in high Mg2+ [Citation13]. However, our accompanying ITC analysis of preQ1 binding indicated no appreciable improvement in effector binding at Mg2+ concentrations greater than 6 mM. As such, we next examined riboswitch dynamics via smFRET measurements under comparable ionic conditions. In the absence of preQ1 and the presence of 6 mM Mg2+, the Lrh preQ1-II riboswitch adopted predominately closed, folded conformations in which 10% and 74% of FRET frames exhibited 0.7 and 0.8 FRET (). Addition of 1 μM preQ1 increased the fraction of molecules in the 0.8 FRET state to 95% while molecules showing 0.35 FRET essentially disappeared (). These results suggest that relatively high Mg2+ concentrations stabilize folded, effector-bound conformations of riboswitches that likely favor a level of homogeneity in the population ensemble that was required for the crystallographic structure determination. However, our results also show that in the presence of high Mg2+ concentrations, structural dynamics and physiologically-relevant effector-dependent ‘switching’ of the Lrh riboswitch may be suppressed and barely observable. Therefore, our results underscore the importance of using concentrations of Mg2+ ions in studies of riboswitches that are similar to intracellular concentrations (0.5–5 mM) of unbound (free) Mg2+ [Citation1,Citation26,Citation27].
We next considered the source of the 0.7 and 0.8 high FRET states that are stabilized by preQ1. Initially, we considered whether a short hairpin might form that comprises the 3´-extended tail from A77 to U93. Our rationale was that such a fold could yield a more compact conformation that results in the transition from 0.7 to 0.8 FRET. However, this three basepair hairpin forms only at a 50% pair probability threshold in RNAstructure [Citation28], suggesting instability and transience in solution. Also incongruous with this idea, the 0.8 FRET state is stabilized by preQ1 whereas the sequence of the posited hairpin was not observed to undergo preQ1-dependent modulation in chemical modification experiments of the Lrh riboswitch in live bacteria [Citation29].
Prior independent studies of the Lrh preQ1-II riboswitch support our observation of two conformations that could correspond to the high FRET states (0.7 and 0.8). Specifically, HNN COSY experiments revealed two conformations of the A72-U39 base pair () under conditions that promote folding (i.e., 1 mM Mg2+ or 1 mM Mg2+ plus 1 mM preQ1) [Citation30]. Although the underlying molecular basis of these conformations is unclear, these conformations could be attributable to equilibrium formation of the U31•A71-U40 and U32•A72-U39 major-groove base triples that flank the nearby binding pocket, which comprises the C30•preQ1•U41 triplex. Indeed, we observe the coalescence of the high FRET states into a single state (0.8) under strong folding conditions of 6 mM Mg2+ plus 1 μM preQ1 ()), which is consistent with major-groove triple formation between J2-3 and P3.
Interestingly, prior smFRET analysis of a related Streptococcus pneumoniae preQ1-II riboswitch did not reveal clear evidence of two high-FRET states [Citation11]. A number of factors could influence this difference. First, the FRET labels of the latter study were placed closer together at A33 and A77, whereas our work placed them much farther apart at A33 and U93 – representing a 16 nt extension in length that includes three codons. Second, the S. pneumoniae preQ1-II riboswitch also harbors a strong G-C pair in the ceiling of the effector pocket, whereas the Lrh preQ1-II riboswitch of our study – and that of Neuner and co-workers [Citation30] – possesses a non-canonical A29-G42 pair that that is known to increase flexibility in the bound state [Citation29], possibly causing heterogeneity in the underlying P3 fold. Finally, we note that differences in riboswitch conformational states within molecules of the same class have been observed in prior smFRET analyses [Citation31].
Molecular recognition and allosteric regulation of macromolecular structure are often described in terms of two alternative models: ‘induced fit’ and ‘lock and key’ (conformational selection) [Citation32]. The induced fit model suggests that the formation of the ligand-bound conformation of a macromolecule is driven by the binding interactions. By contrast, the conformational selection model assumes that the free and bound configurations of macromolecules pre-exist in a dynamic ensemble of structures wherein the preformed bound conformation selectively binds ligand. Our smFRET experiments demonstrate that the apo form of the preQ1-II riboswitch spontaneously samples conformations corresponding to 0.7–0.8 FRET states that are stabilized by preQ1 binding. Hence, our data support the concept that compact (effector-bound-like) conformations pre-exist in the ensemble of riboswitch structures in the absence of effector. This finding appears to support the conformational selection model of molecular recognition by class II preQ1 riboswitches. This result notably differs from the much smaller, translational preQ1-I riboswitch, which uses an induced fit mode of preQ1 sensing [Citation31,Citation33]. Importantly, conformational selection and induced-fit modes of ligand binding are not necessarily mutually exclusive, and our data do rule out the presence of induced-fit characteristics in the mode of effector recognition by the preQ1-II riboswitch.
Supplemental Material
Download MS Word (458.8 KB)Disclosure statement
No potential conflict of interest was reported by the authors.
Supplementary material
Supplementary data can be accessed here.
Additional information
Funding
Related Research Data
References
- Wedekind JE, Dutta D, Belashov IA, et al. Metalloriboswitches: RNA-based inorganic ion sensors that regulate genes. J Biol Chem. 2017;292:9441–9450.
- McCown PJ, Corbino KA, Stav S, et al. Riboswitch diversity and distribution. RNA. 2017;23:995–1011.
- Belashov IA, Dutta D, Salim M, et al. Tails of three knotty switches: how preQ1 riboswitch structures control protein translation. eLife Sci. 2015. DOI:10.1002/9780470015902.a0021031
- Breaker RR. Riboswitches and the RNA world. Cold Spring Harb Perspect Biol. 2012;4:a003566.
- Sherwood AV, Henkin TM. Riboswitch-mediated gene regulation: novel RNA architectures dictate gene expression responses. Annu Rev Microbiol. 2016;70:361–374.
- Roth A, Breaker RR. The structural and functional diversity of metabolite-binding riboswitches. Annu Rev Biochem. 2009;78:305–334.
- Garst AD, Batey RT. A switch in time: detailing the life of a riboswitch. Biochim Biophys Acta. 2009;1789:584–591.
- Serganov A, Nudler E. A decade of riboswitches. Cell. 2013;152:17–24.
- Fuchs RT, Grundy FJ, Henkin TM. S-adenosylmethionine directly inhibits binding of 30S ribosomal subunits to the SMK box translational riboswitch RNA. Proc Natl Acad Sci U S A. 2007;104:4876–4880.
- Liberman JA, Wedekind JE. Riboswitch structure in the ligand-free state. Wiley Interdiscip Rev RNA. 2012;3:369–384.
- Souliere MF, Altman RB, Schwarz V, et al. Tuning a riboswitch response through structural extension of a pseudoknot. Proc Natl Acad Sci U S A. 2013;110:E3256–E64.
- Meyer MM, Roth A, Chervin SM, et al. Confirmation of a second natural preQ1 aptamer class in Streptococcaceae bacteria. RNA. 2008;14:685–695.
- Liberman JA, Salim M, Krucinska J, et al. Structure of a class II preQ1 riboswitch reveals ligand recognition by a new fold. Nat Chem Biol. 2013;9:353–355.
- Aytenfisu AH, Liberman JA, Wedekind JE, et al. Molecular mechanism for preQ1-II riboswitch function revealed by molecular dynamics. RNA. 2015;21:1898–1907.
- Lippa GM, Liberman JA, Jenkins JL, et al. Crystallographic analysis of small ribozymes and riboswitches. Methods Mol Biol. 2012;848:159–184.
- McCarty RM, Bandarian V. Biosynthesis of pyrrolopyrimidines. Bioorg Chem. 2012;43:15–25.
- McCown PJ, Liang JJ, Weinberg Z, et al. Structural, functional, and taxonomic diversity of three preQ1 riboswitch classes. Chem Biol. 2014;21:880–889.
- Akiyama BM, Stone MD. Assembly of complex RNAs by splinted ligation. Methods Enzymol. 2009;469:27–46.
- Roy R, Hohng S, Ha T. A practical guide to single-molecule FRET. Nat Methods. 2008;5:507–516.
- Cornish PV, Ermolenko DN, Noller HF, et al. Spontaneous intersubunit rotation in single ribosomes. Mol Cell. 2008;30:578–588.
- Salsi E, Farah E, Dann J, et al. Following movement of domain IV of elongation factor G during ribosomal translocation. Proc Natl Acad Sci U S A. 2014;111:15060–15065.
- Hua B, Han KY, Zhou R, et al. An improved surface passivation method for single-molecule studies. Nat Methods. 2014;11:1233–1236.
- McKinney SA, Joo C, Ha T. Analysis of single-molecule FRET trajectories using hidden Markov modeling. Biophys J. 2006;91:1941–1951.
- Liberman JA, Suddala KC, Aytenfisu A, et al. Structural analysis of a class III preQ1 riboswitch reveals an aptamer distant from a ribosome-binding site regulated by fast dynamics. Proc Natl Acad Sci U S A. 2015;112:E3485–E94.
- Haller A, Rieder U, Aigner M, et al. Conformational capture of the SAM-II riboswitch. Nat Chem Biol. 2011;7:393–400.
- Alatossava T, Jutte H, Kuhn A, et al. Manipulation of intracellular magnesium content in polymyxin B nonapeptide-sensitized Escherichia coli by ionophore A23187. J Bacteriol. 1985;162:413–419.
- Romani AM. Cellular magnesium homeostasis. Arch Biochem Biophys. 2011;512:1–23.
- Reuter JS, Mathews DH. RNAstructure: software for RNA secondary structure prediction and analysis. BMC Bioinformatics. 2010;11:129.
- Dutta D, Belashov IA, Wedekind JE. Coupling green fluorescent protein expression with chemical modification to probe functionally relevant riboswitch conformations in live bacteria. Biochemistry. 2018;57:4620–4628.
- Neuner S, Santner T, Kreutz C, et al. The “Speedy” Synthesis of Atom-Specific (15)N Imino/Amido-Labeled RNA. Chemistry. 2015;21:11634–11643.
- Suddala KC, Rinaldi AJ, Feng J, et al. Single transcriptional and translational preQ1 riboswitches adopt similar pre-folded ensembles that follow distinct folding pathways into the same ligand-bound structure. Nucleic Acids Res. 2013;41:10462–10475.
- Boehr DD, Nussinov R, Wright PE. The role of dynamic conformational ensembles in biomolecular recognition. Nat Chem Biol. 2009;5:789–796.
- Frener M, Micura R. Conformational rearrangements of individual nucleotides during RNA-ligand binding are rate-differentiated. J Am Chem Soc. 2016;138:3627–3630.