
 ?Mathematical formulae have been encoded as MathML and are displayed in this HTML version using MathJax in order to improve their display. Uncheck the box to turn MathJax off. This feature requires Javascript. Click on a formula to zoom.
ABSTRACT
From biogenesis to degradation, mRNA goes through diverse types of regulation and interaction with other biomolecules. Uneven distribution of mRNA transcripts and the diverse isoforms and modifications of mRNA make us wonder how cells manage the complexity and keep the functional integrity for the normal development of cells and organisms. Single-molecule microscopy tools have expanded the scope of RNA research with unprecedented spatiotemporal resolution. In this review, we highlight the recent progress in the methods for labeling mRNA targets and analyzing the quantitative information from fluorescence images of single mRNA molecules. In particular, the MS2 system and its various applications are the main focus of this article. We also review how recent studies have addressed biological questions related to the significance of mRNA localization in vivo. Efforts to visualize the dynamics of single mRNA molecules in live cells will push forward our knowledge on the nature of heterogeneity in RNA sequence, structure, and distribution as well as their molecular function and coordinated interaction with RNA binding proteins.
Introduction
Single-molecule fluorescence microscopy has provided quantitative insights into fundamental biological questions by breaking the barriers of in vivo complexity and crowdedness. Traditional methods of biochemical and genetic approaches have provided ensemble average data of many mRNA molecules without considering the heterogeneity in the population. The information in an mRNA transcript has been regarded as rather stably conserved along the path from synthesis to degradation. This deterministic view is now challenged by recent data obtained with new single-cell single-molecule technologies revealing the unexpected extent of diversity in RNA species in their sequence and behavior [Citation1]. Among them, fluorescence microscopy tools and analysis techniques have played a major role in understanding the complexity of RNA regulation since fluorescence in situ hybridization (FISH) was first introduced more than 30 years ago [Citation2].
Direct visualization of mRNA by in situ hybridization led to the discovery of actin mRNA localization in Ascidian eggs and embryos [Citation3] and chicken embryonic fibroblasts (CEFs) [Citation4]. RNA localization is currently accepted as a prevalent phenomenon broadly found in the transcriptome of many cell types and organisms [Citation5]. The post-transcriptional transport and localization of mRNA provide an important mechanism to target proteins to specific subcellular compartments of their function. Localized mRNAs may be translated repeatedly to produce many copies of the protein in response to local stimuli, which provides an effective means to regulate gene expression with high spatial and temporal control.
In this review, we discuss the recent progress in fluorescence techniques used for single RNA studies and highlight some of the new findings in biological processes related to mRNA localization. Technical developments in (1) fluorescent labeling of RNA, (2) imaging and spectroscopy, and (3) data analysis tools are reviewed, focusing on the applications in mammalian cells in vivo using the MS2 system. Finally, we present an overview of how cutting-edge single-molecule technologies have been adopted to follow the journey of mRNA with multiple steps of regulations and interactions with proteins and other RNA species.
Labeling methods for single mRNA imaging in vivo
Molecular beacons
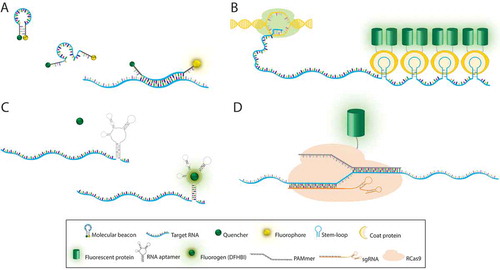
Among a variety of oligonucleotide-based fluorescent probes, the molecular beacon (MB) technique uses a single-stranded stem-loop forming oligonucleotide that bears a fluorophore and a quencher at the two termini. An MB has a relatively high signal-to-noise ratio (SNR) due to the significant quenching of the fluorophore in the absence of the target RNA. Only when the MB hybridizes to the target RNA transcript, the stem-loop configuration is disrupted to restore the fluorescence ()). The benefits of the MB approach include small probe size, rapid response, and versatility in fluorophore/quencher pairs. Since it was first conceptualized by Tyagi and Kramer in 1996 [Citation6], MBs have been a useful tool to study various RNA molecules including mRNA, viral RNA, and noncoding RNA in living cells [Citation7,Citation8].
Figure 1. Labeling methods for mRNA imaging in vivo. (A) Molecular beacon is a single-stranded probe with hairpin-loop conformation containing a quencher and a fluorophore at 3´ and 5´ ends, respectively. Hybridization of the loop sequence to its complementary RNA sequence leads to emission of fluorescence. (B) In RNA stem-loop based labeling systems, multiple repeats of a stem-loop sequence are added to the gene of interest. Following transcription, coat proteins fused with a fluorescent protein bind to the stem-loops in the target RNA. (C) RNA aptamer probes are typically inserted into the 3′UTR of the target RNA. Binding of fluorogen (DFHBI) to the RNA aptamer triggers fluorescence emission. (D) RNA-targeting Cas9 (RCas9) system includes sgRNA and PAMmer that are both complementary to the target RNA. Nuclease-inactive Cas9 fused to a fluorescence protein enables tracking of endogenous RNA. RCas9/target RNA complex is formed in the nucleus and then exported to the cytoplasm.
Conventional MBs are usually synthesized with unmodified DNA or 2′-O-methyl (2Me) RNA backbones, but they tend to generate false-positive signals in the nucleus because of nuclease-mediated degradation and/or nonspecific binding to cellular components. Nonetheless, single-molecule sensitivity by an MB was first demonstrated by using a target RNA engineered to have 96 tandem repeats each of which binds a 2Me MB probe [Citation9]. Ratiometric bimolecular beacons (RBMBs), which contain an 18-base pair double-stranded domain with a 3′-UU overhang and an unquenched reference dye, were also used to image individual reporter mRNAs having as few as four repeats in the hybridization site [Citation10]. The reference dye was used to normalize the fluorescence signal stemming from cell-to-cell variations in the RBMB delivery. And the unique structure of RBMB facilitated nuclear export, which significantly reduced false-positive signals in the nucleus.
Another strategy to reduce the level of false-positive signals is to modify the oligonucleotide backbone of MBs for enhanced biostability. Zhao et al.optimized the backbone by substituting some of the phosphate groups of the 2Me MB with phosphorothioate (PS) linkage. They found that MBs that possess a fully PS-modified loop domain (PSLOOP) and a phosphodiester stem (2Me/PSLOOP) were best fitted for live-cell imaging of single mRNA transcripts. Single mRNA transcripts harboring 32 repeated hybridization sites for a 2Me/PSLOOP MB were detected with > 88% accuracy without affecting cell viability, gene expression, and function [Citation11]. To minimize the target engineering necessary for MB-based single mRNA imaging, Chen et al. demonstrated that an RNA with 8 target repeats could be also detected by using a 2Me/PSLOOP MB [Citation12]. Although MB-based single-RNA detection has been limited to reporter RNA constructs to date, it is a promising technique further to be developed for live-cell, single-molecule imaging of endogenous RNA molecules in the future.
RNA stem-loop systems
RNA stem-loop based labeling systems are widely used genetically-encoded tools for high-resolution imaging of single mRNAs in cells, tissues, and animals. The pioneering technique of the MS2 system takes advantage of the MS2 bacteriophage RNA stem-loop and its cognate coat protein binding [Citation13,Citation14]. Multiple repeats of the RNA stem-loop sequence are inserted into the untranslated region of the target mRNA and the coat protein fused to a fluorescent protein (CP-FP) is co-expressed in the same cell. This approach amplifies the fluorescence signal to localize single mRNA molecules ()). Similarly, the PP7 bacteriophage system and the λ-phage N system have also been adopted for RNA labeling and detection [Citation15–Citation17]. These RNA stem-loop labeling systems have been used to detect single mRNAs in diverse model organisms including yeasts, fruit flies, zebrafish, mice, and human cell lines revealing the dynamics of mRNA and noncoding RNAs. The development of genetically-encoded tagging systems has been extended to study whole transgenic animals thereby providing insight into the physiological dynamics and function of endogenous mRNA expression within tissue context [Citation18–Citation20].
However, the RNA stem-loop systems introduce constant background fluorescence from free CP-FPs. To reduce the cytoplasmic background, a nuclear localization sequence (NLS) has been added to the MS2 coat protein (MCP) sequestering the unbound MCP-FPs in the nucleus [Citation21]. Although this method enables single RNA tracking in the cytoplasm, it is not proper for imaging RNA within the nucleus. To overcome these limitations, bimolecular fluorescence complementation (BiFC) systems have been adopted to reduce the background noise as split fluorescent protein fragments are combined and become fluorescent only when bound to the target mRNA [Citation22–Citation27]. A pioneering work by Ozawa et al. used two RNA-binding domains of PUMILIO1 connected to N- and C-terminal fragments of enhanced green fluorescent protein (EGFP) [Citation23]. Two different Pumilio homology domains (PUM-HDs) were engineered to recognize two specific sequences in a target mRNA. Upon interacting with the target mRNA, the PUM-HDs bring the split EGFP fragments in close proximity and restore the fluorescence. Using this approach, the authors successfully visualized the dynamics of mitochondrial RNA in single living mammalian cells.
Other concerns arise from the high affinity of the MS2 binding site (MBS)-MCP complex that can potentially impede the degradation of short-lived mRNAs and lead to the accumulation of MBS-MCP fragments in P-bodies or stress granules in Saccharomyces cerevisiae [Citation28–Citation31]. Because these problems can confound the sensitivity and accuracy of single RNA imaging, an updated version called MBSV6 was engineered so as to contain an increased linker length, a reduced number of stem-loops, and a reduced affinity for MCP binding. When applied to Saccharomyces cerevisiae, the MBSV6 cassette preserved the endogenous degradation pattern of the target mRNA and did not show either MCP aggregates or mRNA accumulation to the P-bodies during stress [Citation31]. It is also important to note that the accumulation of MBS-MCP fragments has been observed only in yeasts. The MS2 stem-loop containing reporters in mammalian systems have not been shown to be impeded in their degradation. The continuous improvements in RNA stem-loop labeling systems will bring about higher sensitivity and accuracy for direct observation and quantification of mRNA in real time. Diverse applications of the MS2 and PP7 stem-loop systems are further described in the following sections of this review.
Aptamer-fluorogen systems
The concept of an aptamer-fluorogen system was first introduced in 2003, in which binding of 38–54 nucleotide (nt) RNA aptamers was shown to enhance the fluorescence of specific triphenylmethane dyes up to 2300-fold [Citation32]. Later in 2011, Paige et al. demonstrated that an RNA aptamer called Spinach selectively recognizes an EGFP-like fluorophore, 3,5-difluoro-4-hydroxybenzylidene imidazolinone (DFHBI) and activates its fluorescence in live cells ()) [Citation33]. Since then, RNA aptamer-fluorogen systems have drawn significant interest as a powerful tool for visualizing RNA molecules within a live cell.
Studies on three-dimensional structures and biochemical characterization of Spinach have guided the development of new aptamers with improved properties. Spinach2, a superfolding variant of Spinach, was developed by systematic mutagenesis; it showed twice better folding efficiency in vitro than Spinach with increased brightness at 37ºC [Citation34]. Another variant called Broccoli was selected by using fluorescence-activated cell sorting (FACS) and showed even higher fluorescence than Spinach2 [Citation35]. The crystal structures of Spinach [Citation36,Citation37] were used to generate Baby Spinach, which is a truncated 51-nt aptamer with fluorescence comparable to that of Spinach [Citation37]. These RNA aptamers are typically fused to the 3′ end of the target RNA, which requires either transfection of an exogenous reporter or insertion of the aptamer sequence in the genome.
To detect endogenous RNA, two types of aptamer systems have been developed. A fluorescence ‘turn-on’ RNA probe was designed to contain an unstable form of Spinach fused with target-complementary sequences. The structure of Spinach is stabilized when the probe binds to the target RNA, eliciting fluorescence from DFHBI only in the presence of the target [Citation38]. The other type uses split forms of RNA aptamers; two fragments of Split-Broccoli were fused with complementary sequences to recognize the target RNA. When both fragments of Split-Broccoli are bound to the target RNA, they form a fluorophore-binding site and turn on the fluorescence [Citation39].
To further increase the brightness, tandem Spinach array (8–64 aptamer repeats) was generated, showing ~17-fold enhanced fluorescence [Citation40]. However, the average folding efficiency of each aptamer decreased with the increase of the repeat number in the tandem Spinach array. Single RNA imaging in vitro was demonstrated by using the RNA Mango aptamer, which binds thiazole orange (TO) fluorophores and increases the fluorescence up to 1,1000-fold [Citation41]. Autour et al. used microfluidics-based selection to develop brighter RNA Mango aptamers and demonstrated live-cell imaging of small non-coding RNAs by transfecting in vitro-transcribed RNAs after pre-incubating it with TO dye [Citation42]. Further optimization of the tandem arrays and the development of new aptamer-fluorogen pairs may enable aptamer-based single RNA imaging in live cells in the future.
RNA-targeting CRISPR approaches
CRISPR/Cas systems have revolutionized the field of genome engineering over the last few years. Cas9 from the type II CRISPR system of Streptococcus pyogenes is proven as a versatile tool for DNA targeting and editing, and its potential is further extended towards RNA targeting [Citation43] and imaging in live cells [Citation44]. The RNA-targeting Cas9 (RCas9) system consists of three components, catalytically inactivate variant of Cas9 (dCas9), a protospacer adjacent motif (PAM)-presenting oligonucleotide (PAMmer), and a single-guide RNA (sgRNA) ()). For programmable RNA detection, dCas9 was fused to a fluorescent protein (FP) with a nuclear localization sequence and the PAMmer was synthesized as a mixed form of DNA and 2Me RNA oligonucleotide to prevent RNase-H-mediated degradation. And a modified sgRNA scaffold was used to improve its expression and association with dCas9 [Citation45]. These features with a mismatched PAM sequence in the PAMmer/RNA hybrid enabled the specific recognition of the target RNA while minimizing the binding to the encoding DNA. The RCas9 system enabled the imaging of β-actin mRNA localization and trafficking to stress granules in live cells [Citation44].
More recently, CRISPR/Cas13 systems have emerged as a platform for RNA targeting [Citation46]. Four Cas13 proteins (Cas13a, Cas13b, Cas13c, and Cas13d) are found in class 2 type VI CRISPR/Cas systems [Citation47–Citation50]. For instance, Cas13a from Leptotrichia wadei (LwaCas13a) was used to target and knockdown endogenous transcripts with a comparable level by RNA interference but with better specificity [Citation51]. Furthermore, a catalytically inactive variant of the LwaCas13a (dLwaCas13a) was fused with a monomeric superfolder GFP (msfGFP) for RNA imaging. To reduce the background signal from unbound dLwaCas13a proteins, Abudayyeh et al.incorporated a negative feedback (NF) system based on zinc finger self-targeting and KRAB domain repression. The dLwaCas13a-NF system enabled the detection of β-actin mRNA accumulation in stress granules over time in live cells [Citation51].
Although Cas13b and Cas13d have not been used for RNA imaging yet, they also have great potential for programmable RNA imaging in vivo. The Cas13b ortholog from Prevotella sp. P5-125 (PspCas13b) exhibits a higher efficiency in RNA knockdown activity compared with that of LwaCas13a [Citation52]. Cox et al. also demonstrated RNA editing by using the catalytically inactive dPspCas13b fused to adenosine deaminase acting on RNA type 2 (ADAR2). Cas13d proteins are 190–300 amino acid (aa) smaller than Cas13a, b, and c orthologs [Citation49,Citation50]. Therefore, Cas13d can be packaged into adeno-associated virus [Citation49].
CRISPR/Cas systems are advantageous for endogenous mRNA imaging because they do not require affinity tag fusion to the target RNA. Especially, Cas13 systems consist of only two components, the Cas13 protein and CRISPR RNA (crRNA) and do not require a specific sequence element like PAM in the target site. Therefore, Cas13 can be programmed to target any RNA by changing the crRNA spacer sequence. Although single RNA imaging using CRISPR/Cas system has not been demonstrated yet, one can imagine a multitude of applications for direct transcript detection, analysis and manipulation [Citation46,Citation53].
Fluorescence imaging and spectroscopy for single RNA studies
Single-molecule localization microscopy (SMLM)
SMLM techniques have been adopted to localize single RNA molecules with high spatial resolution and to understand their interactions with various RNA binding proteins (RBPs). For instance, a super registration method was developed to quantify RNA-protein interactions with sub-diffraction resolution. Eliscovich et al. used fluorescent beads to calibrate the chromatic aberration across the entire image field for a dual-color localization precision of 10 nm. Applying a threshold of 200 nm, a real physical interaction or simple proximity by random chance was distinguished considering the local molecular density within the cells. Using this method, the authors found that many known RBPs from pulldown assays did not bind the mRNA in situ, and suggested that imaging methods are essential to complement traditional biochemical studies [Citation54]. Similarly, the stress granule transcriptome was identified through RNA-sequencing analysis of purified stress granule cores and validated by single-molecule fluorescence in situ hybridization (smFISH) [Citation55].
Since movement of RNA granules is also important for the spatiotemporal regulation of gene expression, tagged RNAs are tracked, and their movements are further reconstructed in a 3-dimensional (3D) space. For example, single-point edge-excitation sub-diffraction (SPEED) microscopy was applied to follow messenger ribonucleoprotein (mRNP) movement through the nuclear pore complex (NPC) of eukaryotic cells. The kinetics and the 3D transport paths of a single mRNP through the NPCs were measured in live human cells with a spatiotemporal resolution of 8 nm and 2 ms [Citation56]. The detection time resolution was 10 times improved compared to that of the previous measurements [Citation57–Citation59], which facilitated analyzes of the highly transient interactions.
Multifocus microscopy (MFM) was also applied to capture 3D trajectories of single RNA molecules in real time. Using MFM, a 3D volume can be simultaneously imaged by projecting multiple focal planes on a single image plane. Then the recorded images are transformed to well-aligned z-stacks. The authors also developed a transformation model to correct sample-induced aberrations and chromatic differences for global registration of images with a half-pixel precision. Using this technique, β-actin mRNA diffusion in the entire volume of the nucleus was measured with an 80 nm precision. The authors found that β-actin mRNAs freely access the entire nuclear space but show uneven distributions. A major portion of β-actin mRNAs (~60%) were observed within 0.5 μm of the nuclear pores [Citation60].
The aforementioned techniques are just a few examples of numerous microscopy approaches used for single RNA imaging [Citation1,Citation61]. Continuous advances in optics, detectors, and data analysis are expected to provide longer acquisition times with higher spatiotemporal resolution for single RNA imaging.
Fluorescence fluctuation spectroscopy (FFS)
Within a cell, mRNA transcripts actively move and interact with RBPs leading to fluctuations of fluorescence signals. Observing and analyzing this fluctuation signal can provide dynamic information on the mRNAs. Fluorescence correlation spectroscopy (FCS) [Citation62] measures the diffusion coefficient and local concentration of molecules by using autocorrelation of the fluorescent particles moving into and out of a small observation volume (~1 μm3). For FCS, photons emitted from fluorophores are commonly detected by an avalanche photodiode (APD) with a short dead time and high quantum efficiency. The signal from the APD is processed by a hardware or software correlator to generate an autocorrelation curve [Citation63]. The autocorrelation function of simple diffusion model is as follows:
where is the fluorescence intensity at time t; <
> is the time average of
;
is the correlation time or lag time;
is the fluorescence intensity fluctuation; N is the average number of molecules in the focal volume;
is a characteristic diffusion time, and S is the ratio of the axial to radial dimensions of the mean square excitation intensity of the focal volume [Citation64]. When FCS is performed in live cells, background from free fluorophores, intracellular autofluorescence, photodamage, etc. can produce artifacts in the analysis [Citation65]. Therefore, experiments should be conducted with the appropriate intensity of laser power so that the cells are not photodamaged and the fluorophores do not get photobleached. The brightness of the autofluorescence should be measured at different wavelengths and considered in the analysis.
To study the interactions of two different particles, fluorescence cross-correlation spectroscopy (FCCS) is used to quantify the degree of binding, for example, between mRNAs and proteins. The interacting molecules are tagged with spectrally distinguishable fluorophores, and their fluorescence signals of different colors are detected by two APDs. The cross-correlation function is calculated as follows:
where and
are fluorescence signals from two different particles. If the two particles are binding to each other, both signals will come out at the same time and the correlation amplitude
will increase. The degree of binding or colocalization between the two fluorescent particles can be measured using the cross-correlation amplitude [Citation66].
Ohrt et al. applied FCS and FCCS to understand the mechanism by which the RNA-induced silencing complex (RISC) is formed in live cells. The authors transfected mammalian cells with Argonaute 2 (Ago2) protein fused with EGFP and microinjected siRNAs tagged with Cy5 dye. Using FCS on EGFP-Ago2, they found that the diffusion coefficient of cytoplasmic RISC (cRISC) was smaller (5.4 ± 0.2 μm2/s) than that of nuclear RISC (nRISC) (13.7 ± 0.5 μm2/s). These diffusion coefficients correspond to a molecular weight of 3.0 ± 0.6 MDa for cRISC and 158 ± 26 kDa for nRISC, indicating that two distinct populations of RISC exist in vivo. By using FCCS, the authors further showed that most of the loaded nRISC were transported from the cytoplasm [Citation67].
If two molecular species have similar molecular weights, it is difficult to distinguish them by FCS [Citation68]. Also, FCS and FCCS analyses are highly dependent on the model used for curve fitting and thus have to be interpreted carefully. Fluorescence cumulant analysis (FCA) provides information on the molecular brightness and diffusion coefficient when heterogeneous particles coexist [Citation69]. However, FCA is limited to data sampling times of only a few microseconds. Therefore, time integrated fluorescence cumulant analysis (TIFCA) was developed for arbitrary sampling times [Citation70]. TIFCA was used to measure the copy number of CP-FPs binding on a single mRNA tagged with the MS2 or PP7 system [Citation71]. This approach was further applied to quantify the association between MS2-tagged β-actin mRNA and the zipcode binding protein 1 (ZBP1) in live primary mouse embryonic fibroblasts (MEFs) and hippocampal neurons. The authors found that ZBP1 inhibits translation by preventing ribosomes to bind β-actin mRNA in the perinuclear region [Citation72].
Fluorescence recovery after photobleaching (FRAP)
FRAP is another technique that enables the measurement of molecular diffusion in living cells. A focused laser beam is used to instantly bleach fluorophores and the recovery of fluorescence by the influx of unbleached fluorophores from the outside of the bleached region is monitored over time. The fluorescence recovery curve reflects the overall mobility of the molecules [Citation73].
FRAP analysis has been used to quantify mRNA synthesis in vivo by photobleaching the transcription site of MS2-labeled mRNA and observing the fluorescence recovery [Citation74,Citation75]. The recovery kinetics of fluorescent MCP binding to the MBS in the nascent mRNA correlates with the transcription rate of the mRNA. The FRAP curves were fit with a two-exponential function; the fast component was modeled as the RNA polymerase II (RNA Pol II) elongation rate and the slow component was interpreted as polymerase pausing during elongation. The authors found that the measured elongation rate was much faster than the previously reported values [Citation74].
While FRAP experiments are relatively simple, caution is required for quantitative analysis of the data. When the diffusive motion of mRNP is studied by FRAP, diffusion of free fluorophores that are not bound to the mRNP can also contribute to the fluorescence recovery. To avoid an overestimation of the mRNP diffusion rate, Braga et al. developed a reaction-diffusion model for FRAP which takes account of the binding reaction between mRNA and a fluorescently labeled RBP. The authors applied this analysis method to the interaction between Poly(A)-RNA and Polyadenylate-binding nuclear protein 1(PABPN1) and obtained a result consistent with those measured by single particle tracking experiments [Citation76].
Analysis methods for mRNA localization in vivo
Quantitative analysis of RNA localization
Since the localization of actin mRNA was first observed [Citation3,Citation4], numerous studies have shown that heterogeneous RNA localization is prevalent in many different cell types and organisms [Citation5]. Once the intracellular distribution of RNA is imaged, it is important to analyze the collected data in an accurate and efficient manner. There have been a few analysis methods to categorize the localization patterns of RNA. First, the localization patterns of 1644 mRNAs in Drosophila embryos were qualitatively classified into 35 categories [Citation77]. The subcellular localization patterns of 61 human long non-coding RNAs (lncRNAs) were divided into five different types [Citation78]. For a more objective classification, hierarchical clustering algorithms have been used to group mRNA distribution patterns in neurons [Citation79] and HeLa cells [Citation80].
Another approach to analyze RNA localization is to define an index that represents the strength of the localization. Lawrence and Singer defined a localization index (LI), which is the ratio between the highest and the lowest density of RNA particles in a cell. The closer the value of LI is to one, the more uniformly mRNA is distributed in the cell [Citation4]. Another example is the use of a localization coefficient, which is the ratio of the mRNA concentration at the leading edge to that in the perinuclear region. If the localization coefficient is over 1, mRNAs are localized in the leading edge of the cell [Citation81]. Three-dimensional distance measurement between an mRNA and a specific cellular component could be also considered in determining mRNA localization [Citation82]. Voigt et al. defined a cumulative endoplasmic reticulum (ER) localization index that allows quantification of mRNA association with ER structures [Citation83].
For an objective quantification of intracellular localization, Park et al. used the concepts of the polarization and dispersion of RNA distributions. Polarization index (PI) was defined by the size of the polarization vector, connecting the centroid of the cell and that of mRNA particles. Dispersion index (DI) was determined by the sum of the distance from every single mRNA to their centroid. This tool was applied to three different cell types: budding yeast, CEF, and MEF cells to confirm the correlation of the two indexes showing the physical characteristics of the mRNA distribution [Citation84].
Modeling the dynamic behavior of mRNA trafficking
After mRNAs are transcribed, they are exported from the nucleus to the cytoplasm and then transported to their final destination. To understand the mechanism of mRNA localization, single particle tracking (SPT) has been widely used to follow the movement of mRNA [Citation85]. The MS2 labeling system is one feasible approach to track single mRNA molecules inside a living cell and is the main focus of this section.
There are a variety of tracking software implementing manual tracking such as the ImageJ/Fiji plugin MTrackJ [Citation86] and TrackMate [Citation87] or automatic programs such as u-Track [Citation88] and TrackNTrace [Citation89]. Recently, a hybrid tracking program that combines both manual and automatic particle detection was also developed [Citation90]. Once the mRNA trajectories are obtained from the SPT software, they are typically processed to calculate the mean squared displacement (MSD). The MSD is a parameter that measures the deviation of the position of a particle from a reference point over time. The shape of the MSD curve represents the dynamics of the particle movement, which is affected by various environmental factors inside a cell. If the MSD is a linear function of time, it means that the particle exhibits normal diffusion. If the exponent of the MSD curve is less than 1 and greater than zero, it indicates sub-diffusive motion. If the exponent is greater than 1, the particle exhibits super-diffusion. Anomalous diffusion is a generic term for sub- and super-diffusion [Citation91].
The sub-diffusive motion of mRNA was first investigated in bacteria to understand the physical nature of bacterial cytoplasm [Citation92]. Super-diffusive transport of mRNA has been mostly observed in neurons and explained by a few mathematical models. For instance, Bressloff and Newby suggested a stochastic model of directed intermittent search for a hidden target to describe the motor-driven mRNA transport to synaptic targets along a dendrite. Using the model, they calculated the mean first passage time for finding a single target, which could be potentially used to estimate the timescale of mRNA localization in neurons [Citation93]. Another mathematical model for neuronal mRNA transport was recently proposed by using a generalized form of Lévy walk. In this model, mRNA trajectories were divided into two dynamic phases of ballistic run and long extended rest. The time distribution of both phases showed a heavy-tailed probability distribution, which is a signature feature of Lévy walk. The run phase was shown to be microtubule-dependent, and the rest phase was interpreted as localization of mRNA at synaptic sites. The authors validated the model by reproducing the several key dynamic characteristics of their experimental data [Citation94].
Single particle trajectories are also analyzed by calculating the instantaneous diffusion coefficients [Citation83] or by using the jump distance histogram [Citation95,Citation96]. When there are heterogeneous populations of particles, the jump distance histogram analysis is particularly useful to detect subpopulations with different diffusion coefficients. By fitting the experimental jump distance histogram with multiple components, Kues et al. showed that there are at least three subpopulations of U1 small nuclear ribonucleoprotein (snRNP) with low, medium, and high mobility inside the nucleus [Citation95].
Imaging biological processes related to mRNA localization
Visualization of local translation
With the emerging technology of next-generation sequencing (NGS) and mass-spectrometry, global profiles of mRNA transcripts and the associated proteome have been identified [Citation97–Citation99]. However, there is much to be investigated regarding the extent of diversity and heterogeneity in time and space. The single-molecule fluorescence imaging approach can complement cellular and biochemical methods to monitor the highly regulated and complex translation process and to get quantitative measurement of the dynamics in real-time [Citation100]. Given that RNA localization and translation are closely linked to cellular function, many studies have attempted to visualize mRNAs being actively translated [Citation101]. While ribosome tagging to probe polysome association has been used as a direct approach [Citation102], visualization of translated nascent polypeptides along with the mRNA template is a recently adopted approach. Ribosome tagging can enrich actively translated mRNA transcripts; translation ribosome affinity purification (TRAP) [Citation103] and Ribotag [Citation104] can provide a list of transcripts and identify the interactions at a sub-codon resolution. Functionally diverse and distinct proteins can be profiled together depending on the subcellular localization of the ribosomes, which implicates the biological significance of RNA localization [Citation105]. For imaging nascent polypeptides, epitope tagging is amenable to different fluorescent labeling associated with diverse antibodies and their variants. Currently available and validated peptide epitopes include hemagglutinin (HA), myelocytomatosis viral oncogene (Myc), simian virus 5-derived epitope (V5), the synthetic peptide Flag, the synthetic streptavidin-binding Strep-tag, and OLLAS (Escherichia coli OmpF linker and mouse Langerin fusion sequence) [Citation106]. Out of the epitope toolkits, a combination of multi-epitope tagging can be developed to amplify the fluorescent signals. The most well-known are SunTag [Citation107] and spaghetti monster (smTag) [Citation108]. Types of epitopes and the copy number of repeats are chosen by considering physiological impacts of the modified transcript. smTag is made of 8~9 amino acids (aa) while SunTag is made of 22 aa. Because of the small size, smTag could be better than SunTag with higher spatiotemporal resolution [Citation109].
Using different combinatorial pairings of MS2/PP7 based RNA tagging and epitope tagging, translation dynamics have been measured [Citation109–Citation113]. With 24× SunTag (576 aa) and the MS2 system, Wu et al. demonstrated single-molecule imaging of nascent peptides (SINAPS). Using lentiviral transfection, a blue fluorescent protein (oxBFP) based reporter was stably expressed in U2OS cells and primary hippocampal neurons. With FRAP, translation elongation speed was measured to be about five amino acids per second [Citation110].
Another combination of tandem epitope tagging and an RNA labeling system was termed multivalent fluorescence amplification of the nascent polypeptide signal. SunTag peptide arrays and PP7 hairpins were fluorescently lableled with GFP-scFV and tdTomato-tdPCP, respectively. Translational response to environmental stress, such as translation inhibitors, unfolded protein stress (DTT-induced), and oxidative stress (NaAsO2-induced), were examined in this study [Citation111].
Yan et al. also used SunTag and the PP7 system with the prenylation sequence of CAAX to target the reporter mRNA to the plasma membrane for long-term microscopy observation. Because freely diffusing polypeptides in the cytosol can be excluded, only newly translated polypeptides were monitored in this study. The authors highlighted heterogeneity in translation efficiency among the mRNA molecules within the same cell and pointed out the importance of the 5′UTR in controlling translation initiation and elongation. They estimated the ribosome translocation rate to be 3–5 codons per second [Citation112].
Morisaki et al. used dual labeling with the MS2 system and smTag, which was named as nascent-chain tracking (NCT). They examined three different types of reporter constructs in U2OS human cells and reported the ribosome elongation rate to be ~10 amino acids per second. They also suggested that new translation initiation occurs stochastically every 30 sec on average. FRAP and FCS were used to measure the polysome mobility and size [Citation109].
Translating RNA imaging by coat protein knock-off (TRICK) is another technique for visualization of translation. This technique was designed to monitor only the first-round translation. Translated and untranslated mRNA transcripts can be distinguished because the designed mRNA transcript has PP7 and MS2 stem-loops in the coding sequence (CDS) and 3′UTR, respectively. Untranslated mRNA transcripts are labeled with both PP7 coat protein (PCP) and MCP. However, translated transcripts lose PCP after the ‘pioneer’ round of translation as the ribosomes displace the PCPs off from the CDS during translation [Citation114].
Visualization of RNA splicing and degradation
Splicing is a key process that expands and enriches the coding capacity of the genome. In addition, it was reported that splicing is mechanically coupled to the downstream mRNA localization [Citation115]. A technical breakthrough for real-time visualization revealed that splicing occurs much faster than previously proposed [Citation116]. The MS2 and λ-phage N systems were used to investigate the kinetics of splicing by tagging β-globin introns [Citation117]. Schmidt et al. used 4× MS2 reporter system and monitored the process of co-transcriptional splicing within live cells in real-time. The residency time of the intron with the nascent mRNA was compared in different contexts of the constructs and FRAP based kinetic model was presented [Citation118].
Of note, 3′-RNA end accumulation during turnover (TREAT) showed a versatile use of the MS2 and PP7 systems to monitor mRNA degradation. The key to this design is a viral RNA pseudo-knot that is resistant to XrnI, the most common RNase in mammalian cells working as a 5′ to 3′ exonuclease. Two pseudo-knots were added between the MS2 and PP7 stem-loop regions to distinguish intact transcripts from stabilized degradation intermediates. This method was applied in fixed and live cells to measure the half-life of reporter transcripts to observe Ago2-mediated slicing in real-time and to investigate P-bodies as the site of mRNA degradation [Citation119].
Evaluating RNA-protein interactions
The importance of RNA binding proteins (RBPs) has been recognized from the pathological consequence when the proteins are dysregulated. Neurodevelopmental disorders such as fragile X syndrome (FXS) and autism spectrum disorders (ASD) and neurodegenerative diseases such as spinal muscular atrophy (SMA) and amyotrophic lateral sclerosis (ALS) are often associated with problems in RBPs and formation of ribonucleoprotein particles (RNPs). Moreover, the number of neuromuscular disorders with perturbed RNA localization is increasing [Citation120]. For the well-known RBPs such as Staufen, FMRP, PUMILIO, SMN1, and Huntingtin, their association with RNA granules is implicated in neurogenesis and brain development.
Single-molecule techniques have been used to measure the speed and run length of such proteins bound to mRNA. Staufen is the first example of mammalian RBP that was GFP-tagged to monitor its bidirectional movement. In dendrites, the movement of Staufen occurred at 0.1–0.4 μm/s [Citation121]. FMRP-bound RNA granules were monitored with an MS2 reporter construct (Ccnd2-3′UTR tagged with MBS). Pilaz et al. electroporated EGFP-fused FMRP (EFGP-FMRP) constructs into radial glial cells (RGCs) and showed that the RNA granules moved at 1.3 μm/s on average. This study demonstrated that using live organotypic brain slices with high-speed imaging can accelerate our understanding of brain developmental processes [Citation122].
Survival motor neuron (SMN) is one of the best known master regulators for RNP assembly in neurons orchestrating the splicing cascades [Citation123]. Homozygous loss of the SMN1 gene can cause neurodegenerative SMA, resulting in voluntary muscle weakness. SMA is one of the leading genetic cause of infant death, affecting one in 10,000 newborns [Citation124]. Using tri-molecular fluorescence complementation, Dolin-Asp et al. showed that SMN promotes the assembly of ZBP1 protein with β-actin mRNA and facilitates their trafficking [Citation125].
Huntingtin (Htt) protein associates with brain-derived neurotrophic factor (BDNF) mRNA at specific locations. Ma et al. used the MS2 system to monitor the dendritic transport of BDNF 3′UTR reporter mRNAs and observed the co-trafficking of BDNF mRNA with Htt in live neurons. The authors also observed the colocalization of BDNF mRNA with Htt, Ago2, cytoplasmic polyadenylation element binding protein (CPEB), and dynein in thick vibratome sections of the rat cortex [Citation126]. Htt mRNA itself can also associate with Ago2 at cytoplasmic P-bodies in non-neuronal cells, indicating a close association with small RNA-mediated gene silencing [Citation127]. Htt interacts and colocalizes with other partner proteins such as Htt associated protein (HAP1) and microtubule motors such kinesin and dynein [Citation128].
Perspective and conclusion
With the advent of deep sequencing and digital counting of single mRNA transcripts, mRNA localization is more commonly found in many cell types and in different biological contexts. As quantitative analysis tools are applied to clarify the dynamic interaction of mRNA with RBPs, cytoskeletons, and organelles, a better understanding is attained on how cellular systems manage complexity in the combinatorial assembly of ribonucleoprotein complexes and their transport to the localization site. Over the years, many cis-elements and trans-factors for mRNA localization have been identified [Citation129,Citation130]. Multi-color imaging of the RNA elements and the newly identified RBPs will validate their spatiotemporal interactions in vivo, providing a clue to the mechanism of RNA localization. Technical developments in a multiplex format in imaging and analysis are needed to examine the importance of the specific RNA elements and the diverse assortment of RBPs. With improved microscopic techniques, the development of optimized fluorophores is needed in parallel to broaden the multiplexing capability. Implementation of finely tunable and precise stimulation protocols would be additional assets to be combined with the single-molecule techniques for the investigation of the dynamic cellular and molecular responses in living systems. We look forward to further development in fluorescence imaging and labeling techniques for single-molecule analysis of heterogeneous RNA population, which will enable us to address many fundamental biological questions related to RNA localization.
Disclosure statement
No potential conflict of interest was reported by the authors.
Additional information
Funding
Related Research Data
References
- Vera M, Biswas J, Senecal A, et al. Single-cell and single-molecule analysis of gene expression regulation. Annu Rev Genet. 2016;50:267–291.
- Singer RH, Ward DC. Actin gene expression visualized in chicken muscle tissue culture by using in situ hybridization with a biotinated nucleotide analog. Proc Natl Acad Sci U S A. 1982;79(23):7331–7335.
- Jeffery WR, Tomlinson CR, Brodeur RD. Localization of actin messenger RNA during early ascidian development. Dev Biol. 1983;99(2):408–417.
- Lawrence JB, Singer RH. Intracellular-localization of messenger-RNAs for cytoskeletal proteins. Cell. 1986;45(3):407–415.
- Buxbaum AR, Haimovich G, Singer RH. In the right place at the right time: visualizing and understanding mRNA localization. Nat Rev Mol Cell Biol. 2015;16(2):95–109.
- Tyagi S, Kramer FR. Molecular beacons: probes that fluoresce upon hybridization. Nat Biotechnol. 1996;14(3):303–308.
- Zheng J, Yang R, Shi M, et al. Rationally designed molecular beacons for bioanalytical and biomedical applications. Chem Soc Rev. 2015;44(10):3036–3055.
- Ma Z, Wu X, Krueger CJ, et al. Engineering novel molecular beacon constructs to study intracellular RNA dynamics and localization. Genomics Proteomics Bioinf. 2017;15(5):279–286.
- Vargas DY, Raj A, Marras SAE, et al. Mechanism of mRNA transport in the nucleus. Proc Natl Acad Sci U S A. 2005;102(47):17008–17013.
- Zhang X, Song Y, Shah AY, et al. Quantitative assessment of ratiometric bimolecular beacons as a tool for imaging single engineered RNA transcripts and measuring gene expression in living cells. Nucleic Acids Res. 2013;41(15):e152.
- Zhao D, Yang Y, Qu N, et al. Single-molecule detection and tracking of RNA transcripts in living cells using phosphorothioate-optimized 2’-O-methyl RNA molecular beacons. Biomaterials. 2016;100:172–183.
- Chen M, Ma Z, Wu X, et al. A molecular beacon-based approach for live-cell imaging of RNA transcripts with minimal target engineering at the single-molecule level. Sci Rep. 2017;7(1):1550.
- Bertrand E, Chartrand P, Schaefer M, et al. Localization of ASH1 mRNA particles in living yeast. Mol Cell. 1998;2(4):437–445.
- Beach DL, Salmon ED, Bloom K. Localization and anchoring of mRNA in budding yeast. Curr Biol. 1999;9(11):569–578.
- Daigle N, Ellenberg J. LambdaN-GFP: an RNA reporter system for live-cell imaging. Nat Methods. 2007;4(8):633–636.
- Larson DR, Zenklusen D, Wu B, et al. Real-time observation of transcription initiation and elongation on an endogenous yeast gene. Science. 2011;332(6028):475–478.
- Hocine S, Raymond P, Zenklusen D, et al. Single-molecule analysis of gene expression using two-color RNA labeling in live yeast. Nat Methods. 2013;10(2):119–121.
- Forrest KM, Gavis ER. Live imaging of endogenous RNA reveals a diffusion and entrapment mechanism for nanos mRNA localization in Drosophila. Curr Biol. 2003;13(14):1159–1168.
- Lionnet T, Czaplinski K, Darzacq X, et al. A transgenic mouse for in vivo detection of endogenous labeled mRNA. Nat Methods. 2011;8(2):165–170.
- Park HY, Lim H, Yoon YJ, et al. Visualization of dynamics of single endogenous mRNA labeled in live mouse. Science. 2014;343(6169):422–424.
- Fusco D, Accornero N, Lavoie B, et al. Single mRNA molecules demonstrate probabilistic movement in living mammalian cells. Curr Biol. 2003;13(2):161–167.
- Rackham O, Brown CM. Visualization of RNA-protein interactions in living cells: FMRP and IMP1 interact on mRNAs. Embo J. 2004;23(16):3346–3355.
- Ozawa T, Natori Y, Sato M, et al. Imaging dynamics of endogenous mitochondrial RNA in single living cells. Nat Methods. 2007;4(5):413–419.
- Valencia-Burton M, McCullough RM, Cantor CR, et al. RNA visualization in live bacterial cells using fluorescent protein complementation. Nat Methods. 2007;4(5):421–427.
- Yamada T, Yoshimura H, Inaguma A, et al. Visualization of nonengineered single mRNAs in living cells using genetically encoded fluorescent probes. Anal Chem. 2011;83(14):5708–5714.
- Yiu H-W, Demidov VV, Toran P, et al. RNA detection in live bacterial cells using fluorescent protein complementation triggered by interaction of two RNA aptamers with two RNA-binding peptides. Pharmaceuticals. 2011;4(3):494.
- Wu B, Chen J, Singer RH. Background free imaging of single mRNAs in live cells using split fluorescent proteins. Sci Rep. 2014;4:3615.
- Garcia JF, Parker R. MS2 coat proteins bound to yeast mRNAs block 5’ to 3’ degradation and trap mRNA decay products: implications for the localization of mRNAs by MS2-MCP system. RNA. 2015;21(8):1393–1395.
- Haimovich G, Zabezhinsky D, Haas B, et al. Use of the MS2 aptamer and coat protein for RNA localization in yeast: A response to “MS2 coat proteins bound to yeast mRNAs block 5’ to 3’ degradation and trap mRNA decay products: implications for the localization of mRNAs by MS2-MCP system”. RNA. 2016;22(5):660–666.
- Garcia JF, Parker R. Ubiquitous accumulation of 3’ mRNA decay fragments in Saccharomyces cerevisiae mRNAs with chromosomally integrated MS2 arrays. RNA. 2016;22(5):657–659.
- Tutucci E, Vera M, Biswas J, et al. An improved MS2 system for accurate reporting of the mRNA life cycle. Nat Methods. 2018;15(1):81–89.
- Babendure JR, Adams SR, Tsien RY. Aptamers switch on fluorescence of triphenylmethane dyes. J Am Chem Soc. 2003;125(48):14716–14717.
- Paige JS, Wu KY, Jaffrey SR. RNA mimics of green fluorescent protein. Science. 2011;333(6042):642–646.
- Strack RL, Disney MD, Jaffrey SR. A superfolding Spinach2 reveals the dynamic nature of trinucleotide repeat-containing RNA. Nat Methods. 2013;10(12):1219–1224.
- Filonov GS, Moon JD, Svensen N, et al. Broccoli: rapid selection of an RNA mimic of green fluorescent protein by fluorescence-based selection and directed evolution. J Am Chem Soc. 2014;136(46):16299–16308.
- Huang H, Suslov NB, Li N-S, et al. A G-quadruplex-containing RNA activates fluorescence in a GFP-like fluorophore. Nat Chem Biol. 2014;10(8):686–691.
- Warner KD, Chen MC, Song W, et al. Structural basis for activity of highly efficient RNA mimics of green fluorescent protein. Nat Struct Mol Biol. 2014;21(8):658–663.
- Ong WQ, Citron YR, Sekine S, et al. Live cell imaging of endogenous mRNA using RNA-based fluorescence “turn-on” probe. ACS Chem Biol. 2017;12(1):200–205.
- Wang Z, Luo Y, Xie X, et al. In situ spatial complementation of aptamer-mediated recognition enables live-cell imaging of native RNA transcripts in real time. Angew Chem Int Ed Engl. 2018;57(4):972–976.
- Zhang J, Fei J, Leslie BJ, et al. Tandem spinach array for mRNA imaging in living bacterial cells. Sci Rep. 2015;5:17295.
- Dolgosheina EV, Jeng SCY, Panchapakesan SSS, et al. RNA mango aptamer-fluorophore: a bright, high-affinity complex for RNA labeling and tracking. ACS Chem Biol. 2014;9(10):2412–2420.
- Autour A, Jeng SCY, Cawte AD, et al. Fluorogenic RNA mango aptamers for imaging small non-coding RNAs in mammalian cells. Nat Commun. 2018;9(1):656.
- O’Connell MR, Oakes BL, Sternberg SH, et al. Programmable RNA recognition and cleavage by CRISPR/Cas9. Nature. 2014;516(7530):263–266.
- Nelles DA, Fang MY, O’Connell MR, et al. Programmable RNA tracking in live cells with CRISPR/Cas9. Cell. 2016;165(2):488–496.
- Chen B, Gilbert LA, Cimini BA, et al. Dynamic imaging of genomic loci in living human cells by an optimized CRISPR/Cas system. Cell. 2013;155(7):1479–1491.
- Kim VN. RNA-targeting CRISPR comes of age. Nat Biotechnol. 2018;36(1):44–45.
- Abudayyeh OO, Gootenberg JS, Konermann S, et al. C2c2 is a single-component programmable RNA-guided RNA-targeting CRISPR effector. Science. 2016;353(6299):aaf5573.
- Smargon AA, Cox DBT, Pyzocha NK, et al. Cas13b is a type VI-B CRISPR-associated RNA-guided rnase differentially regulated by accessory proteins Csx27 and Csx28. Mol Cell. 2017;65(4):618–630.
- Konermann S, Lotfy P, Brideau NJ, et al. Transcriptome engineering with RNA-Targeting Type VI-D CRISPR effectors. Cell. 2018;173(3):665–676.
- Yan WX, Chong S, Zhang H, et al. Cas13d is a compact RNA-targeting type VI CRISPR effector positively modulated by a WYL-domain-containing accessory protein. Mol Cell. 2018;70(2):327–339.
- Abudayyeh OO, Gootenberg JS, Essletzbichler P, et al. RNA targeting with CRISPR-Cas13. Nature. 2017;550(7675):280–284.
- Cox DBT, Gootenberg JS, Abudayyeh OO, et al. RNA editing with CRISPR-Cas13. Science. 2017;358(6366):1019–1027.
- Mahas A, Stewart CN, Mahfouz MM. Harnessing CRISPR/Cas systems for programmable transcriptional and post-transcriptional regulation. Biotechnol Adv. 2018;36(1):295–310.
- Eliscovich C, Shenoy SM, Singer RH. Imaging mRNA and protein interactions within neurons. Proc Natl Acad Sci U S A. 2017;114(10): E1875–E1884.
- Khong A, Matheny T, Jain S, et al. The stress granule transcriptome reveals principles of mRNA accumulation in stress granules. Mol Cell. 2017;68(4):808–820.
- Ma J, Liu Z, Michelotti N, et al. High-resolution three-dimensional mapping of mRNA export through the nuclear pore. Nat Commun. 2013;4:2414.
- Grunwald D, Singer RH. In vivo imaging of labelled endogenous beta-actin mRNA during nucleocytoplasmic transport. Nature. 2010;467(7315):604–607.
- Mor A, Suliman S, Ben-Yishay R, et al. Dynamics of single mRNP nucleocytoplasmic transport and export through the nuclear pore in living cells. Nat Cell Biol. 2010;12(6):543–552.
- Siebrasse JP, Kaminski T, Kubitscheck U. Nuclear export of single native mRNA molecules observed by light sheet fluorescence microscopy. Proc Natl Acad Sci U S A. 2012;109(24):9426–9431.
- Smith CS, Preibisch S, Joseph A, et al. Nuclear accessibility of beta-actin mRNA is measured by 3D single-molecule real-time tracking. J Cell Biol. 2015;209(4):609–619.
- Moon, HC, Lee BH, Lim K, et al. Tracking single mRNA molecules in live cells. J Phys D-Applied Phys. 2016;49(23):233001.
- Magde D, Elson E, Webb WW. Thermodynamic fluctuations in a reacting system - measurement by fluorescence correlation spectroscopy. Phys Rev Lett. 1972;29(11):705.
- Kim SA, Heinze KG, Schwille P. Fluorescence correlation spectroscopy in living cells. Nat Methods. 2007;4(11):963.
- Chen H, Farkas ER, Webb WW. In vivo applications of fluorescence correlation spectroscopy. Methods Cell Biol. 2008;89:3–35.
- Mütze J, Ohrt T, Schwille P. Fluorescence correlation spectroscopy in vivo. Laser Photon Rev. 2011;5(1):52–67.
- Bacia K, Kim SA, Schwille P. Fluorescence cross-correlation spectroscopy in living cells. Nat Methods. 2006;3(2):83.
- Ohrt T, Mütze J, Staroske W, et al. Fluorescence correlation spectroscopy and fluorescence cross-correlation spectroscopy reveal the cytoplasmic origination of loaded nuclear RISC in vivo in human cells. Nucleic Acids Res. 2008;36(20):6439–6449.
- Meseth U, Wohland T, Rigler R, et al. Resolution of fluorescence correlation measurements. Biophys J. 1999;76(3):1619–1631.
- Müller JD. Cumulant analysis in fluorescence fluctuation spectroscopy. Biophys J. 2004;86(6):3981–3992.
- Wu B, Müller JD. Time-integrated fluorescence cumulant analysis in fluorescence fluctuation spectroscopy. Biophys J. 2005;89(4):2721–2735.
- Wu B, Chao JA, Singer RH. Fluorescence fluctuation spectroscopy enables quantitative imaging of single mRNAs in living cells. Biophys J. 2012;102(12):2936–2944.
- Wu B, Buxbaum AR, Katz ZB, et al. Quantifying protein-mRNA interactions in single live cells. Cell. 2015;162(1):211–220.
- Axelrod D, Koppel DE, Schlessinger J, et al. Mobility measurement by analysis of fluorescence photobleaching recovery kinetics. Biophys J. 1976;16(9):1055–1069.
- Darzacq X, Shav-Tal Y, de Turris V, et al. In vivo dynamics of RNA polymerase II transcription. Nat Struct Mol Biol. 2007;14(9):796–806.
- Ben-Ari Y, Brody Y, Kinor N, et al. The life of an mRNA in space and time. J Cell Sci. 2010;123(10):1761–1774.
- Braga J, McNally JG, Carmo-Fonseca M. A reaction-diffusion model to study RNA motion by quantitative fluorescence recovery after photobleaching. Biophys J. 2007;92(8):2694–2703.
- Lecuyer E, Yoshida H, Parthasarathy N, et al. Global analysis of mRNA localization reveals a prominent role in organizing cellular architecture and function. Cell. 2007;131(1):174–187.
- Cabili MN, Dunagin MC, McClanahan PD, et al. Localization and abundance analysis of human lncRNAs at single-cell and single-molecule resolution. Genome Biology. 2015;16(1):20.
- Cajigas IJ, Tushev G, Will TJ, et al. The local transcriptome in the synaptic neuropil revealed by deep sequencing and high-resolution imaging. Neuron. 2012;74(3):453–466.
- Battich N, Stoeger T, Pelkmans L. Image-based transcriptomics in thousands of single human cells at single-molecule resolution. Nat Methods. 2013;10(11):1127–1133.
- Yamagishi M, Shirasaki Y, Funatsu T. Size-dependent accumulation of mRNA at the leading edge of chicken embryo fibroblasts. Biochem Biophys Res Commun. 2009;390(3):750–754.
- Jourdren L, Delaveau T, Marquenet E, et al. CORSEN, a new software dedicated to microscope-based 3D distance measurements: mRNA-mitochondria distance, from single-cell to population analyses. RNA. 2010;16(7):1301–1307.
- Voigt F, Zhang H, Cui XA, et al. Single-molecule quantification of translation-dependent association of mRNAs with the endoplasmic reticulum. Cell Rep. 2017;21(13):3740–3753.
- Park HY, Trcek T, Wells AL, et al. An unbiased analysis method to quantify mRNA localization reveals its correlation with cell motility. Cell Rep. 2012;1(2):179–184.
- Park HY, Buxbaum AR, Singer RH. Single mRNA Tracking in Live Cells. Methods Enzymol. 2010;472:387–406.
- Meijering E, Dzyubachyk O, Smal I. Methods for cell and particle tracking. Methods Enzymol. 2012;504:183–200.
- Tinevez J-Y, Perry N, Schindelin J, et al. TrackMate: an open and extensible platform for single-particle tracking. Methods. 2017;115:80–90.
- Jaqaman K, Loerke D, Mettlen M, et al. Robust single-particle tracking in live-cell time-lapse sequences. Nat Methods. 2008;5(8):695–702.
- Stein SC, Thiart J. TrackNTrace: a simple and extendable open-source framework for developing single-molecule localization and tracking algorithms. Sci Rep. 2016;6:37947.
- Lee BH, Park HY. HybTrack: a hybrid single particle tracking software using manual and automatic detection of dim signals. Sci Rep. 2018;8(1):212.
- Metzler R, Klafter J. The random walk’s guide to anomalous diffusion: a fractional dynamics approach. Phys Rep. 2000;339(1):1–77.
- Golding I, Cox EC. Physical nature of bacterial cytoplasm. Phys Rev Lett. 2006;96(9):098102.
- Bressloff P, Newby J. Directed intermittent search for hidden targets. New J Phys. 2009;11(2):023033.
- Song MS, Moon HC, JeonJ-H, et al. Neuronal messenger ribonucleoprotein transport follows an aging Levy walk. Nat Commun. 2018;9(1):344.
- Kues T, Dickmanns A, Lührmann R, et al. High intranuclear mobility and dynamic clustering of the splicing factor U1 snRNP observed by single particle tracking. Proc Natl Acad Sci U S A. 2001;98(21):12021–12026.
- Grunwald D, Martin RM, Buschmann V, et al. Probing intranuclear environments at the single-molecule level. Biophys J. 2008;94(7):2847–2858.
- Lee MV, Topper SE, Hubler SL, et al. A dynamic model of proteome changes reveals new roles for transcript alteration in yeast. Mol Syst Biol. 2011;7:514.
- Baltz AG, Munschauer M, Schwanhäusser B, et al. The mRNA-bound proteome and its global occupancy profile on protein-coding transcripts. Mol Cell. 2012;46(5):674–690.
- Sysoev VO, Fischer B, Frese CK, et al. Global changes of the RNA-bound proteome during the maternal-to-zygotic transition in Drosophila. Nat Commun. 2016;7:12128.
- Ruijtenberg S, Hoek TA, Yan X, et al. Imaging translation dynamics of single mRNA molecules in live cells. Methods Mol Biol. 2018;1649:385–404.
- Heyer EE, Moore MJ. Redefining the translational status of 80S monosomes. Cell. 2016;164(4):757–769.
- Dorywalska M, Blanchard SC, Gonzalez Jr RL, et al. Site-specific labeling of the ribosome for single-molecule spectroscopy. Nucleic Acids Res. 2005;33(1):182–189.
- Heiman M, Kulicke R, Fenster RJ, et al. Cell type-specific mRNA purification by translating ribosome affinity purification (TRAP). Nat Protoc. 2014;9(6):1282–1291.
- Sanz E, Yang L, Su T, et al. Cell-type-specific isolation of ribosome-associated mRNA from complex tissues. Proc Natl Acad Sci U S A. 2009;106(33):13939–13944.
- Simsek D, Tiu GC, Flynn RA, et al. The mammalian ribo-interactome reveals ribosome functional diversity and heterogeneity. Cell. 2017;169(6):1051–1065.
- Fritze CE, Anderson TR. Epitope tagging: general method for tracking recombinant proteins. Methods Enzymol. 2000;327:3–16.
- Tanenbaum ME, Gilbert LA, Qi LS, et al. A protein-tagging system for signal amplification in gene expression and fluorescence imaging. Cell. 2014;159(3):635–646.
- Viswanathan S, Williams ME, Bloss EB, et al. High-performance probes for light and electron microscopy. Nat Methods. 2015;12(6):568–576.
- Morisaki T, Lyon K, DeLuca KF, et al. Real-time quantification of single RNA translation dynamics in living cells. Science. 2016;352(6292):1425–1429.
- Wu B, Eliscovich C, Yoon YJ, et al. Translation dynamics of single mRNAs in live cells and neurons. Science. 2016;352(6292):1430–1435.
- Wang C, Han B, Zhou R, et al. Real-Time Imaging of Translation on Single mRNA Transcripts in Live Cells. Cell. 2016;165(4):990–1001.
- Yan X, Hoek TA, Vale RD, et al. Dynamics of translation of single mRNA molecules in vivo. Cell. 2016;165(4):976–989.
- Pichon X, Bastide A, Safieddine A, et al. Visualization of single endogenous polysomes reveals the dynamics of translation in live human cells. J Cell Biol. 2016;214(6):769–781.
- Halstead JM, Lionnet T, Wilbertz JH, et al. Translation. An RNA biosensor for imaging the first round of translation from single cells to living animals. Science. 2015;347(6228):1367–1671.
- Hachet O, Ephrussi A. Splicing of oskar RNA in the nucleus is coupled to its cytoplasmic localization. Nature. 2004;428(6986):959–963.
- Carmo-Fonseca M, Kirchhausen T. The timing of pre-mRNA splicing visualized in real-time. Nucleus. 2014;5(1):11–14.
- Martin RM, Rino J, Carvalho C, et al. Live-cell visualization of pre-mRNA splicing with single-molecule sensitivity. Cell Rep. 2013;4(6):1144–1155.
- Schmidt U, Basyuk E, Robert M-C, et al. Real-time imaging of cotranscriptional splicing reveals a kinetic model that reduces noise: implications for alternative splicing regulation. J Cell Biol. 2011;193(5):819–829.
- Horvathova I, Voigt F, Kotrys AV, et al. The dynamics of mRNA turnover revealed by single-molecule imaging in single cells. Mol Cell. 2017;68(3):615–625.
- Cooper TA, Wan L, Dreyfuss G. RNA and disease. Cell. 2009;136(4):777–793.
- Köhrmann M, Luo M, Kaether C, et al. Microtubule-dependent recruitment of Staufen-green fluorescent protein into large RNA-containing granules and subsequent dendritic transport in living hippocampal neurons. Mol Biol Cell. 1999;10(9):2945–2953.
- Pilaz L-J, Lennox AL, Rouanet JP, et al. Dynamic mRNA transport and local translation in radial glial progenitors of the developing brain. Curr Biol. 2016;26(24):3383–3392.
- Eggert C, Chari A, Laggerbauer B, et al. Spinal muscular atrophy: the RNP connection. Trends Mol Med. 2006;12(3):113–121.
- Zanetta C, Nizzardo M, Simone C, et al. Molecular therapeutic strategies for spinal muscular atrophies: current and future clinical trials. Clin Ther. 2014;36(1):128–140.
- Donlin-Asp PG, Fallini C, Campos J, et al. The survival of motor neuron protein acts as a molecular chaperone for mRNP assembly. Cell Rep. 2017;18(7):1660–1673.
- Ma B, Culver BP, Baj G, et al. Localization of BDNF mRNA with the Huntington’s disease protein in rat brain. Mol Neurodegener. 2010;5:22.
- Savas JN, Makusky A, Ottosen S, et al. Huntington’s disease protein contributes to RNA-mediated gene silencing through association with Argonaute and P bodies. Proc Natl Acad Sci U S A. 2008;105(31):10820–10825.
- Ma B, Savas JN, Yu M-S, et al. Huntingtin mediates dendritic transport of beta-actin mRNA in rat neurons. Sci Rep. 2011;1:140.
- Meer EJ, Wang DO, Kim S, et al. Identification of a cis-acting element that localizes mRNA to synapses. Proc Natl Acad Sci U S A. 2012;109(12):4639–4644.
- Yaniv K, Yisraeli JK. Defining cis-acting elements and trans-acting factors in RNA localization. Int Rev Cytol. 2001;203:521–539.