
ABSTRACT
Hypoxia plays a crucial role in the aggressiveness of solid tumors by driving multiple signaling pathways. Recently, long non-coding RNA (lncRNA) has been reported to promote or inhibit tumor aggressiveness by regulating gene expression. Previous studies in our laboratory found that the lncRNA NDRG1-OT1 is significantly up-regulated under hypoxia and inhibits its target gene NDRG1 at both the mRNA and protein levels. At the protein level, NDRG1-OT1 increases NDRG1 degradation via ubiquitin-mediated proteolysis. However, the repressive mechanism of NDRG1 at the RNA level is still unknown. Therefore, the purpose of this study was to study how NDRG1-OT1 transcriptionally regulates its target gene NDRG1. Luciferase reporter assays showed that NDRG1-OT1 decreased NDRG1 promoter activities. Mass spectrometry, bioinformatics tools, genetic manipulation, and immunoblotting were used to identify the interacting proteins. Surprisingly, different fragments of NDRG1-OT1 had opposite effects on NDRG1. The first quarter fragment (1–149 nt) of NDRG1-OT1 had no effect on the NDRG1 promoter; the second quarter fragment (150–263 nt) repressed NDRG1 by increasing the binding affinity of HNRNPA1; the third quarter fragment (264–392 nt) improved NDRG1 promoter activity by recruiting HIF-1α; the fourth quarter fragment (393–508 nt) down-regulated NDRG1 promoter activity via down-regulation of KHSRP under hypoxia. In summary, we have found a novel mechanism by which different fragments of the same lncRNA can cause opposite effects within the same target gene.
Introduction
Solid tumors are characterized by hypoxia, an imbalance of oxygen delivery and consumption due to rapid tumor growth and inadequate vascular distribution Citation[1,Citation2]. Previous studies have shown that hypoxia is an important factor in the aggressiveness of solid tumors [Citation3], and tumors under hypoxia can activate a series of signaling pathways that adversely affect cellular function [Citation4–Citation7] and result in poor prognosis [Citation8].
Among these signaling pathways, a key transcription factor is hypoxia inducible factor-1 (HIF-1) [Citation9]. HIF-1 activates the expression of its target genes by binding to the hypoxia response elements (HREs) in the promoters of these genes [Citation10,Citation11]. Recent studies reported that hypoxia can modulate the process of breast carcinogenesis by the HIF-1α pathway. For example, DDR2 plays a role in a series of hypoxia-induced behaviors in breast cancer, such as metastasis, invasion, and epithelial-mesenchymal transition, by interacting with HIF-1α under hypoxia [Citation12]. DDX3 also works with HIF-1α to regulate downstream genes under hypoxia [Citation13]. Although hypoxia is an indispensable factor in studies of solid tumors, its regulatory mechanisms remain unclear.
The long non-coding RNAs (lncRNAs), whose sequences contain more than 200 nucleotides, are defined as transcripts that have limited or no ability to translate into protein [Citation14]. LncRNAs have been reported to respond to several extrinsic stimuli, such as drugs [Citation15], hypoxia [Citation16], radiation [Citation17], and diet [Citation18], by epigenetically regulating gene expression, sponging microRNA (miRNA) [Citation19], acting as scaffolds to link proteins and DNA sequences [Citation20], or regulating target RNA stability [Citation21]. In hypoxia, several lncRNAs have been reported to regulate cell function. For example, EFNA3 increased breast cancer cell extravasation from blood vessels into surrounding tissues [Citation22]. HOTTIP promoted epithelial-mesenchymal transition under hypoxia [Citation23]. MALAT1 enhanced arsenite-induced glycolysis under hypoxia [Citation24]. Still, the detailed mechanisms of lncRNA operating under hypoxia are not fully understood.
Recently, our laboratory identified several mechanisms regulating N-myc downstream regulated gene 1 (NDRG1) under different oxygen concentrations. NDRG1, a highly conserved stress response gene, played pivotal roles in regulating cellular differentiation, proliferation, growth arrest, apoptosis, angiogenesis, spindle checkpoint, tumor progression and metastasis, and heavy metal or hypoxia sensing [Citation25–Citation28]. It was modulated by both transcriptional regulators (e.g., AHR [Citation29], TBX-2 and ERG1 [Citation30]) and epigenetic regulation (e.g., miRNA-769-3p [Citation31]). However, it was still unclear whether lncRNA could be involved in the regulation of NDRG1 under hypoxia. In recent research in our laboratory, we first renamed the lncRNA lnc-NDRG1-1 as NDRG1-OT1 (NDRG1 overlapping transcript 1) according to the guidelines for non-coding RNA nomenclature [Citation32]. NDRG1-OT1 was induced under hypoxia in breast cancer cells [Citation33], but its function remained unclear. We discovered that ectopic expression of NDRG1-OT1 could inhibit NDRG1 expression at both RNA and protein levels [Citation33]. At the protein level, NDRG1-OT1 increased NDRG1 degradation via ubiquitin-mediated proteolysis. However, the repressive mechanism of NDRG1 at the RNA level is still unknown. Therefore, the purpose of this study was to investigate the inhibitory mechanism of NDRG1-OT1 at the transcriptional level of NDRG1.
We found that transcriptional inhibition was the main mechanism for suppressing NDRG1 RNA expression levels. In addition, different fragments of NDRG1-OT1 caused different effects on transcriptional activity of NDRG1 by recruiting various proteins.
Results
Different fragments of NDRG1-OT1 have different effects on NDRG1
To investigate the inhibitory mechanism of NDRG1-OT1 on NDRG1 at the transcriptional level, NDRG1-OT1 was first overexpressed in MCF-7 cells, followed by overexpressing NDRG1. As shown in , the expression of NDRG1 was inhibited after overexpressing NDRG1-OT1, and could be rescued by overexpressing NDRG1, indicating that NDRG1 is the target gene of NDRG1-OT1.
Figure 1. The transcriptional levels of NDRG1 were inhibited by overexpressing NDRG1-OT1. MCF-7 cells were transfected with NDRG1-OT1 (2 μg) for 24 h, and NDRG1 (2 μg) for another 24 h. The expression levels of NDRG1-OT1 and NDRG1 were measured in MCF-7 cells by qRT-PCR. The relative expression level was normalized to empty control. Internal control: 18s. Data were repeated at least 3 times, and the results shown are the means ± SDs. *: P < 0.05 versus empty control.
In order to determine how NDRG1-OT1 down-regulates NDRG1 at the transcriptional level, we first investigated the major regions of NDRG1-OT1 responsible for inhibiting NDRG1 by dividing NDRG1-OT1 into halves and quarters. In total, six fragments of NDRG1-OT1 (1–263, 264–508, 1–149, 150–263, 264–392, and 393–508 nt) were constructed according to the predicted 2D structure of NDRG1-OT1 by NONCODE (http://www.noncode.org/show_rna.php?id=NONHSAT129220&version=2&utd=1#) and the predicted 3D structure of each fragment by SimRNA Citation34,(), The different fragments of NDRG1-OT1, as well as Firefly and Renilla luciferase, were co-transfected into HEK293T cells under CoCl2 treatment. The results showed that NDRG1 promoter activity was suppressed by overexpressing full length (1–508 nt) and the first half fragment (1–263 nt) of NDRG1-OT1, but not the second half fragment (264–508 nt) (), Furthermore, the first quarter fragment (1–149 nt) of NDRG1-OT1 had no effect on NDRG1 promoter activity. The second quarter fragment (150–263 nt) and fourth quarter fragment (393–508 nt) of NDRG1-OT1 also significantly repressed NDRG1 promoter activity. Interestingly, the third quarter fragment (264–392 nt) of NDRG1-OT1 enhanced NDRG1 promoter activity (), The effects of different NDRG1-OT1 fragments on transcriptional levels of NDRG1 expression in MCF-7 cells treated with CoCl2 were similar to those of luciferase reporter assays in HEK293T cells ()), indicating different fragments of NDRG1-OT1, except the first quarter fragment (1–149 nt), had different effects on the same target gene, NDRG1.
Figure 2. Different fragments of NDRG1-OT1 have different effects on NDRG1. (a) The predicted 2D structure of NDRG1-OT1 by NONCODE (http://www.noncode.org/show_rna.php?id=NONHSAT129220&version=2&utd=1#) and 3D structure of each fragment by SimRNA [Citation34]. nt: nucleotides. (b) NDRG1 promoter activity measured by luciferase reporter assays. HEK293T cells treated with CoCl2 (300 μM) were co-transfected with the Firefly luciferase, Renilla luciferase, and various fragments of NDRG1-OT1 for 24 h. Firefly luciferase activities were first adjusted by Renilla luciferase activities, and then normalized to empty control. AS: antisense. (c) Relative NDRG1 expression levels by quantitative RT-PCR. MCF-7 cells treated with CoCl2 were transfected with different fragments of NDRG1-OT1 for 24 h. The relative expression levels of NDRG1 were first normalized to internal control (18s rRNA), and then adjusted to empty control. Experiments were repeated at least 3 times, and the results shown are the means ± SDs. *: P < 0.05 as compared to empty control.
![Figure 2. Different fragments of NDRG1-OT1 have different effects on NDRG1. (a) The predicted 2D structure of NDRG1-OT1 by NONCODE (http://www.noncode.org/show_rna.php?id=NONHSAT129220&version=2&utd=1#) and 3D structure of each fragment by SimRNA [Citation34]. nt: nucleotides. (b) NDRG1 promoter activity measured by luciferase reporter assays. HEK293T cells treated with CoCl2 (300 μM) were co-transfected with the Firefly luciferase, Renilla luciferase, and various fragments of NDRG1-OT1 for 24 h. Firefly luciferase activities were first adjusted by Renilla luciferase activities, and then normalized to empty control. AS: antisense. (c) Relative NDRG1 expression levels by quantitative RT-PCR. MCF-7 cells treated with CoCl2 were transfected with different fragments of NDRG1-OT1 for 24 h. The relative expression levels of NDRG1 were first normalized to internal control (18s rRNA), and then adjusted to empty control. Experiments were repeated at least 3 times, and the results shown are the means ± SDs. *: P < 0.05 as compared to empty control.](/cms/asset/61ada82a-ae3f-4849-877c-d664f295f4da/krnb_a_1553480_f0002_oc.jpg)
The second quarter fragment (150–263 nt) represses NDRG1 by increasing the binding of HNRNPA1 under hypoxia
In order to identify the protein-binding partners of NDRG1-OT1 that suppressed the promoter activity of NDRG1, we first performed RNA pull-down assays using the second quarter biotin-labeled NDRG1-OT1 fragment (150–263 nt) as a probe to interact with nuclear extracts from MCF-7 cells. The different amounts of nuclear proteins in normoxia and hypoxia were identified with silver staining ()). The nuclear proteins that increased in hypoxia were observed around 34 kD and were isolated from the gel and analyzed by mass spectrometry. The protein candidates were filtered according to protein score, which is the summation of a statistical score for individual peptides. The protein with the maximum possibility of interacting with NDRG1-OT1 (150–263 nt) was HNRNPA1. We first used bioinformatics tools to predict the docking between NDRG1-OT1 (150–263 nt) and HNRNPA1 ()). The 3D protein structure of HNRNPA1 was modeled by Phyre2 [Citation35]. The docking was predicted by HDOCK [Citation36]. The docking score, based on predicted values of the free energy of protein-ligand binding, indicated binding between NDRG1-OT1 (150–263 nt) and HNRNPA1, which was further validated by anti-HNRNPA1 immunoblotting ()). The results of western blotting showed that more HNRNPA1 interacted with NDRG1-OT1 (150–263 nt) under hypoxia ()).
Figure 3. The second quarter fragment (150–263 nt) represses NDRG1 by increasing the binding affinity of HNRNPA1 under hypoxia. (a) Gel electrophoresis of nuclear proteins after RNA pull-down assays. Nuclear proteins were extracted from MCF-7 cells growing in hypoxia for 24 h or normoxia. Biotin-labeled NDRG1-OT1 (150–263 nt) was used as the bait to pull down interacting proteins. Total nuclear proteins were visualized with silver staining. Differentially expressed proteins were isolated from the gel (area indicated by the closed bracket) and analyzed by mass spectrometry. (b) Bioinformatics prediction of docking between NDRG1-OT1 (150–263 nt) and HNRNPA1 (green). Protein 3D structure of HNRNPA1 was modeled by Phyre2 [Citation35]. The docking was predicted by HDOCK [Citation36]. nt: nucleotides. (c) Western blotting of HNRNPA1 to validate the results of pull-down assays and mass spectrometry analysis. Western blot (d) and quantification (e) of HNRNPA1 in MCF-7 cells transfected with NDRG1-OT1 plasmid. Internal control: TUBA1B. The relative expression level was normalized to empty control. (f) Luciferase activity of NDRG1 promoter activity in the absence of HNRNPA1. HEK293T cells treated with CoCl2 were co-transfected with Firefly luciferase and the second quarter fragment (150–263 nt) in the absence/presence of si-HNRNPA1 for 24 h. The results shown are the means ± SDs of at least 3 separate experiments. *: P < 0.05.
![Figure 3. The second quarter fragment (150–263 nt) represses NDRG1 by increasing the binding affinity of HNRNPA1 under hypoxia. (a) Gel electrophoresis of nuclear proteins after RNA pull-down assays. Nuclear proteins were extracted from MCF-7 cells growing in hypoxia for 24 h or normoxia. Biotin-labeled NDRG1-OT1 (150–263 nt) was used as the bait to pull down interacting proteins. Total nuclear proteins were visualized with silver staining. Differentially expressed proteins were isolated from the gel (area indicated by the closed bracket) and analyzed by mass spectrometry. (b) Bioinformatics prediction of docking between NDRG1-OT1 (150–263 nt) and HNRNPA1 (green). Protein 3D structure of HNRNPA1 was modeled by Phyre2 [Citation35]. The docking was predicted by HDOCK [Citation36]. nt: nucleotides. (c) Western blotting of HNRNPA1 to validate the results of pull-down assays and mass spectrometry analysis. Western blot (d) and quantification (e) of HNRNPA1 in MCF-7 cells transfected with NDRG1-OT1 plasmid. Internal control: TUBA1B. The relative expression level was normalized to empty control. (f) Luciferase activity of NDRG1 promoter activity in the absence of HNRNPA1. HEK293T cells treated with CoCl2 were co-transfected with Firefly luciferase and the second quarter fragment (150–263 nt) in the absence/presence of si-HNRNPA1 for 24 h. The results shown are the means ± SDs of at least 3 separate experiments. *: P < 0.05.](/cms/asset/b63ab363-a48a-47f3-b088-0811c27535a5/krnb_a_1553480_f0003_oc.jpg)
Next, since more HNRNPA1 could be captured in hypoxia using NDRG1-OT1 (150–263 nt) as bait, we further investigated whether this phenomenon was due to higher amounts of HNRNPA1 or better binding activity between HNRNPA1 and NDRG1-OT1 (150–263 nt). As shown in ,, overexpression of NDRG1-OT1 (150–263 nt) did not increase the amount of HNRNPA1, suggesting that the increase in HNRNPA1 captured in hypoxia was due to improved binding activity to NDRG1-OT1 (150–263 nt).
Lastly, to further prove that HNRNPA1 participates in the inhibition of NDRG1, four siRNAs against HNRNPA1 were designed to knock down HNRNPA1. To evaluate the efficacy of si-HNRNPA1, expression levels of HNRNPA1 were measured by qRT-PCR after transfecting different amounts of si-HNRNPA1 into MCF-7 cells. We found that transfecting 25 nM si-HNRNPA1 for 24 h could significantly decrease HNRNPA1 expression at both mRNA and protein levels (data not shown). Therefore, luciferase reporter assays were performed with HEK293T cells co-transfected with NDRG1-OT1 (150–263 nt) and 25 nM si-HNRNPA1. The results showed that si-HNRNPA1 relieved the repression of NDRG1 promoter activity by NDRG1-OT1 (150–263 nt) and the luciferase activity returned to the level of empty control ()), confirming that NDRG1-OT1 (150–263 nt) inhibits NDRG1 promoter activity by recruiting HNRNPA1.
The third quarter fragment (264–392 nt) increases NDRG1 promoter activity by recruiting hif-1α
Since HIF-1α up-regulated NDRG1 expression through binding to its HRE sequence, CGTG, in the NDRG1 promoter [Citation37], we hypothesized that the third quarter fragment (264–392 nt) of NDRG1-OT1 may function as a scaffold to increase the binding of HIF-1α to NDRG1 and enhance NDRG1 promoter activity. To test this hypothesis, we mutated the HRE-binding sequence of NDRG1-OT1 (264–392 nt) to GTAC and performed the luciferase reporter assays. As shown in ), overexpression of the mutant version (312_315CGTG>GTAC) of NDRG1-OT1 (264–392 nt) could no longer boost NDRG1 promoter activity, but a benign mutation at a non-HRE site (295_298TCCA>AGGT) did not reduce NDRG1 promoter activity. Bioinformatics-based prediction of docking also showed less affinity (higher free energy) between HIF-1α and the NDRG1-OT1 third quarter mutant (312_315CGTG>GTAC) ()).
Figure 4. The third quarter fragment (264–392 nt) increases NDRG1 promoter activity by recruiting HIF-1α. (a) Luciferase expression via NDRG1 promoter activity in the absence of the HRE sequence (CGTG) at 312–315 nt. Mutation at 295–298 nt and antisense oligonucleotide (AS) are positive and negative controls, respectively. HEK293T cells treated with CoCl2 were co-transfected with the luciferase vectors, NDRG1-OT1 (264–392 nt), and NDRG1-OT1 mutants. (b) Bioinformatics prediction of docking between HIF-1α (green) and NDRG1-OT1 (264–392 nt) as well as NDRG1-OT1 mutants. (c) Relative expression levels of NDRG1-OT1 (264–392 nt) after immunoprecipitation by antibody against HIF-1α. MCF-7 cells overexpressed NDRG1-OT1 (264–392 nt) and the HIF-1α P402A/P564A mutant, which is resistant to VHL-mediated ubiquitination and degradation. Relative expression of NDRG1-OT1 (264–392 nt) was measured by qRT-PCR. The results shown are the means ± SDs of at least 3 separate experiments. *: P < 0.05.
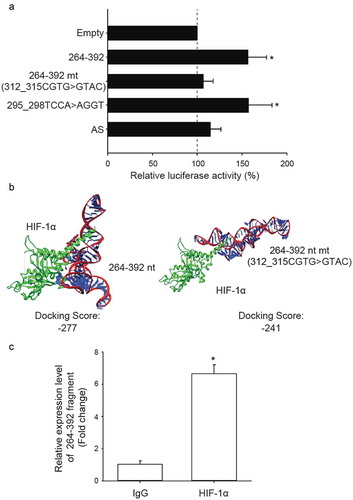
Furthermore, RNA immunoprecipitation was conducted using antibodies against HIF-1α in MCF-7 cells overexpressing NDRG1-OT1 (264–392 nt) and HIF-1α P402A/P564A mutant, which is resistant to VHL-mediated ubiquitination and degradation. The purified RNA interacting with HIF-1α was measured by qRT-PCR. The results showed that more NDRG1-OT1 (264–392 nt) was measured after immunoprecipitation by HIF-1α antibody ()), suggesting that NDRG1-OT1 (264–392 nt) increased NDRG1 promoter activity by interacting with HIF-1α.
The fourth quarter fragment (393–508 nt) represses NDRG1 promoter activity by down-regulation of KHSRP under hypoxia
To identify the protein-binding partners of NDRG1-OT1 (393–508 nt), RNA pull-down assays using biotin-labeled NDRG1-OT1 (393–508 nt) as the probe were performed. The different amounts of nuclear proteins interacting with NDRG1-OT1 (393–508 nt) in normoxia versus hypoxia were identified using silver staining. The nuclear proteins that decreased in hypoxia were observed between 95 and 72 kDa and were isolated and analyzed by mass spectrometry ()). Among the protein candidates, KHSRP had the maximum possibility of binding to NDRG1-OT1 (393–508 nt) in response to changes in O2 concentration, which was also shown in the bioinformatics-based prediction of docking between NDRG1-OT1 (393–508 nt) and KHSRP ()). The results of western blotting also validated that KHSRP binding to NDRG1-OT1 (393–508 nt) was lower in hypoxia ()).
Figure 5. The fourth quarter fragment (393–508 nt) represses NDRG1 promoter activity by down-regulation of KHSRP under hypoxia. (a) Gel electrophoresis of nuclear proteins after RNA pull-down assays. The experimental conditions were the same as in . (b) Bioinformatics prediction of docking between NDRG1-OT1 (393–508 nt) and KHSRP (green). Protein 3D structure of KHSRP was modeled by Phyre2 [Citation35]. The docking was predicted by HDOCK [Citation36]. nt: nucleotides. (c) Western blotting of KHSRP to validate the results of pull-down assays and mass spectrometry analysis. (d) Luciferase expression via NDRG1 promoter activity in cells overexpressing KHSRP. HEK293T cells treated with CoCl2 were co-transfected with the Firefly luciferase and the fourth quarter fragment (393–508 nt) in the absence/presence of KHSRP for 24 h. The results shown are the means ± SDs of at least 3 separate experiments. *: P < 0.05.
![Figure 5. The fourth quarter fragment (393–508 nt) represses NDRG1 promoter activity by down-regulation of KHSRP under hypoxia. (a) Gel electrophoresis of nuclear proteins after RNA pull-down assays. The experimental conditions were the same as in Figure 2. (b) Bioinformatics prediction of docking between NDRG1-OT1 (393–508 nt) and KHSRP (green). Protein 3D structure of KHSRP was modeled by Phyre2 [Citation35]. The docking was predicted by HDOCK [Citation36]. nt: nucleotides. (c) Western blotting of KHSRP to validate the results of pull-down assays and mass spectrometry analysis. (d) Luciferase expression via NDRG1 promoter activity in cells overexpressing KHSRP. HEK293T cells treated with CoCl2 were co-transfected with the Firefly luciferase and the fourth quarter fragment (393–508 nt) in the absence/presence of KHSRP for 24 h. The results shown are the means ± SDs of at least 3 separate experiments. *: P < 0.05.](/cms/asset/dbcf0209-ca04-4eb1-a4d2-a499e6799d94/krnb_a_1553480_f0005_oc.jpg)
To determine whether KHSRP repressed or inactivated NDRG1 promoter activity, the NDRG1 promoter-driven luciferase assays were performed in HEK293T cells co-overexpressing NDRG1-OT1 (393–508 nt) and KHSRP. The results showed that overexpression of KHSRP could eliminate the down-regulatory effect of NDRG1-OT1 (393–508 nt) on NDRG1 promoter activity ()), implying that the inhibitory effect of NDRG1-OT1 (393–508 nt) on NDRG1 promoter activity was due to down-regulation of KHSRP in hypoxia.
Lastly, we used bioinformatics tools to perform docking between NDRG1-OT1 and HNRNPA1, HIF-1α, and KHSRP. As shown in ), HNRNPA1 was predicted to bind to the second quarter fragment (green), HIF-1α to the third quarter fragment (red), and KHSRP to the fourth quarter fragment (cyan). Also, full length biotin-labeled NDRG1-OT1 (1–508 nt) was used as a probe to pull down all interacting proteins under hypoxia. The results of the western blot were similar to those using different fragments of NDRG1-OT1 as probes; namely, NDRG1-OT1 increased the binding with HNRNPA1 and HIF-1α and decreased the interaction with HKSRP ()). We propose a working model based on these results ()) and suggest that the second quarter fragment (150–263 nt) of NDRG1-OT1 represses NDRG1 by recruiting HNRNPA1; the third quarter fragment (264–392 nt) activates NDRG1 by recruiting HIF-1α; and the fourth quarter fragment (393–508 nt) inactivates NDRG1 via down-regulation of KHSRP under hypoxia.
Figure 6. Verification of NDRG1-OT1 interaction with HNRNPA1, HIF-1α, and KHSRP using RNA pull-down assays followed by western blotting. (a) Bioinformatics prediction of docking between NDRG1-OT1 and HNRNPA1, HIF-1α, and KHSRP, respectively. The 3D structure of NDRG1-OT1 was modeled by RNAComposer [Citation52]. Color corresponds to each fragment. 2nd quarter: green; 3rd quarter: red; 4th quarter: cyan. The 3D structure of proteins (purple) was modeled by Phyre2 [Citation35]. The docking prediction was performed by HDOCK [Citation36]. (b) Western blots of HNRNPA1, HIF-1α, and KHSRP after RNA pull-down assays using full length (1–508 nt) NDRG1-OT1 as the probe. (c) Proposed model of NDRG1-OT1 interacting with various proteins to regulate the transcription of NDRG1 under hypoxia.
![Figure 6. Verification of NDRG1-OT1 interaction with HNRNPA1, HIF-1α, and KHSRP using RNA pull-down assays followed by western blotting. (a) Bioinformatics prediction of docking between NDRG1-OT1 and HNRNPA1, HIF-1α, and KHSRP, respectively. The 3D structure of NDRG1-OT1 was modeled by RNAComposer [Citation52]. Color corresponds to each fragment. 2nd quarter: green; 3rd quarter: red; 4th quarter: cyan. The 3D structure of proteins (purple) was modeled by Phyre2 [Citation35]. The docking prediction was performed by HDOCK [Citation36]. (b) Western blots of HNRNPA1, HIF-1α, and KHSRP after RNA pull-down assays using full length (1–508 nt) NDRG1-OT1 as the probe. (c) Proposed model of NDRG1-OT1 interacting with various proteins to regulate the transcription of NDRG1 under hypoxia.](/cms/asset/51be83c2-db4f-4436-8489-b77a7f2eb409/krnb_a_1553480_f0006_oc.jpg)
Discussion
LncRNA NDRG1-OT1 was found to be significantly up-regulated in hypoxia and inhibited the expression of NDRG1 in several breast cancer cell lines [Citation33]. Here, we further discovered that although the overall effect of NDRG1-OT1 on NDRG1 was inhibitory, different fragments of NDRG1-OT1 played various roles in regulating the target gene via recruiting different proteins. Specifically, the second quarter fragment (150–263 nt) and fourth quarter fragment (393–508 nt) of NDRG1-OT1 down-regulated the promoter activity of NDRG1 by increasing the binding of HNRNPA1 and down-regulation of KHSRP, respectively. Conversely, the third quarter fragment (264–392 nt) recruited HIF-1α to increase NDRG1 promoter activity. Our findings revealed a novel mechanism of lncRNA NDRG1-OT1 in regulating its target gene, NDRG1.
NDRG1-OT1 was shown to down-regulate NDRG1 at both the protein and mRNA levels [Citation33]. At the protein level, NDRG1-OT1 destabilizes NDRG1 by promoting ubiquitin-mediated proteolysis [Citation33]. At the mRNA level, we only knew that the stability of NDRG1 mRNA was not affected by overexpressing NDRG1-OT1 [Citation33]. In this follow-up study, we used genetic manipulation and luciferase reporter assays to show that transcriptional inhibition is the major regulatory mechanism. A similar mechanism has been observed for other lncRNAs. For example, APTR repressed the CDKN1A/p21 promoter to increase cell proliferation [Citation38], and the lncRNA Xist activated HDAC3 to suppress the transcriptional activity of SHARP [Citation39].
In order to identify proteins that participated in the transcriptional inhibition of NDRG1, we used biotin-labeled NDRG1-OT1 (150–263 nt) probes to pull down the interacting proteins. HNRNPA1 was identified by mass spectrometry and validated by western blotting. HNRNPA1 is an inhibitory protein known to suppress pre-mRNA splicing by blocking access of the spliceosome to the poly-pyrimidine tract [Citation40,Citation41]. Knockdown of HNRNPA1 can significantly reduce the expression of CD44 isoforms and decrease cancer invasion in breast cancer [Citation41]. A similar mechanism was reported for the lncRNA NEAT1, which suppressed ADARB2 by interacting with NEAT1-binding paraspeckle protein splicing factor [Citation42]. Although HNRNPA1 repressed NDRG1 promoter activity, the binding sites of HNRNPA1 could not be identified in the NDRG1 promoter, indicating that other unidentified proteins recruited by NDRG1-OT1 still need to be explored.
HIF-1α was shown to improve NDRG1 expression at both RNA and protein levels by targeting the HRE site, CGTG, in the NDRG1 promoter [Citation37,Citation43,Citation44]. In this study, we discovered that HIF-1α can also bind to single stranded NDRG1-OT1 at the HRE site. The NDRG1 promoter could no longer be activated once the HRE site was mutated ()), indicating that the third quarter NDRG1-OT1 fragment (264–392 nt) could provide a binding site and function as a scaffold for recruiting HIF-1α to up-regulate the expression of its downstream genes. Other lncRNAs have also been reported to interact with HIF-1α to improve expression of downstream genes, such as LncHIFCAR/MIR31HG, a HIF-1α co-activator [Citation45].
Lastly, an approach similar to that used to identify HNRNPA1 interacting with the second quarter NDRG1-OT1 (150–263 nt) fragment was also used to identify the interacting proteins associated with the fourth quarter fragment. Biotin-labeled NDRG1-OT1 (393–508 nt) probes were used to pull down the interacting proteins. KHSRP was identified by mass spectrometry and validated by western blotting (). KHSRP was reported to regulate mRNA decay by binding to AU-rich elements of 3ʹ untranslated regions [Citation46]. Recent studies showed that KHSRP improved cell proliferation, accelerated G1/S transition in the cell cycle, and was up-regulated in most breast cancer tissue and cell lines [Citation47]. In addition, KHSRP directly interacted with the lncRNA H19 and promoted mRNA decay of target genes [Citation48]. In this study, we discovered that overexpression of KHSRP could rescue the inhibitory effect of NDRG1-OT1 (393–508 nt), suggesting down-regulation of KHSRP might lead to inactivation of the NDRG1 promoter.
Although the second (150–263 nt) and fourth (393–508 nt) quarter fragments of NDRG1-OT1 repressed NDRG1 promoter activity by interacting with different proteins, the interaction between HNRNPA1 and KHSRP remains to be determined. Past research showed that KHSRP interacts with the hnRNP family. For example, KHSRP and hnRNPA2B1 responded together to BRCA1 loss [Citation49]. Likewise, KHSRP and hnRNPH1 were shown to regulate the expression of human rpL3 [Citation50].
In summary, this is the first paper to reveal that different fragments of the same lncRNA, NDRG1-OT1, could produce opposite effects within a single target gene, NDRG1. These results shed light on how lncRNA regulates gene expression to assist cells executing complex and coordinated responses to environmental cues.
Materials and methods
Cell culture and treatments
MCF-7 breast cancer cells and HEK293T human embryonic kidney cells were cultured in Dulbecco’s modified Eagle’s medium (DMEM) (GIBCO, Carlsbad, CA, USA) with 10% fetal bovine serum (FBS) (GIBCO) and 1% penicillin-streptomycin-amphotericin solution (Biological Industries, Beit-Haemek, Israel), and incubated at 37 °C in a humidified atmosphere with 5% CO2. To mimic hypoxic conditions, cells were treated with 300 μM cobalt chloride (CoCl2) (Sigma, St. Louis, MO, USA).
Plasmid DNA construction and transfection
To construct different fragments of plasmid pcDNA3.1+-NDRG1-OT1, the nucleotide (nt) fragments 1–149, 150–263, 1–263, and 264–508, cut by BamH1 (New England BioLabs, Ipswich, MA, USA) and EcoR1 (New England BioLabs) from plasmid pcDNA3.1+-NDRG1-OT1, were inserted into pcDNA3.1+ plasmid (Addgene, USA). Additionally, fragments 264–392 and 393–508 were synthesized and inserted between EcoR1 (New England BioLabs) and EcoR5 (New England BioLabs) in pcDNA3.1+. MCF-7 cells were transfected with the fragments of pcDNA3.1+-NDRG1-OT1 or pcDNA3.1+ empty vector using jetPRIME transfection reagent (Polyplus-transfection, Illkirch, France) according to the manufacturer’s protocol.
RNA extraction and quantitative RT-PCR
Total RNA was extracted by TRIpure reagent (Roche Diagnostics, Branchburg, NJ, USA) according to the manufacturer’s protocol. One μg of total RNA was reverse-transcribed to cDNA using the High-Capacity cDNA Reverse Transcription Kit (Applied Biosystems, Carlsbad, CA). Five percent of each cDNA was used as the template for real-time PCR with FastStart Universal SYBR Green Master (Roche), with primers from . The reaction was executed with an ABI Step One plus system (Applied Biosystems). Each reaction was triplicated, and data were normalized to 18s rRNA.
Table 1. The primers for quantitative RT-PCR.
Luciferase reporter assay
The plasmids containing luciferase (pGL4.74/NDRG1/IRES/Luc/Zeo) were constructed by inserting the NDRG1 promoter (−800 ~ +353 bp) into pGL4.74/IRES/Luc/Zeo [Citation29], and used for luciferase reporter assays. HEK293T cells (8 x 10 [Citation4] cells) were seeded in 24-well plates. After seeding overnight, the cells were cultured under normoxic or CoCl2 conditions, and were co-transfected with 500 ng of different NDRG1-OT1 fragments and 25 ng of reporter constructs or transfection control (pGL4.74 [Rluc/TK] plasmid) for 24 h. After the cells were lysed, the promoter activities were measured using the Dual-Glo luciferase reporter assay system (Promega, Madison, WI, USA).
Nucleus/cytosol fractionation
MCF-7 cells (1.6 x 10 [Citation7] cells) were seeded on a 15-cm dish and cultured under normoxia (21% O2; 5% CO2) or hypoxia (0.5% O2; 5% CO2) after seeding overnight. MCF-7 cells were scraped down and soaked in hypotonic buffer [10 mM 4-(2-hydroxyethyl)-1-piperazineethanesulfonic acid (HEPES), 10 mM KCl, 1 mM ethylenediaminetetraacetic acid (EDTA), and 0.6% Triton X-100] for 30 min, then centrifuged at 14,000 rpm for 20 min. After removing cytosolic proteins in the supernatant, hypertonic buffer [10 mM HEPES, 10 mM KCl, 1 mM EDTA, and 20% glycerol] was added to the centrifuge tube. The nuclear membrane was then broken by sonication (5 seconds at 20% vibrating frequency, 3 times). Nuclear protein was separated by centrifugation at 14,000 rpm for 20 min.
RNA pull-down assay
The RNA pull-down assay was performed using the PierceTM Magnetic RNA-Protein Pull-Down Kit (Thermo, USA #20164). Streptavidin beads were mixed with biotin-labeled NDRG1-OT1 in RNA capture buffer for 30 min. Next, after the supernatant was removed, the mix buffer containing nuclear protein (2 mg/mL), protein-RNA binding buffer, and 50% glycerol was added. After reaction for 1 h, the beads were heated and the bead-binding proteins were measured by immunoblotting.
Mass spectrometry
The differential amounts of proteins visualized by silver-stained gels were analyzed by mass spectrometry in the Proteomics and Protein Function core lab, Center of Genomic Medicine, National Taiwan University. The protein score is the summation of a statistical score for individual peptides in that protein to evaluate how well the experimental data match the database sequence. The data were exported by LC-MS software (Thermo, USA).
Bioinformatics prediction of docking
RNA 2D structure was provided by the NONCODE database with accession number NONHSAT129220.2 (http://www.noncode.org) [Citation51]. The 3D structure of the whole RNA transcript of NDRG1_OT1 (up to 500 nucleotides) was modeled by RNAComposer (http://rnacomposer.cs.put.poznan.pl) [Citation52] and that of each RNA fragment was predicted by SimRNA [Citation34].
The sequences of the three target proteins, namely HNRNPA1, KHSRP, and HIF1A, were obtained from the UniProt database (https://www.uniprot.org) with accession numbers P09651, Q92945, and Q16665, respectively [Citation53]. The protein 3D structures were then modeled by Protein Homology/analogY Recognition Engine V2.0 (http://www.sbg.bio.ic.ac.uk/phyre2) [Citation35]. Based on the alignment coverage and confidence level, the most likely correct 3D structure of each protein was selected.
The molecular docking prediction was done on the HDOCK web server (http://hdock.phys.hust.edu.cn) [Citation36]. Each docking cluster model was selected based on a combination of the correctly predicted binding site and the provided docking score. UCSF Chimera software was used for 3D structure visualization of the docked protein and RNA [Citation54]. All results were generated based on the default setting of each program.
Western blots
To compare nuclear protein expression in normoxia and hypoxia, the protein lysate was separated by 12% polyacrylamide gel electrophoresis and visualized by silver staining. In western immunoblotting assays, the target proteins were separated by 12% SDS-PAGE and transferred to a PVDF membrane (Bio-Rad Laboratories, Hercules, CA, USA). The membranes were blocked in TBST blocking buffer (Arrowtec, Taipei, Taiwan) for 10 min and then hybridized to primary antibodies against NDRG1 (Abcam, England), heterogeneous nuclear ribonucleoprotein A1 (HNRNPA1; GeneTex, Irvine, CA, USA), HIF-1α (GeneTex), KH-type splicing regulatory protein (KHSRP; GeneTex), or TUBA1B (GeneTex). After immunoblotting, the membranes were washed in Tris-buffered saline (Omics Bio, Taiwan) with Tween 20 and reacted with horseradish peroxidase-conjugated goat anti-rabbit IgG or rabbit anti-mouse IgG (GeneTex). The protein bands were visualized using an enhanced chemiluminescence system (Millipore, Billerica, MA, USA).
Site-directed mutagenesis
The HIF-1α core binding site (CGTG) of the HRE sequence was identified at 312–315 nt of NDRG1-OT1. To mutate the nucleotides CGTG to GTAC, two primer pairs were designed as follows: 5ʹ-GTAACGAGTCATTGCCTCTGTACCACCTGGAAGGCTGGACT-3ʹ (forward) and 5ʹ-AGTCCAGCCTTCCAGGTGGGTACAGAGGCAATGACTCGTTAC-3ʹ (reverse). The mutation site was in the middle of the primer (underline) flanked with 19 bases of correct sequence. The mutation experiment was performed using a QuikChange ll Site-Directed Mutagenesis kit (Agilent, USA, #200523). The mutated sequences were validated by Sanger sequencing.
RNA immunoprecipitation assay
RNA immunoprecipitation was performed by the Magna RIPTM RNA-Binding Protein Immunoprecipitation Kit (Millipore, USA #17–700) according to the manufacturer’s instructions. HEK293T cells (1.5 x 10 [Citation7] cells) were seeded in a 15-cm dish. After seeding overnight, cells were co-transfected with 40 μg of NDRG1-OT1 (264–392 bp) and HIF-1α P402A/P564A-pcDNA3 (Addgene, USA), a HIF-1α mutant resistant to PHD2-mediated hydroxylation and VHL-mediated ubiquitination/degradation, for 24 h. Next, total RNA was extracted by RNA immunoprecipitation (RIP) lysis buffer containing a protease inhibitor cocktail. The RNA lysis sample and HIF-1α bound beads were mixed into immunoprecipitation buffer overnight. The immunoprecipitation buffer was composed of RIP wash buffer, 0.5 mM EDTA, and RNase inhibitor. Then, the supernatant was removed and mixed with proteinase buffer at 55 °C for 30 min. After removal of the supernatant, the amount of captured RNA was measured by qRT-PCR.
RNA silencing
The SMARTpool (Dharmacon, Lafayette, CO, USA) targeted HNRNPA1 mRNA was composed of four small interfering (si) RNA sequences: GGAAUUACAACAAUCAGUC, AAUGACAACUUCGGUCGUG, AGGGAUUACCCAAGCAAAA, and AAACCUUGGUGUAGUUGAA. The MCF-7 cells were transfected with the SMARTpool siRNA or pcDNA3.1+ empty vector using DharmaFECT 1 transfection reagent (Dharmacon) according to the manufacturer’s protocol. After 48 h, the transfection medium was removed and the total RNA and protein were extracted. RNA expression was measured by qRT-PCR and protein expression was examined by immunoblotting assays.
Statistical analysis
All results were reported as the means ± SDs from at least 3 independent experiments. The differences between each group were analyzed using Student’s t test. P < 0.05 was considered significant.
Author contributions
CCY and LCL conceived and designed the experiments. CCY, JLL, NNP, and YCC performed the experiments. CCY and LCL analyzed the data. MHT, EYC, LPC, and LCL contributed reagents, materials, and/or analysis tools. CCY and LCL wrote the paper. All authors reviewed the manuscript.
Acknowledgments
We thank Melissa Stauffer for editorial assistance.
Disclosure statement
The authors declare that they have no competing financial interests.
Additional information
Funding
References
- Curran CS, Keely PJ. Breast tumor and stromal cell responses to TGF-beta and hypoxia in matrix deposition. Matrix Biol. 2013;32:95–105.
- Gulledge CJ, Dewhirst MW. Tumor oxygenation: a matter of supply and demand. Anticancer Res. 1996;16:741–749.
- Masson N, Ratcliffe PJ. Hypoxia signaling pathways in cancer metabolism: the importance of co-selecting interconnected physiological pathways. Cancer Metab. 2014;2:3.
- Dong Y, Liang G, Yuan B, et al. MALAT1 promotes the proliferation and metastasis of osteosarcoma cells by activating the PI3K/Akt pathway. Tumor Biol. 2015;36:1477–1486.
- Da Motta LL, Ledaki I, Purshouse K, et al. The BET inhibitor JQ1 selectively impairs tumour response to hypoxia and downregulates CA9 and angiogenesis in triple negative breast cancer. Oncogene. 2017;36:122–132.
- Bae KM, Dai Y, Vieweg J, et al. Hypoxia regulates SOX2 expression to promote prostate cancer cell invasion and sphere formation. Am J Cancer Res. 2016;6:1078–1088.
- Knowles HJ, Harris AL. Hypoxia and oxidative stress in breast cancer. Hypoxia and tumourigenesis. Breast Cancer Res. 2001;3:318–322.
- Wang W, He YF, Sun QK, et al. Hypoxia-inducible factor 1alpha in breast cancer prognosis. Clin Chim Acta. 2014;428:32–37.
- Volm M, Koomagi R. Hypoxia-inducible factor (HIF-1) and its relationship to apoptosis and proliferation in lung cancer. Anticancer Res. 2000;20:1527–1533.
- Zhang W, Shi X, Peng Y, et al. HIF-1alpha promotes epithelial-mesenchymal transition and metastasis through direct regulation of ZEB1 in colorectal cancer. PLoS One. 2015;10:e0129603.
- He Q, Gao Z, Yin J, et al. Regulation of HIF-1{alpha} activity in adipose tissue by obesity-associated factors: adipogenesis, insulin, and hypoxia. Am J Physiol Endocrinol Metab. 2011;300:E877–85.
- Ren T, Zhang W, Liu X, et al. Discoidin domain receptor 2 (DDR2) promotes breast cancer cell metastasis and the mechanism implicates epithelial-mesenchymal transition programme under hypoxia. J Pathol. 2014;234:526–537.
- Bol GM, Raman V, van der Groep P, et al. Expression of the RNA helicase DDX3 and the hypoxia response in breast cancer. PLoS One. 2013;8:e63548.
- Perkel JM. Visiting “noncodarnia”. Biotechniques. 2013;54:301–304.
- Pan JJ, Xie XJ, Li X, et al. Long non-coding RNAs and drug resistance. Asian Pac J Cancer Prev. 2015;16:8067–8073.
- Wang Y, Liu X, Zhang H, et al. Hypoxia-inducible lncRNA-AK058003 promotes gastric cancer metastasis by targeting gamma-synuclein. Neoplasia. 2014;16:1094–1106.
- Jing L, Yuan W, Ruofan D, et al. HOTAIR enhanced aggressive biological behaviors and induced radio-resistance via inhibiting p21 in cervical cancer. Tumor Biol. 2015;36:3611–3619.
- Ruan X, Li P, Cangelosi A, et al. A long non-coding RNA, lncLGR, regulates hepatic glucokinase expression and glycogen storage during fasting. Cell Rep. 2016;14:1867–1875.
- Kallen AN, Zhou XB, Xu J, et al. The imprinted H19 lncRNA antagonizes let-7 microRNAs. Mol Cell. 2013;52:101–112.
- Gong C, Popp MW, Maquat LE. Biochemical analysis of long non-coding RNA-containing ribonucleoprotein complexes. Methods. 2012;58:88–93.
- Xu TP, Liu XX, Xia R, et al. SP1-induced upregulation of the long noncoding RNA TINCR regulates cell proliferation and apoptosis by affecting KLF2 mRNA stability in gastric cancer. Oncogene. 2015;34:5648–5661.
- Gomez-Maldonado L, Tiana M, Roche O, et al. EFNA3 long noncoding RNAs induced by hypoxia promote metastatic dissemination. Oncogene. 2015;34:2609–2620.
- Zhang S, Wang W, Liu G, et al. Long non-coding RNA HOTTIP promotes hypoxia-induced epithelial-mesenchymal transition of malignant glioma by regulating the miR-101/ZEB1 axis. Biomed Pharmacother. 2017;95:711–720.
- Luo F, Liu X, Ling M, et al. The lncRNA MALAT1, acting through HIF-1alpha stabilization, enhances arsenite-induced glycolysis in human hepatic L-02 cells. Biochim Biophys Acta-Gen Subj. 2016;1862:1685–1695.
- Fang BA, Kovacevic Z, Park KC, et al. Molecular functions of the iron-regulated metastasis suppressor, NDRG1, and its potential as a molecular target for cancer therapy. Biochim Biophys Acta. 2014;1845:1–19.
- Kurdistani SK, Arizti P, Reimer CL, et al. Inhibition of tumor cell growth by RTP/rit42 and its responsiveness to p53 and DNA damage. Cancer Res. 1998;58:4439–4444.
- Angst E, Dawson DW, Stroka D, et al. N-myc downstream regulated gene-1 expression correlates with reduced pancreatic cancer growth and increased apoptosis in vitro and in vivo. Surgery. 2011;149:614–624.
- Lu WJ, Chua MS, So SK. Suppressing N-Myc downstream regulated gene 1 reactivates senescence signaling and inhibits tumor growth in hepatocellular carcinoma. Carcinogenesis. 2014;35:915–922.
- Li EY, Huang WY, Chang YC, et al. Aryl hydrocarbon receptor activates NDRG1 transcription under hypoxia in breast cancer cells. Sci Rep. 2016;6:20808.
- Redmond KL, Crawford NT, Farmer H, et al. T-box 2 represses NDRG1 through an EGR1-dependent mechanism to drive the proliferation of breast cancer cells. Oncogene. 2010;29:3252–3262.
- Luo EC, Chang YC, Sher YP, et al. MicroRNA-769-3p down-regulates NDRG1 and enhances apoptosis in MCF-7 cells during reoxygenation. Sci Rep. 2014;4:5908.
- Wright MW. A short guide to long non-coding RNA gene nomenclature. Hum Genomics. 2014;8:7.
- Lin HC, Yeh CC, Chao LY, et al. The hypoxia-responsive lncRNA NDRG-OT1 promotes NDRG1 degradation via ubiquitin-mediated proteolysis in breast cancer cells. Oncotarget. 2018;9:10470–10482.
- Magnus M, Boniecki MJ, Dawson W, et al. SimRNAweb: a web server for RNA 3D structure modeling with optional restraints. Nucleic Acids Res. 2016;44:W315–W9.
- Kelley LA, Mezulis S, Yates CM, et al. The Phyre2 web portal for protein modeling, prediction and analysis. Nat Protoc. 2015;10:845.
- Yan Y, Zhang D, Zhou P, et al. HDOCK: a web server for protein–protein and protein–DNA/RNA docking based on a hybrid strategy. Nucleic Acids Res. 2017;45:W365–W73.
- Wang Q, Li LH, Gao GD, et al. HIF-1alpha up-regulates NDRG1 expression through binding to NDRG1 promoter, leading to proliferation of lung cancer A549 cells. Mol Biol Rep. 2013;40:3723–3729.
- Negishi M, Wongpalee SP, Sarkar S, et al. A new lncRNA, APTR, associates with and represses the CDKN1A/p21 promoter by recruiting polycomb proteins. PLoS One. 2014;9:e95216.
- McHugh CA, Chen CK, Chow A, et al. The Xist lncRNA interacts directly with SHARP to silence transcription through HDAC3. Nature. 2015;521:232–236.
- Takimoto M, Tomonaga T, Matunis M, et al. Specific binding of heterogeneous ribonucleoprotein particle protein K to the human c-myc promoter, in vitro. J Biol Chem. 1993;268:18249–18258.
- Loh TJ, Moon H, Cho S, et al. CD44 alternative splicing and hnRNP A1 expression are associated with the metastasis of breast cancer. Oncol Rep. 2015;34:1231–1238.
- Hirose T, Virnicchi G, Tanigawa A, et al. NEAT1 long noncoding RNA regulates transcription via protein sequestration within subnuclear bodies. Mol Biol Cell. 2014;25:169–183.
- Lok CN, Ponka P. Identification of a hypoxia response element in the transferrin receptor gene. J Biol Chem. 1999;274:24147–24152.
- Kietzmann T, Roth U, Jungermann K. Induction of the plasminogen activator inhibitor-1 gene expression by mild hypoxia via a hypoxia response element binding the hypoxia-inducible factor-1 in rat hepatocytes. Blood. 1999;94:4177–4185.
- Shih JW, Chiang WF, Wu ATH, et al. Long noncoding RNA LncHIFCAR/MIR31HG is a HIF-1alpha co-activator driving oral cancer progression. Nat Commun. 2017;8:15874.
- Gherzi R, Lee KY, Briata P, et al. A KH domain RNA binding protein, KSRP, promotes ARE-directed mRNA turnover by recruiting the degradation machinery. Mol Cell. 2004;14:571–583.
- Wang YY, Gu XL, Wang C, et al. The far-upstream element-binding protein 2 is correlated with proliferation and doxorubicin resistance in human breast cancer cell lines. Tumor Biol. 2016;37:9755–9769.
- Giovarelli M, Bucci G, Ramos A, et al. H19 long noncoding RNA controls the mRNA decay promoting function of KSRP. Pnas. 2014;111:E5023–8.
- Santarosa M, Del Col L, Viel A, et al. BRCA1 modulates the expression of hnRNPA2B1 and KHSRP. Cell Cycle. 2010;9:4666–4673.
- Russo A, Catillo M, Esposito D, et al. Autoregulatory circuit of human rpL3 expression requires hnRNP H1, NPM and KHSRP. Nucleic Acids Res. 2011;39:7576–7585.
- Fang S, Zhang L, Guo J, et al. NONCODEV5: a comprehensive annotation database for long non-coding RNAs. Nucleic Acids Res. 2017;46:D308–D14.
- Popenda M, Szachniuk M, Antczak M, et al. Automated 3D structure composition for large RNAs. Nucleic Acids Res. 2012;40:e112–e.
- Consortium U. UniProt: the universal protein knowledgebase. Nucleic Acids Res. 2016;45:D158–D69.
- Pettersen EF, Goddard TD, Huang CC, et al. UCSF Chimera—a visualization system for exploratory research and analysis. J Comput Chem. 2004;25:1605–1612.