
ABSTRACT
Transcription initiation sites of Trp53 gene in mice were determined using the 5′RACE method. Based on sequence alignment of the 5′-terminal regions of p53 mRNA in mammals, the site for the most abundant transcript turned out to be essentially identical with that determined for human TP53 gene and slightly differed for the longest transcripts, in mice and humans. Secondary structures of the 5′ -terminal regions of the shorter, most abundant and the longest mouse transcripts were determined in vitro and the shorter transcript was also mapped in transfected mouse cells. For the first time, secondary structure models of the 5′ terminus of two mouse p53 mRNAs were proposed. Comparing these models with the conservativeness of the nucleotide sequence of the 5′-terminal region of mRNA in mouse and other mammals, the possible function of the selected structural domains of this region was discussed. To elucidate the translation mechanisms, the two studied mRNAs were translated in the presence of an increasing concentration of the cap analog. For the longest transcript, the data suggested that IRES element(s) was/were involved in translation initiation. Additionally, changes in p53 synthesis under genotoxic and endoplasmic reticulum stress conditions in mouse cells were analyzed.
Introduction
For a long time, the full-length p53 protein was believed to be the only product of TP53 gene expression. In 2002, the discovery of the N-truncated form of p53 lacking 39 amino acids, Δ40p53, marked the beginning of comprehensive systematic studies aimed to identify other isoforms of p53 and to understand their function in the cell [Citation1,Citation2]. Now, at least 13 isoforms of the human p53 protein are known whose expression results from the usage of various transcription promoters, alternative splicing and various translation initiation sites [Citation3–Citation5]. It has been noticed that the known p53 protein isoforms show tissue specificity and their expression levels vary depending on tissue type [Citation6]. What is extremely important, it seems that disturbance of the p53 isoforms expression plays a very important role in tumorigenesis [Citation5,Citation7,Citation8] cell differentiation [Citation9] and cell response to pathogens [Citation10].
Expression of different isoforms of human p53 protein is regulated at different levels: transcription of p53 mRNA variants and their stability in the cell, different synthesis efficiency of p53 isoforms and their posttranslational modification and degradation. It is believed that compared to transcriptional regulation, translational control of mRNAs existing in the cell allows for more rapid changes in the cellular concentrations of the encoded proteins [Citation11–Citation14]. In particular, this refers to p53 protein whose expression rapidly increases in response to stress induction. Initiation is the most highly regulated phase of translation. It has been shown that in the regulation of the expression of p53 protein and its major isoform Δ40p53 at the translational level, the 5′ non-coding regions of mRNA play a crucial role [Citation15–Citation19]. These regions are of various length due to different transcription initiation sites. They contain alternative AUG initiation codons and function as IRES elements governing cap-independent translation, which are particularly active upon stress conditions. Recently, in order to better understand the functioning of the 5′-terminal region of human p53 mRNA in translation, we have investigated variants of this region focusing on their structure and efficiency in promoting translation under normal and stress conditions [Citation20,Citation21].
Although the knowledge of human p53 is constantly increasing, there is still limited information on p53 mRNA transcripts in mice. This is unexpected taking into account that mouse is often used as a model organism in functional studies of p53. A spectacular observation is that mice devoid of the Trp53 gene are highly tumor prone [Citation22]. Strikingly, there is even no consensus in the literature about the initiation of Trp53 gene transcription. Early attempts to map the 5′ end of mouse p53 mRNA have proved inconclusive, likely due to the presence of a stable secondary structure within the 5′-untranslated region of the mRNA. Nevertheless, it has been suggested that the transcription initiation sites correspond to the 5′ non-coding region of 216 nt from the first AUG codon [Citation23,Citation24]. The experimental data have additionally suggested the 5′ non-coding regions of 156 nt and 112–114 nt. However, the presence of these transcripts was likely a consequence of specific folding of that region and preferential cleavages by nuclease S1 as well as termination of the reverse transcription reaction during analysis [Citation23]. In the GenBank data, Mus musculus mRNA for p53 (AB020317.1) comprises 101 non-coding nucleotides to the first AUG codon. In recently published data, mRNA constructs with 5′ non-coding region of 157 nt have been used [Citation25,Citation26]. These discrepancies concerning the 5′ non-coding region of mouse p53 mRNA are particularly bothering taking into account the very important role of the corresponding region of human p53 mRNA in the regulation of p53 expression at the translational level [Citation15,Citation16,Citation18–Citation21]. Thus, we were curious to know whether similar structural motifs exist in the human and mouse 5′ non-coding regions of p53 mRNA transcripts which could be responsible for the functioning of these regions.
In this study, we determined the transcription initiation sites for mouse Trp53 gene and characterized the secondary structures of the 5′-terminal regions of selected p53 mRNA transcripts. Secondary structure elements found in those regions were compared with those present in human p53 mRNAs. Based on the conservativeness of the nucleotide sequence of the 5′ non-coding regions in other organisms, the possible function of selected structural elements in interactions with some cellular proteins was discussed. Since in mouse p53 mRNA two potential AUG initiation codons are present at a short, 6-nucleotide distance, the problem from which codon the translation of full-length p53 occurs was also addressed. Finally, translation assays of mouse p53 mRNA were performed in both conditions: in vitro and in NIH3T3 cells and the results were compared with those obtained for its human counterpart.
Results and discussion
Transcription initiation sites of mouse Trp53 gene
In order to determine transcription initiation sites of mouse Trp53 gene, we performed 5′RACE experiment on total RNA isolated from mouse liver and thymus, and from 11-day-old mouse embryos. Subsequently, 29 clones derived from embryos and 20 clones from both liver and thymus were sequenced. The determined 5′ ends of transcripts were marked on the sequence of upstream region of the coding sequence of mouse p53 mRNA ( and Fig. S1 in Supplementary data). The numbers in the figure show how many clones corresponded to a particular sequence variant. It is worthy of note that in all the transcripts the first nucleotide of the AUG initiation codon is marked as 1 and all nucleotides in the 5′ direction are labeled with negative numbers ascending towards the 5′ end. In the transcripts’ names information about the length of their 5′ non-coding regions is included. In our studies, the second AUG codon from the 5′ end of mRNA is considered as the translation initiation site (this assumption is explained further in the text).
The 5′RACE data revealed that there are potentially several transcription initiation sites for mouse p53 mRNA. The data were compared with those deposited in the DataBase of Transcription Start Sites (DBTSS) v.10.1 [Citation27]. DBTSS contains information about both the exact points of transcription start sites and the abundance of transcripts previously identified by massively sequenced 5′-end oligo-cap selected cDNA, which ensures that only capped RNAs have been examined [Citation27]. There is a general similarity between the distribution of transcription initiation sites revealed by our 5′RACE experiment and the DBTSS data. However, the 5′RACE data are ‘less dispersed’ which may be due to a limited number of analyzed clones. Nevertheless, some short transcripts, beginning, for example, at nucleotide positions (−101), (−89), (−62) and (−58), as well as the longest one at (−247), were detected only by the 5′RACE method. Considering that in the 5′RACE experiment a G-track is added to the 5′ end of the transcript, the determination of some transcripts’ 5′ ends is impeded, e.g. transcripts (−111) or (−134) from RACE may correspond to RNA (−114) or (−135) from DBTSS, respectively. Importantly, we observed some transcripts without their equivalents in DBTSS, whose presence cannot be explained by the G-truck addition. This is properly illustrated by transcript (−247) or by transcripts (−62) and (−89), which may be tissue-specific and do not occur in NIH3T3 cells which were used to get the DBTSS data. Finally, the length distribution of 5′ non-coding regions in the 5′RACE data differs among the studied tissues ()). In all three samples, from embryos, liver and thymus, transcript (−122) occurs most frequently, though in liver in only 30 % while in thymus in 60 % of the sequenced clones. In liver, the longer non-coding regions prevail while in thymus, regions shorter than 122-nucleotide-long occur more frequently ()). We showed that transcript (−247) was barely detectable in liver and thymus (Fig. S2) which may explain its absence during RACE analysis of samples from those tissues.
Figure 1. Schematic representation of the transcription initiation sites for mouse p53 mRNA determined experimentally, and their comparison with the data derived from massively sequenced cDNA. (a) The 5′-RACE results are displayed above the 5′-terminal sequence of p53 mRNA. The numbers correspond to the number of the identified clones, indicating also the first nucleotide of the transcript. Transcripts derived from embryos, thymus and liver are denoted in red, blue and green, respectively. Data collected in the database of transcriptional start sites for NIH3T3 cells ([Citation27]; http://dbtss.hgc.jp/) are displayed as the bars below the nucleotide sequence and grey numbers correspond to the number of reads for each sequence length in TSS-Seq. (b) The pie charts show the percentage distribution for different length 5′-UTRs from the 5ʹ-RACE data.
![Figure 1. Schematic representation of the transcription initiation sites for mouse p53 mRNA determined experimentally, and their comparison with the data derived from massively sequenced cDNA. (a) The 5′-RACE results are displayed above the 5′-terminal sequence of p53 mRNA. The numbers correspond to the number of the identified clones, indicating also the first nucleotide of the transcript. Transcripts derived from embryos, thymus and liver are denoted in red, blue and green, respectively. Data collected in the database of transcriptional start sites for NIH3T3 cells ([Citation27]; http://dbtss.hgc.jp/) are displayed as the bars below the nucleotide sequence and grey numbers correspond to the number of reads for each sequence length in TSS-Seq. (b) The pie charts show the percentage distribution for different length 5′-UTRs from the 5ʹ-RACE data.](/cms/asset/515312cb-f0ba-48eb-95e3-0b58723e4a2b/krnb_a_1556084_f0001_oc.jpg)
It is worthy of note that there is a discrepancy in the assessment of the AUG initiation codon for the full-length p53 protein between our studies and some earlier published data, as two AUG codons are located at a 6-nucleotide distance, and both codons are placed in the open reading frame (ORF). The issue regarding the position of the initiation codon was firstly noted in the 1980s [Citation28,Citation29]. Currently, there are discrepancies concerning the length of mouse p53 protein between the literature [Citation28,Citation29] and the database (https://www.uniprot.org/uniprot/P02340). According to different sources, p53 contains either 390 or 387 amino acids. In order to address this problem, sequences of 5′-terminal regions of p53 genes from 11 mammals were aligned (Figure 2). The alignment strongly suggested that the second AUG triplet functions as the translation initiation site. Moreover, only this codon is embedded in the sequence context which follows the rule of the Kozak’s consensus [Citation30].
Taking into consideration the differences in nucleotides’ numeration in our and the previously cited studies, we conclude that mouse Trp53 gene transcript identified by Bienz et al. [Citation23] differs by only a single nucleotide from our most abundant mRNA-122. This transcript is also the most abundant transcript in the DBTSS data (). Additionally, in the same study, two other potential 5′UTR lengths have been proposed which in our study correspond to the non-coding regions of 225 and 165 nucleotides, respectively [Citation23]. These results, however, have been considered inconclusive and neither transcript containing 225 nor 165 nucleotide-long 5′UTR were detected in our 5′RACE analysis; they are not displayed in the DBTSS data, either.
Two transcripts identified by 5′RACE were chosen for further analysis. The first one contained a 122-nucleotide-long 5′ non-coding region (named mRNA-122), as it emerged most often in all the analyzed samples. The second transcript had the longest identified 5′ non-coding region of 247 nucleotides (mRNA-247), and it was identified only in the RNA pool isolated from mouse embryos. However, the presence of this transcript was also confirmed in some mouse tissues, particularly in the brain, heart and spinal cord while it was hardly or not detected in kidney, liver, lung or spleen tissues (Fig. S2).
We compared the selected transcription initiation sites identified in our 5′RACE analysis of mouse Trp53 gene with those described earlier for human TP53 gene; reviewed in [Citation31]. For that purpose the alignment of 5′-terminal sequences of p53 mRNAs from 11 mammals was used (). The comparison allowed localization of the transcription initiation sites in relation to the conserved stretches of the p53 mRNA sequence. Importantly, it turned out that the major transcription initiation site of mouse and human p53 genes are essentially identical as they differ only by a single nucleotide, despite the fact that the length of the corresponding 5′ non-coding regions of mouse and human transcripts are 122 and 139 nucleotides, respectively. For human transcripts the longest identified 5′ non-coding region corresponds to the P0 transcription initiation site. The transcription initiation site for the longest mouse mRNA-247 differs by 21 nucleotides (between A(−247) and G(−225) thus still by less than 10% of the entire length of the 5′ non-coding region ().
Figure 2. Alignment of the 5′-terminal regions of p53 mRNA sequences derived from eleven different species. Capital letters symbolize mRNA sequence (derived from GeneBank) and lowercase letters indicate p53 gene sequence (obtained from Ensembl) of the region homological to the longest identified mouse transcript. Human P1 and P0 transcription initiation sites are marked as ‘h(P1)’ and ‘h(P0)’, accordingly, whereas mouse transcription initiation sites are marked as ‘m’. Translation initiation codons AUG1 and AUG2 are highlighted. Two alignments were prepared and joined: above and below human P1 initiation site. Comparisons of the sequences were prepared using Clustal Omega program [Citation56]. Alignment is colored according to the percentage of sequence conservation (red, 100%; green, 80% – 99%; blue, 60% – 79%).
![Figure 2. Alignment of the 5′-terminal regions of p53 mRNA sequences derived from eleven different species. Capital letters symbolize mRNA sequence (derived from GeneBank) and lowercase letters indicate p53 gene sequence (obtained from Ensembl) of the region homological to the longest identified mouse transcript. Human P1 and P0 transcription initiation sites are marked as ‘h(P1)’ and ‘h(P0)’, accordingly, whereas mouse transcription initiation sites are marked as ‘m’. Translation initiation codons AUG1 and AUG2 are highlighted. Two alignments were prepared and joined: above and below human P1 initiation site. Comparisons of the sequences were prepared using Clustal Omega program [Citation56]. Alignment is colored according to the percentage of sequence conservation (red, 100%; green, 80% – 99%; blue, 60% – 79%).](/cms/asset/cf09da20-a8d7-4b1e-9158-47e0a0b32c28/krnb_a_1556084_f0002_oc.jpg)
Secondary structure of the 5′-terminal regions of two p53 mRNAs
Two p53 mRNA molecules with 5′ non-coding regions of 122 or 247 nucleotides, mRNA-122 and mRNA-247, were synthesized by in vitro transcription. Secondary structures of their 5′-terminal regions, RNA-122 and RNA-247, were analyzed by means of Pb2+-induced cleavage and SHAPE probing approaches [Citation32,Citation33]. Folding of the 5′ non-coding region of mRNA-122 was also analyzed by DMS modification in vitro and in the transfected MB352 cell culture. The experimental results of the SHAPE and DMS modification approaches were used in RNAStructure v5.6 computer program as structural constraints to predict secondary structure models of the investigated 5′ non-coding regions of p53 mRNA ().
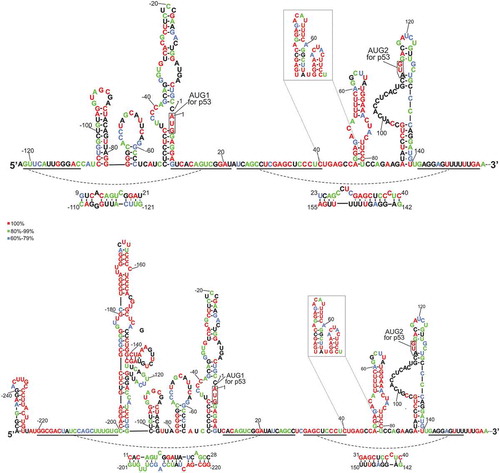
Figure 3. Secondary structure model of the 5′-terminal region of p53 mRNA-122, RNA-122. First nucleotide of the start codon is labelled as 1 and all nucleotides in the 5′ direction are denoted by negative numbers. Pb2+-induced cleavages are shown as black arrowheads and DMS modification sites in vitro and in the cell culture are denoted by black circles and white squares, respectively. Nucleotides are marked in red, orange and black, according to their SHAPE reactivity. Nucleotides labeled with gray represent primer binding sequence used in reverse transcription reaction. Alternative arrangement of the region U41 – U81 is also shown in the frame. Free energy values for selected structural motifs are shown in parentheses.
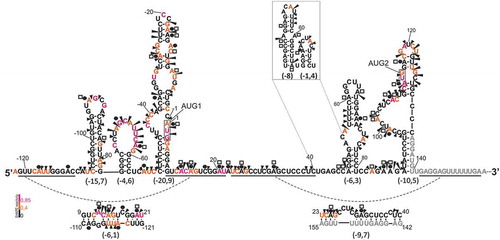
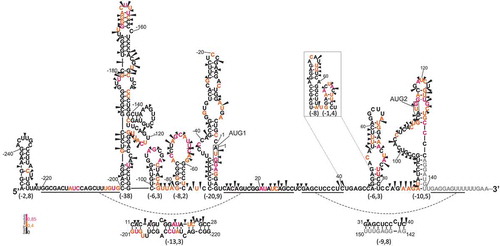
Figure 4. Secondary structure model of the 5′-terminal region of p53 mRNA-247, RNA-247. All the labels are as in .
Secondary structure of RNA-122
shows a secondary structure model of the 5′- terminal region of p53 mRNA-122, RNA-122, with the free energy folding of ΔG = −77.6 kcal/mol. In the model, five hairpin motifs are present: C(−106):G(−78), G(−77):C(−57), C(−51):G9, A47:U81 and A89:U140. Alternatively, the U41-U81 region may form two hairpins U41:A66 and G68:C80. The initiation codons are located in two large, imperfect hairpin domains, AUG1 in C(−51):G9 and AUG2 in A89:U140. Hairpin motifs are separated by sequence stretches which are involved in the formation of long-range interactions. The stretch G(−121) – C(−110) interacts with G9 – U21 while the stretch U23 – C40 pairs with G142 – A155 forming two imperfect duplexes with free energy of −6.1 kcal/mol and −9.7 kcal/mol, respectively.
The proposed secondary structure of RNA-122 is well supported by the results of experimental probing in vitro with Pb2+-induced cleavage, DMS modification and SHAPE methods ( and Fig. S3 in Supplementary data). In particular, the mapping results nicely confirm the single-stranded regions of apical loops of hairpins C(−106):G(−78) and G(−77):C(−57). Nucleotides present in two domains with AUG1 and AUG2 codons undergo intense modification. This is understandable since the domains consist of segments of no more than 4 base pairs interspaced by internal loops. The exceptions are double-stranded segments with 7 and 8 base pairs closing these domains, which are resistant to modification. The modification patterns of mRNA stretches, which are presumably involved in tertiary interactions are less consistent with the proposed folding. In particular, in the duplex formed by G(−121) – C(−110) and G9 – U21 stretches some nucleotides are reactive with NMIA and/or some presumably double-stranded regions undergo Pb2+-induced cleavage. Thus, this segment does not seem to be particularly stable which is consistent with its low stabilization energy of −6.1 kcal/mol.
The region of alternatively proposed folding, spanning nucleotides from A41 to U81, contains relatively fewer modifications. Based on the patterns of Pb2+-induced cleavages and SHAPE reactivity we found it difficult to propose a prevailing structural arrangement of this region. Therefore, we decided to characterize folding of this region further by mapping the sites accessible to oligomer hybridization. For that purpose, the mRNA-122, 6-mers semi-random DNA libraries, and RNase H hydrolysis were used (). This approach has been shown to be particularly useful in screening for target sites for antisense oligonucleotides in highly structured RNA molecules: region X of hepatitis C virus [Citation34], and the genomic and antigenomic HDV ribozymes [Citation35]. Most importantly, this approach was used for mapping the sites accessible to oligomer hybridization in the 5′-terminal region of human p53 mRNA that begins at P1 transcription initiation site [Citation36]. This data allowed us to make direct comparison of accessibility to hybridization of both the corresponding regions of mouse and human p53 mRNAs. The mapping results for mouse transcript are displayed on two possible secondary structure arrangements of the region spanning nucleotides A41 and U81 ()). Both mapping patterns were compared with the pattern that has been earlier obtained for the corresponding region in human p53 mRNA. It turned out that the presence of a single hairpin motif in that region is more consistent with the rules that govern hybridization of complementary oligonucleotides [Citation35] and the mapping pattern characteristic of the 5′-terminal region of human p53 mRNA [Citation36]. Therefore, this region seems to form a single hairpin motif in both mouse and human p53 mRNAs, which in human transcript has been shown to interact with Mdm2 protein [Citation37]. However, computer predictions show that two hairpins in mouse and a single hairpin in human mRNAs are preferred based only on calculation of stabilization energies.
Figure 5. Accessibility mapping of the G33 – A89 region of the mRNA-122 to oligonucleotide hybridization using short oligonucleotide libraries and RNase H hydrolysis. (a) Autoradiogram shows the products of RNase H cleavage identified by reverse transcription with 5ʹ-end-32P-labeled DNA primer. cDNA products were analyzed using a 8% polyacrylamide gel. Lanes: c, g, a, t: reactions with RNase H in the presence of semi-random libraries for 10 and 30 min; (-): control reaction; C, G, T, A: sequencing lines. Selected cytosine residues are labeled on the left of each autoradiogram. (b) Two alternative secondary structure models of the G33 – A89 region with RNase H cleavage sites indicated. The most probable positions of oligonucleotide hybridization are marked as gray lines.
In order to evaluate whether the secondary structure of the 5′-terminal region of p53 mRNA-122 determined in vitro differs from that present in cellular environment, chemical modification with DMS was employed. The modification sites, under the conditions in which adenines in position N1 or cytosines in position N3 were modified [Citation38], are shown in . As expected, because of higher specificity of DMS compared to Pb2+ ions and NMIA reagent, fewer nucleotides were modified in vitro. However, their distribution is essentially consistent with the proposed secondary structure of this region of mRNA and corresponds well to the results of Pb2+-induced cleavage and SHAPE approaches.
In cellular conditions, most DMS modification sites correspond to the sites determined in vitro. Some differences are, however, worth noting, especially those concerning more than just a single modified nucleotide. They concern a single-stranded stretch at the 5′ terminus with A(−117) and A(−111) which are modified only in vitro, a region at the bottom of hairpin A47:U81 i.e. nucleotide G49 and nucleotides in the apical loop of this hairpin A60 and A66, which are modified in the cell but they are resistant to modification in vitro. Finally, nucleotides A102 and C103 in the internal loop region which precede the AUG2 codon are modified only in the cell. These results suggest that the structure of the 5′-terminal region of p53 mRNA in the cellular environment corresponds well to that proposed based on in vitro studies. Nevertheless, some restricted changes in selected elements of this mRNA region exist, which are likely a consequence of interactions with cellular components.
Structural probing of RNA-247
The proposed secondary structure of the 5′-terminal region of mRNA-247, RNA-247, in its part which spans nucleotides C(−101) and A156, closely resembles the arrangement of this region in mRNA-122 ( and ) in Supplementary data). The only differences are observed in stems of two hairpins, shorter in C(−101):G(−83) and longer in G(−79):C(−55), as compared to the analogous hairpins in RNA-122. These differences result from the extension of the non-coding nucleotide sequence of p53 mRNA in the 5′ direction. In RNA-247 the 5-nucleotide-long stretch G(−102) – C(−106) forms secondary interactions within a double-stranded segment which closes the large structural domain C(−200):G(−102) with ΔG of −38 kcal/mol. In RNA-112, this sequence stretch extends the stem of hairpin C(−101):G(−83) by additional five base pairs. In RNA-247, the opposite fragment of this segment, U(−82) – G(−78), constitutes a single-stranded link and leads to the extension of the downstream hairpin stem by two base-pairs, G-C and G-U. Finally, 5′-proximal stretch of RNA-247 forms a hairpin motif of low stability with ΔG of −2.8 kcal/mol. Nucleotide stretches which connect hairpin motifs have a potential to form additional interactions. The region G(−220) – G(−201) interacts with C11 – C28 (ΔG = −13.3 kcal/mol) and the region G31 – C40 with G142 – U150 (ΔG = −9.8 kcal/mol).
The results of structure mapping of RNA-247 with NMIA reagent and Pb2+ ions support the proposed secondary structure. However, some differences in modification patterns of the corresponding regions in RNA-247 and RNA-122 are detectable. They are manifested as weaker modifications of the hairpin in which AUG1 is embedded and a few additional modifications in the hairpin A47:U81 in RNA-247. Importantly, a very similar modification pattern of the apical loops of hairpins C(−101):G(−83) and G(−79):C(−55) in RNA-247 with the corresponding regions in RNA-122 was observed although the hairpin stems differ in both mRNAs.
Folding of selected structural domains predicted in RNA-122 and RNA-247
In order to establish whether hairpin motifs C(−200):G(−102), C(−51):G9 and A89:U140 proposed in RNA-122 and/or RNA-247 are really present in these RNAs we synthesized three model oligonucleotides corresponding to these motifs, and characterized their structures (Figure 6 and Fig. S5 in Supplementary data). For hairpins C(−51):G9 and A89:U140 additional G residues present at their 5′ ends facilitated the synthesis of oligomers by T7 in vitro transcription. For hairpin C(−200):G(−102), the 5ʹ and 3ʹ ends were extended by G and C residues, respectively. As expected, hairpin type motifs were the most stable folds of the oligomers predicted in silico with stabilization energy of −41.9 kcal/mol, −21.1 kcal/mol and −10.9 kcal/mol, respectively. The computer predictions are well supported by the experimental results of Pb2+ probing ( and Fig. S5 in Supplementary data).
Figure 6. Secondary structure models of three oligoribonucleotides corresponding to hairpins: C(−200):G(−102) (a). C(−51):G9 (b) and A89:U140 (c). Black arrowheads indicate Pb2+-induced cleavages and nucleotides are numbered as in p53 mRNA-247.
The Pb2+-induced cleavage pattern characteristic of isolated hairpin C(-200):G(-102) is found in the corresponding region of the pattern obtained for RNA-247 ( and )). It suggests that the corresponding sequence stretches fold into closely related structures. Small differences are only observed between the distribution of cleavages in the isolated hairpin and the corresponding region in RNA-247. They concern cleavages in the region of two bulged trinucleotide stretches and in the upper part of the hairpin. The isolated hairpin lacks cleavages in double-stranded segments which is consistent with the proposed structure and known specificity of Pb2+ ions.
The hairpin motif C(−51):G9 is present in both RNA-122 and RNA-247. The isolated hairpin is relatively resistant to cleavage with Pb2+ ions. Importantly, the cleavage pattern observed in the asymmetric internal loop of the oligomer, in which AUG1 codon is embedded, is very similar to those occurring in the RNA-122 and RNA-247. For the other parts of the hairpin some differences in cleavage distribution and/or intensities are noted. This may be a consequence of the hairpin thermodynamic instability. Only the double-stranded segments that close the hairpins consist of 7 base pairs while the other segments have only 3 or 4 base pairs and are interspaced by internal loops or closed with 3-nt membered apical loop.
Finally, in the hairpin motif A89:U140 the initiation codon AUG2 is located from which the synthesis of isoform Δ41p53 begins. The Pb2+-induced cleavage pattern of the isolated hairpin reflects very well the patterns obtained for the corresponding regions of both mRNA-122 and mRNA-247. The only substantial difference concerns dinucleotide 131-CC-132 in a large asymmetric internal loop. This region undergoes cleavage in the isolated hairpin but is resistant to cleavage in the full-length mRNA molecules which may suggest some structural differences. However, in that particular case it may also result from different analytical techniques applied for cleavage site identification. In the case of isolated hairpin a 5′-end-labeled oligoribonucleotide was used while cleavages in mRNA were mapped by the primer extension method. The primer was complementary to the region between nucleotides A144 and A156 thus Pb2+ cleavages occurring very close to the 3′ end of the primer may have escaped analysis.
Conservation of structural elements found in the 5′-terminal region of p53 mRNA
We compared the secondary structure models of the 5′-terminal regions of two studied p53 mRNAs, RNA-122 and RNA-247, with the conservation of nucleotide sequence of those regions in various organisms (Figure 7). The idea of this comparison was to find structural elements in those regions which are highly conserved. Such elements may play important functions, likely also via interacting with some cellular proteins.
The first highly conserved region spans nucleotides C40 and C80 ( and ). In the structural models of RNA-122 and RNA-247 this region folds into a single hairpin, or alternatively, into two hairpin motifs based on computer predictions. The results of mapping of the sites accessible to oligomer hybridization in this region with oligonucleotide libraries and RNase H digestion support its arrangement in mouse p53 mRNA into a single hairpin motif, although two hairpins are thermodynamically preferred. On the other hand, folding of the corresponding region of human p53 mRNA into a single hairpin is thermodynamically favored. This difference is a result of 5-nucleotide stretch spanning positions 81 and 85, which consists mainly of non-conserved nucleotides and differs in both mRNAs. Importantly, the hairpin present in human mRNA has been shown to interact with the Mdm2 protein [Citation37]. Additionally, it has been demonstrated that one nucleotide mutation in an apical loop of this hairpin (CUA to CUG) resulted in a weaker mRNA affinity for Mdm2, and consequently, the p53 and Δ40p53 translation level was lower. The authors have suggested that preservation of not only the sequence but also the tertiary structure of this hairpin is crucial to maintain its function [Citation37]. So far, there is no data concerning binding of Mdm2 to mouse p53 mRNA despite extended studies of Mdm2-p53 interactions using various cell cultures, invertebrates (C. intestinalis) [Citation39] and mouse models [Citation40]. Since our analyses reveled two potential different foldings of the C40 – C80 region of RNA-122 and RNA-247 we could envisage that Mdm2-mouse p53 mRNA interaction might be controlled by structural rearrangement of this region. Moreover, the hairpin present in human p53 mRNA is also recognized by PTB (polypyrimidine tract binding protein) and hnRNP C1/C2 [Citation41].The possibility of alternative folding of the C40 – C80 region in mouse p53 mRNA may also be interpreted as the potential to play a role of riboswitch able to interact with different regulatory factors.
Figure 7. Secondary structure models of the 5′-terminal regions of mRNA-122 and mRNA-247 with the level of each nucleotide conservation marked based on the alignment of p53 mRNA sequences derived from eleven different species (the data shown in ). The nucleotides are colored according to the percentage of their conservation (red, 100%; green, 80% – 99%; blue, 60% – 79%).
The second conserved region consists of nucleotides in positions 1 to 8, and additionally, five upstream nucleotides. This region includes the so called Kozak’s context, which specifies the optimal nucleotide sequence in which translation initiation codon is embedded i.e. 5′-GCCAUGG-3′ [Citation30]. In the case of both mouse and human p53 mRNA, the AUG1 codon is placed at the junction of the double-stranded segment and the internal loop region ( and ). In mouse p53 mRNA, the first codon (−9)AUG(−7) from the 5′ terminus is not located in the optimal Kozak’s context and these three nucleotides are not conserved in other organisms (). Interestingly, within this AUG, after the A residue in human mRNA, there is an almost 20-nucleotide-long sequence stretch present in most analyzed sequences. This results in the extension of the large hairpin domain in which the codon is embedded in its upper part. The 7-nucleotide-long stretch between positions (−19) and (−25) which is composed exclusively of pyrimidine residues, mainly cytidines, in all the analyzed sequences, deserves special attention. Such a region may be the site of interaction with proteins.
The third conserved region spans nucleotides A(−97) and U(−87), in which out of 11 nucleotides only dinucleotide (−90)GA(−89) is variable and two other nucleotides are not perfectly conserved. Interestingly, in mouse p53 mRNA this region forms the 7-nucleotide-membered apical loop closed with two base pairs. Also in human p53 mRNA, in transcripts beginning at the P0 and P1 sites, this region folds into a hairpin motif. In that case the hairpin is closed with 5-nucleotide-membered apical loop. This is a consequence of the presence of two nucleotides other than those present in mouse mRNA, which are not conserved in this region. This region seems to be also a potential binding sites for trans-acting protein factors.
It is worth noting that in both mRNA-122 and mRNA-247, the G(−79) – C(−55) region forms hairpin structure with the same 13-nucleotide-membered apical loop. This structural element has been also observed in earlier studied 5′UTR of mouse p53 mRNA which was 157 nucleotides in length [Citation25]. Despite of slightly lower sequence conservativeness, the apical element of this hairpin is essential to maintain an interaction with hnRNP Q. Substitution of all A to G residues in this element caused weaker affinity for hnRNP Q, and as a consequence, reduction of IRES activity was observed [Citation25]. It seems that the interaction with hnRNP Q could be affected not only by sequence alteration but also by structural changes since the 13-nucleotide-membered apical loop was not present in mutant RNA.
Further towards the 5′ direction, two nucleotide stretches from C(−126) to C(−199) and from C(−215) to C(−238) are conserved. In mouse p53 mRNA, the first region folds into a large hairpin type domain. The conserved stretches are interspaced with short sequences of variable nucleotides or less conserved. The stretch between A(−155) and U(−178) turns out to be particularly interesting. It contains a hairpin consisting of two double-stranded segments of 5 and 4 base pairs interspaced with an asymmetric internal loop of type 2/1 and closed with a 3-nucleotide-membered apical loop. It is extremely interesting that a very similar hairpin motif has earlier been proposed to exist in human p53 mRNA. That hairpin differs only in the apical loop region which has 4 nucleotides instead of 3 and lacks bulged cytosine in the internal loop. In mouse p53 mRNA, this hairpin closes a large structural domain while in human p53 mRNA it is separated from other motifs by single-stranded nucleotide stretches. A highly conserved sequence and location of the hairpin in both mRNAs suggest that it may be accessible to interactions with other macromolecules.
Finally, there is an 18-nucleotide polypyrimidine segment within the almost perfectly conserved region between C(−215) and C(−238). Apart from pyrimidine residues it contains only four conservative purines, two adenosine and two guanosine residues. High conservatism of this region suggests its important functional role. It might be recognized by PTB which is known as an ITAF to enhance IRES activity of human p53 mRNA via interaction with the 5′-terminal region of this mRNA [Citation41,Citation42].
Translation initiation and IRES activity
It has recently been shown that translation efficiency of mRNAs that differ in their 5′-terminal regions strongly depends not only on the length but also on the structure of that region [Citation17,Citation18,Citation21,Citation43]. We addressed the question whether these two factors have an impact on the translation efficacy of mouse mRNA-122 and mRNA-247. An in vitro translation assay in RRL revealed a strong decrease in the p53 synthesis, by approximately 40%, for mRNA-247 compared with mRNA-122 (Figure 8A). Thus, the extension of mouse mRNA in the 5′ direction seems to influence the translation initiation process. Presumably, the presence of an additional stable hairpin domain C(−200):G(−102) in the 5′-proximal part of mRNA-247 is responsible for the reduction of p53 synthesis (). A similar observation has been presented for human p53 mRNA with different variants of the 5′ terminus [Citation18]. The region located between the P0 and P1 promoters exhibits an inhibitory effect on human p53 synthesis. We also observed that mouse Δ41p53 isoform was produced from AUG2 with the same efficiency for both transcripts, mRNA-122 and mRNA-247. Interestingly, human Δ40p53 is also synthesized at a similar level from both transcripts, which started at P0 and at P1 transcription initiation sites [Citation18,Citation21]. Moreover, for mRNA-122, p53 and Δ41p53 proteins were synthesized in vitro with the ratio of 5:1 which is comparable to that determined for human p53 and Δ40p53 ()) [Citation17]. Taken together, it appears that mouse and human p53 mRNAs undergo translation with similar effectiveness to produce full-length p53 proteins and their major N-truncated isoforms.
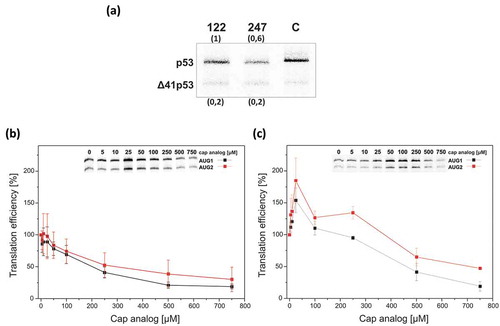
Figure 8. The influence of the increasing concentration of the cap analog on translation efficiency of mRNA-122 and mRNA-247. (a) The 5′-capped mRNAs were translated in RRL in the presence of 35S-methionine. Human p53 mRNA was used in the control reaction. Band intensities were analyzed using MultiGauge software (Fuji) and relative amounts of protein products are displayed in the brackets. (b and c) In vitro translation of mRNA-122 (panel B) or mRNA-247 (panel C) was conducted in the presence of an increasing concentration of the cap analogue (m7GpppG) to inhibit cap-dependent translation. The amounts of protein products translated from AUG1 and AUG2 were determined, normalized to an amount with no cap analog added and displayed on the graph.
For the first time, mouse Δ41p53 isoform (also called p44) was described in 1985 [Citation44] and was further characterized in 1987 [Citation45]. Animal models revealing the functioning of Δ41p53 in vivo have been prepared. It has been shown that overexpression of Δ41p53 inhibits mouse growth and causes premature aging [Citation46], plays a critical role in maintaining the embryonic stem cell state [Citation9] and it is implicated in the development of age-dependent diabetes [Citation47].
In order to establish whether mouse p53 and Δ41p53 are synthesized via the same mechanisms as their human counterparts we performed translation assays of mRNA-122 and mRNA-247 in RRL in the presence of increasing concentration of the cap analog (m7GpppG) () [Citation17,Citation18]. For mRNA-122, at 250 µM cap analog concentration, strong inhibition of translation from AUG1 and AUG2 was observed, of around 40% and 50%, respectively, compared with the initial values with no inhibitor added ()). A further decrease in the synthesis of both isoforms was noticed at a higher concentration of the cap analog. At 750 μM the amounts of p53 and Δ41p53 were significantly lower, by approximately 80% and 70%, respectively. A different effect was observed for mRNA-247. At low 25 μM concentration of the cap analog, an increase in protein synthesis from both initiation codons was observed ()). A gradual decrease of the p53 and Δ41p53 amounts was noticed at a higher concentration of the cap analog. However, at its 500 μM concentration translation effectiveness from both codons was relatively high: from AUG1 it was around 50% and from AUG2 it was app. 75% compared with synthesis efficacy with no inhibitor added.
The result described above suggested that translation of mRNA-122 from both AUG1 and AUG2 initiation codons occurs mostly according to a cap-dependent mechanism. On the contrary, in the case of the long transcript, mRNA-247, the shape of inhibition curves might indicate a cap-independent character of the translation initiation process from both codons. Comparing the course of mouse Δ41p53 and human Δ40p53 translation inhibition we can observe large similarities, such as an increase in protein synthesis at a low concentration of the cap analog and still a high amount of protein production, above 50% of the initial level, at the highest concentration of m7GpppG [Citation17,Citation18,Citation21]. It has been postulated that human Δ40p53 isoform is predominantly synthesized in an IRES-dependent mode [Citation6]. Presumably, for mRNA-247, translation from AUG2 is also governed by an IRES element. Moreover, it has already been shown that the 5ʹ-terminus of mouse transcript exhibits IRES activity, particularly under stress conditions. However, mRNA applied in those experiments contained shorter 5′UTR, 157 nucleotides in length [Citation25]. It is likely that such length of the 5′-terminal part of mouse p53 mRNA is sufficient to maintain IRES activity.
Moreover, in the case of mouse transcripts it seems that the length of their 5′-terminus is correlated with the translation initiation mechanisms. This structural motif C(−200):G(−102) present only in the longer transcript, mRNA-247, might build steric hindrance for ribosome to scan mRNA and as a consequence, IRES-dependent translation is favored. Furthermore, this region might be also a platform for ITAFs which enhance IRES activity [Citation20,Citation21,Citation41]. Interestingly, we observed higher expression of mRNA-247, both in embryo and in individual tissues/organs: brain, heart and spinal cord (Fig. S2). In the case of these organs, in adult fully developed organisms their cells lose the ability to divide or are able to generate new cells at a low level [Citation48]. We could envisage that the presence of longer mRNA allows to produce p53 protein in those specific tissues, particularly under stress conditions, when cap-dependent translation is reduced. It could be crucial to build a fast p53-stress response in tissues/organs which may not be easily regenerated by new generation of cells. However, further research is necessary to gain more data on the potential relation between a higher expression of long p53 mRNA and tissue/organs specificity in mouse.
The sequence alignment indicated that out of two potential AUG initiation codons the second one may play the role of the initiation codon for full-length p53 (). In order to examine which codon is the actual initiation place of the full-length p53 translation, directed mutagenesis of mRNA-122 was performed. The first or the second AUG codon was replaced by GCG triplet to prevent recognition by the ribosome initiation complex, and as a consequence, no translation product should have been observed [Citation17]. The obtained mRNA mutants were used as templates in in vitro translation, in RRL, in the presence of [S35]-methionine. Surprisingly, in both cases translation products were observed ()). Mutation of the first AUG resulted in inhibition of p53 synthesis by around 20% compared with the translation effectiveness for the wild-type mRNA, while mutation of the second AUG caused a decrease in p53 production by approximately 40%. There was no change in the amounts of Δ41p53 for both mutants ()). To confirm the in vitro data wild type and mutant mRNAs were transfected into embryonic fibroblast MB352 cells which derived from p53 null (-/-) mouse embryos. For all mRNA transcripts, wild type and mutants, p53 protein was detected 6 hours after transfection ()).
Figure 9. The influence of mutation of two potential AUG initiation codons on translation efficiency assayed in in vitro conditions (a) and in transfected cell culture (b). Potential initiation codons are underlined and mutated nucleotides are marked in grey. In panel A the results of translation in RRL are shown and relative protein amounts are displayed in brackets. In panel B transfection reactions of mRNAs were prepared using two different concentrations of the transfection reagent Lipofectamine. GAPDH was used as a loading control.
Altogether, the assay in vitro and in the cell showed that both the AUG codons are recognized as translation initiation codons. However, the in vitro results indicated that the second AUG codon, which is located in the optimal Kozak’s sequence context, is preferred in translation initiation since p53 is synthetized more effectively when the amounts of p53 protein produced from both mutant mRNAs are compared. Such preference is not seen in the transfected MB352 cells. This discrepancy may result from a different protein composition of rabbit reticulocyte lysate and living cell systems. The lysate is a simplified system which is very useful in the investigation of translation mechanisms since it is only composed of ribosome, amino acids, tRNAs and basic factors necessary for the translation process [Citation49]. However, it does not reflect the entire cellular protein environment. Some factors which are able to interact with p53 mRNA and modulate its translation may be present only in the cells. Indeed, we have already observed differences in the translation efficiency of p53 mRNA variants in RRL and in the living cells, and, moreover, even between various cells [Citation18].
P53 activation under stress conditions
It is well documented that p53 is activated upon different stress conditions [Citation6,Citation50,Citation51]. However, p53-stress response varies depending on many factors, especially the stress agent and cell type [Citation1,Citation6,Citation52]. We addressed the question of how the expression of Trp53 gene is regulated in the presence of particular stress factors in mouse cells compared with various human cell lines. Mouse fibroblasts NIH3T3 were exposed to 1.2 μM tunicamycin or 0.1 μM thapsigargin which induce endoplasmic reticulum (ER) stress and to DNA-damaging agent, 0.1 μM doxorubicin [Citation6]. We noticed that ER stress resulted in a slight decrease in p53 amount whereas upon doxorubicin treatment, the p53 level was elevated significantly, approximately 2-fold (Figure 10). It has been demonstrated that human p53-stress response is cell type-dependent. Doxorubicin treatment caused strong p53 activation in BT474 (ductal carcinoma) cells and little response in BT549 (ductal carcinoma) and MLS-1765 (human sarcoma) cells, whereas ER stress resulted in a slight increase in p53 amount in all these cell lines [Citation6]. However, reduction of the p53 protein level upon thapsigargin treatment has been shown in HCT116 (colorectal carcinoma) and A549 (lung carcinoma) cells [Citation53].
Our results indicate that in mouse fibroblasts (NIH3T3) p53 protein level is raised profoundly upon treatment with DNA-damaging agent while ER stress leads to a small decrease in the p53 amount, which is in line with the observation for HCT116 and A549 cells [Citation51]. Nonetheless, further research is needed to clearly show how the p53 protein level is changed by specific stress agents in various human and mouse cell types.
Finally, we analyzed whether the observed changes in p53 protein level are related to changes in mRNA expression. It turned out that the amount of p53 mRNA was similar under all the tested stress conditions and comparable to that in the cell with no stress induction ()). Since an increase in p53 protein level and no changes in RNA expression upon doxorubicin treatment were observed we assumed that p53 is, at least partly, activated at the translation level to elevate its amount in DNA-damaging stress conditions. It has been shown that p53 synthesis is enhanced in the presence of etoposide and sodium nitroprusside chemicals in mouse fibroblasts [Citation25]. The IRES activity has been proposed to be responsible for this effect [Citation25,Citation26]. Our data supports the potential cap-independent translation mechanism of mouse p53 mRNA which seems to be favored under stress conditions.
Figure 10. The p53 synthesis efficiency under different stress conditions in NIH3T3 cells. The cells were exposed for 16 hours to doxorubicin (0.1 μM), tunicamycin (1.2 μM) and thapsigargin (0.1 μM), or to an equivalent volume of DMSO, and then harvested. Endogenous p53 protein level was determined by western blot (a) or flow cytometry (b) using monoclonal 1C12 antibody. GAPDH was used as a loading control. The RT-PCR analysis of p53 mRNA and β-actin mRNA (as a control) was also conducted. For RT-PCR analysis, the samples were prepared using total RNA extracted from mouse fibroblasts treated with DMSO as a control, tunicamycin, thapsigargin and doxorubicin.
Conclusions
The distribution of transcription initiation sites for mouse p53 mRNA determined by the 5′RACE is similar to that deposited in the DataBase of Transcription Start Sites. However, length distribution of 5′ non-coding regions identified in the 5′RACE data differs in embryos, liver and thymus. In all three samples, transcripts starting at nucleotide position (−122) occur more often, although in liver in only 30% while in thymus in 60% of the sequenced clones. In liver, longer non-coding regions prevail while in thymus shorter regions appear more frequently.
The transcription initiation sites identified in the 5′RACE of mouse Trp53 gene are compared with those described earlier for human TP53 gene. Surprisingly, it turns out that the main transcription start sites of mouse and human p53 genes differ by only a single nucleotide despite that their 5′ non-coding regions are 122 and 139 nucleotides in length, respectively. The transcription initiation site for mRNA-247 differs by 21 nucleotides from the P0 start site for the longest human mRNA thus still by less than 10% of the entire 5ʹ non-coding region length.
For the first time, secondary structure models of the 5′-terminal regions of the most abundant and the longest mouse transcripts, mRNA-122 and mRNA-247, are determined by experimental probing in vitro. Chemical modification of p53 mRNA-122 in transfected mouse cells shows that the structure of its 5′- terminus in the cellular environment corresponds very well to that proposed in vitro. The comparison of the newly proposed secondary structures of the 5′ terminus of two mouse mRNAs with conservation of nucleotide sequence of these regions in various mammals reveals several conserved structural motifs of possibly the same functions. A highly conserved region C40 – C80 is the most significant: in the corresponding fragment of human mRNA it has been demonstrated to interact with Hdm2 and it is also recognized by PTB and hnRNP C1/C2 proteins. The conserved region G(−79) – C(−55) is folded into a hairpin with a 13-nucleotide-membered apical loop which is crucial to maintain the interaction with hnRNP Q. Finally, an 18-nucleotide polypyrimidine tract within almost perfectly conserved region C(−215) – C(−238) may be bound by PTB protein to potentially modulate IRES activity as it has been earlier shown for translation of human p53 mRNA.
The mouse and human p53 mRNAs undergo translation with similar effectiveness to produce full-length p53 proteins and their major N-truncated isoforms. Translation of mouse mRNA-122 from both AUG1 and AUG2 codons seems to occur mostly according to a cap-dependent mechanism. On the contrary, in the case of mRNA-247, the results indicate a cap-independent character of translation initiation from both these codons.
Translation of site-mutated mRNA-122 shows unexpectedly that both AUG codons, which are separated by only six nucleotides, are recognized as the translation initiation codons for the full-length p53 in vitro and in the cell. However, the second AUG codon, which is located in the optimal Kozak’s sequence context, is preferred as a translation initiation site in vitro.
In mouse fibroblasts, the p53 protein level is observed to raise profoundly upon treatment with a DNA-damaging agent while ER stress led to a little decrease in the p53 amount. At the same time, the level of p53 mRNA is similar under all tested stress conditions and comparable to that in the cell with no stress agent. Thus, we assume that p53 is, at least partly, activated at the translation level to elevate its amount in DNA-damaging stress conditions.
Overall, our data clearly show both similarities and discrepancies between mouse and human p53 gene expression at the transcription and translation levels. These results should be very useful to expand our knowledge of p53 in terms of applying mouse as a model in p53 research.
Materials and methods
5ʹRACE (rapid amplification of cDNA ends)
5ʹRACE experiment was performed as recommended by the manufacturer (Invitrogen). Briefly, first strand cDNA was synthetized using GSP1 starter (5′-GTCTTCCAGTGTGATG ATGGT-3′) and SuperScript II reverse transcriptase. In the next step, homopolymeric tail was added to the 3′ end of cDNA using terminal deoxynucleotidyl transferase and dCTP. dC-tailed cDNA was amplified using Abridged Anchor Primer and GSP2 (5′-CAAAAAACTTA CCAGGGCAACT-3′), then cloned into TOPO Cloning Vector (Invitrogen). Primers GSP1 and GSP2 were reverse versions of the primers used previously in [Citation54]. About 25 clones were sequenced for each tissue analyzed. Total RNA used in the 5′RACE experiments from mouse embryo or mouse organs was purchased from Clontech.
DNA template constructs and oligonucleotides
The DNA templates for p53 mRNA variants with the 5′ non-coding region of 122 or 247 nucleotides in length were prepared in two steps. In the first step, the p53 True Clone (Origene) was digested by SacI and Psp5II restriction enzymes (Invitrogen), digestion products were separated on an agarose gel and the band of approximate length of 6200 nucleotides was excised and eluted. Subsequently, dsDNA templates containing appropriate 5′-terminal regions of p53 mRNA following the T7 transcription promoter sequence were generated by PCR reaction using plasmids from 5′RACE experiment with appropriate length inserts of p53 5′UTR. The following forward (F) and reverse (R) primers were used: for construct 122: F: 5′-AAGCAGAGCTCTAATACGACTCACTATAGGAGTTCATTGGG ACCATCCTG-3′ and R: 5′-GGTGACAGGGTCCTGTGCTGCA-3′; for construct 247: F: 5′-AAGCAGAGCTCTAATACGACTCACTATAGGACGGAAGGACTTGCCCTTACTT GTTATGGCGACTAT-3′ and R: 5′-GGTGACAGGGTCCTGTGCTGCA-3′. The obtained PCR products were digested with SacI and Psp5II restriction enzymes and cloned into the plasmid prepared as described above using T4 DNA Ligase (Thermo Fisher Scientific).
Templates for the synthesis of isolated hairpin motifs were prepared by PCR using the following forward (F) and reverse (R) primers: for hairpin C(−51):G9: F:5′-TAATACGACTC ACTATAGCTCCTCCTTCCCAGCAGGGTGTCACGCTTCTCCGAAGA-3′ and R: 5′-CTCCTCCATGGCAGTCATCCAGTCTTCGGAGAAGCGTGACACCCTGC-3′; for hairpin A89:U140: F:5′-TAATACGACTCACTATAGATATCCTGCCATCACCTCACTGCATGG ACG-3′ and R:5′-AACATCCTGGGGCAGCAACAGATCGTCCATGCAGTGAGGTG ATGGC-3′; for hairpin C(−200):G(−102): F: 5′-TAATACGACTCACTATAGCCAGGAG TCTCGCGGGGGTTGCTGGGATTGGGACTTTCCCCTCCCACGT-3′ and R: 5′-GCCAGGATGGTCCCAATGAACTGAAGCTACAGAACTTTAGCCAGGGTGAGCAC GTGGGAGGGGAAAGTCCCAATCC-3′.
For mRNA constructs containing mutations in one of the two potential translation initiation codons, appropriate AUG triplets were substituted with GCG using site-directed mutagenesis [Citation18]. All the generated templates contained T7 promoters for subsequent RNA synthesis by in vitro transcription. The sequence of each template was confirmed by sequencing.
Cell culture, RNA transfection and stress conditions
MB352 and NIH3T3 cell lines were purchased from ATCC. The cells were maintained in DMEM medium, supplemented with 10% fetal bovine serum or bovine calf serum, accordingly, non-essential amino acids (Gibco-BRL), 100 U/ml of penicillin G, and 0.1 mg/ml of streptomycin sulphate (Sigma) at 37°C in 5% carbon dioxide atmosphere. Cells used for transfection were under passage 25 and transfection was performed when cell confluence reached about 90%. 3.5 pmol of mRNA-122 was transfected into cells on 6-well plates using TransMessenger Transfection Reagent (Qiagen) according to manufacturer’s protocol. After 3h following transfection, cells were washed in PBS and fresh medium was supplied. Transfection of the mRNA-122 with mutated initiation codons into MB352 cells was performed using Lipofectamine MessengerMAX transfection reagent (Thermo Scientific) as suggested by the manufacturer. After 6 hours cells were harvested and analyzed by western blotting.
Endoplasmic reticulum (ER) stress was generated by addition of tunicamycin or thapsigargin to a final concentration of 1.2 µM or 0.1 µM, respectively. Doxorubicin was applied in a final concentration of 0.1 µM. Cells were exposed to stress conditions for 16 hours and then harvested.
Western blot analysis
For western blot analysis cell lysates were prepared in the buffer: 62.5 mM Tris-HCl pH 6.8, 2% SDS, 10% glycerol, 50 mM DTT and protease inhibitor (Roche). Total cell lysates were incubated for 5 min at 95°C and then loaded on a 15% SDS-PAGE gel and following electrophoresis the proteins were transferred onto a nitrocellulose membrane. The blot was probed with mouse monoclonal antibodies against p53 (1C12; Cell Signaling), and GAPDH (Anti-Glyceraldehyde-3-Phosphate Dehydrogenase, clone 6C5ʹ, Merck Millipore). Primary antibody was detected by Goat Anti-Mouse-HRP (Thermo Scientific Pierce) and visualized using the enhanced chemiluminescent visualization (ECL) system (Thermo Scientific Pierce).
Transcription in vitro
In vitro transcription was performed using T7-Scribe Standard RNA IVT Kit (Cellscript) or TranscriptAid T7 High Yield Transcription Kit (Thermo Scientific) as recommended by the manufacturers. RNA was purified using the GeneJET RNA Cleanup and Concentration Micro Kit (Thermo Scientific). RNA transcripts corresponding to defined hairpin motifs were labelled on their 5′ ends with 32P using polynucleotide kinase and standard protocol. Capped RNA transcripts for in vitro translation experiments were synthesized in the presence of Anti-Reverse Cap Analog (ARCA; Cellscript). The size and integrity of RNA transcripts were verified by agarose gel electrophoresis and SimplySafe (EurX) staining.
Translation in vitro
Translation reactions were performed in the nuclease-treated rabbit reticulocyte lysate (RRL) system (Promega) as it has been described in our previous work [Citation17,Citation18,Citation20]. Briefly, 2.5 pmol of mRNA-122 or mRNA-247 in a volume of 5.5 µl was denatured at 65°C for 3 min and immediately placed on ice for 5 min. The RNA solution was added to 19.5 µl of the translation mixture consisting of 17.5 µl of RRL, 20 µM amino acid mix without methionine, 1 µl of [35S]-methionine (1000 Ci/mol) (Hartman Analytic) and 20 units of recombinant ribonuclease inhibitor (Promega). Translation reaction products were resolved on 15% SDS-polyacrylamide gels, followed by gel drying and radioisotope imaging with FLA 5100 image analyzer (Fuji). Band intensities were analyzed using MultiGauge software (Fuji).
For experiments with the cap analog (m7GpppG; Cellscript) RRL was pre-incubated for 15 min at 30°C with an increasing concentration of the analog (0–750 μM) and equimolar amounts of magnesium acetate.
Pb2+-induced cleavage and primer extension
Prior to the cleavage reaction with Pb2+ ions, approximately 14 pmol of RNA was renatured in the buffer: 40 mM NaCl, 10 mM Tris-HCl pH 7.2, 10 mM MgCl2 by heating for 1 min at 65°C and cooling for 5 min at 37°C. The mixture was divided into four samples and lead(II) acetate solution was added to the final concentration of 0.25 mM, 0.5 mM and 1 mM and an equal volume of water was added to the control reaction. After incubation at 37°C for 2 min, the reactions were terminated by mixing their aliquots with 8 M urea/20 mM EDTA solution and RNA was precipitated with 0.3 M sodium acetate pH 5.2, 1 µl of glycogen (20 mg/ml) and 3 volumes of ethanol. To determine Pb2+-induced cleavage sites primer extension reaction was performed with 5′-end-[32P]-labelled primers: Rm403 (5′-AAGCTACAGAACTTTAG CCA-3′), Rm508 (5′-TTCGGAGAAGCGTGACACCCTGC-3′), Rm591 (5′-CCATAAG CCTGAAAATGTCTCCT-3′) and Rm679 (5′-TTCAAAAAACTCCTCAACATCCT-3′) using 50 units of Super Script III reverse transcriptase (Invitrogen).
For the purpose of determination of the secondary structure of isolated hairpin motifs appropriate 5′-end-[32P]-labelled RNA (230 000 cpm) was treated as described above. The Pb2+-induced cleavage reaction products were resolved on 8% or 12% polyacrylamide gels, followed by radioisotope imaging with FLA 5100 image analyzer (Fuji).
Shape
SHAPE analysis was performed as described previously [Citation17]. After modification of RNA with NMIA and RNA precipitation, the pellet was resuspended in H2O. Primer extension reactions, products separation and radioisotope imaging were carried out as described in the section ‘Pb2+-induced cleavage and primer extension’.
DMS modification in vitro
Before modification with dimethyl sulfate (DMS; Sigma Aldrich), 40 pmol of mRNA-122 was incubated in the buffer: 20 mM NaCl, 5 mM MgCl2, 20 mM HEPES pH 7.8 at 65°C for 5 min and cooled at 25°C for 10 min. Pretreated mixture was divided into four samples and DMS was added to a final concentration of 0.4% and the samples were incubated at 37°C for 3 min, 5 min and 10 min. In the control reaction, an equivalent amount of ethanol was added and the sample was incubated at 37°C for 10 min. Immediately after the reaction, all samples were precipitated with ethanol. Primer extension reactions, products separation and radioisotope imaging were performed as described in the section ‘Pb2+-induced cleavage and primer extension’.
DMS modification in transfected cell culture
Modification with DMS in transfected cell culture was performed similarly as in Kwok et al. [Citation55]. The experiment was conducted in MB352 cells transfected with mRNA-122. After 3.5 h cells were harvested and DMS modification was conducted. Before the modification reaction, the cells were washed with PBS, harvested, resuspended in PBS and divided into two samples. Subsequently, DMS was added to the final concentration of 0.25%. The sample was incubated at 37°C for 10 min and the reaction was terminated by addition of β-mercaptoethanol (Sigma) to the final concentration of 0.7 M. Control reaction was prepared by adding 2 M β-mercaptoethanol and incubation at 37°C for 10 min prior to DMS treatment. The cells were additionally washed twice with 0.7 M β-mercaptoethanol and treated with TRIreagent (Molecular Research Centre or Sigma). RNA was isolated according to standard procedure, and primer extension, product separation and radioisotope imaging were performed as described in the section ‘Pb2+-induced cleavage and primer extension’.
Flow cytometry
Single-cell suspensions were fixed with formaldehyde and permeabilizated, immunostained with 1C12 primary antibody (Cell Signaling) and combined to the fluorochrome-conjugated secondary antibody 4408 (Cell Signaling), as recommended by the manufacturer. Subsequently, flow cytometry analysis was performed. At least 10,000 events per sample were obtained using Becton Dickinson Accuri C6 flow cytometer and the data was analyzed using Accuri CFlow program.
Mapping of RNA accessibility to hybridization with DNA semi-random libraries and RNase H cleavage
Mapping of the RNA fragment corresponding to the G33 – A89 region was conducted based on the previous work [Citation35,Citation36]. Briefly, 0.5 pmol mRNA-122 was incubated in the buffer: 20 mM HEPES pH 8.0, 50 mM KCl, 4 mM MgCl2, 1 mM DTT and 50 μg/ml BSA at 65°C for 2 min and cooled to 37°C. Then, RNase H (Promega) was added to the final concentration of 225 units/ml. The cleavage reaction was induced by adding separately four DNA 6-mer libraries to the final concentration of 185 μM. All samples were incubated for 10 or 30 min at 37°C. The reactions were stopped by adding an equal volume of 20 mM EDTA. Immediately after reaction the samples were purified by chloroform-phenol extraction and RNA was precipitated with ethanol. Primer extension, product separation and radioisotope imaging were performed as described in the section ‘Pb2+-induced cleavage and primer extension’.
Supplemental Material
Download PDF (1.7 MB)Acknowledgments
Dr. Agnieszka Gorska is thanked for assistance at the initial stages of 5′RACE experiment and Dr. Mariola Dutkiewicz for helpful advice and critical reading of the manuscript. We thank Dr. Eliza Wyszko and Dr. Dorota Gurda from the Laboratory of Subcellular Structures Analyses of our Institute for expert help in performing flow cytometry experiments and analyzing the data.
Disclosure statement
No potential conflict of interest was reported by the authors.
Supplementary Material
Supplemental data for this article can be accessed here.
Additional information
Funding
Related Research Data
References
- Courtois S, Verhaegh G, North S, et al. DeltaN-p53, a natural isoform of p53 lacking the first transactivation domain, counteracts growth suppression by wild-type p53. Oncogene. 2002 Oct 3;21(44):6722–6728. PubMed PMID: 12360399; eng.
- Yin Y, Stephen CW, Luciani MG, et al. p53 Stability and activity is regulated by Mdm2-mediated induction of alternative p53 translation products. Nat Cell Biol. 2002 Jun;4(6):462–467. PubMed PMID: 12032546.
- Marcel V, Hainaut P. p53 isoforms - a conspiracy to kidnap p53 tumor suppressor activity? Cell Mol Life Sci. 2009 Feb;66(3):391–406. . PubMed PMID: 18854945.
- Engelmann D, Putzer BM. Emerging from the shade of p53 mutants: N-terminally truncated variants of the p53 family in EMT signaling and cancer progression. Sci Signal. 2014 Sep 30;7(345):re9. . PubMed PMID: 25270260.
- Joruiz SM, Bourdon JC. p53 isoforms: key Regulators of the cell fate decision. Cold Spring Harb Perspect Med. 2016 Aug 1;6(8). PubMed PMID: 26801896; PubMed Central PMCID: PMCPMC4968168. DOI:10.1101/cshperspect.a026039.
- Candeias MM, Powell DJ, Roubalova E, et al. Expression of p53 and p53/47 are controlled by alternative mechanisms of messenger RNA translation initiation. Oncogene. 2006 Nov 2;25(52):6936–6947. PubMed PMID: 16983332; eng.
- Bourdon JC. p53 and its isoforms in cancer. Br J Cancer. 2007 Aug 6;97(3):277–282. PubMed PMID: 17637683; PubMed Central PMCID: PMCPMC2360320.
- Marcel V, Dichtel-Danjoy ML, Sagne C, et al. Biological functions of p53 isoforms through evolution: lessons from animal and cellular models. Cell Death Differ. 2011 Dec;18(12):1815–1824. PubMed PMID: 21941372; PubMed Central PMCID: PMC3214904. eng.
- Ungewitter E, Scrable H. Delta40p53 controls the switch from pluripotency to differentiation by regulating IGF signaling in ESCs. Genes Dev. 2010 Nov 1;24(21):2408–2419. PubMed PMID: 21041409; PubMed Central PMCID: PMCPMC2964751.
- Terrier O, Bourdon JC, Rosa-Calatrava M. p53 protein isoforms: key regulators in the front line of pathogen infections? PubMed PMID: 23592981; PubMed Central PMCID: PMCPMC3616980 PLoS Pathog. 2013;94:e1003246.
- Sonenberg N, Hinnebusch AG. Regulation of translation initiation in eukaryotes: mechanisms and biological targets. Cell. 2009 Feb 20;136(4):731–745. PubMed PMID: 19239892; PubMed Central PMCID: PMCPMC3610329.
- Jackson RJ, Hellen CU, Pestova TV. The mechanism of eukaryotic translation initiation and principles of its regulation. Nat Rev Mol Cell Biol. 2010 Feb;11(2):113–127. PubMed PMID: 20094052; PubMed Central PMCID: PMCPMC4461372.
- Liwak U, Faye MD, Holcik M. Translation control in apoptosis. Exp Oncol. 2012 Oct;34(3):218–230. PubMed PMID: 23070007.
- Aitken CE, Lorsch JR. A mechanistic overview of translation initiation in eukaryotes. Nat Struct Mol Biol. 2012 Jun 5;19(6):568–576. . PubMed PMID: 22664984.
- Halaby MJ, Yang DQ. p53 translational control: a new facet of p53 regulation and its implication for tumorigenesis and cancer therapeutics. Gene. 2007 Jun 15;395(1–2):1–7. PubMed PMID: 17395405.
- Vilborg A, Wilhelm MT, Wiman KG. Regulation of tumor suppressor p53 at the RNA level. J Mol Med (Berl). 2010 Jul;88(7):645–652. PubMed PMID: 20306257.
- Blaszczyk L, Ciesiolka J. Secondary structure and the role in translation initiation of the 5ʹ-terminal region of p53 mRNA. Biochemistry. 2011 Aug 23;50(33):7080–7092. PubMed PMID: 21770379; eng.
- Gorska A, Blaszczyk L, Dutkiewicz M, et al. Length variants of the 5ʹ untranslated region of p53 mRNA and their impact on the efficiency of translation initiation of p53 and its N-truncated isoform DeltaNp53. RNA Biol. 2013 Nov;10(11):1726–1740. PubMed PMID: 24418891; PubMed Central PMCID: PMC3907482.
- Marcel V, Nguyen Van Long F, Diaz JJ. 40 years of research put p53 in translation. Cancers (Basel). 2018 May 21;10(5). PubMed PMID: 29883412; PubMed Central PMCID: PMCPMC5977125. DOI:10.3390/cancers10050152.
- Swiatkowska A, Zydowicz P, Gorska A, et al. The role of structural elements of the 5ʹ-terminal region of p53 mRNA in translation under stress conditions assayed by the antisense oligonucleotide approach. PLoS One. 2015;10(10):e0141676. PubMed PMID: 26513723; PubMed Central PMCID: PMCPMC4626026.
- Zydowicz-Machtel P, Swiatkowska A, Popenda L, et al. Variants of the 5ʹ-terminal region of p53 mRNA influence the ribosomal scanning and translation efficiency. Sci Rep. 2018 Jan 24;8(1):1533. PubMed PMID: 29367734; PubMed Central PMCID: PMCPMC5784139.
- Donehower LA, Harvey M, Slagle BL, et al. Mice deficient for p53 are developmentally normal but susceptible to spontaneous tumours. Nature. 1992 Mar 19;356(6366):215–221. PubMed PMID: 1552940.
- Bienz B, Zakuthouri R, Givol D, et al. Analysis of the gene coding for the murine cellular tumor-antigen P53. Embo J. 1984;3(9):2179–2183. PubMed PMID: WOS:A1984TH11600037; English.
- Bienz-Tadmor B, Zakut-Houri R, Libresco S, et al. The 5ʹ region of the p53 gene: evolutionary conservation and evidence for a negative regulatory element. Embo J. 1985 Dec 1;4(12):3209–3213. PubMed PMID: 3004941; PubMed Central PMCID: PMCPMC554644.
- Kim DY, Kim W, Lee KH, et al. hnRNP Q regulates translation of p53 in normal and stress conditions. Cell Death Differ. 2013 Feb;20(2):226–234. PubMed PMID: 22935615; PubMed Central PMCID: PMCPMC3554343.
- Seo JY, Kim DY, Kim SH, et al. Heterogeneous nuclear ribonucleoprotein (hnRNP) L promotes DNA damage-induced cell apoptosis by enhancing the translation of p53. Oncotarget. 2017 Aug 1;8(31):51108–51122. PubMed PMID: 28881634; PubMed Central PMCID: PMCPMC5584235.
- Yamashita R, Wakaguri H, Sugano S, et al. DBTSS provides a tissue specific dynamic view of Transcription Start Sites. Nucleic Acids Res. 2010 Jan;38(Database issue):D98–D104. PubMed PMID: 19910371; PubMed Central PMCID: PMCPMC2808897.
- Harlow E, Williamson NM, Ralston R, et al. Molecular cloning and in vitro expression of a cDNA clone for human cellular tumor antigen p53. Mol Cell Biol. 1985 Jul;5(7):1601–1610. PubMed PMID: 3894933; PubMed Central PMCID: PMCPMC367278.
- Zakut-Houri R, Bienz-Tadmor B, Givol D, et al. Human p53 cellular tumor antigen: cDNA sequence and expression in COS cells. Embo J. 1985 May;4(5):1251–1255. PubMed PMID: 4006916; PubMed Central PMCID: PMCPMC554332.
- Kozak M. Initiation of translation in prokaryotes and eukaryotes. Gene. 1999 Jul 8;234(2):187–208. PubMed PMID: 10395892.
- Swiatkowska A, Zydowicz P, Sroka J, et al. The role of the 5ʹ terminal region of p53 mRNA in the p53 gene expression. Acta Biochim Pol. 2016;63(4):645–651. PubMed PMID: 27776193.
- Ciesiolka J, Michalowski D, Wrzesinski J, et al. Patterns of cleavages induced by lead ions in defined RNA secondary structure motifs. J Mol Biol. 1998 Jan 16;275(2):211–220. PubMed PMID: 9466904.
- Wilkinson KA, Gorelick RJ, Vasa SM, et al. High-throughput SHAPE analysis reveals structures in HIV-1 genomic RNA strongly conserved across distinct biological states. PLoS Biol. 2008 Apr 29;6(4):e96. PubMed PMID: 18447581; PubMed Central PMCID: PMCPMC2689691.
- Swiatkowska A, Dutkiewicz M, Ciesiolka J. Structural features of target RNA molecules greatly modulate the cleavage efficiency of trans-acting delta ribozymes. Biochemistry. 2007 May 8;46(18):5523–5533. PubMed PMID: 17425288; eng.
- Wrzesinski J, Legiewicz M, Ciesiolka J. Mapping of accessible sites for oligonucleotide hybridization on hepatitis delta virus ribozymes. Nucleic Acids Res. 2000 Apr 15;28(8):1785–1793. PubMed PMID: 10734198; PubMed Central PMCID: PMCPMC102829.
- Gorska A, Swiatkowska A, Dutkiewicz M, et al. Modulation of p53 expression using antisense oligonucleotides complementary to the 5ʹ-terminal region of p53 mRNA in vitro and in the living cells. PLoS One. 2013;8(11):e78863. PubMed PMID: 24244378; PubMed Central PMCID: PMC3824000.
- Candeias MM, Malbert-Colas L, Powell DJ, et al. P53 mRNA controls p53 activity by managing Mdm2 functions. Nat Cell Biol. 2008 Sep;10(9):1098–1105. PubMed PMID: 19160491.
- Tijerina P, Mohr S, Russell R. DMS footprinting of structured RNAs and RNA-protein complexes. PubMed PMID: 17948004; PubMed Central PMCID: PMCPMC2701642 Nat Protoc. 2007;210:2608–2623.
- Karakostis K, Ponnuswamy A, Fusee LT, et al. p53 mRNA and p53 protein structures have evolved independently to interact with MDM2. Mol Biol Evol. 2016 May;33(5):1280–1292. PubMed PMID: 26823446.
- Tackmann NR, Zhang Y. Mouse modelling of the MDM2/MDMX-p53 signalling axis. J Mol Cell Biol. 2017 Feb 1;9(1):34–44. PubMed PMID: 28096294; PubMed Central PMCID: PMCPMC5907827.
- Khan D, Sharathchandra A, Ponnuswamy A, et al. Effect of a natural mutation in the 5ʹ untranslated region on the translational control of p53 mRNA. Oncogene. 2013 Aug 29;32(35):4148–4159. PubMed PMID: 23027126.
- Grover R, Ray PS, Das S. Polypyrimidine tract binding protein regulates IRES-mediated translation of p53 isoforms. Cell Cycle. 2008 Jul 15;7(14):2189–2198. PubMed PMID: 18635961.
- Vassilenko KS, Alekhina OM, Dmitriev SE, et al. Unidirectional constant rate motion of the ribosomal scanning particle during eukaryotic translation initiation. Nucleic Acids Res. 2011 Jul;39(13):5555–5567. PubMed PMID: 21415006; PubMed Central PMCID: PMCPMC3141257.
- Mowat M, Cheng A, Kimura N, et al. Rearrangements of the cellular p53 gene in erythroleukaemic cells transformed by Friend virus. Nature. 1985 Apr 18– 24;314(6012):633–636. PubMed PMID: 3990796.
- Rovinski B, Munroe D, Peacock J, et al. Deletion of 5ʹ-coding sequences of the cellular p53 gene in mouse erythroleukemia: a novel mechanism of oncogene regulation. Mol Cell Biol. 1987 Feb;7(2):847–853. PubMed PMID: 3547084; PubMed Central PMCID: PMCPMC365143.
- Maier B, Gluba W, Bernier B, et al. Modulation of mammalian life span by the short isoform of p53. Genes Dev. 2004 Feb 1;18(3):306–319. PubMed PMID: 14871929; PubMed Central PMCID: PMCPMC338283.
- Hinault C, Kawamori D, Liew CW, et al. Delta40 Isoform of p53 controls beta-cell proliferation and glucose homeostasis in mice. Diabetes. 2011 Apr;60(4):1210–1222. PubMed PMID: 21357466; PubMed Central PMCID: PMCPMC3064094.
- Ali SR, Hippenmeyer S, Saadat LV, et al. Existing cardiomyocytes generate cardiomyocytes at a low rate after birth in mice. Proc Natl Acad Sci U S A. 2014 Jun 17;111(24):8850–8855. PubMed PMID: 24876275; PubMed Central PMCID: PMCPMC4066522.
- Terenin IM, Akulich KA, Andreev DE, et al. Sliding of a 43S ribosomal complex from the recognized AUG codon triggered by a delay in eIF2-bound GTP hydrolysis. Nucleic Acids Res. 2016 Feb 29;44(4):1882–1893. PubMed PMID: 26717981; PubMed Central PMCID: PMCPMC4770231.
- Khan D, Katoch A, Das A, et al. Reversible induction of translational isoforms of p53 in glucose deprivation. Cell Death Differ. 2015 Jul;22(7):1203–1218. PubMed PMID: 25721046; PubMed Central PMCID: PMCPMC4572868.
- Mlynarczyk C, Fahraeus R. Endoplasmic reticulum stress sensitizes cells to DNA damage-induced apoptosis through p53-dependent suppression of p21(CDKN1A). Nat Commun. 2014 Oct 8;5:5067.
- Khan D, Chattopadhyay S, Das S. Influence of metabolic stress on translation of p53 isoforms. Mol Cell Oncol. 2016 Jan;3(1):e1039689. PubMed PMID: 27308557; PubMed Central PMCID: PMCPMC4845197.
- Pluquet O, Qu LK, Baltzis D, et al. Endoplasmic reticulum stress accelerates p53 degradation by the cooperative actions of Hdm2 and glycogen synthase kinase 3beta. Mol Cell Biol. 2005 Nov;25(21):9392–9405. PubMed PMID: 16227590; PubMed Central PMCID: PMCPMC1265800.
- Chiang YJ, Difilippantonio MJ, Tessarollo L, et al. Exon 1 disruption alters tissue-specific expression of mouse p53 and results in selective development of B cell lymphomas. PLoS One. 2012;7(11):e49305. PubMed PMID: 23166633; PubMed Central PMCID: PMCPMC3498120.
- Kwok CK, Ding Y, Tang Y, et al. Determination of in vivo RNA structure in low-abundance transcripts. Nat Commun. 2013;4:2971. PubMed PMID: 24336128.
- Sievers F, Wilm A, Dineen D, et al. Fast, scalable generation of high-quality protein multiple sequence alignments using clustal omega. Mol Syst Biol. 2011 Oct 11;7:539. PubMed PMID: 21988835; PubMed Central PMCID: PMCPMC3261699.