
ABSTRACT
In plant mitochondria, some steady-state transcripts contain primary 5ʹ ends derived from transcription initiation, while the others have processed 5ʹ termini generated by post-transcriptional processing. Differentiation and mapping of the primary and processed transcripts are important for unraveling the molecular mechanism(s) underlying transcription and transcript end maturation. However, previous efforts to systematically differentiate these two types of transcripts in plant mitochondria failed. At present, it is considered that the majority of mature mRNAs may have processed 5ʹ ends in Arabidopsis. Here, by combination of circular RT-PCR, quantitative RT-PCR, RNA 5ʹ-polyphosphatase treatment and Northern blot, we successfully discriminated and mapped the primary and processed transcripts in maize mitochondria. Among the thirty-five mature and eight precursor RNAs analyzed in this study, about one half (21/43) were found to have multiple isoforms. In total, seventy-seven steady-state transcripts were determined, and forty-seven of them had primary 5ʹ ends. Most transcription initiation sites (126/167) were downstream of a crTA-motif. These data suggested a major contribution of transcription initiation to 5ʹ-end formation of steady-state transcripts in maize mitochondria. Moreover, the mapping results revealed that mature RNA termini had largely been formed before trans-splicing, and C→U RNA editing was accompanied with trans-splicing and transcript end formation in maize mitochondria.
Introduction
Mitochondria have their own genetic system originating from an endosymbiotic α-proteobacterial ancestor [Citation1]. In mammals, all of the functional genes are closely spaced on the mitochondrial genome, and the genes encoding rRNAs and mRNAs are separated by genes for tRNAs. Both strands of the mitochondrial genome could be transcribed from single promoter lying in the non-coding regulatory region, producing precursor transcripts encompassing almost the entire genome [Citation1]. The mature RNAs in mammalian mitochondria are derived from the precursor transcripts by cleavages at the sites adjacent to tRNAs, and all of them have processed 5ʹ ends generated by post-transcriptional processing. By contrast, the plant mitochondrial genomes are more complicated due to the dynamic rearrangement [Citation2]. The presence of large intergenic regions and the insertions from nuclear and plastid sequences lead to a loss of polycistronic transcripts. Most mitochondrial genes in plants are transcribed as monocistrons, and a few as dicistron or tricistrons [Citation3,Citation4].
Transcription of plant mitochondrial genes is frequently driven by multiple promoters, giving rise to numerous precursor RNAs with primary 5ʹ termini [Citation5–Citation7]. To generate mature RNAs, these precursors pass through various processing steps including RNA editing, intron splicing, and 5ʹ- and (or) 3ʹ-end formation [Citation8]. Studies on the mechanisms underlying transcript end formation in plant mitochondria have identified several trans-factors and cis-elements involved in this process. Among them, RNase P and RNase Z are two endonucleases, and they could cut at specific sites adjacent to tRNAs or tRNA-like elements (t-elements), releasing tRNAs or other RNA species [Citation9,Citation10]. Following the endonucleolytic cleavages, 3ʹ→5ʹ exonucleases such as polynucleotide phosphorylase and RNase II trim the 3ʹ termini to positions defined by stem-loop structures (SLSs) or RNA binding proteins (RBPs), e.g. pentatricopeptide repeat protein (PPR), thereby generateing the mature 3ʹ ends [Citation11–Citation14]. However, increasing evidence indicates that the exonuclease with 5ʹ→3ʹ activity is absent in plant mitochondria [Citation15,Citation16], and the formation of processed 5ʹ ends may be not associated with exonucleolytic trimming.
Besides those have processed 5ʹ ends, the other steady-state transcripts in plant mitochondria have primary 5ʹ ends derived from transcription initiation [Citation5,Citation7]. A major difference between the primary and processed 5ʹ ends is that the former is triphosphated while the latter is monophosphated [Citation17]. Differentiation and mapping of these two types of transcripts are important to uncover the mechanism(s) underlying transcription and transcript end maturation in plant mitochondria.
At present, several strategies have been developed to distinguish the primary and processed transcripts, including (i) conversion of triphosphate to monophosphate using tobacco acid pyrophosphatase (TAP) followed by rapid amplification of cDNA ends or circular RT-PCR (cRT-PCR), (ii) ribonuclease protection analysis of primary transcripts capped by guanylyl transferase, and (iii) in vitro transcription of putative promoters using isolated mitochondrial protein extracts [Citation5–Citation7,Citation18–Citation20]. Using these strategies, many primary 5ʹ termini have been identified in plant mitochondria. Alignment of the sequences surrounding the primary 5ʹ ends revealed one major type of plant mitochondrial promoter containing core element YRTA (Y = C or T, R = G or A) [Citation5,Citation18–Citation20]. In maize (Zea mays.), in vitro mutagenesis of the atp1 and cox3 promoters showed that the CRTA core was indeed an essential element and that the regions both upstream and downstream of the core element could influence promoter activity [Citation21,Citation22]. In addition to the YRTA core, minor promoter cores including AATA, ATTA, and CTTA have also been documented [Citation5,Citation18,Citation23]. Besides, no conserved sequences were identified in a few other promoters [Citation5].
Although some primary and processed 5ʹ termini have been determined, previous efforts to systematically differentiate the two types of transcripts failed because the triphosphate groups were rather unstable and they could be converted to monophosphate groups for unknown reasons [Citation3–Citation5,Citation17]. The instability of triphosphate groups hinders the discrimination of primary 5ʹ ends from processed 5ʹ termini. Nowadays, it is considered that the majority of mitochondrial mature mRNAs in Arabidopsis (Arabidopsis thaliana) may contain processed 5ʹ termini [Citation3].
By combination of multiple approaches including cRT-PCR, quantitative RT-PCR (RT-qPCR), RNA 5ʹ-polyphosphatase treatment, and Northern blot, we systematically differentiated and mapped the primary and processed transcripts in maize mitochondria. As an improvement, we used 26S rRNA to normalize the two samples treated and not treated by RNA 5ʹ-polyphosphatase, and then compared the transcript abundance between the two samples by cRT-PCR and RT-qPCR. Although a small fraction of unstable primary transcripts was detected, it did not seem to affect the differentiation results. We found about one half of mature and precursor RNAs (21/43) had multiple isoforms. In this work, the data clearly showed that the majority of steady-state transcripts (i.e. different isoforms of mature and precursor RNAs) in maize mitochondria retained the primary 5ʹ ends. The mapping results also revealed that transcript end maturation preceded trans-splicing, and C→U RNA editing was accompanied with the processes of trans-splicing and transcript end formation in maize mitochondria. The present study provides a thorough dataset of transcript termini in maize mitochondria, and it is important for further studies on transcription and transcript end formation in plant mitochondria.
Results
Mapping of mitochondrial mature RNAs with primary 5ʹ termini
cRT-PCR allows simultaneous determination of 5ʹ and 3ʹ extremities of a RNA molecule [Citation3,Citation4,Citation24,Citation25]. Using cRT-PCR and Northern blot as major approaches, we systematically mapped the transcript termini of mitochondrion-encoded genes annotated in maize NB mitochondrial genome (GenBank: AY506529.1), including thirty-four protein-coding (except mat-R) and three rrn (rrn26, rrn18, and rrn5) genes [Citation26]. To distinguish primary and processed 5ʹ ends, we treated the enriched mitochondrial RNAs using 5ʹ-polyphosphatase prior to circularization, and then compared cRT-PCR and RT-qPCR products obtained from the treated and non-treated samples (Fig. 1). Previous studies showed that mature 26S rRNA in maize mitochondria had processed 5ʹ termini [Citation7,Citation27], which was insensitive to RNA 5ʹ-polyphosphatase treatment. Mapping of 26S rRNA in this study confirmed the previous results, and determined its 5ʹ and 3ʹ ends in maize NB mitochondrial genome at 400,232 ~ 400,236 and 403,744 ~ 403,748, respectively (Fig. S1). We therefore performed reverse transcription using gene-specific primers together with rrn26 primer, and normalized the two samples by amplification of the self-ligated 26S rRNA using outward-facing primers.
Among the thirty-seven mitochondrial genes analyzed, twenty-seven were found to be stably accumulated as monocistrons, six as dicistrons, and the other four (nad6, atp6, rps3, and rpl16) as both monocistrons and dicistrons (). Transcription and post-transcriptional processing of the thirty-seven genes generate thirty-five monocistronic and dicistronic mature RNAs in maize mitochondria.
Table 1. 5′ and 3′ termini of the steady-state transcripts in maize NB mitochondria.
By combination of cRT-PCR, RNA 5ʹ-polyphophatase treatment, RT-qPCR, and Northern blot, we systematically discriminated and mapped the thirty-five mature RNAs, and all transcript termini identified are listed in . In the thirty-five mature RNAs analyzed, twenty-seven have primary 5ʹ termini. As examples, mapping of nad4, atp8, and cob are shown in . cRT-PCR detected two major isoforms of nad4 and atp8 mature mRNAs, and the larger ones were strongly amplified from the sample treated by RNA 5ʹ-polyphosphatase, suggesting that they were sensitive to 5ʹ-polyphosphatase and contained 5ʹ terminal triphosphates. The smaller isoforms were obtained in both samples, but the relative levels were much lower in the treated sample, which should be due to the competitive amplification of larger transcripts (). One major band corresponding to cob mature mRNA was strongly amplified from the treated sample. Notably, faint bands with similar sizes as cob and larger isoforms of nad4 and atp8 were also detected in the non-treated sample, but their relative levels were only 6.2% (atp4-1) to 13.0% (cob) of those in the treated counterpart (). These results indicate that cob as well as the larger isoforms of nad4 and atp8 mature mRNAs have primary 5ʹ ends, while the smaller types of nad4 and atp8 contain processed 5ʹ termini.
Figure 1. Mapping of representative mature RNAs with primary 5′ ends. (A) Gel separation of cRT-PCR products. + and -: samples treated and non-treated by RNA 5′-polyphosphatase, respectively. The two samples were normalized by amplification of 26S rRNA (26S) using outward-facing primers. The bands as indicated were sequenced by cloning into vectors. M: DNA molecular marker. (B) RT-qPCR analysis of the relative abundance of circularized primary transcripts after the treatment by 5′-polyphosphatase. n4: nad4-1, a8: atp8-1, cb: cob. +/-: nad4-1, atp8-1, or cob over 26S in the treated sample/nad4-1, atp8-1, or cob over 26S in the non-treated sample, respectively. The values are mean and SD of three biological replicates. (C) RNA gel blot assay of nad4, atp8, and cob transcripts. 2 µg mitochondrial RNAs were loaded in each lane. Bands corresponding to full-length mRNAs revealed by cRT-PCR are marked. n4, a8 and cb: RNA probes derived from coding regions of nad4, atp8, and cob genes, respectively. (D) Transcript termini deduced from cRT-PCR clones. Gene coding regions are shown as gray boxes, and 5′ and 3′ UTRs as bold lines. Positions of 5′ and 3′ ends relative to translation start codon AUG (+1) and stop codon UGA, UAA, or UAG (−1), and numbers of clones obtained at those positions are indicated. Positions of primers used for reverse transcription and PCR amplification are indicated by closed and open arrows, respectively. Positions of outward-facing primers used for RT-qPCR are indicated by open squares. Positions of RNA probes are as indicated. Scale bar = 100 nts.
To determine the precise positions of transcript termini, prominent bands that could be independently amplified were sequenced by cloning into vectors, and the results showed the two major types of nad4 and atp8 were identical at 3ʹ ends, but differed in the length of 5ʹ UTRs (, Table S1). The primary 5ʹ end of nad4 was located 345 nts upstream of AUG (−345), and those of atp8 and cob were enriched in regions −384~−356 and −874~−867, respectively ( and Table S1). The mapping results were confirmed by RNA gel blot (). Both nad4 and atp8 probes detected two dominant bands, while the cob probe recognized one major band. And the sizes of these bands were quite close to those deduced from cRT-PCR results ().
Individual mapping of the other twenty-four monocistrons and dicistrons containing primary 5ʹ ends are shown in gene-specific figures (Figs. S2–S22). Similar to nad4 and atp8, many mature RNAs were accumulated as multiple isoforms, which we numbered sequentially in this study. In the twenty-four mature RNAs, rps4 had six major types, nad2, ccmC and atp1 had five, cox2 and rpl16 had four, and atp4, atp6, atp9 and rps3-rpl16 had three. Two dominant isoforms were detected for nad5, nad6, nad9, cox1, ccmFN-rps1 and atp6-nad6, while only one type was detected for the others. Most steady-state transcripts (including different isoforms of mature RNAs) detected in RNA gel blot were mapped by cRT-PCR, whereas some bands (e.g. rps3-rpl16-3) were difficult to be amplified though different combination of primers had been used (Fig. S19). Moreover, only one and two transcripts containing primary 5ʹ termini were determined for rpl16 and rps4, respectively, which was due to their complex transcript patterns (Figs. S19 and S20). In total, fifty-seven transcripts were determined for the twenty-seven mature mRNAs, and forty-three of them were primary (). RT-qPCR analyses revealed the relative abundance of primary transcripts in the treated sample was 4.5 (atp1-4) to 40 (rps3-rpl16-1) folds higher than that in the non-treated sample, which means 2.5% (rps3-rpl16-1) to 22.2% (atp1-4) of triphosphate at primary 5ʹ ends are converted to monophosphate in maize mitochondria (Figs. S14 and S19).
The 5ʹ ends of most primary transcripts are located at single positions or enriched within small regions, while the transcription initiation sites of nad4L, nad6-1, nad9-2, cox2-4, cox3, ccmFC, atp1-3, atp1-4, atp4-1, atp8-1, atp9-2, and rps7 disperse in large regions spanning dozens of nucleotides (). Except for rpl16-1 (+27), the 5ʹ extremities of primary transcripts were mapped upstream of the coding regions, ranging from −2,364~−2,361 (atp1-1) to −153 (cox1-1).
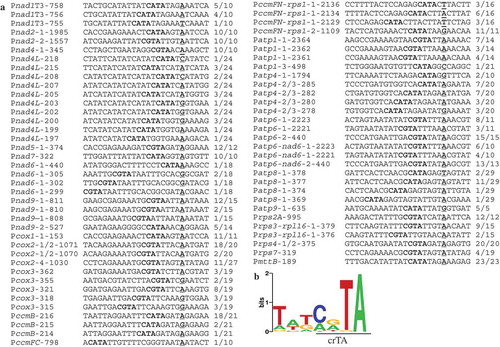
In previous studies, several promoter core elements of plant mitochondrial genes have been reported, including CRTA, TRTA, AATA, ATTA, and CTTA [Citation5,Citation18,Citation19,Citation21,Citation22,Citation28]. Analysis of the sequences within 20-nt upstream regions revealed 136 of the 164 (~82.9%) transcription initiation sites identified for mature RNAs were downstream of the tetranucleotides: CRTA (66/136, 48.5%), TRTA (31/136, 22.8%), and AATA/ATTA/CTTA (39/136, 28.7%) (Figs. 2A and S23). By contrast, the other twenty-eight promoters lacked any putative core element (Fig. S23C). As a negative control, the tetranucleotides were also searched in three random sets of 20-nt sequences selected from 5ʹ UTRs, and about 20% of the sequences contained such short elements (Table S2).
We also screened the regions 20 nts upstream of the 164 initiation sites for sequences consensus using the Multiple Expectation Maximization for Motif Elicitation (MEME) tool [Citation29], and a 7-nt-long motif upstream of 123 (75%) initiation sites was discovered (). This motif is characterized by presence of a core element crTA (uppercase letters depict overrepresented nucleotide >1 bit), and it is significantly more predominant (P value = 4.6e-024) in the putative promoters compared with the background sequences.
Figure 2. Sequence analysis of the regions 20 nts upstream of transcription initiation sites. (A) Primary 5′ ends downstream of putative promoter core elements CRTA (R = A and G). Putative promoters are named as P-transcript name-distance between transcription initiating site and AUG (mature mRNAs) or the downstream exon (nad1T3), and P is short for Promoter; transcription initiating nucleotides are underlined, and putative promoter cores are written in bold; the number of molecules obtained at each initiation site together with the total number of clones sequenced for the recovered band are given. (B) MEME analysis discovered a 7-nt-long promoter motif upstream of 126 transcription initiation sites (for both mature and precursor RNAs). This motif is characterized by presence of a core element crTA (uppercase letters depict overrepresented nucleotide >1 bit).
Previous studies showed the transcript abundance of mitochondrial genes may be dependent on developmental stages [Citation30]. To analyze whether the transcript profiles determined in this study were specific to 13 days after pollination (DAP), we also mapped in 18-DAP kernel tissues the transcript termini of ten representative genes, including nad9, cob, cox1, cox3, atp8, ccmFN, rps1, rps3, rpl16, and mttB (Fig. S24). Analyses by cRT-PCR, RNA 5ʹ-polyphophatase treatment and RT-qPCR showed similar transcript patterns, suggesting expression of these genes were independent of seed development from 13 to 18 DAPs at RNA levels.
The mapping results in this study were compared with previously identified 5ʹ ends in maize mitochondria. We found the 5ʹ termini of nad5, atp9, and 26S rRNA determined here were consistent with the published results [Citation6,Citation24,Citation27], whereas those of cox2, cox3, and atp1 were inconsistent [Citation19,Citation20,Citation22]. Previous mapping of 26S rRNA and atp9 were carried out in maize inbred B37N, and the 5ʹ ends of nad5 and atp1 was analyzed in W22 inbred and pioneer hybrid 3377, respectively. However, the maize lines used to map cox2 and cox3 transcript termini were not clear. Moreover, previous analysis of the regions upstream cox2 5ʹ termini revealed a complex promoter containing seven overlapping units of GTATATA [Citation20], which we failed to detect in maize NB mitochondrial genome, and the sequences surrounding the reported atp1 and cox3 initiating sites could not be identified in NB mitochondrial genome as well [Citation19,Citation21]. These results suggest that the inconsistent mapping results may be due to the genomic structural variation.
The nad6 gene is 1,044 bps downstream of atp6 in maize NB mitochondrial genome [Citation26], and a previous study showed atp6 and nad6 genes were co-transcribed [Citation31]. Northern blot analysis in this study showed complicated transcript patterns of these two genes similar with the published results (Fig. S16C). cRT-PCR mapping results showed that the two types of atp6-nad6 had primary 5ʹ termini, and they were identical at the 3ʹ ends but differed in the length of 5ʹ UTRs (Fig. S16). Moreover, we identified atp6 and nad6 monocistrons, and found that they had both primary and processed transcripts (Fig. S16). The 5ʹ ends of primary atp6 were identical with those of atp6-nad6, while nad6 and atp6-nad6 had the same 3ʹ termini.
The cRT-PCR results showed that the primary forms of nad5, nad6, cox1, atp6, atp8, and rps3-rpl16 were strongly amplified in the treated sample, whereas the relative abundance of the processed ones was much lower (, S4, S7, S16 and S19). RNA gel blot analysis revealed that the abundance of the primary types were much higher than that of the processed ones. Together these results, the primary transcript forms are more abundant for these genes in maize mitochondria.
Interestingly, we found the primary 5ʹ ends of nad4L, cox2-4, and rps7 were distributed in three regions containing direct repeats of CATAT, GTAATA, and GTATATA, respectively (Figs. S3, S8 and S21).
Mapping of mitochondrial mature RNAs with processed 5ʹ termini
As shown above, many mature RNAs are accumulated as multiple isoforms, some of which have processed 5ʹ termini (). In addition to 26S rRNA, only processed types were detected for nad1, nad3-rps12, rps2B, rps12ct-rps7ct, and 5S and 18S rRNAs (Figs. 3 and S25-S28). As examples, mapping of 18S rRNA and nad3-rps12 are shown in . cRT-PCR and Northern blot analyses revealed nad3 and rps12 genes were co-transcribed, while 18S rRNA was accumulated as a monocistron (). RT-qPCR results showed the relative abundance of circularized 18S rRNA were comparable between the two samples treated and non-treated by 5ʹ-polyphosphatase, indicating the presence of monophosphate group at its 5ʹ terminus. By contrast, the relative level was slightly higher for nad3-rps12 in the treated sample. The subsequent analysis showed nad3-rps12 was immediately downstream of tRNALeu, implying the processed 5ʹ end of this dicistron (Fig. 4). Further studies on rps2B, rps12ct-rps7ct, and 5S rRNA showed their relative abundance were almost unchanged after 5ʹ-polyphophatase treatment (Figs. S25-S27). Similar to nad3-rps12, the transcript abundance of nad1 was slightly higher in the treated sample, and the presence of an upstream t-element indicated its 5ʹ ends was likely generated by post-transcriptional processing ( and S28).
Figure 3. Mapping of representative mature RNAs with processed 5′ ends. (A) Gel separation of cRT-PCR products. + and -: samples treated and non-treated by RNA 5′-polyphosphatase, respectively. The two samples were normalized by amplification of 26S rRNA (26S) using outward-facing primers. The bands as indicated were sequenced by cloning into vectors. n3: nad3, r12: rps12, 18S: 18S rRNA. M: DNA molecular marker. (B) RT-qPCR analysis of the relative levels of circularized processed transcripts after the treatment by 5′-polyphosphatase. +/-: nad3-rps12 or 18S over 26S in the treated sample/nad3-rps12 or 18S over 26S in the non-treated sample. The values are mean and SD of three biological replicates. (C) RNA gel blot assay of nad3-rps12 and 18S rRNA. 2 µg mitochondrial RNAs were loaded in each lane. Bands corresponding to mature RNAs revealed by cRT-PCR are marked. n3, r12 and 18S: RNA probes derived from coding regions of nad3, rps12 and rrn18 genes, respectively. (D) Transcript termini deduced from cRT-PCR clones. For nad3-rps12, the gene coding regions are shown as gray boxes, and 5′ and 3′ UTRs as bold lines; the mature 18S rRNA is shown as a black box. 5′ and 3′ ends of nad3-rps12 relative to nad3 AUG (+1) and rps12 UGA (−1) and the transcript termini of 18S rRNA in maize NB mitochondrial genome are indicated. Positions of primers used for reverse transcription and PCR amplification are indicated by closed and open arrows, respectively. Positions of outward-facing primers used for RT-qPCR are indicated by open squares. Positions of RNA probes are as indicated. Scale bar = 100 nts.
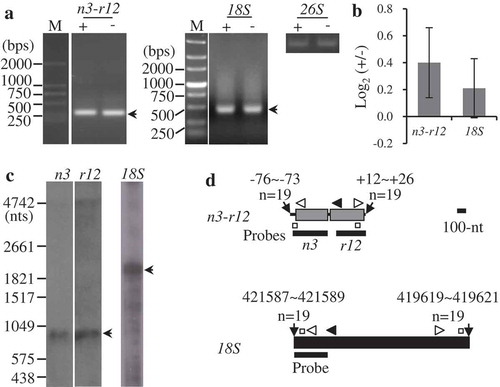
Figure 4. tRNAs and t-elements adjacent to the mapped transcript termini. Positions of transcript termini relative to the neighboring exons are indicated. tRNAs and t-elements are predicted by tRNAscan-SE and Mfold, respectively.
Previous studies reported that the processed 5ʹ termini might be generated by endonucleolytic cleavages at sites adjacent to RNA secondary structures such as tRNAs, t-elements, and SLSs [Citation3]. To identify RNA secondary structures potentially involved in formation of the processed 5ʹ ends, we searched the maize mitochondrial genome for highly conserved 5ʹ-GGTTCRANYCC-3ʹ motif of the pseudo-uridine arm of tRNAs [Citation32]. This screen identified tRNALeu and a t-element exactly upstream the processed 5ʹ ends of nad3-rps12 and nad1, respectively (). Further analysis by Mfold [Citation33] revealed one SLS immediately downstream the processed 5ʹ end of rps3-rpl16-2 (Fig. S29).
For rps13 mature mRNA, Northern blot detected six isoforms (Fig. S30). Due to the complex transcript profile, we failed to discriminate the primary and processed 5ʹ ends, and only three transcripts were mapped by cRT-PCR, i.e. rps13-1, −2, and −3. rps13-1 is directly downstream of tRNAMet, and rps13-2 and −3 have the same 5ʹ extremities adjacent to a t-element (). These analyses indicate that the three rps13 transcripts should have processed 5ʹ termini generated post-transcriptionally.
Totally, twenty-four processed 5ʹ ends were determined for the thirty-five transcription units, and five of them were adjacent to RNA secondary structures ( and S29). Similar with the primary transcripts, many processed 5ʹ termini were mapped at single positions or enriched in small regions, and a few dispersed in large regions spanning dozens of nucleotides (). Except atp1-5 (+89/+90), all processed 5ʹ ends were located upstream of AUG from −1,217~−1,211 (nad1) to −57 (cox1-2). MEME analysis of the regions surrounding processed 5ʹ ends (-/+ 50 nts) failed to identify any conserved sequences.
3ʹ transcript termini in maize mitochondria
The multiple isoforms of nad2, nad4, nad5, nad6, nad9, ccmC, ccmFN-rps1, atp1, atp6, atp6-nad6, atp9, and rps3-rpl16 are identical at 3ʹ ends but variable at the length of 5ʹ UTRs (). By contrast, the different types of cox1, cox2, atp4, atp8, and rps13 vary at both ends. Of the forty-one 3ʹ ends identified in this study, six are terminated at single positions and the other thirty-five are enriched within small regions (). The 3ʹ ends identified here are in agreement with those previously reported for nad5, cox2, atp9, and18S rRNA [Citation24,Citation34].
The 3ʹ termini in maize mitochondria are exclusively located downstream of coding regions with 3ʹ UTR up to 1,826/1,834 nts for rps4 (Fig. S20). Similar with processed 5ʹ termini, MEME analysis of the sequences surrounding 3ʹ ends (-/+ 50 nts) did not reveal any general sequence motifs. By contrast, the search for tRNA or t-element identified tRNACys and tRNALeu exactly downstream the 3ʹ termini of nad5 and ccmC, respectively (). Further screening for other RNA secondary structures by Mfold found ten and six SLSs were immediately upstream and downstream of the mapped 3ʹ termini, respectively (Figs. S31-S33). In summary, more than one third (18/41) of the 3ʹ extremities mapped for mature RNAs are adjacent to RNA secondary structures such as tRNAs and SLSs.
We also observed short non-encoded tracts at 5ʹ→3ʹ junctions of the transcripts analyzed in this study, especially nad3-rps12 (12/19 clones), atp8 (28/53 clones), and mttB (17/23 clones). Most of these non-encoded nucleotides are adenosines and cytidine, and in some cases uridines and guanosines (). The length of the short extensions ranges from one to thirteen nucleotides.
Table 2. Non-encoded nucleotides detected at 5ʹ→3ʹ junctions.
Order of post-transcriptional processes in maize mitochondria
In maize NB mitochondrial genome, the presence of six trans-splicing introns separates nad1, nad2, and nad5 genes to nine independent precursors [Citation26]. Mapping of these precursors makes it possible to unravel the order of post-transcriptional steps, including trans-splicing, transcript end maturation, and RNA editing. In the nine precursors, the transcript termini of nad1T1, nad1T3, nad1T4, nad2T1, nad2T2, nad5T1, nad5T2, and nad5T3 were successfully determined ( and S34). Given the low abundance of these precursors, we did not perform RT-qPCR, and the primary and processed 5ʹ ends were discriminated based on cRT-PCR results. The 5ʹ ends of nad1T1 and nad5T1, and 3ʹ extremities of nad1T4, nad2T2, and nad5T3 are identical with those of corresponding mature mRNAs. The nad2 mature mRNA has five distinct 5ʹ termini, and the two primary 5ʹ ends are the same as those of nad2T1. However, the processed 5ʹ termini of mature nad2 could not be detected for nad2T1. These data indicate most transcript termini of mature nad1, nad2, and nad5 (except the processed 5ʹ ends of nad2) have been formed prior to trans-splicing.
The primary 5ʹ ends of nad1T3 and nad2T1 are downstream of the putative promoter core CRTA, and the processed 5ʹ terminus of nad2T2 coincides with the 3ʹ end of tRNAMet ( and ). The processed 5ʹ extremities of nad1T4, nad5T2, and nad5T3 disperse in large regions spanning dozens of nucleotides, and no RNA secondary structures could be identified nearby ( and S34). The 3ʹ ends of all eight precursors are homogeneous, and seven of them (except nad1T1) are adjacent to tRNAs, t-element, or SLSs (, S31 and S32).
Figure 5. Mapping of nad5 precursors. (A) Gel separation of nad15T1, nad5T2, and nad5T3 cRT-PCR products. + and -: samples treated and non-treated by RNA 5′-polyphosphatase, respectively. The two samples were normalized by amplification of 26S rRNA (26S) using outward-facing primers. The bands as indicated were sequenced by cloning into vectors. M: DNA molecular marker. (B) Transcript termini of nad15T1, nad5T2, and nad5T3 deduced from cRT-PCR clones. Exons are shown as gray boxes, and 5′ and 3′ termini as bold lines. Positions of 5′ and 3′ ends in respect to the neighboring exons, and numbers of clones obtained at those positions are indicated. Positions of primers used for reverse transcription and PCR amplification are indicated by closed and open arrows, respectively. ex and int: exon and intron, respectively. Scale bar = 100 nts.
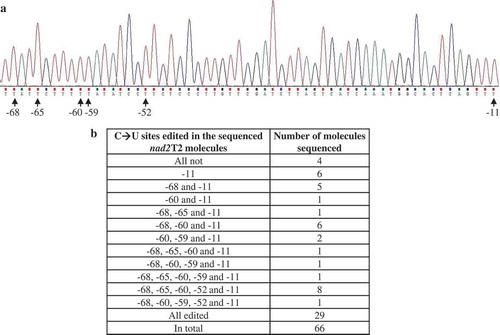
RNA editing is a process that alters the nucleotide sequence of an RNA molecule after transcription, and C→U editing is a major type of RNA editing in plant organelles [Citation35]. In nad2 exon 5, there were six C→U editing sites at positions −68, −65, −60, −59, −52, and −11 relative to translation stop codon UAA (−1), and all forty mature nad2 molecules sequenced were fully edited at the six sites (Fig. 6A). By contrast, only twenty-nine of the sixty-six nad2T2 molecules analyzed were fully edited. In the other thirty-seven clones, four were not edited at all, and thirty-three were partially edited (). In nad1 exon 5, we detected eight C→U editing sites at positions −236, −224, −200, −156, −81, −51, −42, and −26 relative to stop codon, and the twenty mature nad1 molecules analyzed were fully edited at these sites (Fig. S35A). Sequencing the same number of nad1T4 molecules showed seventeen were fully edited while the other three were partially edited (Fig. S35C). In addition to the editing sites in exon 5, we also detected a C→U site in nad1 intron 4b (−268 relative to stop codon), which was edited in all twenty nad1T4 molecules analyzed (Fig. S35 B and C). In contrast to nad2T2 and nad1T4, all five C→U sites (−119, −114, −113, −98, and −96) in nad5 exon 5 were fully edited in the thirty nad5T3 molecules analyzed (Fig. S36). Together these results, C→U RNA editing is accompanied with trans-splicing and transcript end maturation, and a majority of editing sites have been edited preceding trans-splicing.
Figure 6. C→U RNA editing at nad2T2. (A) The six C→U editing sites identified at nad2 exon 5. Positions of the editing sites relative to nad2 UAA (−1) are indicated. All six sites are fully edited in the forty nad2 molecules analyzed. (B) Editing of the six C→U sites in nad1T4 precursor. Among the sixty-six nad2T2 molecules analyzed, twenty-nine were fully edited, four were not edited, and the other thirty-three were partially edited.
C→U RNA editing at UTRs
We also surveyed 5ʹ and 3ʹ UTRs of mature mRNAs for presence of C→U editing sites in maize mitochondria. Because some cRT-PCR primers were anchored on UTRs, we could not examine the whole sequences. In the regions analyzed, seventeen C→U editing sites were detected, but only four of them were fully edited (Table S3). Eight of the seventeen sites were present at 5ʹ UTRs, and the other nine at 3ʹ UTRs. These data suggest most of these C→U editing sites are partially edited, and they are distributed on both 5ʹ and 3ʹ UTRs.
Discussion
Primary and processed transcripts could be discriminated in maize mitochondria
Previous reports showed that the triphosphate groups at primary 5ʹ ends were unstable, and they could be converted to monophosphate groups in plant mitochondria [Citation3–Citation5]. This problem hinders the discrimination of primary and processed transcripts using strategies depending on the presence of triphosphate groups. At present, it is considered that the majority of 5ʹ termini at mitochondrial mature mRNAs are likely generated by post-transcriptional processing in Arabidopsis [Citation3].
By combination of cRT-PCR, 5ʹ-polyphosphatase treatment, and RT-qPCR, we found the primary and processed transcripts could be differentiated in maize mitochondria. The primary transcripts were sensitive to 5ʹ-polyphosphatase, and RT-qPCR analyses revealed that their relative abundance in the sample treated by 5ʹ-polyphosphatase was 4.5 ~ 40 folds higher than that in the non-treated sample. The sequencing results showed that most transcription initiation sites (126/167) were downstream of a crTA-motif ( and S23). By contrast, the processed transcripts were insensitive to 5ʹ-polyphosphatase treatment. For mature RNAs having processed 5ʹ ends only, their relative levels were almost unchanged after 5ʹ-polyphosphatase treatment; for those containing both primary and processed 5ʹ termini, the primary transcripts were strongly amplified in the treated sample, while the processed ones were detected at higher levels in the non-treated sample. Several processed 5ʹ termini were adjacent to RNA secondary structures such as tRNAs, t-elements, and SLS ( and S29). Most of the cRT-PCR mapping results were verified using Northern blot. Although the conversion of triphosphate to monophosphate groups at primary 5ʹ ends was also observed, the ratio was low (2.5 ~ 22.2%) and it did not seem to affect the discrimination results. Moreover, the mapping results seemed to be independent of seed development because ten representative genes showed similar transcript patterns at 13 and 18 DAPs (Fig. S24).
The mature 26S rRNA has processed 5ʹ end (Fig. S1) [Citation27]. As an improvement, we used 26S rRNA to normalize the two samples treated and non-treated by 5ʹ-polyphosphatase, and it was shown to be an important step to distinguish the primary and processed 5ʹ termini. In addition to the processed transcripts, trace amount of precursor 26S rRNA having primary 5ʹ ends was also detected in maize [Citation7,Citation27]. In the normalization step, cRT-PCR and RT-qPCR should detected both processed and primary 26S rRNAs in the treated sample, while only the processed one could be amplified in the non-treated sample. Therefore, the real relative abundance of primary transcripts in the treated sample should be a little higher than that estimated above (4.5 ~ 40 folds), and there should be less than 2.5 ~ 22.5% of triphosphates converted to monophosphate at primary 5ʹ termini.
Similar to 26S rRNA, low levels of precursor nad1, nad3-rps12, rps7ct-rps12ct, rps2B, 5S and 18S rRNAs with primary 5ʹ ends should be present in maize mitochondria as well, and it might be the major cause to the slightly higher levels of nad3-rps12 and nad1 in the treated sample ( and S28). Actually, primary 18S rRNA at low abundance was also detected in maize mitochondria [Citation7].
Major contribution of transcription initiation to RNA 5ʹ-end formation
In this study, most transcripts detected by RNA gel blot were mapped. However, the transcript termini of rps4-3 to −6, rps13-4 to −6, and rpl16-2 and −3 were difficult to determine due to the complex transcript patterns. The failed amplification of rps3-rpsl16-3 by cRT-PCR was not clear. We also attempted to map matR mRNA but failed (Fig. S37). We found the cRT-PCR mapping results of matR were not repeatable, and no dramatic band was detected by Northern blot, suggesting that matR mature mRNA might be accumulated at a very low level in maize mitochondria.
To the thirty-five mature and eight precursor RNAs analyzed, about one half (21/43) are were found to have multiple isoforms. In total, seventy-seven steady-state transcripts (i.e. the different isoforms of mature and precursor RNAs) were mapped and discriminated, and forty-seven of them had primary 5ʹ extremities. Although both primary and processed 5ʹ termini were detected for nad5-T1, nad5, nad6, cox1, atp1, atp6, atp8, and rps3-rpl16, the primary forms were dominant. These data show a majority of steady-state transcripts in maize mitochondria have primary 5ʹ termini, and transcription initiation plays a dominant role in 5ʹ-end formation.
Heterogeneous 5ʹ termini of mitochondrial transcripts in maize
The transcript end mapping results show many primary and processed transcripts are variable in length of 5ʹ UTRs in maize mitochondria (). It is evident that the heterogeneous primary 5ʹ ends are caused by transcription initiation at multiple sites, while the variable length of 5ʹ UTRs in processed transcripts seems to be the lack of 5ʹ→3ʹ exonuclease in plant mitochondria.
In plastids, most genes are transcribed as polycistronic precursors [Citation36]. Generation of mature RNAs is proposed to be initiated by endonucleolytic cleavages near 5ʹ and 3ʹ ends or at the intercistronic regions between coding regions, which releases intermediates bearing variable transcript termini [Citation36,Citation37]. Exonucleases trim the intermediate transcripts 5ʹ→3ʹ or 3ʹ→5ʹ to positions defined by RBPs or RNA secondary structures, thus steady-state RNAs with homogeneous 5ʹ and 3ʹ ends are formed. At present, exonucleases with 5ʹ→3ʹ and (or) 3ʹ→5ʹ activities have been identified in plastids [Citation38–Citation40]. In plant mitochondria, exonucleases with 3ʹ→5ʹ activity have also been characterized, and a similar mechanism of 3ʹ-end maturation is documented [Citation11–Citation14,Citation41]. However, increasing evidence suggest 5ʹ→3ʹ exonuclease is absent in plant mitochondria [Citation3,Citation15,Citation16,Citation42]. Forner et al. (2007) found many mitochondrial transcripts had a defined 3ʹ end but a relaxed 5ʹ end in Arabidopsis [Citation3], Kazama et al. (2013) reported in rice (Oryza sativa) that both atp1 and atp8 mRNAs had multiple 5ʹ ends but single 3ʹ termini [Citation42], and Ruwe et al. (2016) showed mitochondrial small RNAs (sRNAs) representing the footprint of RBPs had stringent 3ʹ but loose 5ʹ ends and few sRNAs overlapping with 5ʹ ends of mitochondrial mRNAs were present in Arabidopsis [Citation15]. In maize mitochondria, we found the 3ʹ ends of steady-state transcripts were homogeneous, but many processed 5ʹ termini were rather heterogeneous, which seems to the intermediates of endonucleolytic cleavages at multiple sites. Due to the lack of 5ʹ→3ʹ exonuclease, the ragged 5ʹ termini were retained in the processed transcripts stably accumulated in maize mitochondria.
RNA secondary structures and transcript end formation in maize mitochondria
In plant organelles, tRNAs and t-elements could be recognized and excised by endonucleases RNase P and RNase Z [Citation9,Citation10,Citation43]. In Arabidopsis and wheat (Triticum aestivum), many 5ʹ and 3ʹ termini of mitochondrial transcripts are adjacent to tRNAs or t-elements, and an involvement of these structures in transcript end maturation have been documented [Citation3,Citation10]. In maize mitochondria, the 5ʹ ends of nad1, nad1T1, nad2T2, nad3-rps12 and rps13-1 to −3, and the 3ʹ termini of nad5, nad5T3 and ccmC are mapped to tRNAs or t-elements (), which implies generation of these ends should be directed by endonucleolytic cleavages of RNase P or RNase Z.
In addition to tRNAs and t-elements, many SLSs are predicted either upstream or downstream of the mapped transcript termini in maize mitochondria (Figs. S29 and S31-S33). The diverse functions of SLSs in post-transcriptional regulation of gene expression have been demonstrated. In plant mitochondria, SLSs could define the mature 3ʹ ends and protect the upstream coding region from degradation by blocking 3ʹ→5ʹ exonucleolytic processing [Citation12,Citation13,Citation44]. In metazoans, the SLS at 3ʹ UTR of histone mRNAs could be recognized by a RBP, which recruits a cleavage factor to cut out the histone mature mRNA [Citation45]. Moreover, many SLSs are identified to be directly upstream the 3ʹ termini of Arabidopsis atp9, nad1, cox2, cox1, nad2, atp8, and rps7 mRNAs, where they might function in exonucleolytic maturation of these ends [Citation3]. In this study, about one half of the mapped 3ʹ ends in both mature and precursor RNAs (25/49) are adjacent to SLSs (Figs. S31–S33). Notably, the SLS upstream of maize atp9 3ʹ end is quite similar to that coincides whith pea atp9 3ʹ terminus, which is demonstrated to define transcript end by blocking 3ʹ→5ʹ exonucleolytic trimming [Citation13]. Since SLSs could be easily found in a given single stranded RNA sequences (Fig. S38), we are not sure the SLSs identified in this study are functional, but they could be candidate RNA processing and (or) stability factors for further studies on transcript end maturation and RNA stabilization in maize mitochondria.
We also notice that neither conserved sequences nor RNA secondary structures could be identified nearby the other 3ʹ ends. The present evidence implies RBP-mediated transcript end maturation mechanism probably accounts for the formation of these ends. Arabidopsis mitochondrial stability factor 1 (AtMTSF1) and AtMTSF2 are two PPR proteins associating with 3ʹ extremities of nad4 mature mRNA and nad1 exons 2–3 precursor RNA, respectively [Citation11,Citation14]. The sequence-specific binding of these two PPR proteins defines the 3ʹ termini and protects RNA from degradation by blocking 3ʹ→5ʹ exonucleolytic cleavage.
Although only two PPR proteins involved in transcript end maturation are reported, fifteen sRNAs overlapping with 3ʹ transcript termini have been detected in Arabidopsis mitochondria, including the one corresponding to AtMTSF1-binding site [Citation11,Citation15]. We compared the 3ʹ termini of mitochondrial mRNAs between maize and Arabidopsis, and found sRNAs overlapping with the 3ʹ ends of Arabidopsis nad2, nad4, nad5, nad7, and nad9 were conserved in maize (Fig. S39). However, the other ten sRNAs overlapping with the 3ʹ ends of Arabidopsis nad1, cox1, ccmB, ccmC, ccmFN2, atp4, rps7, atp8, apt9, and mttB could not be found in maize. Instead, SLSs immediately upstream of 3ʹ ends of maize nad1, cox1, atp8, apt9, and mttB were identified. It is reasonable to assume that the 3ʹ ends of maize nad2, nad4, nad5, nad7 and nad9 mature mRNAs are likely defined by RBPs, while those of nad1, cox1, atp8, apt9, and mttB might be determined by SLSs. In agreement with this argument, a putative MTSF1 ortholog was identified in maize (Fig. S40).
Materials and methods
Isolation of mitochondria from maize kernels
The maize line used in this study is W22 inbred, which contains NB mitochondrial genome [Citation46]. Mitochondria were enriched from developing kernels at 13 or 18 DAP as previously described [Citation47].
RNA extraction and RT-PCRs
The enriched mitochondria were used for RNA extraction by TRIzol reagent (Invitrogen, USA). The concentration and purity of mitochondrial RNAs were assayed with NanoDropTM 2000C (Thermo Fisher Scientific, USA). RNA integrity was assessed on an Agilent Bioanalyzer Lab-on-Chip system (Agilent Technologies, USA; Fig. S41).
To differentiate the primary and secondary transcripts, mitochondrial RNAs were treated with RNA 5ʹ-polyphosphatase (Epicentre, USA) prior to self-ligation. RNA 5ʹ-polyphosphatase could remove two phosphates from the triphosphate groups at primary 5ʹ termini. After the treatment, primary transcripts could be circularized by T4 RNA ligase. By comparing the cRT-PCR and RT-qPCR products obtained from samples treated and non-treated by 5ʹ-polyphosphatase, primary and processed 5ʹ termini were discriminated. The 26S mature rRNA has processed 5ʹ ends, which is insensitive to 5ʹ-polyphosphatase treatment. We therefore performed reverse transcription using gene-specific primers together with rrn26 primer, and then normalized the two samples by amplification of the self-ligated 26S rRNA. The primers used for reverse transcription, and cRT-PCR and RT-qPCR amplifications are listed in Table S4.
The mitochondrial RNAs treated with RNA 5ʹ-polyphosphatase were purified using PureLink RNA Mini kit (Thermo Fisher Scientific, USA) according to the manufacturer’s instructions. One microgram of mitochondrial RNAs treated or not by 5ʹ-polyphosphatase were self-ligated by T4 RNA ligase 1 (NEB, UK), and purified using PureLink RNA Mini kit. To synthesize the first strand cDNAs, 0.2 μg self-ligated mitochondrial RNAs were reverse transcribed using six gene-specific primers plus one rrn26 primer by PrimeScript™ II Reverse Transcriptase (TaKaRa, Japan). Normalization of the two samples treated and non-treated by RNA 5ʹ-polyphosphatase was performed by amplification of circularized 26S rRNA using outward-facing primers. PCR was performed at 57°C annealing temperature for 25 ~ 40 cycles depending on transcript abundance, and the target transcripts could be detected in one round amplification. cRT-PCR products were separated by 1.0 ~ 1.5% agarose gel, and the prominent bands that could be amplified independently were sequenced by cloning into pMD19 vector (TaKaRa, Japan). Positive clones containing the target inserts were determined by colony PCR, and sequenced commercially (Sangon Biotech, China). As an example, the colony PCR selection and sequencing results of single clones containing atp8-1 insert are shown in Fig. S42.
We performed RT-qPCR to compare the abundance of circularized transcripts between the treated and non-treated samples using SsoFast™ EvaGreen Supermixes (Bio-Rad, USA). Each determination included three biological replicates, and every biological replicate contained three technical replicates. The relative transcript levels of target genes were measured in respect to the transcript level of circularized 26S rRNA. Reactions were run on CFX96 Touch™ Real-Time PCR Detection System (Bio-Rad, USA), and data were evaluated using CFX ManagerTM (Bio-Rad, USA).
RNA gel blot hybridization
RNA gel blot hybridization was performed using DIG Northern Starter Kit (Roche, USA). The RNA samples were firstly separated using the denatured agarose gel with 18 or 25 wells, and then transferred to nylon membranes by capillary transfer. For hybridization, individual lanes containing the separated RNA samples were cut out from the nylon membranes using a scissor. DNA fragments used to prepare RNA probes were amplified by primers given in Table S5. PCR products were separated by 1.0% agarose gel, and then recovered and cloned into pEASY-Blunt Simple vector (TransGen Biotech, China), which contains a T7 promoter several bps upstream of the insertion site. To minimize vector sequences in the resulting probes, primers used to amplify the target DNA fragments contained restriction enzyme cutting sites, and the construct was linearized using restriction endonuclease before in vitro transcription by T7 RNA polymerase.
Prediction of RNA secondary structures
SLSs and tRNAs were identified and drawn by Mfold [Citation33] and tRNAscan-SE (http://lowelab.ucsc.edu/tRNAscan-SE/), respectively. t-elements were predicted by Mfold and drawn manually.
Supplemental Material
Download PDF (2.1 MB)Acknowledgments
We thank Dr. Zongliang Chen (Rutgers University), Dr. Caiji Gao (South China Normal University), Dr. Feng Sun and Dr. Yanzhuo Yang (Shandong University) for their comments on the manuscript, and Dr. Qibin Ma and Dr. Yanbo Cheng (South China Agricultural University) for reagents.
Disclosure statement
No potential conflict of interest was reported by the authors.
Additional information
Funding
Related Research Data
References
- Neupert W. Mitochondrial gene expression: a playground of evolutionary tinkering. Annu Rev Biochem. 2016;85:65–76.
- Gualberto JM, Mileshina D, Wallet C, et al. The plant mitochondrial genome: dynamics and maintenance. Biochimie. 2014;100:107–120.
- Forner J, Weber B, Thuss S, et al. Mapping of mitochondrial mRNA termini in Arabidopsis thaliana: t-elements contribute to 5ʹ and 3ʹ end formation. Nucleic Acids Res. 2007;35:3676–3692.
- Choi BY, Acero MM, Bonen L. Mapping of wheat mitochondrial mRNA termini and comparison with breakpoints in DNA homology among plants. Plant Mol Biol. 2012;80:539–552.
- Kuhn K, Weihe A, Borner T. Multiple promoters are a common feature of mitochondrial genes in Arabidopsis. Nucleic Acids Res. 2005;33:337–346.
- Mulligan RM, Lau GT, Walbot V. Numerous transcription initiation sites exist for the maize mitochondrial genes for subunit 9 of the ATP synthase and subunit 3 of cytochrome oxidase. Proc Natl Acad Sci U S A. 1988;85:7998–8002.
- Mulligan RM, Maloney AP, Walbot V. RNA processing and multiple transcription initiation sites result in transcript size heterogeneity in maize mitochondria. Mol Gen Genet. 1988;211:373–380.
- Hammani K, Giege P. RNA metabolism in plant mitochondria. Trends Plant Sci. 2014;19:380–389.
- Canino G, Bocian E, Barbezier N, et al. Arabidopsis encodes four tRNase Z enzymes. Plant Physiol. 2009;150:1494–1502.
- Gutmann B, Gobert A, Giege P. PRORP proteins support RNase P activity in both organelles and the nucleus in Arabidopsis. Gene Dev. 2012;26:1022–1027.
- Haïli N, Arnal N, Quadrado M, et al. The pentatricopeptide repeat MTSF1 protein stabilizes the nad4 mRNA in Arabidopsis mitochondria. Nucleic Acids Res. 2013;41:6650–6663.
- Kuhn J, Tengler U, Binder S. Transcript lifetime is balanced between stabilizing stem-Loop structures and degradation-promoting polyadenylation in plant mitochondria. Mol Cell Biol. 2001;21:731–742.
- Dombrowski S, Brennicke A, Binder S. 3ʹ-Inverted repeats in plant mitochondrial mRNAs are processing signals rather than transcription terminators. Embo J. 1997;16:5069–5076.
- Wang C, Aube F, Planchard N, et al. The pentatricopeptide repeat protein MTSF2 stabilizes a nad1 precursor transcript and defines the 3ʹ end of its 5ʹ-half intron. Nucleic Acids Res. 2017;45:6119–6134.
- Ruwe H, Wang G, Gusewski S, et al. Systematic analysis of plant mitochondrial and chloroplast small RNAs suggests organelle-specific mRNA stabilization mechanisms. Nucleic Acids Res. 2016;44:7406–7417.
- Binder S, Stoll K, Stoll B. P-class pentatricopeptide repeat proteins are required for efficient 5ʹ end formation of plant mitochondrial transcripts. RNA Biol. 2013;10:1511–1519.
- Binder S, Stoll K, Stoll B Maturation of 5ʹ ends of plant mitochondrial RNAs. Physiol Plantarum 2016; 157:280–288.
- Yan B, Pring DR. Transcriptional initiation sites in sorghum mitochondrial DNA indicate conserved and variable features. Curr Genet. 1997;32:287–295.
- Rapp WD, Stern DB. A conserved 11 nucleotide sequence contains an essential promoter element of the maize mitochondrial atp1 gene. Embo J. 1992;11:1065–1073.
- Lupold DS, Caoile AG, Stern DB. The maize mitochondrial cox2 gene has five promoters in two genomic regions, including a complex promoter consisting of seven overlapping units. J Biol Chem. 1999;274:3897–3903.
- Caoile AG, Stern DB. A conserved core element is functionally important for maize mitochondrial promoter activity in vitro. Nucleic Acids Res. 1997;25:4055–4060.
- Rapp WD, Lupold DS, Mack S, et al. Architecture of the maize mitochondrial atp1 promoter as determined by linker-scanning and point mutagenesis. Mol Cell Biol. 1993;13:7232–7238.
- Giese A, Thalheim C, Brennicke A, et al. Correlation of nonanucleotide motifs with transcript initiation of 18S rRNA genes in mitochondria of pea, potato and Arabidopsis. Mol Gen Genet. 1996;252:429–436.
- Zhang YF, Suzuki M, Sun F, et al. The mitochondrion-targeted PENTATRICOPEPTIDE REPEAT78 protein is required for nad5 mature mRNA stability and seed development in maize. Mol Plant. 2017;10:1321–1333.
- Wang HQ, Wang K, Du QG, et al. Maize Urb2 protein is required for kernel development and vegetative growth by affecting pre-ribosomal RNA processing. New Phytol. 2018;218:1233–1246.
- Clifton SW, Minx P, Fauron CM, et al. Sequence and comparative analysis of the maize NB mitochondrial genome. Plant Physiol. 2004;136:3486–3503.
- Maloney AP, Traynor PL, Levings CS 3rd, et al. Identification in maize mitochondrial 26S rRNA of a short 5ʹ-end sequence possibly involved in transcription initiation and processing. Curr Genet. 1989;15:207–212.
- Liere K, Weihe A, Borner T. The transcription machineries of plant mitochondria and chloroplasts: composition, function, and regulation. J Plant Physiol. 2011;168:1345–1360.
- Bailey TL, Boden M, Buske FA, et al. MEME SUITE: tools for motif discovery and searching. Nucleic Acids Res. 2009;37:W202–8.
- Calixte S, Bonen L. Developmentally-specific transcripts from the ccmFN-rps1 locus in wheat mitochondria. Mol Genet Genomics. 2008;280:419–426.
- Haouazine-Takvorian N, Takvorian A, Jubier MF, et al. Genes encoding subunit 6 of NADH dehydrogenase and subunit 6 of ATP synthase are co-transcribed in maize mitochondria. Curr Genet. 1997;31:63–69.
- Hanic-Joyce PJ, Spencer DF, Gray MW. In vitro processing of transcripts containing novel tRNA-like sequences (‘t-elements’) encoded by wheat mitochondrial DNA. Plant Mol Biol. 1990;15:551–559.
- Zuker M. Mfold web server for nucleic acid folding and hybridization prediction. Nucleic Acids Res. 2003;31:3406–3415.
- Williams MA, Johzuka Y, Mulligan RM. Addition of non-genomically encoded nucleotides to the 3ʹ-terminus of maize mitochondrial mRNAs: truncated rps12 mRNAs frequently terminate with CCA. Nucleic Acids Res. 2000;28:4444–4451.
- Shikanai T. RNA editing in plants: machinery and flexibility of site recognition. BBA-Bioenergetics. 2015;1847:779–785.
- Stern DB, Goldschmidt-Clermont M, Hanson MR. Chloroplast RNA metabolism. Annu Rev Plant Biol. 2010;61:125–155.
- Pfalz J, Bayraktar OA, Prikryl J, et al. Site-specific binding of a PPR protein defines and stabilizes 5ʹ and 3ʹ mRNA termini in chloroplasts. Embo J. 2009;28:2042–2052.
- Kishine M, Takabayashi A, Munekage Y, et al. Ribosomal RNA processing and an RNase R family member in chloroplasts of Arabidopsis. Plant Mol Biol. 2004;55:595–606.
- Hayes R, Kudla J, Schuster G, et al. Chloroplast mRNA 3ʹ-end processing by a high molecular weight protein complex is regulated by nuclear encoded RNA binding proteins. Embo J. 1996;15:1132–1141.
- Luro S, Germain A, Sharwood RE, et al. RNase J participates in a pentatricopeptide repeat protein-mediated 5ʹ end maturation of chloroplast mRNAs. Nucleic Acids Res. 2013;41:9141–9151.
- Perrin R, Meyer EH, Zaepfel M, et al. Two exoribonucleases act sequentially to process mature 3ʹ-ends of atp9 mRNAs in Arabidopsis mitochondria. J Biol Chem. 2004;279:25440–25446.
- Kazama T, Yagi Y, Toriyama K, et al. Heterogeneity of the 5ʹ-end in plant mRNA may be involved in mitochondrial translation. Front Plant Sci. 2013;4:517.
- Gobert A, Gutmann B, Taschner A, et al. A single Arabidopsis organellar protein has RNase P activity. Nat Stuct Mol Biol 2010; 17:740–U113.
- Bellaoui M, Pelletier G, Budar F. The steady-state level of mRNA from the Ogura cytoplasmic male sterility locus in Brassica cybrids is determined post-transcriptionally by its 3ʹ region. Embo J. 1997;16:5057–5068.
- Marzluff WF. Metazoan replication-dependent histone mRNAs: a distinct set of RNA polymerase II transcripts. Curr Opin Cell Biol. 2005;17:274–280.
- Liu YJ, Xiu ZH, Meeley R, et al. Empty pericarp5 encodes a pentatricopeptide repeat protein that is required for mitochondrial RNA editing and seed development in maize. Plant Cell. 2013;25:868–883.
- Meyer EH, Tomaz T, Carroll AJ, et al. Remodeled respiration in ndufs4 with low phosphorylation efficiency suppresses Arabidopsis germination and growth and alters control of metabolism at night. Plant Physiol. 2009;151:603–619.