
ABSTRACT
Ultracentrifugation remains the gold standard for isolation of small extracellular vesicles (sEV), particularly for cancer applications. The objective of this study was to determine if a widely used ultracentrifugation protocol for isolation of serum sEV could be modified to reduce the number of ultracentrifugation cycles and increase efficiency, while maintaining equal or better sample purity and yield. Serum was obtained from two healthy subjects. sEVs were isolated from 1 mL aliquots using three different ultracentrifugation protocols. Co-isolation of RNA carrier protein was assessed by performing Western blots for ApoA-I, ApoB, and Ago2. Small RNA-sequencing was performed on the sEV isolates, and differential detection of small ncRNA was compared across isolation protocols. Reduction from three- to two-ultracentrifuge cycles with no sucrose cushion resulted in a much higher sEV yield but also had the highest levels of lipoprotein and Ago2 contamination. However, the two-ultracentrifugation cycle protocol that incorporated a 30% sucrose cushion into the first cycle resulted in slightly higher sEV yields with lower levels of protein contamination compared to the lengthier three-ultracentrifugation cycle approach, therefore presenting a more efficient alternative approach for isolation of serum sEVs. It was also notable that there were some differences in sEV ncRNA cargo according to protocol, although it was less than expected given the differences in co-isolated RNA carrier proteins. Our results suggest that use of the modified serum sEV isolation protocol with two ultracentrifugation cycles and incorporating a 30% sucrose cushion offers a more efficient approach in terms of efficiency and purity.
Introduction
There has been surging interest in recent years in studying and exploiting circulating small extracellular vesicles (sEVs) as biomarkers for both malignant [Citation1–Citation3] and non-malignant diseases [Citation4–Citation7]. Although a number of approaches currently exist for sEV isolation, ultracentrifugation remains the gold standard, particularly for cancer applications. Commercially available polymer-precipitation kits offer rapid means of isolation, but are accompanied by substantial contamination by non-EV proteins and RNA [Citation8]. Although affinity-based purification approaches offer a relatively clean isolation option, their use in patients with malignant disease is accompanied by a risk of bias, since they are based on the assumption that the target protein(s) will be present on the sEV membranes, which is not always the case. To this point, the EV-associated tetraspanins CD63 [Citation9–Citation13], CD9 [Citation12–Citation18], CD81 [Citation14,Citation17,Citation19–Citation22], and HSP70 [Citation23–Citation29] – typically the basis for the affinity purification methods – are commonly downregulated or not expressed by cancer cells. Ultrafiltration via size exclusion columns (SEC), such as qEV columns (Izon Science, Oxford, UK), offer a viable alternative [Citation30] but have a relatively high per sample cost, which can be particularly prohibitive for the comparatively larger sample sizes of human studies. While suppliers tout the reusability of their columns following a cleaning step – up to 5 times per column – this elicits concern by many researchers and clinicians over potential contamination when using discrete human samples.
Although isolation via differential ultracentrifugation may mitigate the potential bias that can stem from affinity-based approaches and offers cleaner isolates relative to polymer-based commercial kits [Citation31], one protocol that has been routinely used for more than a decade requires three lengthy ultracentrifugation cycles [Citation32,Citation33], presenting a practical challenge for use with human samples since each additional cycle greatly reduces overall sEV yield and available volume of serum is often limited. Further, co-isolation of RNA carrier proteins such as lipoproteins [Citation34] or Argonaut proteins [Citation35,Citation36] can confound downstream analysis of sEV small non-coding RNA (ncRNA) cargo. Therefore, we set out to determine if we could reduce the number of ultracentrifugation cycles – and hence, processing time – described in a standard protocol [Citation32], while retaining comparable or better yield and purity – as measured by nanoparticle tracking analysis and co-isolated lipoprotein and Argonaut protein.
Results
We obtained serum from each of two healthy subjects (40 year old Caucasian male and 37 year old Caucasian female). sEV were isolated from 1 mL serum aliquots from each subject using the three different differential ultracentrifugation protocols described below (each in duplicate). The University of Cincinnati Institutional Review Board approved this study and both subjects provided informed consent for participation.
Protocol #1: Two ultracentrifugation cycles (no sucrose cushion)
Serum (1 mL) was diluted with equal volume of phosphate-buffered saline (PBS) and centrifuged for 30 minutes at 2,000 × g at 4°C with a Sorvall ST 16R bench-top centrifuge (Fisher Scientific, Waltham, MA). The supernatant was transferred to a new tube and centrifuged for 45 minutes at 12,000 × g at 4°C. The supernatant was again transferred to a clean ultracentrifuge tube and centrifuged for 2 hours at 110,000 × g at 4ºC with an Optima L-100K ultracentrifuge (Beckman-Coulter, Brea, CA) using a 70Ti fixed-angle rotor. The resultant pellet was resuspended in 1 mL of PBS and then diluted with additional PBS to bring the total volume to 20 mL, which was then filtered through a 0.22-μm filter, collected in a fresh ultracentrifuge tube, and centrifuged for 70 minutes at 110,000 × g at 4ºC using a 70Ti fixed-angle rotor. The supernatant was discarded, and the sEV pellet resuspended in 100 μL of PBS and stored at −80ºC for downstream analysis.
Protocol #2: Three ultracentrifugation cycles (no sucrose cushion)
This is the widely-used serum sEV differential ultracentrifugation protocol previously described by Thery et al. [Citation32]. Briefly, 1mL of serum was diluted with equal volume of PBS and centrifuged for 30 minutes at 2,000 × g at 4°C with a Sorvall ST 16R bench-top centrifuge (Fisher Scientific). The supernatant was transferred to a new tube and centrifuged for 45 minutes at 12,000 × g at 4°C. The supernatant was again transferred to a clean ultracentrifuge tube and centrifuged for 2 hours at 110,000 × g, 4ºC with an Optima L-100K ultracentrifuge (Beckman-Coulter) using a 70Ti fixed-angle rotor. The resultant pellet was resuspended 1 mL PBS and then diluted with additional PBS to bring the total volume to 20 mL, which was then filtered through a 0.22-μm filter, collected in a fresh ultracentrifuge tube, and centrifuged for 70 minutes at 110,000 × g at 4ºC using a 70Ti fixed-angle rotor. The supernatant was discarded, and the pellet was resuspended 1 mL of PBS, diluted with additional PBS to bring the total volume to 20 mL, and centrifuged for 70 minutes at 110,000 × g at 4ºC. The supernatant was again discarded, and the sEV pellet resuspended in 100 μL of PBS and stored at −80ºC for downstream analysis.
Protocol #3: Two ultracentrifugation cycles with 30% sucrose cushion
Serum (1mL) was diluted with equal volume of PBS and centrifuged for 30 minutes at 2,000 × g at 4°C with a Sorvall ST 16R bench-top centrifuge (Fisher Scientific). The supernatant was transferred to a new tube and centrifuged for 45 minutes at 12,000 × g at 4°C. The supernatant was removed, PBS was added to bring the total volume to 20 mL, and it was gently pipetted on top of 4 mL Tris/sucrose/D2O solution (30% sucrose cushion) and centrifuged for 75 minutes at 100,000 × g at 4°C with an Optima L-100K ultracentrifuge (Beckman-Coulter) using a 70Ti fixed-angle rotor. A 5mL syringe fitted with an 18-G needle was used to collect approximately 3.5ml of the sucrose cushion from the side of the ultracentrifuge tube. The aspirate was then transferred to a fresh ultracentrifuge tube, diluted to 60ml with PBS, and centrifuged for 70 minutes at 100,000 × g at 4°C using a 45Ti fixed-angle rotor. The sEV pellet was resuspended in 100 μL PBS and stored at −80ºC for downstream analysis.
Sev quantitation and characterization
Total high-speed ultracentrifugation time was 190 minutes for Protocol #1, 260 minutes for Protocol #2, and 145 minutes for Protocol #3. sEV concentrations were estimated via nanoparticle tracking analysis (NTA) and differed significantly across protocols (pANOVA = 0.003; ). Concentrations were significantly higher for Protocol #1 (two ultracentrifuge cycles) relative to Protocol #2 (three ultracentrifuge cycles; p = 0.03) and Protocol #3 (two ultracentrifuge cycles with 30% sucrose cushion; p = 0.04). Although the estimated particle concentration for Protocol #3 was higher than Protocol #2, the difference was not statistically significant (p = 0.60). Mean particle size significantly differed across protocols (pANOVA = 0.02), where the particles quantified by NTA were slightly larger in the isolates from Protocol #3 relative to those from Protocol #1 (p = 0.01) and were marginally larger than those from Protocol #2 (p = 0.07); for particles from Protocol #1 and Protocol #2 did not significantly differ in size (p = 0.17). The presence of sEVs was confirmed via transmission electron microscopy (TEM; ) and western blot for sEV-associated tetraspanin CD81 and exosome binding protein TSG101 (not shown), in accordance with the minimal experimental requirements described by the International Society for Extracellular Vesicles (ISEV) [Citation37].
Figure 1. Representative transmission electron microscopy (TEM) images of small extracellular vesicle isolates by differential ultracentrifugation protocol, with wide-field images in the lower panels and zoom images in the upper panels. Corresponding scale bars (100 nm) are displayed in the lower right corner of each respective image.
Protein contaminants
We performed western blots to assess the presence of lipoprotein (Apo-A1 and Apo-B) and Argonaut 2 (Ago2) co-isolates in each sample (). Lipoprotein and Ago2 co-isolation was noticeably higher for Protocol #1 (two ultracentrifuge cycles), with some contamination noted for Protocol #2 (three ultracentrifuge cycles), and very faint or no bands observed for Protocol #3 (two ultracentrifuge cycles with 30% sucrose cushion).
Figure 2. Western blot protein analysis for assessment of co-isolation of lipoprotein (ApoA1 and ApoB) and Ago2. P1, P2 and P3 represent samples isolated from Protocol #1 (2 ultracentrifugation cycles), Protocol #2 (3 ultracentrifugation cycles) and Protocol #3 (2 ultracentrifugation cycles with 30% sucrose cushion) respectively.
Differential detection of sEV small ncRNA Cargo
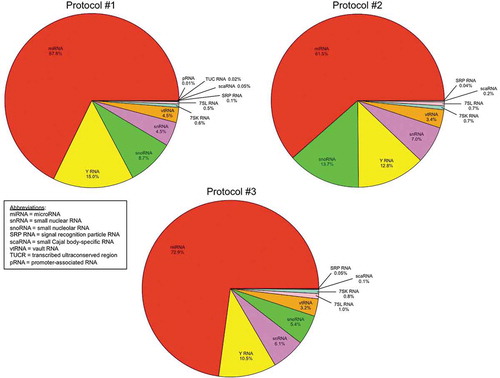
The total read counts for uniquely aligned ncRNA for the samples in Protocol #1 (two ultracentrifuge cycles), Protocol #2 (three ultracentrifuge cycles) and Protocol #3 (two ultracentrifuge cycles with 30% sucrose cushion) were 12901, 9144 and 11345, respectively. A total of 957 discrete small ncRNA transcripts (exclusive of tRNA) were identified across the 12 samples, with a 143 ncRNA having counts > 10 across the 4 isolates for any given protocol (85 ncRNA had counts > 10 across samples in each of the three protocols). The relative proportions of each class of uniquely aligned small ncRNA transcripts detected across the serum sEV isolates for each ultracentrifugation protocol is shown in . MicroRNA (miRNA) was the most prominent small ncRNA class detected in the isolates, regardless of isolation protocol, although the relative proportion of miRNA was slightly higher for Protocol #3 (72.9% of aligned transcripts) compared to Protocol #1 (67.8%) or Protocol #2 (61.5%). Y RNA, small nucleolar RNA (snoRNA), small nuclear RNA (snRNA) and vault RNA (vtRNA) comprised the majority of the remaining sEV ncRNA cargo, with other small ncRNA classes – 7SL RNA, 7SK RNA, signal recognition particle RNA (SRP RNA), small Cajal body-specific RNA (scaRNA), transcribed ultraconserved region (TUCR), and promoter-associated RNA (pRNA) – accounting for less than 2% of detected ncRNA for each the isolates from each protocol. Summary metrics for small RNA-seq and a complete list of all sEV small ncRNA transcripts with respective counts are provided in Supplemental Table S1 and S2.
Figure 3. Relative proportions of uniquely aligned small non-coding RNA (ncRNA) species detected across the serum small extracellular vesicle (sEV) isolates according to ultracentrifugation protocol.
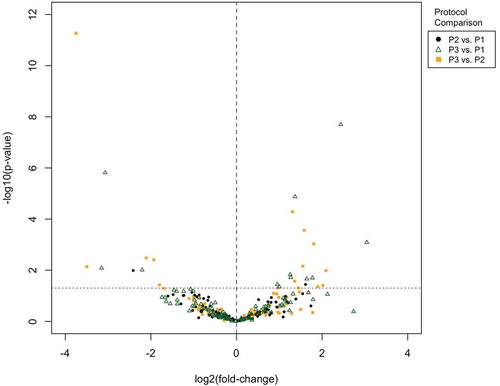
We performed pairwise comparisons across isolation protocols, adjusted for sex, to assess variability of ncRNA in the sEV isolates according to isolation protocol ( and ), given the observed gradient of lipoprotein contamination. There were 11 differential ncRNA between Protocol #1 (two ultracentrifugation cycles) and Protocol #3 (two ultracentrifugation cycles with 30% sucrose cushion) using a nominal p-value ≤ 0.05 (this decreases to 4 differential transcripts when FDR correction is applied, with significance considered where Q ≤ 0.1). Fifteen differential ncRNA transcripts were identified between Protocol #2 and Protocol #3 (this decreased to 8 ncRNA after FDR correction). There was very little difference in ncRNA between the isolates from the two protocols without a 30% sucrose cushion (Protocol #1 and Protocol #2).
Table 1. Size and concentration of small extracellular vesicles (sEV) according to differential ultracentrifugation serum isolation protocol.
Table 2. Pairwise analysis of differentially detected small extracellular vesicular (sEV) non-coding RNA (ncRNA) cargo across serum isolation protocols, adjusted for sex.
Figure 4. Volcano plot of differential small non-coding RNA (ncRNA) present in small extracellular vesicle (sEV) isolates from serum for each pairwise comparison between isolation protocols. P1, P2 and P3 represent samples isolated from Protocol #1 (2 ultracentrifugation cycles), Protocol #2 (3 ultracentrifugation cycles) and Protocol #3 (2 ultracentrifugation cycles with 30% sucrose cushion) respectively.
Discussion
We have described a modified differential ultracentrifugation approach for isolation of sEV from serum that improves sample purity and processing efficiency. The modified protocol (Protocol #3), which entails two ultracentrifugation cycles with a 30% sucrose cushion incorporated into the first cycle, resulted in slightly higher, albeit non-significant, sEV yields with considerably lower levels of lipoprotein and Ago2 contamination compared to the lengthier standard approach (Protocol #2), therefore presenting a more efficient alternative approach for isolation of serum sEVs. Although the protocol involving two ultracentrifuge cycles with no sucrose cushion resulted in a much higher sEV yield, co-isolation of RNA carrier proteins was a substantial issue, drawing into question its utility for scientific and clinical applications.
It is understood that lipoproteins, which can also act as carriers of RNA – including miRNA [Citation34] – are often co-isolated with sEVs, and investigators have voiced concern over this to potentially to confound downstream results [Citation38]. The RNA binding protein Ago2 can also associate with mature miRNA in plasma [Citation35,Citation36]. Although we observed some differences in ncRNA between protocols with and without lipoprotein and Ago2 contamination, it is notable that the differences were not nearly as extensive as we anticipated given the observed differences in co-isolation of lipoproteins and Ago2 by isolation protocol. This is in line with results from a previous study that found similar concentrations of miR-16 and miR-451 measured by droplet digital PCR (ddPCR) in serum exosome isolates using differential ultracentrifugation versus three different commercial exosome precipitation kits [Citation39]. However, while the variance in sEV ncRNA cargo according to degree of co-isolated RNA carriers in the present study was less extensive than expected, it is still notable that some significant differences in sEV ncRNA did exist, and were most pronounced when comparing Protocol #2 (two ultracentrifugation cycles with 30% sucrose cushion) – which had little to no co-isolation of lipoproteins or Ago2 – to the protocols without a sucrose cushion – which had higher levels of RNA carrier proteins present. Accordingly, co-isolation of these proteins should be minimized whenever possible to mitigate potential errant conclusions.
There were several strengths to our study, notably our inclusion of intra- and inter-personal biological replicates, use of multiple approaches – including NTA, TEM, and Western blots – for characterization of the sEV isolates, and comprehensive small RNA-seq for evaluation of the impact of ultracentrifugation protocol on sEV ncRNA cargo. However, there were also some potential limitations. One minor limitation of this study is that NTA, which was used to quantify the sEV yield for each protocol, cannot discriminate between extracellular vesicles and protein aggregates or other nanoparticles within the same size range [Citation40]. However, while this may be an issue in terms of overestimation for the 2-cycle protocol with no sucrose cushion, the protocol that we found to be most favorable – Protocol #3 (2-cycle with a 30% sucrose cushion) – had the lowest amount of detectable lipoprotein, suggesting that, if anything, we overestimated the sEV yield of the other two methods relative to it. Another potential issue is that the method for isolation of extracellular vesicles can impact sEV size, structure and cargo [Citation8]. Indeed, we observed differences in mean sEV sizes between the sucrose cushion protocol and the two protocols lacking a sucrose cushion. However, it is unclear if those disparities relate to true differences in sEV size distribution or if they are skewed by detection of protein aggregates present in the isolates from the two protocols that did not incorporate the sucrose cushion. Moreover, the observed differences in sEV cargo detected were minimal, particularly when accounting for multiple comparisons, mitigating such concern.
Our results suggest that use of the modified serum sEV isolation protocol presented here (Protocol #3) reducing to two ultracentrifugation cycles with an incorporated 30% sucrose cushion offers a more efficient approach in terms of efficiency and overall purity the isolates.
Materials & Methods
Serum collection
Serum was collected in 4 × 8.5mL BD Vacutainer® SST™ tubes (BD, Franklin Lakes, NJ) from each subject using a butterfly needle. Blood was allowed to clot at room temperature for 30 minutes, tubes were centrifuged at 1,500 × g for 15 minutes to separate the serum, and serum was removed and stored in 1 mL aliquots at −80°C.
Nanoparticle tracking analysis
The sEV size range and concentration for each isolate was determined via nanoparticle tracking analysis (NTA) using a NanoSight NS300 instrument (Malvern, Worcestershire, UK). sEV isolates were diluted 1:100 in PBS, with the instrument set to camera level 14 and detection threshold = 5. Differences in size and concentration of sEV isolates were first compared via one-way analysis of variance (ANOVA), followed by pairwise t-tests using Stata 13 (StataCorp LLC, College Station, TX) with significance considered where p ≤ 0.05; all tests were two-sided.
Transmission electron microscopy
sEV were visually confirmed by TEM imaging using a JEOL JEM-1230 instrument. To prepare the sample, a drop of 0.1% bovine serum albumin (BSA) was placed on a formvar carbon coated grid for 1 minute and then wicked away with a piece of filter paper. We then placed 10µL of the sEV isolate on the grid for 5 minutes, after which we gently wicked the sample away and added 10 drops of 2% aqueous uranyl acetate (UA) to the grid. The UA was then wicked away, and the grid was allowed to dry prior to imaging.
Western blots
The presence of sEVs was further confirmed by western blot for the EV-associated tetraspanin CD81 and cytosolic endosomal sorting complex component TSG101 [Citation37]. Western blots were additionally performed to assess contamination by proteins that can potentially harbor small ncRNA, using antibodies against ApoA-I, ApoB, and Ago2.
CD81, TSG101 and Ago2: were run using NuPAGE 4–12% Bis-Tris Gels (Thermo Fisher Scientific) in a mini gel tank with MOPS SDS Running Buffer with added NuPAGE Antioxidant. Samples were mixed with 4× Laemmli SDS sample buffer (non-reducing) and NuPAGE Reducing Agent (10x) and heated to 95°C for 7 minutes. The gel was run for 50 minutes at 200V constant. Proteins were subsequently transferred onto polyvinylidene difluoride (PVDF) membrane with Step 1- Transfer buffer on a Pierce Power Station (Thermo Fisher Scientific) for 10 minutes at 1.3A constant. CD81 (ab79559, Abcam, Cambridge, UK), TSG101 (ab30871, Abcam), and Ago2 (C34C6, Cell Signaling, Danvers, MA) antibody was added 1:1000 in 5% milk, 5% bovine serum albumin (BSA) and 5% BSA, respectively, in tris-buffered saline and Tween 20 (TBST) overnight at 4°C. After washing the membrane 3 times at 5 minutes each in TBST, secondary antibody Goat anti-Mouse IgG H&L (ab205719, Abcam) was added 1:3000 in 5% milk in TBST for three hours for CD81 and secondary antibody goat anti-Rabbit IgG H&L (ab205718, Abcam) was added 1:2000 in 5% BSA in TBST for two hours, respectively. Following 3 final washes at 5 minutes each, detection was performed using a WesternBright ECL detection kit (Advansta, Menlo Park, CA) on a C-DiGit Blot Scanner (LI-COR Biotechnology, Lincoln, NE).
ApoA-I and ApoB: were run on a 4–20% CriterionTM TGX Precast Gel (BioRad, Hercules, CA) in a CriterionTM Vertical electrophoresis tank (BioRad) with 1× Tris-Glycine-SDS (TGS) running buffer. Samples were mixed with 4 x SDS Loading buffer with β-mercaptoethanol and heated to 90°C for 5 minutes. The gel was run for ~45 minutes at 200V constant. Proteins were subsequently transferred onto a nitrocellulose membrane with tris-glycine methanol transfer buffer using a CriterionTM Blotter (BioRad) for 20 minutes at 35V followed by 75 minutes at 70V. Blocked membrane for 0.5 hours with Odyssey Blocking Buffer (LI-COR). ApoA-I (ab25945, Abcam) and ApoB (ab98132, Abcam) antibody were respectively added at 1:1000 in 2% BSA in TBST+0.05% sodium-azide overnight at 4°C. After washing the membrane 3 times at 5 minutes each in TBST, secondary RDye 800 CW Goat anti-Rabbit IgG IRDye 800 (cat# 926–32211, LI-COR) or IRDye 800 CW Donkey anti-Goat IgG (cat# 926–32214, LI-COR) was added at 1:10,000 in 1% milk in TBST for 1 hour at room temperature in the dark. Following 3 final washes at 10 minutes each, detection was performed on an Odyssey Imaging Scanner (LI-COR).
Small RNA-sequencing
Total RNA was extracted from sEV isolates using the miRNeasy Micro kit (Qiagen, Valencia, CA) according to the manufacturer’s suggested protocol. Small RNA library preparation and sequencing performed by the University of Cincinnati Genomics, Epigenomics and Sequencing Core using a custom library preparation protocol designed to handle low input and fragmented RNA that is commonly encountered in extracellular vesicles (provisional patent #: # 62/434,531).
To prepare the library, the NEBNext small RNA sample library preparation kit (New England BioLabs, Ipswich, MA) was used with ~5 ng of total RNA determined by Bioanalyzer RNA 6000 Pico Kit (Agilent, Santa Clara, CA) in a 5-µL solution as input, following the manufacturer’s suggested protocol, modified to allow for precise library size selection to increase small RNA detection sensitivity and specificity. After 15 cycles of PCR for indexing and library enrichment, an equal-volume of 10 μl PCR mix (library without size selection) per sample together with the same volume of the negative control were pooled, followed by DNA cleanup using DNA Clean & Concentrator (Zymo Research, Irvine, CA) and mixed with 135 and 319 bp custom-made ladders targeting the library 16–200 nt small RNA cDNA insert. Next, precise size selection of the 135–319 bp library via 2.75% agarose gel electrophoresis was performed at 7 v/cm for 1.5 hours. After gel purification, 2 µl of each library was diluted 1:104 in dilution buffer (10 mM Tris-HCl, pH 8.0 with 0.05% Tween 20), and library concentration was measured by qPCR using the NEBNext Library Quant Kit (New England BioLabs) on a QuantStudio 5 Real-Time PCR System (Thermo Fisher Scientific). Quantified libraries were clustered onto a flow cell at the concentration of 15 pM using the TruSeq SR Cluster Kit v3 (Illumina), and sequenced for 51 cycles using TruSeq SBS kit on a HiSeq 1000 system (Illumina) to generate a few million reads. Based on the sequencing read number from each sample, an equal-read number pool from the PCR mix was calculated via volume adjustment of the PCR mix. Finally, the same procedure for the second round of sequencing was performed to generate expected number of reads for final data analysis.
Bioinformatic analysis of small RNA-seq
Following small RNA-seq, reads were demultiplexed and aligned to small RNA sequences using STAR RNA-seq aligner [Citation41]. Small non-coding RNA (ncRNA) – miRNA, misc_RNA, scRNA, snRNA, sRNA, snoRNA, scaRNA – were quantified based on the M16 release of GENCODE [Citation42,Citation43] via RNA-Seq by Expectation Maximization (RSEM) using the RSEM package [Citation44]. Post-alignment quality control (RNA-SeQC [Citation41]) was performed to assess number of abundant small RNA and degree of replication between samples. Differential expression analysis was performed based on reads per kilobase per million mapped reads (RPKM) using Bioconductor packages edgeR [Citation45,Citation46] and DESeq2 [Citation47]. Statistical significance of differential expression was determined based on unadjusted nominal p-value (p ≤ 0.05); FDR-adjusted p-values (Q < 0.1) were also presented [Citation48]. Cluster analysis of differentially secreted small RNA was performed using the Bayesian infinite mixture model [Citation49].
Supplemental Material
Download MS Excel (154.3 KB)Disclosure statement
No potential conflict of interest was reported by the authors.
Supplementary material
Supplemental data for this article can be accessed here.
Additional information
Funding
Related Research Data
References
- Thind A, Wilson C. Exosomal miRNAs as cancer biomarkers and therapeutic targets. J Extracell Vesicles. 2016;5:31292.
- Kinoshita T, Yip KW, Spence T, et al. MicroRNAs in extracellular vesicles: potential cancer biomarkers. J Hum Genet. 2017;62:67–74.
- Kalluri R. The biology and function of exosomes in cancer. J Clin Invest. 2016;126:1208–1215.
- Campion CG, Sanchez-Ferras O, Batchu SN. Potential role of serum and urinary biomarkers in diagnosis and prognosis of diabetic nephropathy. Can J Kidney Health Dis. 2017;4:2054358117705371.
- Graham EM, Burd I, Everett AD, et al. Blood biomarkers for evaluation of perinatal encephalopathy. Front Pharmacol. 2016;7:196.
- Kumar S, Reddy PH. Are circulating microRNAs peripheral biomarkers for Alzheimer’s disease? Biochim Biophys Acta. 2016;1862:1617–1627.
- Tsochandaridis M, Nasca L, Toga C, et al. Circulating microRNAs as clinical biomarkers in the predictions of pregnancy complications. Biomed Res Int. 2015;2015:294954.
- Taylor DD, Shah S. Methods of isolating extracellular vesicles impact down-stream analyses of their cargoes. Methods. 2015;87:3–10.
- Nagelkerke A, Sweep FC, Stegeman H, et al. Hypoxic regulation of the PERK/ATF4/LAMP3-arm of the unfolded protein response in head and neck squamous cell carcinoma. Head Neck. 2015;37:896–905.
- Qiu X, You Y, Huang J, et al. LAMP3 and TP53 overexpression predicts poor outcome in laryngeal squamous cell carcinoma. Int J Clin Exp Pathol. 2015;8:5519–5527.
- Morbini P, Capello GL, Alberizzi P, et al. Markers of squamocolumnar junction cells in normal tonsils and oropharyngeal cancer with and without HPV infection. Histol Histopathol. 2015;30:833–839.
- Funakoshi T, Tachibana I, Hoshida Y, et al. Expression of tetraspanins in human lung cancer cells: frequent downregulation of CD9 and its contribution to cell motility in small cell lung cancer. Oncogene. 2003;22:674–687.
- Woegerbauer M, Thurnher D, Houben R, et al. Expression of the tetraspanins CD9, CD37, CD63, and CD151 in Merkel cell carcinoma: strong evidence for a posttranscriptional fine-tuning of CD9 gene expression. Mod Pathol. 2010;23:751–762.
- Buim ME, Lourenco SV, Carvalho KC, et al. Downregulation of CD9 protein expression is associated with aggressive behavior of oral squamous cell carcinoma. Oral Oncol. 2010;46:166–171.
- Zhang BH, Liu W, Li L, et al. KAI1/CD82 and MRP1/CD9 serve as markers of infiltration, metastasis, and prognosis in laryngeal squamous cell carcinomas. Asian Pac J Cancer Prev. 2013;14:3521–3526.
- Erovic BM, Pammer J, Hollemann D, et al. Motility-related protein-1/CD9 expression in head and neck squamous cell carcinoma. Head Neck. 2003;25:848–857.
- Okochi H, Kato M, Nashiro K, et al. Expression of tetra-spans transmembrane family (CD9, CD37, CD53, CD63, CD81 and CD82) in normal and neoplastic human keratinocytes: an association of CD9 with alpha 3 beta 1 integrin. Br J Dermatol. 1997;137:856–863.
- Huang CI, Kohno N, Ogawa E, et al. Correlation of reduction in MRP-1/CD9 and KAI1/CD82 expression with recurrences in breast cancer patients. Am J Pathol. 1998;153:973–983.
- Lee MS, Kim JH, Lee JS, et al. Prognostic significance of CREB-binding protein and CD81 expression in primary high grade non-muscle invasive bladder cancer: identification of novel biomarkers for bladder cancer using antibody microarray. PLoS One. 2015;10:e0125405.
- Yoo TH, Ryu BK, Lee MG, et al. CD81 is a candidate tumor suppressor gene in human gastric cancer. Cell Oncol (Dordr). 2013;36:141–153.
- Muzzafar T, Medeiros LJ, Wang SA, et al. Aberrant underexpression of CD81 in precursor B-cell acute lymphoblastic leukemia: utility in detection of minimal residual disease by flow cytometry. Am J Clin Pathol. 2009;132:692–698.
- Inoue G, Horiike N, Onji M. The CD81 expression in liver in hepatocellular carcinoma. Int J Mol Med. 2001;7:67–71.
- Frohwitter G, Buerger H, Korsching E, et al. Site-specific gene expression patterns in oral cancer. Head Face Med. 2017;13:6.
- Boonjaraspinyo S, Boonmars T, Kaewkes S, et al. Down-regulated expression of HSP70 in correlation with clinicopathology of cholangiocarcinoma. Pathol Oncol Res. 2012;18:227–237.
- Zohrabian VM, Nandu H, Gulati N, et al. Gene expression profiling of metastatic brain cancer. Oncol Rep. 2007;18:321–328.
- Lebret T, Watson RW, Molinie V, et al. Heat shock proteins HSP27, HSP60, HSP70, and HSP90: expression in bladder carcinoma. Cancer. 2003;98:970–977.
- Cornford PA, Dodson AR, Parsons KF, et al. Heat shock protein expression independently predicts clinical outcome in prostate cancer. Cancer Res. 2000;60:7099–7105.
- Park CS, Joo IS, Song SY, et al. An immunohistochemical analysis of heat shock protein 70, p53, and estrogen receptor status in carcinoma of the uterine cervix. Gynecol Oncol. 1999;74:53–60.
- Nanbu K, Konishi I, Komatsu T, et al. Expression of heat shock proteins HSP70 and HSP90 in endometrial carcinomas. Correlation with clinicopathology, sex steroid receptor status, and p53 protein expression. Cancer. 1996;77:330–338.
- Boing AN, van der Pol E, Grootemaat AE, et al. Single-step isolation of extracellular vesicles by size-exclusion chromatography. J Extracell Vesicles. 2014;3(1): eCollection 2014.
- Lobb RJ, Becker M, Wen SW, et al. Optimized exosome isolation protocol for cell culture supernatant and human plasma. J Extracell Vesicles. 2015;4:27031.
- Thery C, Amigorena S, Raposo G, et al. Isolation and characterization of exosomes from cell culture supernatants and biological fluids. Curr Protoc Cell Biol. 2006. Chapter 3:Unit 3. 22: 3.22.1-3.22.29.
- Caby MP, Lankar D, Vincendeau-Scherrer C, et al. Exosomal-like vesicles are present in human blood plasma. Int Immunol. 2005;17:879–887.
- Michell DL, Vickers KC. Lipoprotein carriers of microRNAs. Biochim Biophys Acta. 2016;1861:2069–2074.
- Arroyo JD, Chevillet JR, Kroh EM, et al. Argonaute2 complexes carry a population of circulating microRNAs independent of vesicles in human plasma. Proc Natl Acad Sci USA. 2011;108:5003–5008.
- Turchinovich A, Weiz L, Langheinz A, et al. Characterization of extracellular circulating microRNA. Nucleic Acids Res. 2011;39:7223–7233.
- Lotvall J, Hill AF, Hochberg F, et al. Minimal experimental requirements for definition of extracellular vesicles and their functions: a position statement from the International Society for Extracellular Vesicles. J Extracell Vesicles. 2014;3:26913.
- Simonsen JB. What are we looking at? Extracellular vesicles, lipoproteins, or both? Circ Res. 2017;121:920–922.
- Helwa I, Cai J, Drewry MD, et al. A comparative study of serum exosome isolation using differential ultracentrifugation and three commercial reagents. PLoS One. 2017;12:e0170628.
- Filipe V, Hawe A, Jiskoot W. Critical evaluation of Nanoparticle Tracking Analysis (NTA) by NanoSight for the measurement of nanoparticles and protein aggregates. Pharm Res. 2010;27:796–810.
- DeLuca DS, Levin JZ, Sivachenko A, et al. RNA-SeQC: RNA-seq metrics for quality control and process optimization. Bioinformatics. 2012;28:1530–1532.
- Harrow J, Frankish A, Gonzalez JM, et al. GENCODE: the reference human genome annotation for the ENCODE project. Genome Res. 2012;22:1760–1774.
- Mudge JM, Harrow J. Creating reference gene annotation for the mouse C57BL6/J genome assembly. Mamm Genome. 2015;26:366–378.
- Li B, Dewey CN. RSEM: accurate transcript quantification from RNA-Seq data with or without a reference genome. BMC Bioinformatics. 2011;12:323.
- Robinson MD, McCarthy DJ, Smyth GK. edgeR: a Bioconductor package for differential expression analysis of digital gene expression data. Bioinformatics. 2010;26:139–140.
- McCarthy DJ, Chen Y, Smyth GK. Differential expression analysis of multifactor RNA-Seq experiments with respect to biological variation. Nucleic Acids Res. 2012;40:4288–4297.
- Love MI, Huber W, Anders S. Moderated estimation of fold change and dispersion for RNA-seq data with DESeq2. Genome Biol. 2014;15:550.
- Storey JD, Tibshirani R. Statistical significance for genomewide studies. Proc Natl Acad Sci USA. 2003;100:9440–9445.
- Freudenberg JM, Sivaganesan S, Wagner M, et al. A semi-parametric Bayesian model for unsupervised differential co-expression analysis. BMC Bioinformatics. 2010;11:234.