
ABSTRACT
5-fluorouracil (5-FU) was isolated as an inhibitor of thymidylate synthase, which is important for DNA synthesis. The drug was later found to also affect the conserved 3ʹ-5ʹ exoribonuclease EXOSC10/Rrp6, a catalytic subunit of the RNA exosome that degrades and processes protein-coding and non-coding transcripts. Work on 5-FU’s cytotoxicity has been focused on mRNAs and non-coding transcripts such as rRNAs, tRNAs and snoRNAs. However, the effect of 5-FU on long non-coding RNAs (lncRNAs), which include regulatory transcripts important for cell growth and differentiation, is poorly understood. RNA profiling of synchronized 5-FU treated yeast cells and protein assays reveal that the drug specifically inhibits a set of cell cycle regulated genes involved in mitotic division, by decreasing levels of the paralogous Swi5 and Ace2 transcriptional activators. We also observe widespread accumulation of different lncRNA types in treated cells, which are typically present at high levels in a strain lacking EXOSC10/Rrp6. 5-FU responsive lncRNAs include potential regulatory antisense transcripts that form double-stranded RNAs (dsRNAs) with overlapping sense mRNAs. Some of these transcripts encode proteins important for cell growth and division, such as the transcription factor Ace2, and the RNA exosome subunit EXOSC6/Mtr3. In addition to revealing a transcriptional effect of 5-FU action via DNA binding regulators involved in cell cycle progression, our results have implications for the function of putative regulatory lncRNAs in 5-FU mediated cytotoxicity. The data raise the intriguing possibility that the drug deregulates lncRNAs/dsRNAs involved in controlling eukaryotic cell division, thereby highlighting a new class of promising therapeutical targets.
Introduction
In spite of substantial progress made over the past couple of decades, effective chemotherapeutical treatment of most somatic cancers remains a challenge. Within a large variety of anti-cancer drugs available, agents that inhibit DNA replication and repair are among the oldest and most widely used compounds in therapies of many solid tumors. One of the best-studied examples, 5-fluorouracil (5-FU), was initially designed in 1957 to interfere with pyrimidine biosynthesis. Later work confirmed the drug's ability to inhibit thymidilate synthase, a key enzyme in this pathway and to interfere with the formation of ribosomal RNA [Citation1–Citation3]. Subsequently, 5-FU was proposed to also act through an RNA pathway [Citation4,Citation5]. The mechanism of action involves incorporation of fluorinated uracil into transcripts, which converts them into poor substrates for the conserved 3ʹ-5ʹ exoribonuclease EXOSC10/Rrp6 [Citation6–Citation8]. EXOSC10/Rrp6 is involved in global RNA processing and degradation either independently of or in association with the RNA exosome, which is a multi-subunit complex conserved from yeast to human [Citation9,Citation10].
Saccharomyces cerevisiae is a versatile model organism that has been used extensively to study mitotic cell growth and division in the presence of anti-proliferative compounds such as 5-FU [Citation11–Citation13]. While both DNA- and RNA based mechanisms have been invoked for the drug’s effects in cancer cells, it is noteworthy that 5-FU toxicity in S. cerevisiae appears to be mostly due to altered RNA processing [Citation5,Citation13]. This marks yeast out as a useful system to study the global transcriptional response to 5-FU. Yeast RRP6, although not annotated as an essential gene, is important for normal cell growth and differentiation in various strain backgrounds [Citation14–Citation17]. Its human ortholog EXOSC10 was initially thought to be non-essential [Citation18], but more recent work demonstrated its critical role for somatic and germ cell division in mouse and human [Citation19–Citation21].
A large fraction of EXOSC10/Rrp6’s substrates are lncRNAs that are broadly defined as transcripts with little or no coding potential. In yeast, this class of RNAs includes cryptic unstable transcripts (CUTs) and meiotic unannotated transcripts (MUTs) that accumulate to peak levels in a vegetatively growing rrp6 mutant and sporulating wild type cells [Citation16,Citation22]. Two other major types of lncRNAs are Xrn1-sensitive unstable transcripts (XUTs), and stable unannotated transcripts (SUTs) [Citation23,Citation24]. The roles of most lncRNAs are unknown. However, a growing body of evidence indicates that many of them are not a dispensable byproduct of bi-directional transcription, but regulate gene expression via promoter interference and sense/antisense (s/a) interference of transcription in both fission- and budding yeast [Citation25–Citation31].
Regulatory lncRNAs are known to play important roles also in higher eukaryotes, notably during mammalian cell growth and differentiation [Citation32]. Specifically, it was shown that a dsRNA molecule formed by s/a lncRNAs has important functions in the human cell cycle [Citation33]. Such interactions between transcripts are likely not an isolated phenomenon, since recent genome-wide profiling methods revealed an unexpectedly complex RNA interactome in mammals, which includes numerous antisense lncRNAs [Citation34–Citation36]. lncRNAs are not only interesting from a biological standpoint, they currently also receive much attention as drivers of cancer progression [Citation37,Citation38]. Interestingly, 5-FU induces genes in the interferon pathway, and dsRNAs formed by retrotransposons mediate an interferon response in cancer cells, when DNA methylation is inhibited [Citation39,Citation40]. It is, however, unknown if dsRNAs that originate from s/a transcript pairs are also able to trigger an immune response to cancer.
Given that EXOSC10/Rrp6 targets lncRNAs in dividing cells, it is conceivable that exoribonuclease-dependent 5-FU toxicity is in part mediated by its ability to alter the stability of potential regulatory lncRNAs. To test this idea, we have carried out a genome-wide RNA profiling analysis of 5-FU treated versus untreated diploid wild type cells and rrp6 mutant control cells synchronously undergoing a mitotic cell cycle. Our study has revealed protein-coding and non-coding transcripts that show altered levels in 5-FU treated cells and rrp6 mutant cells. Somewhat unexpectedly, we identified the paralogous transcriptional regulators Swi5 and Ace2 as 5-FU targets. These activators are important for the mitotic exit network, a group of genes that orchestrates cell cycle progression and cell separation. The analysis also identified 5-FU responsive non-coding RNAs, including antisense transcripts that form in vivo dsRNAs with sense mRNAs involved cell cycle control. Our results therefore reveal an indirect transcriptional effect of 5-FU, and they highlight lncRNAs in general, and antisense transcripts that form dsRNAs with overlapping mRNAs in particular, as potential mediators of the drug’s RNA-dependent effects on cell division.
Results
Experimental rationale and design
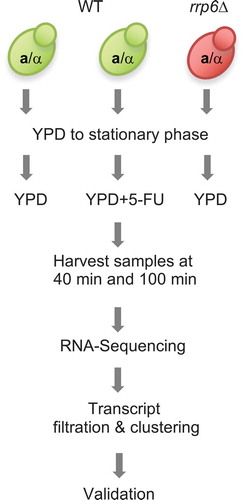
The major aim of our study was to analyse the effect of 5-FU treatment as compared to RRP6 deletion on mRNA and lncRNA levels in diploid yeast cells undergoing rapid mitotic growth. Since 5-FU down-regulates Rrp6’s activity via substrate inhibition, we expected the drug to increase the enzyme’s target transcript levels. Although RNA profiling studies of the mitotic cell cycle are typically carried out in haploid cells, we preferred using a diploid strain to ensure that the data are comparable to our earlier work on lncRNA and protein expression during cell growth and differentiation [Citation16,Citation41]. Consequently, haploid cell synchronization protocols based on pheromone arrest were not suitable. We also sought to avoid temperature sensitive mutant alleles of essential cell division cycle genes, since they may have unintended effects on 5-FU’s activity, and rrp6 mutant cells (referred to as rrp6∆) fail to grow at 37ºC. We therefore arrested wild type cells in G1 by starvation [Citation42], which is a naturally occurring process, before releasing them into fresh rich medium (YPD) in the presence and absence of 20µg/ml 5-FU (). As a control for lncRNA accumulation, rrp6∆ cells were arrested and released into rich medium. The strains were sampled at 40 and 100 minutes, which are two time points broadly corresponding to G1/S and the onset of G2/M-phases as determined by monitoring DNA replication. We note that synchronizing cells enhances fluctuating RNA levels, which might be masked in samples from asynchronous logarithmically growing cells. We cannot, however, study bona fide cell cycle regulation of coding and non-coding transcripts in the presence and absence of 5-FU, because the experiment does not cover at least two complete mitotic cycles after nutrient deprivation.
Figure 1. Experimental approach. A flow chart shows the color coded wild type (green) and mutant (red) strains that were employed in the RNA profiling experiment including cell culturing, data production and analysis and validation steps.
5-FU treatment of diploid yeast cells
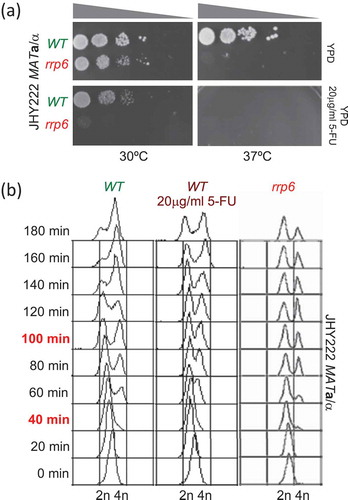
To optimize 5-FU treatment in our diploid JHY222 strain we assayed growth at different concentrations and found that 20µg/ml closely mimics the growth phenotype of rrp6∆ cells at 30ºC. We also confirmed previous findings that cells lacking RRP6 are hyper-sensitive to 5-FU and that growth at 37ºC exacerbates the drug’s toxic effect () [Citation5,Citation11,Citation12,Citation43].
We subsequently monitored progression through G1 and S-phase by FACS analysis of cells sampled every 20 minutes until three hours after release into fresh medium. The data indicated that most cells had not initiated a new round of mitosis 40 minutes (representing G1/S) into the experiment, and that approximately 50% of the cells had undergone DNA replication by 100 minutes (representing G2/M). 5-FU treated wild type cells and the rrp6∆ control show a moderate delay at the 100-minute time point and, as expected, a substantial delay at 180 minutes () [Citation11].
Figure 2. Monitoring cell growth and DNA replication. (A) Images show the outcome of a plate growth assay after 48 hours at the temperatures indicated at the bottom on rich medium (YPD) at permissive (30ºC) and restrictive temperatures (37ºC) for wild type (WT in green) and mutant (rrp6 in red) cells in the strain indicated to the left. The drug concentration is given to the right. Grey triangles at the top indicate increasing dilution of the cell suspension. (B) The output of a FACS analysis is given. The time points are given in minutes and are shown to the left; the samples that were further analysed are shown in red. Color-coded untreated wild type (WT in green), treated wild type (WT 20µg/ml 5-FU in purple) and mutant (rrp6 in red) cell samples are shown at the top. DNA content and strain background are given at the bottom and to the right, respectively.
The RNA expression landscape of 5-FU treated diploid cells
We first compared the global RNA signal levels between the samples using a scatter plot matrix. This analysis revealed, as expected, a strong effect of RRP6’s deletion, and a similar albeit much weaker effect of 5-FU on global RNA levels (Figure S1A). A more specific analysis of the transcriptional response represented by density graphs and box plots, revealed that CUT levels showed the strongest increase in the absence of Rrp6 and in wild type cells treated with 5-FU, while mRNA expression levels showed the smallest increase. For SUTs, XUTs and MUTs we observed an intermediate response (Figure S1B). These results are consistent with CUTs being a major target of Rrp6, and 5-FU affecting the enzyme via substrate inhibition [Citation6,Citation22].
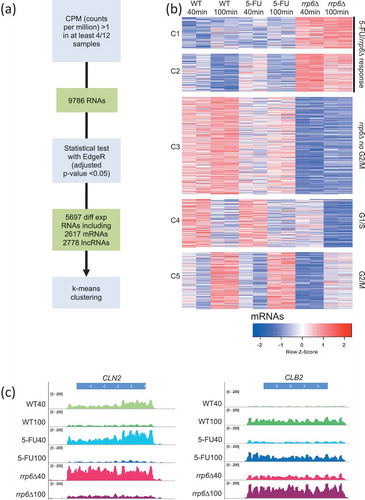
We next identified genes for which we observed fluctuating levels across the sample set. Given the experimental setup, we expected a transcriptional response related to cells progressing from G1/S toward G2/M together with the effects due to lacking Rrp6 activity and 5-FU treatment. We first identified 9786 RNAs (including 5596 mRNAs, 400 dubious open reading frames (ORFs) and 3651 lncRNAs) that showed an expression value given in counts per million (CPM) >1 in at least four out of 12 samples. Subsequently, we employed TMM normalization and a statistical test implemented in EdgeR corrected for multiple testing (adjusted p-value <0.05) to filter 5697 significantly differentially expressed RNAs (see methods). They include 2617 validated mRNAs, 248 transcripts encoded by dubious ORFs, and 2778 RNAs annotated as non-coding RNAs that fall into five classes (CUTs, SUTs, rsSUTs, MUTs and XUTs). This multi-step procedure was used to decrease the false-positive rate due to very low expression signals (see methods). Finally, we empirically grouped the mRNAs into five clusters using the supervised k-means algorithm (Figure 3A). Clusters C1 and C2 contain genes that respond to 5-FU and/or rrp6∆. C3 contains genes for which we observe decreased levels in rrp6∆ and 5-FU. C4 and C5 contain mRNAs that tend to peak at the G1/S or G2/M time pointsin all three conditions, respectively (). The latter two patterns are exemplified by the G1 cyclin CLN2 (C4) and the B-type cyclin CLB2 (C5) (; Table S2).
Figure 3. RNA-Sequencing analysis strategy and output. (A) A flow chart outlines the RNA-Seq data analysis strategy. (B) A color-coded heatmap (red is high and blue is low) shows the expression patterns for protein-coding RNAs (mRNAs) grouped into five clusters (C1-C5) given to the left for sample duplicates from wild type (WT), treated wild type (5-FU) and mutant (rrp6∆) cells as shown at the top. The time points are indicated in minutes. The clusters are biologically classified into genes that respond to treatment and gene deletion (5-FU/rrp6∆), gene deletion (rrp6∆) and cell cycle peaks (G1/S and G2/M). A color scale is shown at the bottom. (C) Color-coded histograms are shown for G1/S and G2/M marker genes as given at the top. The sequence (x-axis) is plotted against expression signals (y-axis) for wild type cells (WT40, WT100, shades of green), treated cells (5-FU40, 50-FU100, shades of blue) and mutant cells (rrp6∆40, rrp6∆100, shades of red) at 40 and 100 minutes after release into fresh medium. The data range set in IGV is indicated.
To further analyse the functional relevance of our clustered target transcripts, we identified significantly enriched Gene Ontology (GO) terms from the biological process ontology (Figure S2, Table S3) and we manually searched the clusters for genes related to cell growth, division and stress response [Citation44]. C1 contained genes important for the mitotic cell cycle and cell division such as a cyclin (PCL9) but showed no statistically significant enrichment of these biological processes. We found that C2, for which we also detected no GO term enrichment, contained genes involved in processes relevant for 5-FU and the known phenotype of rrp6∆. They include DNA repair (HIM1, POL2, SSL2), DNA replication (ORC5, PSF1, SLD5), regulation of gene expression relevant for stress response and ribosomal RNA synthesis (ABF1, HCM1, MOT3, RGT1, RRN3, RRN7), and cell cycle progression (BUB2, CDC34). We also observed genes important for meiosis (MEI4, RED1) and spore formation (SPO19, SPO73, SSP2) in C2. This is unsurprising, since our experimental protocol involved arresting diploid cells in G1 via starvation, which primes them for entry into the meiotic differentiation pathway (the full execution of which requires, however, the simultaneous absence of a fermentable carbon source and nitrogen; see methods) [Citation45].
Cluster C3 contains genes that fail to be upregulated to normal levels in rrp6∆ and in 5-FU treated cells that progress through S-phase toward G2/M. Most of these genes are involved in metabolic processes, notably sugar metabolism (ENO1, GPM1, TDH2) and transport (OPT1, SIT1). C3 also contains genes important for the cell cycle (AMN1, CTS1, DSE1, DSE2, DSE3, DSE4, EGT2). The reasons for this rrp6∆-dominant effect are unclear but they are likely related to the complex nature of the mutant phenotype [Citation46,Citation47] (Figure S2A).
Cluster C4 identifies genes that show a broadly similar pattern of decreased expression in the 100-minute samples in all three conditions. Enriched processes include DNA-dependent DNA replication (CDC9, CDC45, RAD27, RFA1, RFA2, RFA3, SIM1) and DNA damage stimulus (MSH6, RTT107). We note, however, that some DNA repair genes are induced by 5-FU. Such cases include enzymes important for nucleotide excision repair (RAD4), double strand break repair (PRI2), recombination (SMC6), mismatch repair (PMS1), and DNA-damage induced transcription (DUN1). These patterns reflect 5-FU’s impact on cell cycle progression and DNA integrity [Citation48,Citation49] (Figure S2B).
In Cluster C5, where we observe consistent up-regulation in the entire sample set, a range of genes involved in amino acid biosynthesis pathways (ARO3, HOM2, ILV6, MET6, MET17, MMP1) appears to be unaffected by RRP6 gene deletion and drug treatment. It is noteworthy that this cluster also contains cell cycle regulators that are not perturbed at the level of mRNA expression (CLB1, CLB2, SPO12). Although this group is not significantly enriched, it appears that neither 5-FU nor rrp6∆ prevent cell cycle regulated genes in general from being expressed in our experimental setup (Figure S2C).
5-FU affects the mitotic exit network via the activator Swi5
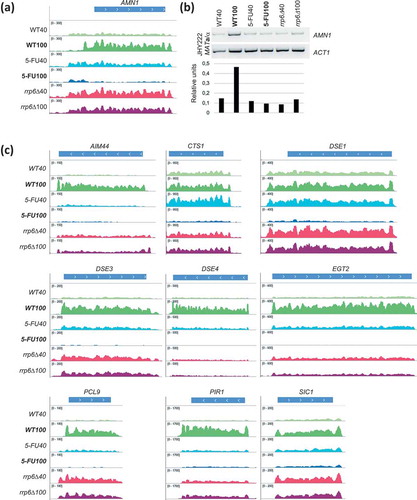
Cluster C3 contained the Antagonist of the Mitotic Exit Network 1 (AMN1), which is involved in mitotic checkpoints and chromosome stability. The gene is down-regulated by 5-FU and (albeit to a lesser extent) by rrp6∆ at the 100-minute time point [Citation50,Citation51] (). We confirmed the RNA-Sequencing data in an independent experiment using RT-PCR (). Furthermore, we observed similar patterns for a cyclin-dependent kinase inhibitor (SIC1) and genes involved in daughter cell separation (CTS1, DSE1, DSE3, DSE4, EGT2; ). The distinctive expression pattern of these genes likely explains why they were clustered apart from most other cell cycle regulated genes in C4 and C5 that appeared to be unperturbed at the transcriptional level. These findings prompted us to search for more genes important for cell separation and cell wall synthesis that showed negative 5-FU/rrp6∆ response patterns. We indeed found AIM44 and PIR1 in C5 (). We note that the transcripts shown in accumulate to higher levels in rrp6∆ cells than in the wild-type at the 40 minute time point. It could be that they are under negative control of Rrp6 during G1/S phase.
Figure 4. Expression data for cell cycle genes. (a) A histogram of RNA-Sequencing data is shown for AMN1 like in . (b) An RT-PCR assay is shown (top) and band intensities are quantified (bottom) for AMN1. ACT1 was used as a control. Samples in lanes 1–6 are indicated at the top and bottom. The strain background is given to the left. (c) Expression data are shown as histograms for selected cell cycle genes as indicated at the top, like in .
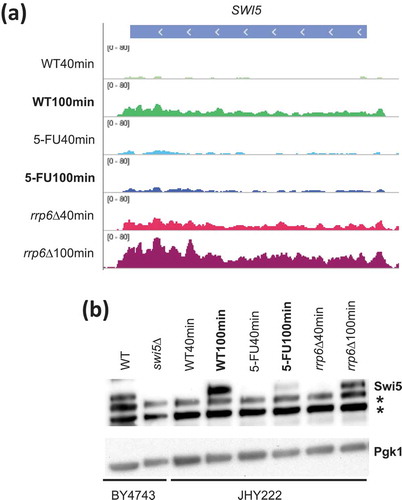
The observed patterns could be explained by mechanisms either involving RNA synthesis (gene activation) or RNA degradation (transcript stability). To distinguish between these possibilities we interpreted information about published in vivo protein/DNA binding data from microarray-based chromatin immunoprecipitation (ChIP-Chip) experiments that are online available via the YEASTRACT (www.yeastract.com) database [Citation52]. This confirmed that, among others, AMN1, AIM44, DSE1, DSE2, DSE4, EGT2, PCL9, PIR1 and SIC1 are likely direct targets of the DNA binding activator Swi5 [Citation53–Citation55]. We therefore examined RNA levels for SWI5 and found that it was expressed at lower levels in 5-FU than untreated cells at 100 minutes, while no negative effect was apparent in the rrp6∆ sample (). This pattern was confirmed at the protein level. Swi5 protein is undetectable under our experimental conditions in the 40-minute samples, while it accumulates to roughly equivalent levels in WT and rrp6∆ cells but not in 5-FU treated WT cells at 100 minutes (). It is unclear why we cannot detect Swi5 at the early 40-minute time point but it might be degraded in diploid cells undergoing glucose starvation and G1 arrest, perhaps by the ubiquitin ligase SCF(Cdc4) that is known to target Swi5 during the cell cycle [Citation56]. Swi5’s decrease at the 100-minute timepoint could in part explain the strong negative effect 5-FU has on the expression of its target genes. An additional contribution could be made by partial cytoplasmic retention of Swi5 in treated cells, bearing in mind that the protein is in part regulated via subcellular localisation [Citation57].
Figure 5. SWI5 RNA and protein analysis. (a) A histogram is shown for SWI5 like in . (b) A Western blot assay is shown for Swi5 in strain backgrounds indicated at the bottom. Pgk1 was used as a loading control. Non-specific bands are indicated with an asterisk to the right. Lanes 1 and 2 contain samples from wild type (WT) and swi5 deletion (swi5∆) strains. Lanes 3–8 contain wild type cells (WT40min, WT100min), treated cells (5-FU40min, 50-FU100min) and mutant cells (rrp6∆40min, rrp6∆100min) 40 and 100 minutes after release into fresh medium.
5-FU treatment affects different classes of lncRNAs
Given that 5-FU-treatment leads to the production of modified transcripts, which are inefficient substrates for Rrp6’s ribonucleolytic activity we hypothesized that the drug might stabilize potential regulatory lncRNAs [Citation6,Citation7]. At least some of these RNAs, notably antisense transcripts that form dsRNAs with their overlapping sense mRNAs or with other lncRNAs, possess regulatory functions or have been associated with altered protein levels [Citation41,Citation58].
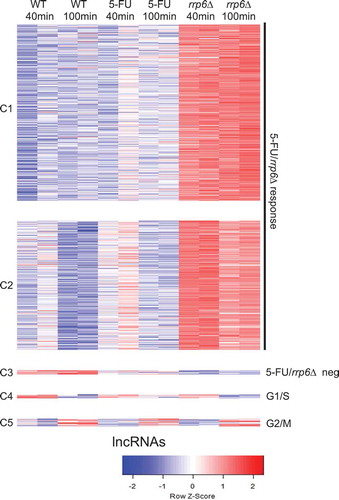
To gain insight into the RNA profile of diploid cells treated with 5-FU versus rrp6∆, we first grouped 2778 lncRNAs, including CUTs, SUTs, MUTs and XUTs, into five clusters broadly representing a positive 5-FU/rrp6∆ response (C1-C2), a negative 5-FU/rrp6∆ response (C3), peak expression in G1/S (C4) and peak expression in G2/M (C5) (). These patterns were reminiscent of what we obtained with mRNAs. The overall response is comparable in 5-FU and rrp6∆ samples but the lncRNAs accumulate to much higher levels in the gene deletion mutant. This was to be expected since the deletion strain entirely lacks Rrp6 activity, while the enzyme might only be partially affected in the 5-FU treated wild type strain.
Figure 6. RNA profiling of lncRNAs. A color coded heatmap is shown for lncRNAs like in . Clusters (C1-C5) and response classes are given to the left and right. Sample duplicates are indicated at the top. A color scale is shown at the bottom.
Given the regulatory potential of these non-coding RNAs, we next focused on the sub-class of 804 5-FU/rrp6∆ responsive antisense lncRNAs that overlapped sense mRNAs ( and S4 Table; note that the table contains 825 entries because of multiple overlap cases). GO term analysis revealed no significant enrichment, but we observed genes involved in meiosis (MEI4, PCH2, RED1, ZIP2), sporulation (ADY4, SPO22, SPO77) and, notably, cell growth (cell wall organization; e.g. CWP1, EXG2) (Table S4). We next asked if these s/a transcript pairs form dsRNAs in vivo. To this end, we interpreted data from a published dsRNA profiling experiment using a haploid wild type strain and a mutant strain lacking the 5ʹ-3ʹ-exoribonuclease Xrn1 (meant to amplify the signal by stabilizing antisense transcripts) that ectopically express fungal Dicer and Argonaute orthologs from N. castellii. These enzymes cleave dsRNAs and the breakdown products are detected by small RNA-Sequencing [Citation58]. Using these dsRNA profiling data, we observed clear dsRNA signals for several meiotic genes and, importantly, the cell growth factors CWP1 and EXG2 (Figure S3).
The group of s/a loci also contained a class of genes involved in response to chemicals, such as MNL1/SUT597 that is relevant for 5-FU treatment. MNL1 is potentially interesting because it is conserved from yeast to mammals (Mnl1/EDEM1) and plays a role in resistance to chemicals via the unfolded protein response pathway. Its antisense RNA SUT597 is upregulated in the presence of 5-FU and the absence of Rrp6 as shown both by RNA-Sequencing and an RT-PCR assay (-). As expected, a stable dsRNA is formed by MNL1/SUT597 s/a transcripts (). CUT158/MTR3 is also interesting because this conserved gene (EXOSC6 in human) is involved in RNA exosome-dependent transcript processing and degradation. CUT158 accumulates in 5-FU treated and rrp6 mutant cells as monitored by RNA-Sequencing and RT-PCR assay and forms a dsRNA that covers almost the entire MTR3 coding sequence (Figure S4A-D).
Figure 7. Expression data for antisense lncRNAs. (a) A color coded heatmap for antisense lncRNAs (AS lncRNAs) is shown as in . (b) Color-coded genomic heatmaps are shown for mRNAs in blue, and lncRNAs in light grey (SUTs), red (XUTs) and green (CUTs). Chromosome numbers and genome coordinates are given in the middle. Red boxes delineate selected lncRNAs. Wild type (WT), treated (WT 5-FU) and mutant (rrp6∆) samples, and the time points in minutes are shown to the right. Top (+) and bottom (-) DNA strands and a scale are given to the right. Images were generated using VING software [Citation95]. (c) A bar diagram shows quantified RNA-Sequencing expression signals for SUT597. The expression signal (y-axis) is plotted against the samples (x-axis) as shown at the bottom. Time points are given for wild type (WT), drug-treated (5-FU) and mutant (rrp6) samples. Data are presented as mean values ± SEM (calculated from two biological replicates used in the RNA-Sequencing analysis). (d) An RT-PCR assay is shown for antisense lncRNAs and overlapping sense mRNAs as indicated to the right. Wild type (WT), treated (WT 5-FU) and mutant (rrp6) samples, and the time points in minutes are given at the top. ACT1 was used as a loading control. (e) A color-coded graph plots the 19–23 base small RNA read densities (tag/nucleotide, y-axis) against top (+) and bottom (-) strands of the genome (y-axis). Protein-coding and non-coding genes are represented by arrows for which the color code is like in panel B. Data are shown in black for a wild type strain (WT, dotted line), and a strain expressing Dicer/Argonaute (RNAi), and in red for a mutant strain (xrn1, dotted line), and a mutant strain expressing Dicer/Argonaute (xrn1 RNAi). Chromosome numbers and genome coordinates and are given at the top and bottom, respectively. The images were generated using the VING software and previously published small RNA-Sequencing data [Citation58,Citation95]. To view a larger region covering the loci and a graphical representation of the signals showing wild type and engineered RNAi strain separately, see http://vm-gb.curie.fr/mw2/small_RNA-seq/.
![Figure 7. Expression data for antisense lncRNAs. (a) A color coded heatmap for antisense lncRNAs (AS lncRNAs) is shown as in Figure 6. (b) Color-coded genomic heatmaps are shown for mRNAs in blue, and lncRNAs in light grey (SUTs), red (XUTs) and green (CUTs). Chromosome numbers and genome coordinates are given in the middle. Red boxes delineate selected lncRNAs. Wild type (WT), treated (WT 5-FU) and mutant (rrp6∆) samples, and the time points in minutes are shown to the right. Top (+) and bottom (-) DNA strands and a scale are given to the right. Images were generated using VING software [Citation95]. (c) A bar diagram shows quantified RNA-Sequencing expression signals for SUT597. The expression signal (y-axis) is plotted against the samples (x-axis) as shown at the bottom. Time points are given for wild type (WT), drug-treated (5-FU) and mutant (rrp6) samples. Data are presented as mean values ± SEM (calculated from two biological replicates used in the RNA-Sequencing analysis). (d) An RT-PCR assay is shown for antisense lncRNAs and overlapping sense mRNAs as indicated to the right. Wild type (WT), treated (WT 5-FU) and mutant (rrp6) samples, and the time points in minutes are given at the top. ACT1 was used as a loading control. (e) A color-coded graph plots the 19–23 base small RNA read densities (tag/nucleotide, y-axis) against top (+) and bottom (-) strands of the genome (y-axis). Protein-coding and non-coding genes are represented by arrows for which the color code is like in panel B. Data are shown in black for a wild type strain (WT, dotted line), and a strain expressing Dicer/Argonaute (RNAi), and in red for a mutant strain (xrn1, dotted line), and a mutant strain expressing Dicer/Argonaute (xrn1 RNAi). Chromosome numbers and genome coordinates and are given at the top and bottom, respectively. The images were generated using the VING software and previously published small RNA-Sequencing data [Citation58,Citation95]. To view a larger region covering the loci and a graphical representation of the signals showing wild type and engineered RNAi strain separately, see http://vm-gb.curie.fr/mw2/small_RNA-seq/.](/cms/asset/f9ae3dd4-0e26-4796-b8b2-afc7f5c1ae20/krnb_a_1581596_f0007_c.jpg)
Intriguingly, the group of s/a loci includes the SWI5 paralog ACE2, and its overlapping antisense lncRNAs CUT259 and SUT2107 that show opposing peak expression patterns both in RNA-Sequencing and stranded RT-PCR experiments (-). We observed that ACE2 mRNA is moderately down-regulated by 5-FU but not rrp6∆ (-). When we measured Ace2 levels by Western blot, we found that the protein failed to accumulate to wild type levels at the 100-minute time point in both treated and mutant cells; this effect became weaker at a later time point at 160 minutes (). This finding raised the question why Ace2 did not accumulate to normal levels in 5-FU treated and rrp6∆ cells although mRNA levels remain almost the same. It is possible that the mechanism, which down-regulates the protein in both conditions involves ACE2/SUT2107 dsRNA formation, which occurs in haploid cells undergoing growth in rich medium () [Citation58]. We therefore assayed ACE2/SUT2107 transcript pairs in our sample set from diploid cells using an immunoprecipitation assay based on the dsRNA-specific J2 antibody and RT-PCR [Citation59]. We detected weak signals in untreated and treated cells, and a stronger signal in the rrp6∆ background that was consistent with the increase of sense and antisense RNA levels in this strain (). Finally, we confirmed that the J2 assay is suitable for detecting fluctuating dsRNA signals due to variable transcript levels by monitoring GAP1/SUT1912 that are very weakly expressed in fermenting mitotic cells (YPD) and induced in meiotic cells (cultured in sporulation medium SPII; the complete dataset will be published elsewhere) (Figure S5A-C).
Figure 8. Sense/antisense RNA and protein expression data for ACE2/SUT2107/CUT259. (A) A genomic expression heatmap for the region containing ACE2/SUT2107/CUT259 is shown like in . (B) A bar diagram shows quantified RNA-Sequencing expression signals for ACE2, CUT259 and SUT2107 as in . (C) An RT-PCR assay is shown for ACE2 and SUT2107 like in . A non-specific band in marked with an asterisk. ACT1 was used as a loading control. (D) A Western blot assay is shown for Ace2 like in . A non-specific band is marked with an asterisk. Pgk1 was used as a loading control. Samples are given at the bottom and at the top. Band intensities are shown in a histogram where samples (x-axis) are plotted against relative intensity units (y-axis). (E) A color-coded graph plots the 19–23 base small RNA read densities (tag/nucleotide, y-axis) against top (+) and bottom (-) strands of the genome (y-axis) like in . (F) An immunoprecipitation (IP) assay is shown using the dsRNA specific J2 antibody for the s/a pair given at the bottom. RNA samples harvested 100 minutes after release into fresh medium from wild type (WT), drug-treated (5-FU) and mutant (rrp6∆) cells were assayed in the presence (+) or absence (-) of J2 antibody as shown at the top. A PCR product revealing precipitated RNA is marked to the right (dsRNA).
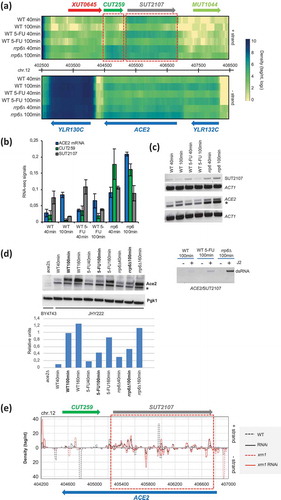
We conclude that antisense SUT2107 levels are increased moderately by 5-FU and strongly by rrp6∆, thereby drawing ACE2 sense mRNA into a dsRNA complex. The ACE2/SUT2107 double-stranded form covers almost the entire coding region of ACE2, and is associated with diminished Ace2 protein levels in 5-FU and rrp6∆ samples. This result complements our data on Swi5, because Ace2 is known to co-activate certain Swi5-dependent cell cycle genes, and other genes important for cell division, such as CTS1 ([Citation60] and references therein). Our findings indicate that 5-FU negatively affects Swi5 and Ace2 transcription factors that are important for normal cell cycle progression via the Antagonist of the Mitotic Exit Network (AMEN) pathway, and its downstream target genes. The data highlight a transcriptional regulatory aspect of 5-FU’s toxicity that implicates important cell cycle regulators, and stable lncRNAs/dsRNAs. Finally, the results provide molecular insight into the complex mitotic growth phenotype shown by rrp6∆ cells in different strain backgrounds at permissive and restrictive temperatures [Citation16,Citation17,Citation61].
Discussion
The anti-cancer drug 5-FU is incorporated into RNA and thereby indirectly inhibits the 3ʹ-5ʹ exoribonuclease EXOSC10/Rrp6, which is an evolutionarily conserved protein that processes or degrades different types of non-coding RNAs. Since certain long non-coding RNAs have been reported to be important for cell growth, development and diseases such as cancer, we hypothesized that part of 5-FU’s cytotoxicity might stem from its ability to alter the stability of regulatory lncRNAs. To provide initial evidence for the concept in a model system suitable for RNA profiling of cell cycle progression, we analysed the effect of 5-FU on the transcriptome of synchronized diploid budding yeast wild type versus rrp6 mutant cells. The latter served as a positive control since cells lacking Rrp6 accumulate lncRNAs, and fail to divide normally; that is, while the phenotype is more or less severe at the permissive temperature depending on the background, all mutant strains arrest at the restrictive temperature of 37ºC.
EXOSC10/Rrp6 is important for cell growth and development
We find that the vast majority of 5-FU/rrp6∆ dependent lncRNAs accumulate to much higher levels in the gene deletion mutant than in drug-treated cells, yet JHY222 rrp6∆ cells can grow and divide. While this seems to argue against a major effect of deregulated lncRNAs on cell division, we underline that JHY222 rrp6∆ cells do show a moderate growth phenotype at 30ºC, and fully arrest at 37ºC. Moreover, mutant cells in the SK1 background fail to grow normally even at the permissive temperature [Citation16,Citation17]. Finally, Rrp6’s important role in yeast is mirrored in mammals by our own results, and other recent reports showing that EXOSC10 is essential for cell division in mouse and human [Citation19–Citation21].
Rrp6 deletion and 5-FU treatment elicit an overlapping and conserved response
It was proposed earlier that 5-FU’s toxic effect in yeast is based on DNA- and RNA-dependent mechanisms, but that the RNA pathway was dominant [Citation5,Citation13]. A tiling array-based RNA profiling study of the 5-FU response in the fission yeast S. pombe, in combination with genetic analyses, provided additional evidence for 5-FU’s effect on RNA processing; it is noteworthy that transcripts encoded by genes conserved between the distantly related budding- and fission yeasts, such as SNU66, PRP8 and ESF2, respond to the drug (Figure S6) [Citation62]. Elegant work using pre-mRNA splicing reporter genes demonstrated that mRNA processing is impaired in a similar fashion when cells are treated with 5-FU or lack Rrp6, and that overexpressing RRP6 reverses the effect of the drug on reporter gene expression [Citation63]. Taken together, these data are consistent with the idea that an important, and at least partially conserved element of 5-FU’s cytotoxic effect is mediated via altered RNA processing.
5-FU destabilizes transcription factors critical for cell division
While mRNAs encoded by many cell cycle regulated genes showed the expected fluctuations after release into rich growth medium (see clusters C4 and C5 in ), we found that some of the genes involved specifically in cell cycle progression (AMN1, SIC1, PCL9) and cell separation (EGT2 and, among others, the DSE genes) failed to be induced to normal levels. A literature and database survey of activators targeting the promoters of protein-coding 5-FU target genes identified the paralogous transcriptional activators Swi5 and Ace2 that are known to be extensively regulated at the level of protein stability and localisation; reviewed in [Citation64]. Our data point to simultaneous down-regulation of Swi5 and Ace2 as a mechanism for 5-FU’s ability to prevent the induction of certain cell cycle regulated genes. We did not expect to find that 5-FU affects regulatory proteins, however, the result is consistent with the earlier finding that 5-FU decreases the levels of mammalian transcription factors important for cell proliferation, such as ATF2, IRF2, and REL [Citation65].
It is not clear why Swi5 is down-regulated by 5-FU but not rrp6∆. It could be that the drug elicits a combination of effects such as decreased mRNA synthesis and protein instability caused by altered activity of cell cycle regulated proteases [Citation56]; for review, see [Citation64].
Do lncRNA-mediated effects contribute to 5-FU’s toxicity?
The simplest explanation, which has been proposed before, is that modified RNAs are suboptimal substrates for Rrp6, and therefore tend to accumulate in 5-FU treated cells [Citation6,Citation7]. This is consistent with our finding that lncRNAs, which increase when cells are exposed to 5-FU, strongly accumulate in cells lacking Rrp6. However, 5-FU might also up-regulate lncRNAs by negatively affecting conserved components of the RNA degradation machinery, such as EXOSC10/Rrp6, given that the gene is associated with an overlapping antisense lncRNA.
dsRNAs were proposed to play a major role in the regulation of bacterial gene expression [Citation66]. In yeast, dsRNAs formed by s/a transcripts are involved in controlling the stability of mRNAs and XUT-type regulatory lncRNAs [Citation58,Citation67]. In mammals, a dsRNA plays an important role during cell cycle progression by binding regulatory proteins [Citation33]. In addition, we recently reported evidence that developmental stage-specific formation of dsRNAs is negatively correlated with protein levels [Citation41]. We noticed that, in spite of the fact that SWI5 and ACE2 are paralogs, only the latter is associated with clearly expressed (and annotated) antisense lncRNAs (CUT259 and SUT2107). Both of these antisense transcripts accumulate in drug-treated and mutant cells and therefore recruit ACE2 sense mRNA into a dsRNA form that is stable in vivo. This could prevent the mRNA from being transported into the cytoplasm or it could inhibit Ace2 protein translation by hindering the mRNA’s association with ribosomes. In this context we note that, contrary to Swi5, Ace2 protein levels are down-regulated during the initial phases of cell cycle progression by both 5-FU and rrp6∆, as one would expect if accumulating lncRNAs were to be involved.
Are yeast 5-FU/Rrp6-targeted lncRNAs relevant for human cancer?
The function of EXOSC10/Rrp6 as a subunit of the RNA exosome has evolved over time and so has its set of substrates or activities [Citation68–Citation70]. For example, it was proposed that mammalian EXOSC10 may be more efficient at processing structured RNAs than yeast Rrp6 [Citation71]. These differences notwithstanding, our data highlight the regulatory potential of 5-FU/Rrp6 responsive lncRNAs/dsRNAs in eukaryotes. This is a promising lead, especially in light of recent evidence that human EXOSC10 is an unfavorable prognostic marker for liver cancer [Citation72].
Our yeast data provide global evidence that lncRNAs of all currently known major types accumulate in 5-FU treated cells, including antisense RNAs that form dsRNAs with overlapping sense mRNAs. Furthermore, we find again that dsRNAs are associated with decreased protein levels (see ;[Citation41]). Is further experimental work in yeast, such as preventing the expression of specific antisense lncRNAs by deleting promoter regions, critical? Perhaps not. The evolutionary distance between yeast and human is large and individual lncRNAs are not conserved at the sequence level from yeast to mammals. Consequently, a future priority is to identify and further analyse EXOSC10/Rrp6-dependent human lncRNAs that respond to 5-FU using RNA-Sequencing and CRISPR/dCas9 based methods [Citation73]. This approach will likely yield useful results, since earlier microarray-based work showed that 5-FU alters microRNA and lncRNA expression profiles in cultured breast- and colon cancer cells [Citation74–Citation76]. Critically, genome-wide mammalian RNA interactome data are now available [Citation34–Citation36,Citation77]. They should prove extremely useful in elaborating hypotheses about the roles of mammalian lncRNAs and dsRNAs in the etiology and progression of cancer.
Recent advances in tumor genomics and personalized medicine have helped conceptualize promising new approaches, such as immunotherapy that complements chemotherapies today, and will perhaps replace them in the future [Citation78,Citation79]. However, gaining insight into novel molecular mechanisms underlying the toxicity of 5-FU that has been used for decades, will likely continue to be important in the foreseeable future [Citation80]. The yeast work reported here provides initial evidence in a simple eukaryotic model organism for roles of lncRNAs and dsRNAs in mediating 5-FU’s toxicity. Such a mechanism would open up novel therapeutical targets that may help improve the outcome of established anti-cancer treatments.
Materials and methods
Strain backgrounds
The strains employed for RNA profiling work were JHY222 MATa/α (derived from the standard yeast strain S288C) and JHY222 MATa/α rrp6 that were described in [Citation16], . In the JHY222 background, contrary to SK1, deletion of RRP6 is not lethal under laboratory conditions, but causes a growth phenotype and impairs meiosis and spore formation [Citation16,Citation17].
Table 1. Yeast strains.
5-fluorouracil dose optimization
Cells were cultured in YPD over-night and diluted to 2 × 10⁶ cells/ml in fresh YPD. 10µl of a suspension from serially diluted yeast cells (10-fold to 104-fold) was deposited on standard YPD plates containing 20µg/ml 5-FU and cultured for 48 hours at 30ºC or 37ºC. Pictures were taken using the GE Imager system (General Electric, USA) at 48h.
Culture conditions and 5-fluorouracil treatment
Wild type and rrp6 mutant cells from fresh plates were inoculated in standard growth medium (YPD), and cultured over night at 30ºC in a rotatory shaker (New Brunswick) for 19 hours. The cells were spun down and washed with pre-warmed water twice before they were re-inoculated into parallel cultures with growth medium (wild type and rrp6∆) and YPD containing 20µg/ml 5-FU (wild type) at a concentration of 2 × 10⁶ cells/ml. Samples were harvested immediately after inoculation and then every 20 minutes until three hours, spun down, frozen in liquid nitrogen and stored at −80ºC for further analysis. An aliquot was fixed in ethanol and used to monitor DNA synthesis.
Fluorescence activated cell sorting (FACS) analysis
To monitor the progression of diploid cells through mitotic S-phase, 107 cells were resuspended, fixed with 70% ethanol and sonicated using a Branson Sonifier 250 for 10 seconds at 20% power, before they were analysed as described in [Citation16].
Genome-wide strand-specific RNA-sequencing library preparation
For each condition, we isolated total RNA from biological duplicates using the hot phenol method as described [Citation81]. Ribosomal RNA was removed using the RiboMinus Eukaryote System v2 kit (ThermoFisher, France). We next prepared strand-specific RNA-Sequencing libraries starting from 125 ng of rRNA-depleted RNA using the TruSeq Stranded Total RNA Sample Preparation kit (Illumina, USA), as described [Citation58]. Before carrying out stranded RNA-Sequencing, we controlled total RNA and cDNA quality using the RNA 6000 Pico kit, and High Sensitivity DNA chips, respectively, and a BioAnalyzer 2100 (Agilent, France).
RNA-sequencing data production and processing
We employed a HiSeq2500 sequencer (Illumina) to carry out paired-end sequencing of the libraries (2 x 50 nucleotides). Reads were mapped onto the S. cerevisiae S288C reference genome using TopHat version 2.0.6 [Citation82]. Parameters were set at a tolerance of three mismatches and a maximum intron size of 2 kb [Citation30,Citation58]. Further bioinformatics analyses were carried out with uniquely mapped reads. Tag densities for genes, dubious ORFs, sn(o)RNAs, tRNAs and several classes of lncRNAs (including CUTs, SUTs, rsSUTs, XUTs and MUTs) were obtained after normalization over the total number of reads that uniquely mapped to ORFs. Mapping statistics are summarized in Table S1.
RNA profiling data analysis
To identify differentially expressed transcripts, we focused on transcripts with >1 count per million (CPM) in at least four out of 12 experiments. Such a filtering step is recommended for microarray and RNA-Sequencing based profiling experiments, since genes with very low counts across libraries do not provide robust evidence for differential expression [Citation83,Citation84]. The library size was recomputed after this filtering step and counts were normalized using the TMM approach [Citation85], and the differential analysis was performed with EdgeR [Citation86,Citation87]. Differential expression was determined between conditions and time points. transcripts with a corrected p-value <0.05 were selected as being significantly differentially expressed [Citation88]. The analysis was performed using the EdgeR Bioconductor package [Citation89].
Clustering and Gene Ontology term enrichment
Different strategies were employed to determine the optimal clustering method and its parameters. We tested from k = 4 to k = 20 using k-means [Citation86], and Partitioning Around Medoids (PAM) [Citation87]. We generated silhouette plots of each step to assess the clustering methods’ efficiency. This, together with visual inspection of the heatmaps enabled us to identify k-means, k = 5 as the best approach. Gene Ontology (GO) Biological Process term enrichment was computed using GoTermFinder whereby GO terms with adjusted p-values below 0.01 were considered as significant [Citation90]. For clusters with enriched GO terms, ReviGO was then used to cluster the significant GO terms based on their semantic similarity (default parameters) [Citation91].
Raw- and processed data availability
Raw data files were uploaded to the NCBI’s GeneOmnibus (GEO) repository and are available under the accession number GSE77511 [Citation92]. The RNA-Sequencing data for all replicates and averaged duplicates are also conveniently accessible online in a searchable viewer at http://vm-gb.curie.fr/mprimig/5FU.
Genome-wide detection of dsRNAs
Genome-wide data on dsRNA formation in haploid wild type and xrn1 mutant cells were previously published [Citation58]. The RNA-Sequencing data are available online at http://vm-gb.curie.fr/mw2/small_RNA-seq/.
Immunological detection of dsRNA
An RNA immunoprecipitation (RIP) assay was performed using the dsRNA-specific J2 antibody [Citation59]. RNA was extracted with cold phenol. 35µg RNA was incubated with 3.5µg dsRNA-specific J2 antibody (Scicons, France) at 4ºC overnight. Dynabeads were prepared according to the manufacturer’s instructions and incubated with the antibody-RNA mixture on a rotator at 4ºC for 2h. RNA was washed, eluted and treated with DNaseI (Ambion, France). Finally, precipitated RNA was reverse transcribed using the High Capacity cDNA Reverse Transcription kit (ThermoScientific, USA) and amplified using Taq Polymerase (Qiagen, France) at 60ºC for 30 cycles using the primer pair for ACE2 ().
Table 2. Oligonucleotides for RT-PCR assays.
RT-PCR assays
Strand-specific RT-PCR assays were carried out using the SuperScript II kit (ThermoScientific, USA). 2µg of RNA was treated with DNaseI (Ambion, USA), and reverse transcribed with reverse primers (shown in ), in the presence of Actinomycin D to prevent second strand synthesis. After reverse transcription, the samples were treated with RNase H (TEBU BIO, France) to remove the RNA template. cDNA was PCR amplified using Taq polymerase (Qiagen, USA) at 60ºC for 28 cycles. RT-PCR products were separated on 2% agarose gels and photographed using the Gel-doc XRS image system (Bio-Rad, USA). Primers used for RT-PCR were designed using NCBI Primer-Blast program. Standard RT-PCR assays were performed as published [Citation93]. Briefly, RNA was extracted using the hot phenol method, followed by DNase I treatment with TURBO DNA-free Kit (Ambion, USA). RT-PCR reactions were carried out using 2 µg of RNA reverse transcribed with Reverse Transcriptase (High Capacity cDNA Reverse Transcription kit; Life Technologies, USA) and amplified using Taq Polymerase (Qiagen, France) at 60ºC for 28 cycles. RT-PCR products were separated on 2% agarose gels and photographed using the Gel-doc XRS image system (Bio-Rad, USA). Primers used for RT-PCR were designed using Primer3 (simgene.com/Primer3; ).
Western blotting
Protein extracts were prepared from samples of cells cultured in rich medium (YPD), pre-sporulation medium (YPA), and sporulation medium (SPII) as described in [Citation94]. 20µg of total protein extract was separated by SDS-PAGE gel electrophoresis (Bio-Rad, USA) and transferred to ImmobilonPSQ membranes (Millipore, France) using an electro-blotter (TE77X; Hoefer, USA) set at 50mA for 2.5h. The membrane was blocked with 5% milk powder at room temperature for 1h, incubated with anti-Swi5 and anti-Ace2 antibodies (1:1000) overnight at 4°C. A secondary anti-rabbit antibody (1:10,000) was incubated at room temperature for 1h. An anti-Pgk1 antibody (1:10,000) was incubated at room temperature for 1h before the signals were revealed using an anti-mouse secondary antibody (1:10,000) incubated at room temperature for 1h. Protein signals were revealed using the ECL-Plus Chemiluminescence kit (GE Healthcare, USA) and the ChemiDoc XRS system (Bio-Rad, USA). Band intensities were quantified with the ImageQuant TL 7.0 software at standard settings (GE Healthcare, USA).
Supplemental Material
Download Zip (7.2 MB)Acknowledgments
We thank David Stillman for the anti-Swi5 and anti-Ace2 antibodies, Joe Horecka for a swi5 mutant strain, and Marc Descrimes for the initial version of the RNA-Seq data’s genome viewer. This study was supported by a PhD fellowship from La Ligue Contre le Cancer and La Région de Bretagne (ARED) to Bingning Xie, and a postdoctoral fellowship by La Région de Bretagne (SAD) to Igor Stuparevic. This work has also benefited from the facilities and expertise of the NGS platform of Institut Curie, which are supported by the Agence Nationale de la Recherche (ANR-10-EQPX-03, ANR10-INBS-09-08), and the Canceropôle Ile-de-France. Further funding was provided by Inserm, the University of Rennes 1, and La Ligue Contre le Cancer Comité 35 and Comité 29 to Michael Primig, and research grants from the Agence Nationale de la Recherche (REGULncRNA, DNA-Life), and the European Research Council (EpincRNA starting grant, DARK consolidator grant) to Antonin Morillon.
Disclosure statement
No potential conflict of interest was reported by the author(s)
Supplemental data
Supplemental data for this article can be accessed here.
Additional information
Funding
Related Research Data
References
- Longley DB, Harkin DP, Johnston PG. 5-fluorouracil: mechanisms of action and clinical strategies [Research support, Non-U.S. Gov’t review]. Nat Rev Cancer. 2003 May;3(5):330–338. PubMed PMID: 12724731; eng.
- Scartozzi M, Maccaroni E, Giampieri R, et al. 5-Fluorouracil pharmacogenomics: still rocking after all these years? [Review]. Pharmacogenomics. 2011 Feb;12(2):251–265. PubMed PMID: 21332317; eng.
- Wilson PM, Danenberg PV, Johnston PG, et al. Standing the test of time: targeting thymidylate biosynthesis in cancer therapy. Nat Rev Clin Oncol. 2014 May;11(5):282–298. PubMed PMID: 24732946.
- Hoskins J, Butler JS. RNA-based 5-fluorouracil toxicity requires the pseudouridylation activity of Cbf5p. Genetics. 2008 May;179(1):323–330. PubMed PMID: 18493057; PubMed Central PMCID: PMCPMC2390612.
- Hoskins J, Scott Butler J. Evidence for distinct DNA- and RNA-based mechanisms of 5-fluorouracil cytotoxicity in Saccharomyces cerevisiae. Yeast. 2007 Oct;24(10):861–870. PubMed PMID: 17640085.
- Kammler S, Lykke-Andersen S, Jensen TH. The RNA exosome component hRrp6 is a target for 5-fluorouracil in human cells. Mol Cancer Res. 2008 Jun;6(6):990–995. PubMed PMID: 18567802; eng.
- Silverstein RA, Gonzalez de Valdivia E, Visa N. The incorporation of 5-fluorouracil into RNA affects the ribonucleolytic activity of the exosome subunit Rrp6. Mol Cancer Res. 2011 Mar;9(3):332–340. PubMed PMID: 21289297; eng.
- Fang F, Hoskins J, Butler JS. 5-fluorouracil enhances exosome-dependent accumulation of polyadenylated rRNAs. Mol Cell Biol. 2004 Dec;24(24):10766–10776. PubMed PMID: 15572680; PubMed Central PMCID: PMCPMC533989.
- Januszyk K, Lima CD. The eukaryotic RNA exosome. Curr Opin Struct Biol. 2014 Feb;24:132–140. PubMed PMID: 24525139; PubMed Central PMCID: PMCPMC3985421.
- Makino DL, Baumgartner M, Conti E. Crystal structure of an RNA-bound 11-subunit eukaryotic exosome complex. Nature. 2013 Feb 3;495:70–75.
- Lum PY, Armour CD, Stepaniants SB, et al. Discovering modes of action for therapeutic compounds using a genome-wide screen of yeast heterozygotes. Cell. 2004 Jan 9;116(1):121–137. PubMed PMID: 14718172.
- Hoepfner D, Helliwell SB, Sadlish H, et al. High-resolution chemical dissection of a model eukaryote reveals targets, pathways and gene functions. Microbiol Res. 2014 Feb -Mar;169(2–3):107–120. PubMed PMID: 24360837.
- Giaever G, Flaherty P, Kumm J, et al. Chemogenomic profiling: identifying the functional interactions of small molecules in yeast. Proc Natl Acad Sci U S A. 2004 Jan 20;101(3):793–798. PubMed PMID: 14718668; PubMed Central PMCID: PMC321760.
- Stead JA, Costello JL, Livingstone MJ, et al. The PMC2NT domain of the catalytic exosome subunit Rrp6p provides the interface for binding with its cofactor Rrp47p, a nucleic acid-binding protein. Nucleic Acids Res. 2007;35(16):5556–5567. PubMed PMID: 17704127; PubMed Central PMCID: PMCPMC2018643.
- Allmang C, Kufel J, Chanfreau G, et al. Functions of the exosome in rRNA, snoRNA and snRNA synthesis. Embo J. 1999 Oct 1;18(19):5399–5410. PubMed PMID: 10508172; PubMed Central PMCID: PMC1171609. eng.
- Lardenois A, Liu Y, Walther T, et al. Execution of the meiotic noncoding RNA expression program and the onset of gametogenesis in yeast require the conserved exosome subunit Rrp6. Proc Natl Acad Sci U S A. 2011 Jan 18;108(3):1058–1063. PubMed PMID: 21149693; PubMed Central PMCID: PMC3024698.
- Assenholt J, Mouaikel J, Andersen KR, et al. Exonucleolysis is required for nuclear mRNA quality control in yeast THO mutants. Rna. 2008 Nov;14(11):2305–2313. PubMed PMID: 18824516; PubMed Central PMCID: PMC2578857. eng.
- van Dijk EL, Schilders G, Pruijn GJ. Human cell growth requires a functional cytoplasmic exosome, which is involved in various mRNA decay pathways. Rna. 2007 Jul;13(7):1027–1035. PubMed PMID: 17545563; PubMed Central PMCID: PMCPMC1894934.
- Pefanis E, Wang J, Rothschild G, et al. RNA exosome-regulated long non-coding RNA transcription controls super-enhancer activity. Cell. 2015 May 7;161(4):774–789. PubMed PMID: 25957685; PubMed Central PMCID: PMCPMC4428671.
- Blomen VA, Majek P, Jae LT, et al. Gene essentiality and synthetic lethality in haploid human cells. Science. 2015 Nov 27;350(6264):1092–1096. PubMed PMID: 26472760.
- Jamin SP, Petit FG, Kervarrec C, et al. EXOSC10/Rrp6 is post-translationally regulated in male germ cells and controls the onset of spermatogenesis. Sci Rep. 2017 Nov 8;7(1):15065. PubMed PMID: 29118343; PubMed Central PMCID: PMCPMC5678167.
- Wyers F, Rougemaille M, Badis G, et al. Cryptic pol II transcripts are degraded by a nuclear quality control pathway involving a new poly(A) polymerase. Cell. 2005 Jun 3;121(5):725–737. PubMed PMID: 15935759; eng.
- Xu Z, Wei W, Gagneur J, et al. Bidirectional promoters generate pervasive transcription in yeast. Nature. 2009 Feb 19;457(7232):1033–1037. PubMed PMID: 19169243; PubMed Central PMCID: PMC2766638. eng.
- van Dijk EL, Chen CL, d’Aubenton-Carafa Y, et al. XUTs are a class of Xrn1-sensitive antisense regulatory non-coding RNA in yeast. Nature. 2011 Jul 7;475(7354):114–117. PubMed PMID: 21697827.
- Castelnuovo M, Zaugg JB, Guffanti E, et al. Role of histone modifications and early termination in pervasive transcription and antisense-mediated gene silencing in yeast. Nucleic Acids Res. 2014 Apr;42(7):4348–4362. PubMed PMID: 24497191; PubMed Central PMCID: PMCPMC3985671.
- Hongay CF, Grisafi PL, Galitski T, et al. Antisense transcription controls cell fate in Saccharomyces cerevisiae. Cell. 2006 Nov 17;127(4):735–745. PubMed PMID: 17110333.
- Pelechano V, Steinmetz LM. Gene regulation by antisense transcription. Nat Rev Genet. 2013 Dec;14(12):880–893. PubMed PMID: 24217315.
- van Werven FJ, Neuert G, Hendrick N, et al. Transcription of two long noncoding RNAs mediates mating-type control of gametogenesis in budding yeast. Cell. 2012 Sep 14;150(6):1170–1181. PubMed PMID: 22959267; PubMed Central PMCID: PMC3472370.
- Wery M, Gautier C, Descrimes M, et al. Bases of antisense lncRNA-associated regulation of gene expression in fission yeast. PLoS Genet. 2018 Jul;14(7):e1007465. PubMed PMID: 29975684; PubMed Central PMCID: PMCPMC6049938.
- Wery M, Gautier C, Descrimes M, et al. Native elongating transcript sequencing reveals global anti-correlation between sense and antisense nascent transcription in fission yeast. Rna. 2018 Feb;24(2):196–208. PubMed PMID: 29114019; PubMed Central PMCID: PMCPMC5769747.
- Atkinson SR, Marguerat S, Bitton DA, et al. Long noncoding RNA repertoire and targeting by nuclear exosome, cytoplasmic exonuclease, and RNAi in fission yeast. Rna. 2018 Sep;24(9):1195–1213. PubMed PMID: 29914874; PubMed Central PMCID: PMCPMC6097657.
- Quinn JJ, Chang HY. Unique features of long non-coding RNA biogenesis and function. Nat Rev Genet. 2016 Jan;17(1):47–62. PubMed PMID: 26666209.
- Portal MM, Pavet V, Erb C, et al. Human cells contain natural double-stranded RNAs with potential regulatory functions. Nat Struct Mol Biol. 2015 Jan;22(1):89–97. PubMed PMID: 25504323.
- Aw JG, Shen Y, Wilm A, et al. In vivo mapping of eukaryotic RNA interactomes reveals principles of higher-order organization and regulation. Mol Cell. 2016 May 19;62(4):603–617. PubMed PMID: 27184079.
- Sharma E, Sterne-Weiler T, O’Hanlon D, et al. Global mapping of human RNA-RNA interactions. Mol Cell. 2016 May 19;62(4):618–626. PubMed PMID: 27184080.
- Lu Z, Zhang QC, Lee B, et al. RNA duplex map in living cells reveals higher-order transcriptome structure. Cell. 2016 May 19;165(5):1267–1279. PubMed PMID: 27180905.
- Schmitt AM, Chang HY. Long noncoding RNAs in cancer pathways. Cancer Cell. 2016 Apr 11;29(4):452–463. PubMed PMID: 27070700; PubMed Central PMCID: PMCPMC4831138.
- Huarte M. The emerging role of lncRNAs in cancer. Nat Med. 2015 Nov;21(11):1253–1261. PubMed PMID: 26540387.
- Chiappinelli KB, Strissel PL, Desrichard A, et al. Inhibiting DNA methylation causes an interferon response in cancer via dsRNA including endogenous retroviruses. Cell. 2015 Aug 27;162(5):974–986. PubMed PMID: 26317466; PubMed Central PMCID: PMCPMC4556003.
- Matsumura Y, Yashiro M, Ohira M, et al. 5-Fluorouracil up-regulates interferon pathway gene expression in esophageal cancer cells. Anticancer Res. 2005 Sep -Oct;25(5):3271–3278. PubMed PMID: 16101138.
- Becker E, Com E, Lavigne R, et al. The protein expression landscape of mitosis and meiosis in diploid budding yeast. J Proteomics. 2017 Mar 6;156:5–19. PubMed PMID: 28057603.
- Herman PK. Stationary phase in yeast. Curr Opin Microbiol. 2002 Dec;5(6):602–607. PubMed PMID: 12457705.
- Gustavsson M, Ronne H. Evidence that tRNA modifying enzymes are important in vivo targets for 5-fluorouracil in yeast. Rna. 2008 Apr;14(4):666–674. PubMed PMID: 18314501; PubMed Central PMCID: PMCPMC2271368.
- The Gene Ontology C. Expansion of the gene ontology knowledgebase and resources. Nucleic Acids Res. 2017 Jan 4;45(D1):D331–D338. PubMed PMID: 27899567; PubMed Central PMCID: PMCPMC5210579.
- Becker E, Liu Y, Lardenois A, et al. Integrated RNA- and protein profiling of fermentation and respiration in diploid budding yeast provides insight into nutrient control of cell growth and development. J Proteomics. 2015 Apr 24;119:30–44. PubMed PMID: 25662576.
- Gudipati RK, Xu Z, Lebreton A, et al. Extensive degradation of RNA precursors by the exosome in wild-type cells. Mol Cell. 2012 Nov 9;48(3):409–421. PubMed PMID: 23000176; PubMed Central PMCID: PMC3496076.
- Schneider C, Kudla G, Wlotzka W, et al. Transcriptome-wide analysis of exosome targets. Mol Cell. 2012 Nov 9;48(3):422–433. PubMed PMID: 23000172; PubMed Central PMCID: PMCPMC3526797.
- Seiple L, Jaruga P, Dizdaroglu M, et al. Linking uracil base excision repair and 5-fluorouracil toxicity in yeast. Nucleic Acids Res. 2006;34(1):140–151. PubMed PMID: 16407331; PubMed Central PMCID: PMCPMC1326247.
- Matuo R, Sousa FG, Escargueil AE, et al. DNA repair pathways involved in repair of lesions induced by 5-fluorouracil and its active metabolite FdUMP. Biochem Pharmacol. 2010 Jan 15;79(2):147–153. PubMed PMID: 19712668.
- Wang Y, Shirogane T, Liu D, et al. Exit from exit: resetting the cell cycle through Amn1 inhibition of G protein signaling. Cell. 2003 Mar 7;112(5):697–709. PubMed PMID: 12628189.
- Baro B, Queralt E, Monje-Casas F. Regulation of mitotic exit in Saccharomyces cerevisiae. Methods Mol Biol. 2017;1505:3–17. PubMed PMID: 27826852.
- Teixeira MC, Monteiro PT, Palma M, et al. YEASTRACT: an upgraded database for the analysis of transcription regulatory networks in Saccharomyces cerevisiae. Nucleic Acids Res. 2018 Jan 4;46(D1):D348–D353. PubMed PMID: 29036684; PubMed Central PMCID: PMCPMC5753369.
- Harbison CT, Gordon DB, Lee TI, et al. Transcriptional regulatory code of a eukaryotic genome. Nature. 2004 Sep 2;431(7004):99–104. PubMed PMID: 15343339.
- Sun W, Yu T, Li KC. Detection of eQTL modules mediated by activity levels of transcription factors. Bioinformatics. 2007 Sep 1;23(17):2290–2297. PubMed PMID: 17599927.
- Simon I, Barnett J, Hannett N, et al. Serial regulation of transcriptional regulators in the yeast cell cycle. Cell. 2001 Sep 21;106(6):697–708. PubMed PMID: 11572776.
- Kishi T, Ikeda A, Koyama N, et al. A refined two-hybrid system reveals that SCF(Cdc4)-dependent degradation of Swi5 contributes to the regulatory mechanism of S-phase entry. Proc Natl Acad Sci U S A. 2008 Sep 23;105(38):14497–14502. PubMed PMID: 18787112; PubMed Central PMCID: PMCPMC2567208.
- Moll T, Tebb G, Surana U, et al. The role of phosphorylation and the CDC28 protein kinase in cell cycle-regulated nuclear import of the S. cerevisiae transcription factor SWI5. Cell. 1991 Aug 23;66(4):743–758. PubMed PMID: 1652372.
- Wery M, Descrimes M, Vogt N, et al. Nonsense-mediated decay restricts LncRNA levels in yeast unless blocked by double-stranded RNA structure. Mol Cell. 2016 Jan 19 PubMed PMID: 26805575. DOI:10.1016/j.molcel.2015.12.020.
- Schonborn J, Oberstrass J, Breyel E, et al. Monoclonal antibodies to double-stranded RNA as probes of RNA structure in crude nucleic acid extracts. Nucleic Acids Res. 1991 Jun 11;19(11):2993–3000. PubMed PMID: 2057357; PubMed Central PMCID: PMCPMC328262.
- Dohrmann PR, Butler G, Tamai K, et al. Parallel pathways of gene regulation: homologous regulators SWI5 and ACE2 differentially control transcription of HO and chitinase. Genes Dev. 1992 Jan;6(1):93–104. PubMed PMID: 1730413.
- Briggs MW, Burkard KT, Butler JS. Rrp6p, the yeast homologue of the human PM-Scl 100-kDa autoantigen, is essential for efficient 5.8 S rRNA 3ʹ end formation. J Biol Chem. 1998 May 22;273(21):13255–13263. PubMed PMID: 9582370; eng.
- Mojardin L, Botet J, Quintales L, et al. New insights into the RNA-based mechanism of action of the anticancer drug 5ʹ-fluorouracil in eukaryotic cells. PloS one. 2013;8(11):e78172. PubMed PMID: 24223771; PubMed Central PMCID: PMCPMC3815194.
- Sorenson MR, Stevens SW. Rapid identification of mRNA processing defects with a novel single-cell yeast reporter. Rna. 2014 May;20(5):732–745. PubMed PMID: 24671766; PubMed Central PMCID: PMCPMC3988574.
- Weiss EL. Mitotic exit and separation of mother and daughter cells. Genetics. 2012 Dec;192(4):1165–1202. PubMed PMID: 23212898; PubMed Central PMCID: PMCPMC3512134.
- Marin-Vicente C, Lyutvinskiy Y, Romans Fuertes P, et al. The effects of 5-fluorouracil on the proteome of colon cancer cells. J Proteome Res. 2013 Apr 5;12(4):1969–1979. PubMed PMID: 23477467.
- Lybecker M, Zimmermann B, Bilusic I, et al. The double-stranded transcriptome of escherichia coli. Proc Natl Acad Sci U S A. 2014 Feb 25;111(8):3134–3139. PubMed PMID: 24453212; PubMed Central PMCID: PMC3939876.
- Sinturel F, Navickas A, Wery M, et al. Cytoplasmic control of sense-antisense mRNA pairs. Cell Rep. 2015 Sep 22;12(11):1853–1864. PubMed PMID: 26344770.
- Allmang C, Petfalski E, Podtelejnikov A, et al. The yeast exosome and human PM-Scl are related complexes of 3ʹ –> 5ʹ exonucleases. Genes Dev. 1999 Aug 15;13(16):2148–2158. PubMed PMID: 10465791; PubMed Central PMCID: PMCPMC316947.
- Kowalinski E, Kogel A, Ebert J, et al. Structure of a cytoplasmic 11-Subunit RNA exosome complex. Mol Cell. 2016 Jul 7;63(1):125–134. PubMed PMID: 27345150; PubMed Central PMCID: PMCPMC4942675.
- Liu Q, Greimann JC, Lima CD. Reconstitution, activities, and structure of the eukaryotic RNA exosome. Cell. 2006 Dec 15;127(6):1223–1237. PubMed PMID: 17174896.
- Januszyk K, Liu Q, Lima CD. Activities of human RRP6 and structure of the human RRP6 catalytic domain. Rna. 2011 Aug;17(8):1566–1577. PubMed PMID: 21705430; PubMed Central PMCID: PMCPMC3153979.
- Uhlen M, Zhang C, Lee S, et al. A pathology atlas of the human cancer transcriptome. Science. 2017 Aug 18;357(6352). PubMed PMID: 28818916.
- Wu WY, Lebbink JHG, Kanaar R, et al. Genome editing by natural and engineered CRISPR-associated nucleases. Nat Chem Biol. 2018 Jul;14(7):642–651. 10.1038/s41589-018-0080-x. PubMed PMID: 29915237.
- Shah MY, Pan X, Fix LN, et al. 5-Fluorouracil drug alters the microRNA expression profiles in MCF-7 breast cancer cells. J Cell Physiol. 2011 Jul;226(7):1868–1878. PubMed PMID: 21506117.
- Zhou J, Zhou Y, Yin B, et al. 5-Fluorouracil and oxaliplatin modify the expression profiles of microRNAs in human colon cancer cells in vitro. Oncol Rep. 2010 Jan;23(1):121–128. PubMed PMID: 19956872.
- Xiong W, Jiang YX, Ai YQ, et al. Microarray analysis of long non-coding RNA expression profile associated with 5-fluorouracil-based chemoradiation resistance in colorectal cancer cells. Asian Pac J Cancer Prev. 2015;16(8):3395–3402. PubMed PMID: 25921151.
- Gong J, Shao D, Xu K, et al. RISE: a database of RNA interactome from sequencing experiments. Nucleic Acids Res. 2018 Jan 4;46(D1):D194–D201. PubMed PMID: 29040625; PubMed Central PMCID: PMCPMC5753368.
- DeWeerdt S. Calling cancer’s bluff with neoantigen vaccines. Nature. 2017 Dec 21;552(7685):S76–S77. PubMed PMID: 29293229.
- Eisenstein M. Making cancer immunotherapy a surer bet. Nature. 2017 Dec 21;552(7685):S72–S73. PubMed PMID: 29293218.
- Blokhin I, Khorkova O, Hsiao J, et al. Developments in lncRNA drug discovery: where are we heading? Expert Opin Drug Discov. 2018 Sep;13(9):837–849. PubMed PMID: 30078338.
- Schmitt ME, Brown TA, Trumpower BL. A rapid and simple method for preparation of RNA from Saccharomyces cerevisiae. Nucleic Acids Res. 1990 May 25;18(10):3091–3092. PubMed PMID: 2190191; PubMed Central PMCID: PMCPMC330876.
- Kim D, Pertea G, Trapnell C, et al. TopHat2: accurate alignment of transcriptomes in the presence of insertions, deletions and gene fusions. Genome Biol. 2013 Apr 25;14(4):R36. PubMed PMID: 23618408; PubMed Central PMCID: PMCPMC4053844.
- Bourgon R, Gentleman R, Huber W. Independent filtering increases detection power for high-throughput experiments. Proc Natl Acad Sci U S A. 2010 May 25;107(21):9546–9551. PubMed PMID: 20460310; PubMed Central PMCID: PMCPMC2906865.
- Rau A, Gallopin M, Celeux G, et al. Data-based filtering for replicated high-throughput transcriptome sequencing experiments. Bioinformatics. 2013 Sep 1;29(17):2146–2152. PubMed PMID: 23821648; PubMed Central PMCID: PMCPMC3740625.
- Robinson MD, Oshlack A. A scaling normalization method for differential expression analysis of RNA-seq data. Genome Biol. 2010;113:R25. PubMed PMID: 20196867; PubMed Central PMCID: PMCPMC2864565.
- McCarthy DJ, Chen Y, Smyth GK. Differential expression analysis of multifactor RNA-Seq experiments with respect to biological variation. Nucleic Acids Res. 2012 May;40(10):4288–4297. PubMed PMID: 22287627; PubMed Central PMCID: PMCPMC3378882.
- Lun AT, Chen Y, Smyth GK. It’s DE-licious: A recipe for differential expression analyses of RNA-seq experiments using quasi-likelihood methods in edgeR. Methods Mol Biol. 2016;1418:391–416. PubMed PMID: 27008025.
- Benjamini Y, Hochberg Y Controlling the false discovery rate: a practical and powerful approach to multiple testing. J R Statist Soc B 1995;57:289–300.
- Robinson MD, McCarthy DJ, Smyth GK. edgeR: a bioconductor package for differential expression analysis of digital gene expression data. Bioinformatics. 2010 Jan 1;26(1):139–140. PubMed PMID: 19910308; PubMed Central PMCID: PMCPMC2796818.
- Boyle EI, Weng S, Gollub J, et al. GO::termFinder–opensource software for accessing gene ontology information and finding significantly enriched gene ontology terms associated with a list of genes. Bioinformatics. 2004 Dec 12;20(18):3710–3715. PubMed PMID: 15297299; PubMed Central PMCID: PMCPMC3037731.
- Supek F, Bosnjak M, Skunca N, et al. REVIGO summarizes and visualizes long lists of gene ontology terms. PloS one. 2011;6(7):e21800. PubMed PMID: 21789182; PubMed Central PMCID: PMCPMC3138752.
- Coordinators NR. Database resources of the national center for biotechnology information. Nucleic Acids Res. 2016 Jan 4;44(D1):D7–19. PubMed PMID: 26615191; PubMed Central PMCID: PMCPMC4702911.
- Xie B, Horecka J, Chu A, et al. Ndt80 activates the meiotic ORC1 transcript isoform and SMA2 via a bi-directional middle sporulation element in Saccharomyces cerevisiae. RNA Biol. 2016 Sep;13(9):772–782. PubMed PMID: 27362276; PubMed Central PMCID: PMCPMC5013992.
- Kushnirov VV. Rapid and reliable protein extraction from yeast [Research support, Non-U.S. Gov’t]. Yeast. 2000 Jun 30;16(9):857–860. PubMed PMID: 10861908; eng.
- Descrimes M, Zouari YB, Wery M, et al. VING: a software for visualization of deep sequencing signals. BMC Res Notes. 2015;8:419, 10.1186/s13104-015-1404-5. PubMed PMID: 26346985; PubMed Central PMCID: PMC4562374