
 ?Mathematical formulae have been encoded as MathML and are displayed in this HTML version using MathJax in order to improve their display. Uncheck the box to turn MathJax off. This feature requires Javascript. Click on a formula to zoom.
ABSTRACT
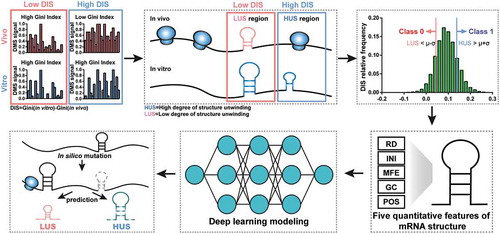
The structure of mRNA in vivo is unwound to some extent in response to multiple factors involved in the translation process, resulting in significant differences from the structure of the same mRNA in vitro. In this study, we have proposed a novel application of deep neural networks, named DeepDRU, to predict the degree of mRNA structure unwinding in vivo by fitting five quantifiable features that may affect mRNA folding: ribosome density (RD), minimum folding free energy (MFE), GC content, translation initiation ribosome density (INI) and mRNA structure position (POS). mRNA structures with adjustment of the simulated structural features were designed and then fed into the trained DeepDRU model. We found unique effect regions of these five features on mRNA structure in vivo. Strikingly, INI is the most critical factor affecting the structure of mRNA in vivo, and structural sequence features, including MFE and GC content, have relatively smaller effects. DeepDRU provides a new paradigm for predicting the unwinding capability of mRNA structure in vivo. This improved knowledge about the mechanisms of factors influencing the structural capability of mRNA to unwind will facilitate the design and functional analysis of mRNA structure in vivo.
Introduction
mRNA is a key component of the translation system. It not only carries protein-coding information but also serves as an essential vector for translation regulation information by folding into mRNA structures [Citation1]. Notably, mRNA structures at the 5ʹ UTR and ribosome binding site (RBS) regions have a significant effect on translation efficiency [Citation2,Citation3]. Recent studies have shown that RNA structures in vivo are different from that in vitro (as revealed by DMS probing [Citation4,Citation5], DMS-MaPseq [Citation6] and icSHAPE [Citation7]). Some general conclusions have been drawn: mRNA in vivo is less structured than mRNA in vitro, and mRNA structures in highly expressed genes, especially long-range base pairing structures, appear to be destabilized by translation. However, further investigation of these differences in the specific and accurate analysis of each mRNA structure is a challenge owing to the influence of multiple factors and the dynamic, unique nature of the mRNA structure itself; that is, each mRNA structure has a distinctive individual structure.
For the translation by the ribosome to proceed smoothly, the mRNA structure must first be unwound, and complex interactions between the translating ribosome and the mRNA structure occur during translation. Translating ribosomes are among the most critical factors that cause structural differences in vitro and in vivo. Ribosome profiling is a method for determining the exact position of ribosomes in the transcriptome during the translation with a single-nucleotide resolution by deeply sequencing ribosome-protected mRNA fragments [Citation8,Citation9]. The precise ribosome density information demonstrated by this method makes it possible to resolve the interactions between translating ribosomes and mRNA structure in vivo. For example, the mRNA structure in the CDS region influences cotranslational protein folding by affecting the efficiency of ribosome translation or, in more extreme cases, by causing ribosomal pauses [Citation10–Citation12]. Additional factors that affect mRNA structural stability in vivo can be primarily classified into several categories: structural features, such as the GC content and minimum free energy of structural subsequences, and other factors, such as the location of mRNA structure within a gene.
Deep learning, or artificial neural networks, is a type of machine learning that solves complex problems by learning ‘big data.’ The deep neural network (DNN), a type of deep learning, has multiple hidden layers and units that can model complex nonlinear relationships and is widely used in natural language processing [Citation13], speech recognition [Citation14] and the sensational AlphaGo [Citation15]. Deep learning is currently being applied to biological ‘big data,’ such as the detection of breast cancer based on histological images [Citation16], the analysis of ribosomal stalling sites based on ribosome profiling [Citation17] and the prediction of DNA- and RNA-binding proteins [Citation18]. We have proposed a novel application of the DNN model to fit mRNA structure features and subsequently predict the structural state in vivo, revealing the impact of these features on the in vivo mRNA structural stability.
Among experimental approaches to detecting RNA structure in vivo, DMS probing detected adenine and cytosine bases in non-Watson–Crick conformations [Citation4,Citation5]. Thus, we proposed identifying in vitro and in vivo mRNA structures by this method and dividing them into two classes according to the degree of unwinding. Then, five structural features of each mRNA structure were obtained, and the DNN model for binary classification was trained. After obtaining a precise model to predict the degree of RNA structure unwinding in vivo, we could mutate different features of these mRNA structures and decipher the specific impact of these features on mRNA structural stability ().
Figure 1. Schematic overview of DeepDRU model and the prediction pipeline. The Gini index was calculated to measure the stability of the mRNA structure. The difference between the Gini index values in vitro and in vivo was used to classify the mRNA structures into class 0 and class 1. Then, the two classes were fed into the DNN model for training. After the model was trained, various feature adjustments to the mRNA structures were designed, and the model was used to predict the degree of structure unwinding.
Results
Constructing a deep learning model with five mRNA structure features
We proposed a DNN model that fits mRNA structure differentiation in vitro and in vivo with quantifiable elements that may influence structural stability, thereby realizing the ability to predict the degree of unwinding of mRNA structure in vivo (). Unlike previous mRNA structure prediction models that aimed at constructing RNA structures [Citation19], this deep learning model is mainly used to predict whether the mRNA structure has strong or weak unwinding capability in vivo. DMS profiling [Citation4] can be used to provide a global feature describing in vivo and in vitro mRNA structures by measuring the Gini index of DMS signal of structure region. A higher Gini index corresponds to a highly structured region and a lower index corresponds to a weakly structured region. Typically, due to a variety of factors, such as translating ribosomes, the in vitro structure is usually more stable than that in vivo [Citation4]. The ‘structural disappearance trend’ (DIS), which is equal to the Gini index of mRNA structures in vitro minus that in vivo, was used to measure the unwinding capability of mRNA structure in vivo. In this study, the in vitro mRNA structures of Saccharomyces cerevisiae were all divided into two classes by DIS. Class 1 contained structures beyond the mean plus standard deviation (SD), which represented structures with a high degree of unwinding in vivo, named HUS; class 0 contained structures below the mean minus SD, which represented structures with a low degree of unwinding in vivo, named LUS (). HUS and LUS mRNA structures could appear on the same gene, and several differences in structural features might be interpreted as corresponding to the existence of these two states ()).
Figure 2. High and low degrees of mRNA structure unwinding with various structural features. (a) LUS and HUS structures with different structural features in the YDR346C gene. (b) Pearson correlation coefficients between the five structural features. (c) Distribution of the five features between the two classes.
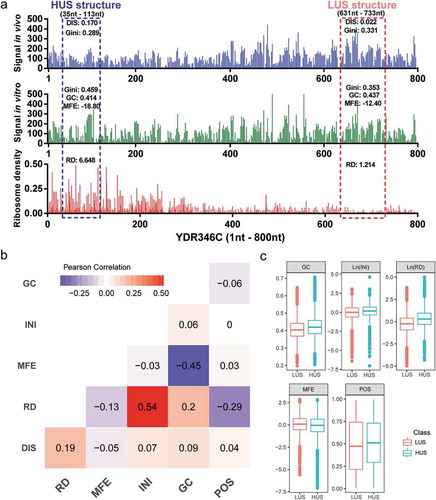
In addition to sequence composition, previous studies found that translation efficiency could affect mRNA structure in vivo, especially the mRNA structure in the ribosomal binding region [Citation2,Citation20]. We chose five quantitative features for modelling: gene features, including the translation initiation ribosome density (INI), calculated from ribosome profiling data [Citation8]; subsequence structure features, including the minimum free energy (MFE) [Citation21] and GC content (GC), which reflect mRNA structure stability; and other features, including the relative position of the structure in the gene (POS) and the ribosome density of the structure region (RD). Notably, the RD and INI values in this project were averaged from five different studies of ribosome profiling data in wild-type yeast aiming to obtain more general in vivo ribosome profiling data [Citation22–Citation26].
By directly calculating the correlations between these five structural features and DIS values, the general influence of these five features on mRNA structure could be obtained ()). Notably, the correlation between ribosome density and DIS was the strongest (with a correlation coefficient of 0.19). After the dataset was divided into HUS and LUS classes, the five features differ between the two groups of mRNA structures (p-value <2.2 × 10⁻¹⁶), but it was difficult to explain the contributions of these five features to the mRNA structure ()). Therefore, we adopted DNN modelling to decipher the relationships between mRNA structure and these complex regulatory features.
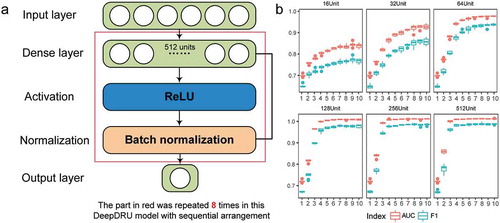
We established the DNN sequential model using the TensorFlow deep learning framework [Citation27], named DeepDRU (using a deep learning approach to predict the degree of mRNA structure unwinding in vivo.). The DeepDRU model consisted of fully connected layers, activation layers and normalization layers; the activation functions adopted were ReLU [Citation28] and Sigmoid; the Adam optimization function [Citation29] was adopted to accelerate the training process; and optimization techniques, batch normalization [Citation30] and early stopping [Citation31] were added to prevent overfitting of the model ()). To obtain the best model structure, we traversed the model structure from 1 to 10 layers, 16 units to 512 units per layer (60 different models) and finally determined the best DeepDRU model structure to be eight layers of 512 units by 10-fold cross-validation (), Table S1). The accuracy of the DeepDRU model of the whole dataset classification reached 99.53%. Thus, a DNN model that can accurately predict the degree of in vivo mRNA structure unwinding from structural features was established.
Figure 3. Schematic illustration of the DeepDRU model. (a) The DeepDRU model used in this study is a sequential DNN model of multiple dense layers. After careful verification of the number of dense layers and units per layer, we used a sequential model of eight dense layers of 512 units. More details can be found in the description of the method. (b) Tenfold cross-validation was performed on models constructed with different numbers of layers and different numbers of units.
High ribosome density caused mRNA structure in vivo to be unwound
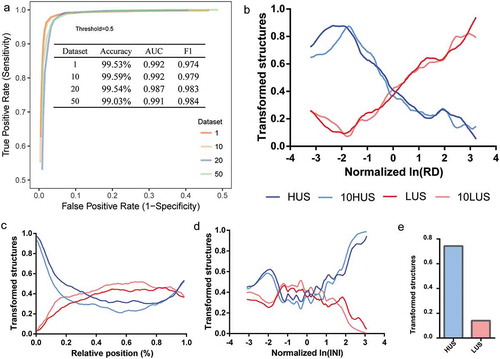
Translating ribosomes are a critical factor that affects mRNA structural stability. Previous studies have demonstrated a negative correlation between ribosomal translation efficiency and in vivo mRNA structure stability; that is, high translation efficiency corresponds to low structural stability in a region [Citation2,Citation5,Citation20,Citation32]. We performed single-factor gradient adjustment in silico on the ribosome density (RD) of the mRNA structures. By predicting the state of the adjusted mRNA structures using DeepDRU, a clear correlation between the RD and the average structural transformation ratio was shown ()). mRNA structures belonging to the LUS class tended to change into HUS when the RD of the structural region was increased, and when the RD of structures belonging to HUS was decreased, these structures tended to transform to the LUS class. A similar trend was shown in datasets that were filtered using more stringent thresholds (10HUS and 10LUS). This correlation was most pronounced for intervals greater than −2.0 (corresponding to 0.48 before normalization) and less than 3.0 (corresponding to 4.07 before normalization). Due to the steric hindrance of the translating ribosome, if the RD of the mRNA structural region was high, the ribosome would occupy the folding space of the structural region, preventing the formation of the mRNA structure.
The 5‘- and 3‘-end mRNA structures were much easier to maintain in vivo
We sought to establish the relationship between mRNA structure and its relative position in the gene CDS region. Previous studies have shown that the mRNA structure in the translation initiation region plays an important role in translation regulation, which is related to the regulation of translation efficiency and cotranslational protein folding [Citation3,Citation33–Citation35]. Moreover, the mRNA structure at the 3‘ end of the mRNA is related to RNA localization and mRNA half-life [Citation36,Citation37]. We changed the relative position (POS) of the mRNA structure on the gene by gradient adjustment and found that 89.02% of originally HUS structures transformed to LUS after being transferred downstream of the initiation AUG codon. The mRNA structure of the middle part of the gene remained unchanged, and the structural transformation trend at the 3ʹ end (approximately beyond 0.8) revealed a trend toward LUS, especially for originally HUS structures. We believe that this finding reflected the rules of in vivo mRNA structure learned by the model, that is, the 5‘ and 3‘ ends of the mRNA were more likely to maintain their structure. Second, these two regions themselves might be more likely to maintain in vivo mRNA structure, for example, to stall ribosomes at the AUG codon for assembly to allow time for downstream mRNA structure formation. Furthermore, to eliminate the interference of high RD at the 5ʹ end region, the POS and RD were simultaneously changed to the value of the first structure at the 5‘ end of mRNA, and similar results were obtained ()).
High translation initiation ribosome density weakened the capability of structure unwinding
Translation initiation is the rate-limiting step in the translation process and is regulated by a variety of factors, including the mRNA structure [Citation38]. The mRNA structural feature INI, which is the sum of the normalized RDs relative to the start codon, could reflect the inverse of the translation initiation rate. Single-factor gradient adjustment showed that the effect of INI on the mRNA structure, especially in regions with intermediate INI value (approximately between −1 and 1), fluctuated greatly ()). However, high-INI regions, that is, genes with high INI and a low translation initiation rate, corresponding to a low degree of unwinding. A low translation initiation rate was prone to form a slow “ramp” at the translation initiation region, which could reduce ribosome traffic jams and increase the ribosome spacing during translation elongation, which might allow local mRNA structure to refold [Citation35,Citation39]. Meanwhile, in low-INI regions (approximately less than −2), the degree of unwinding tended to increase, perhaps due to the rapid degradation of mRNA with low translation efficiency [Citation40].
Effects of mRNA structure subsequence composition on its structure in vivo
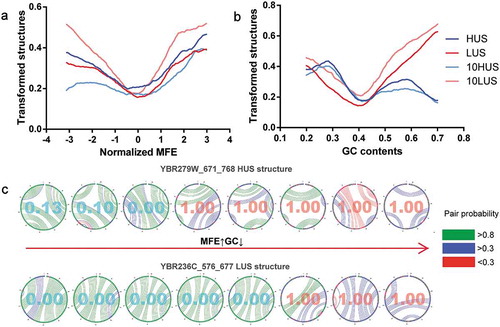
The minimum free energy (MFE) and GC content were used to evaluate the stability of the mRNA structure in vitro based on its sequence composition [Citation39,Citation41–Citation43]. MFE was significantly negatively correlated with GC, with a Pearson correlation of −0.45 ()). Compared to mutations in the other features discussed previously, the results of single-factor gradient adjustment of both MFE and GC exhibited a very distinctive trend (, )). The transformed mRNA structure curve showed a V-shaped trend with a mean value as the demarcation point. As the changes in the normalized MFE value moved in both directions from the mean value 0, both HUS and LUS structures would shift toward the opposite state. At the MFE and GC mean points, the lowest point of the structural transformed rate, that is, the mRNA structure at the mean, can more easily maintain its original state. To reduce the impact of other structural factors, we selected two from all the mRNA structures for which all five structural features were close to the mean. Random mutations of the structural sequence were made, and eight mutations in which the absolute value of the MFE and GC was simultaneously increased or decreased were selected. When the effects of other structural features were attenuated, an increase in the MFE and a decrease in the GC content corresponded to a reduction in the number of mRNA structure pairs and the pairing probability, so that the prediction result was changed from HUS to LUS ()). Thus, when the interference of other factors is removed, the sequence composition of the mRNA structure directly affects the stability of its structure in vivo.
Figure 4. The effects of MFE and GC on the mRNA structure in vivo. (a, b) Single-factor gradient adjustment of MFE and GC in mRNA structure. (c) The detailed process of two mRNA structural mutations and structural state transitions. MFE increased and GC decreased from left to right. The value in the circle was generated by DeepDRU model prediction. Less than 0.5 could be classified as LUS structure, and more than 0.5 was classified as HUS structure. In vitro mRNA, structure is shown with different colours representing pairing probability.
The contribution of five structural features to mRNA structure in vivo
The structural ribosomal density (RD), the structural minimum free energy (MFE), the translation initiation ribosome density (INI), the GC content of the structural region sequence (GC) and the relative position of the mRNA structure in the gene (POS) is five essential factors that might affect the structural stability in vivo. By retraining the DeepDRU model with the data for one feature missing, the impact factors of the five structural features could be obtained to evaluate the contribution of each feature to the model. The INI has the most significant impact, followed by the POS of the mRNA structure and the RD of the structure region ()). The in vitro characteristics of the mRNA structure, including MFE and GC, contributed least to the model. When considering the impact of two features, any two of RD, INI and POS have the most significant impact ratio ()). Initially, the impact ratio of MFE was lower than that of GC. However, when combined with INI, INI-MFE’s influence was higher than that of INI and GC. As expected, the combination of GC and MFE naturally has the lowest impact.
Figure 5. The DeepDRU model addressed the impact ratio of structural features. (a) Impact ratio of five structural features on structural unwinding capability. (b) Impact ratio of the pairwise combination of structural features on structural unwinding capability. (c) The mRNA was partitioned according to the degree of unwinding. Only the sHUS (red) and sLUS (blue) regions were identified for each mRNA. “Ave“ is the average HUS ratio of each column. ”INI” is the INI value of each mRNA. (d) INI values of mRNAs with dominant sHUS or sLUS regions. (e) The proportions of several types of mRNA structures.
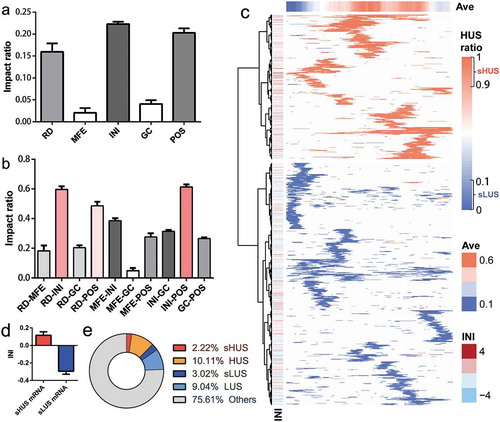
mRNAs were partitioned according to the degree of unwinding
The degree of unwinding of mRNA regions varied due to the factors discussed above, including RD, INI and POS. In other words, regardless of the sequence composition, the mRNA region itself has characteristics that determine whether it is prone to form a structure. By simulating the change in MFE value of the mRNA region from the minimum value to the maximum, the DeepDRU model was used to predict the classification. If the HUS ratio was greater than 0.9, it was considered mRNA structure with a stable high degree of unwinding (sHUS); If the HUS ratio was less than 0.1, it was considered mRNA structure with a stable low degree of unwinding (sLUS). SHUS and sLUS were special cases of HUS and LUS, accounting for 18.00% and 25.04%, respectively ()). The locations of sHUS and sLUS on mRNA were not evenly distributed, as each presented advantage in different mRNAs; thus, the mRNA could be clustered into sHUS rich mRNAs or sLUS rich mRNAs (), Table S2). This clear difference between the two types of mRNA might be explained by the INI value of mRNA, i.e., mRNA with a dominant sHUS region has a higher INI value ()). In addition, the relative position of sLUS on the mRNA was consistent with the previous conclusion that sLUS was more concentrated at the 5‘ and 3‘ ends.
Discussion
Since the invention of large-scale, high-throughput methods for in vivo mRNA structure determination, previous studies have statistically derived general conclusions regarding in vivo and in vitro mRNA structural differences, such as that the mRNA structure in vitro tends to be unwound in the cell and that the structural differences between in vivo and in vitro mRNA are mainly caused by ribosome translation [Citation2,Citation4–Citation7]. Because multiple factors cause differences in vivo and in vitro structures, however, it was difficult to perform a further accurate or ‘personalized analysis’ of mRNA structures in previous studies.
In this study, we used a novel deep learning application to accurately model labelled mRNA structures in yeast with five quantitative structural features (RD of structure regions, MFE and GC content of subsequences, INI and POS). Through extensive model selection and optimization, we obtained the DeepDRU model with high accuracy, which best predicted the degree of mRNA structure unwinding in vivo. The rules explaining the effects of these five features on mRNA structural stability were then resolved by performing in silico gradient adjustment for these five features and subsequent prediction by the DeepDRU model. We found that increasing RD increased the degree of mRNA structure unwinding and vice versa. The relative position of the mRNA structure on the gene also affects its unwinding capability; that is, the in vivo mRNA structure near the 5ʹ end (POS< 20%) in particular and the 3ʹ end (POS>80%) tends to have a low degree of unwinding. The INI of mRNA is the most critical factor among the five features affecting unwinding capability. The sequence of the mRNA structural region determines the strength of its in vitro mRNA structure through the MFE algorithm or GC content but has limited effects on its structure in vivo. In particular, mRNA that maintains a stable high or low degree of unwinding regions (sHUS or sLUS) could be identified by simulation and prediction by DeepDRU.
This study is the first to use a deep learning approach to deconstruct mRNA structure differentiation in vitro and in vivo. DNNs were proven to be usable for solving complex regulatory issues in mRNA structure. The DeepDRU model accurately predicted the degree of in vivo mRNA structure unwinding and resolved the range of influence of five structural features on structural unwinding capability. However, some limitations are worth noting. Previous studies have shown that codon bias and tRNA abundance could affect the ribosome translation rate and thus influence the structural stability of mRNA in vivo [Citation12,Citation39,Citation44]. Codon bias and tRNA abundance were not considered separately in our model, because the RD data already carried the ribosome translation information on these two factors. Our results are encouraging and should be validated in a larger number of mutant yeast species. Future works should, therefore, focus on the following points. Codon biases and tRNA abundance should be used as separate features instead of RD to make the DNN model more universal and to perform an impact analysis of the mRNA structural stability. Additionally, more species, such as Arabidopsis and mice, as well as more detection methods, such as SHAPE-MaP and icSHAPE, should be considered in the state prediction of mRNA structure in vivo.
Materials and methods
Raw data preprocessing
Saccharomyces cerevisiae RNA structure data were obtained from a DMS profiling experiment (containing in vivo, in vitro and denatured datasets in WIG format) published in the NCBI GEO database, accession number GSE45803 [Citation4]. Gene sequences were retrieved from SGD database assembly R62. DMS signal data in WIG format were mapped to genes and filtered with thresholds of 1, 10, 20 and 50 thresholds, producing four datasets named as the thresholds ()). The specific gene screening strategy is as follows:
where ‘i’ is each site of the gene. Datasets 1, 10, 20 and 50 correspond to 3657 and 1801, 1019 and 398 genes. WIG data were mapped to genes, and genes were screened by DMS signal per gene per nt using Perl scripts. We trimmed G/T sites in the gene sequence and then used sliding windows of 50 nt (i.e., the 50 nt sequence after the deletion of G and T sites, where the full-length sequence was approximately 100 nt) to divide the trimmed genes into regions. Multiple sets of ribosome profiling (RP) data were combined to approach the true S. cerevisiae ribosome occupancy. The RP data of wild-type yeast were based on the following studies: Zinshteyn and Gilbert et al. 2013 [Citation22], Lareau et al. 2014 [Citation23], Albert et al. 2014 [Citation24] (BY and RM samples), Young et al. 2016 [Citation25] and Nissley et al. 2016 [Citation26] (Rep1 and Rep2 samples). The RNA-Seq data were from Albert et al. 2014 (BY and RM samples) [Citation24]. Then, the RP and RNA-Seq data were trimmed and mapped to the yeast genome (assembly R62) by Bowtie and normalized by the RPKM of the RNA-Seq data [Citation45]. For the yeast fragments, an offset of 15 nucleotides from the 5ʹ end represented the P-site of the ribosome position [Citation46]. Therefore, ribosome occupancy at nucleotide resolution was given by the location of the genome position of the 15th nucleotide of ribosomal fragments.
Figure 6. The effects of RD, POS, and INI on the mRNA structure in vivo. (a) ROC curve of DeepDRU model by different datasets (more details can be found in the materials and methods). (b, c, d) Single-factor gradient adjustment of RD, POS, and INI. The ordinate was the ratio of transformed structure to the total. When the ratio of transformed structures reached 1, all structures had transformed to the opposite of their original class. HUS and LUS belong to the dataset 1. Ten HUS and 10LUS belong to the dataset 10. (e) Transformation ratios of LUS and HUS structures after co-mutation of the POS and RD.
Classification of mRNA structures by DMS probe data
We defined the mRNA structure by two metrics: Pearson’s correlation coefficient (r < 0.55) and the Gini coefficient (Gini < 0.14), as described [Citation4]. To more reasonably analyse the trend of the disappearance of an RNA structure, we propose an index that reflected the difference between in vivo and in vitro mRNA structures, named DIS, which was equivalent to subtracting the in vitro and in vivo Gini coefficients of the structural region (G). For an mRNA structural region of length n, the DMS signal per site is , and its DIS and Gini coefficient are as follows:
Calculation and standardization of five features of mRNA structures
We chose five structural features as measures of mRNA structure. The feature RD was the ribosome density of the structural region [Citation47]. MFE was the minimum free energy of a local subsequence, calculated by the Vienna (v.2.1.9) package RNAfold [Citation21] function and visualized by RNAstructure [Citation48]. INI reflected the translation efficiency at the beginning of the gene region (+15 nt). GC represented the GC content of the sequence of the structural region. Finally, POS was the relative position of the structure region in the gene, which was obtained by dividing the sequence length by the central position of the structure region. Two features, RD and INI, were exponentially distributed, so the logarithm was used. Before deep learning training, the parameters (except POS and GC) were normalized ((x-μ)/σ2) to make the model more accurate.
Establishment of a deep neural network model
We established a DNN model named DeepDRU (using a deep learning approach to predict the degree of mRNA structure unwinding in vivo). By labelling known-state structures and evaluating a sequence using these five features, a prediction model can be generated. DIS was used to evaluate the degree of RNA structural unwinding in vivo, and its distribution was similar to a normal distribution. To ensure a sufficient number of training sets and development sets (Train/Dev set), we decided to use μ ± σ as the threshold value. Class 1 was defined as DIS greater than μ + σ, meaning that such structures in vitro have a high degree of unwinding, and named HUS; class 0 was tagged as DIS less than μ-σ, indicating that such structures in vitro have a weak degree of unwinding in vivo, and named LUS. Therefore, the question became a binary classification problem. In this project, we used TensorFlow [Citation27] to construct a DNN model solving the complex problem of RNA structural state prediction in vivo. After model training, we determined 0.5 as the classification threshold from the ROC curve ()). During the training of the model, the high threshold of datasets 20 and 50 might introduce bias to the meta-properties of RNA structural pattern and cause the fluctuation of the predicted result of the DeepDRU model; therefore, these two datasets were deleted.
Ten-fold cross-validation
Ten-fold cross-validation (10CV) method was used to evaluate the generalization capabilities of different DeepDRU models. All mRNA structural data were first randomly shuffled and then divided into 10 groups, each with nine groups as the training set (Train) and one group as the development set (Dev). This process was repeated 10 times until each group was used in the development set once. Each model was subsequently trained on a training set and validated on the development set. To select the most suitable model, we performed a 10CV on 60 models with multiple dense layers (1 to 10 layers) and multiple units per layer (16, 32, 64, 128, 256 and 512 units). The precision, recall, area under the ROC curve (AUC) and F1 score (F1) in 10CV were averaged (Table S1). Rank in Table S1 represents the index after sorting the data according to the predicted value. The model with eight fully connected layers of 512 units was chosen as the DeepDRU model. Among the 60 models, the AUC, precision and F1 score values of this model structure are the highest among the 60 models; that is, the rank value is 1, and the rank value of recall is 3. The average accuracy of this model was 99.59% in the training set, 96.27% in the development set and 3.32% in the difference. The training data, main Python and Perl scripts, and model files used in this project can be obtained in the Github repository (https://github.com/atlasbioinfo/DeepDRU). Among them, the Python scripts are mainly used for deep learning model training and prediction, and the Perl scripts are used for data processing and preliminary analysis.
Single-factor gradient adjustment and predictions
We performed single-factor gradient adjustment in silico on the five features of mRNA structure to test the effects of these features on the unwinding capability. Single-factor gradient adjustment is a method in which only one structural feature is gradient adjusted while the other features remain unchanged. A gradient of 100 aliquots was designed between the mean plus or minus 3 SD of the structural features, and gradient adjustment was performed from small to large. It should be noted that the significance of the simulated feature adjustment in silico was to analyse multiple factor effects on the retention of mRNA structures in vivo more accurately than with the original data statistics. First, the feature adjustment in silico can design a large number of previously unobservable mRNA structures and predict their unwinding degree in vivo, enriching the amount of data. Second, in the process of gradient mutation, the tolerance of each structure to different feature changes can be accurately obtained, which is not possible by traditional statistical analyses. The transformation of mRNA structure was defined as a change in mRNA structure state (i.e., reclassification into another group) after the adjustment. In addition, since we used two datasets in the single-factor gradient adjustment (dataset 1 and 10), results of HUS, LUS, 10HUS and 10LUS were generated correspondingly.
Impact ratios of the structural features
We retrained the model with the data from each structural feature missing and calculated the impact ratio of each feature from the F1 score of the trained model.
The ratio is the F1 score of the DeepDRU model minus the average F1 score of the 10-fold cross-validation (s = 10). The impact ratio of single structural feature is the result of ratio normalization, where the Max (ratio) is 0.5 because the modelling accuracy of random features should be 0.5.
mRNA partition by unwinding degree
MFE values of all mRNA regions were changed 11 times by gradient (−3 to 3 of normalized ln(MFE)), and then the DeepDRU model was used to predict the in vivo mRNA structure state after the change. The numbers of HUS in 11 predictions divided by 11 are ‘HUS ratio’. If the HUS ratio is greater than 0.9 or less than 0.1, the mRNA region is considered to be a stable HUS or LUS region, named sHUS or sLUS (), Table S2). The sHUS and sLUS regions were labelled on the mRNA and clustered by Ward’s hierarchical agglomerative clustering method [Citation49].
Supplemental Material
Download Zip (290.5 KB)Acknowledgments
The authors would like to thank the State Key Laboratory of Crop Stress Biology in Arid Areas for its technical and hardware support for this project. We are grateful to Dr Jian Cheng and Dr Wenlong Ma for guidance in deep learning modelling. We thank Dr Anthony M. Mustoe for advice on mRNA structure analysis and Professor Zhao Xu for guidance on data preprocessing. Finally, we thank Professors Yanling Liu and Gehong Wei for their valuable guidance in the writing of this thesis and their critical review of the manuscript.
Disclosure statement
No potential conflict of interest was reported by the authors.
Supplementary material
Supplemental data for this article can be accessed here
Additional information
Funding
References
- Mortimer SA, Kidwell MA, Doudna JA. Insights into RNA structure and function from genome-wide studies. Nat Rev Genet. 2014 Jul;15(7):469–479. PubMed PMID: 24821474; English.
- Mustoe AM, Busan S, Rice GM, et al. Pervasive regulatory functions of mrna structure revealed by high-resolution SHAPE probing. Cell. 2018 Mar 22;173(1):181–195 e18. PubMed PMID: 29551268; PubMed Central PMCID: PMCPMC5866243.
- Espah Borujeni A, Cetnar D, Farasat I, et al. Precise quantification of translation inhibition by mRNA structures that overlap with the ribosomal footprint in N-terminal coding sequences. Nucleic Acids Res. 2017 May 19;45(9):5437–5448. PubMed PMID: 28158713; PubMed Central PMCID: PMCPMC5435973.
- Rouskin S, Zubradt M, Washietl S, et al. Genome-wide probing of RNA structure reveals active unfolding of mRNA structures in vivo. Nature. 2014 Jan 30;505(7485):701–705. PubMed PMID: 24336214; PubMed Central PMCID: PMCPMC3966492.
- Ding Y, Tang Y, Kwok CK, et al. In vivo genome-wide profiling of RNA secondary structure reveals novel regulatory features. Nature. 2014 Jan 30;505(7485):696–700. PubMed PMID: 24270811. English.
- Zubradt M, Gupta P, Persad S, et al. DMS-MaPseq for genome-wide or targeted RNA structure probing in vivo. Nat Methods. 2017 Jan;14(1):75–82. PubMed PMID: 27819661.
- Spitale RC, Flynn RA, Zhang QC, et al. Structural imprints in vivo decode RNA regulatory mechanisms. Nature. 2015 Mar 26;519(7544):486–490. PubMed PMID: 25799993; PubMed Central PMCID: PMCPMC4376618.
- Ingolia NT, Ghaemmaghami S, Newman JR, et al. Genome-wide analysis in vivo of translation with nucleotide resolution using ribosome profiling. Science. 2009 Apr 10;324(5924):218–223. PubMed PMID: 19213877; PubMed Central PMCID: PMCPMC2746483.
- Ingolia NT. Ribosome profiling: new views of translation, from single codons to genome scale. Nat Rev Genet. 2014 Mar;15(3):205–213. PubMed PMID: 24468696.
- Sabi R, Tuller T. A comparative genomics study on the effect of individual amino acids on ribosome stalling. Bmc Genomics. 2015;16 Suppl 10:S5. PubMed PMID: 26449596; PubMed Central PMCID: PMCPMC4602185.
- Zur H, Tuller T. Strong association between mRNA folding strength and protein abundance in S. cerevisiae. EMBO Rep. 2012 Mar 01;13(3):272–277. PubMed PMID: 22249164; PubMed Central PMCID: PMCPMC3323128. English.
- Tuller T, Waldman YY, Kupiec M, et al. Translation efficiency is determined by both codon bias and folding energy. Proc Natl Acad Sci U S A. 2010 Feb 23;107(8):3645–3650. PubMed PMID: 20133581; PubMed Central PMCID: PMCPMC2840511. English.
- Doan S, Conway M, Phuong TM, et al. Natural language processing in biomedicine: a unified system architecture overview. Methods Mol Biol. 2014;1168:275–294. PubMed PMID: 24870142.
- Hinton G, Deng L, Yu D, et al. Deep neural networks for acoustic modeling in speech recognition. Ieee Signal Proc Mag. 2012 Nov;29(6):82–97. PubMed PMID: WOS:000310345000010. English.
- Silver D, Huang A, Maddison CJ, et al. Mastering the game of go with deep neural networks and tree search. Nature. 2016 Jan 28;529(7587):484–489. PubMed PMID: WOS:000368673800028. English.
- Ciresan DC, Giusti A, Gambardella LM, et al. Mitosis detection in breast cancer histology images with deep neural networks. Med Image Comput Comput Assist Interv. 2013;16(Pt 2):411–418. PubMed PMID: 24579167.
- Zhang S, Hu H, Zhou J, et al. Analysis of Ribosome stalling and translation elongation dynamics by deep learning. Cell Syst. 2017 Sep 27;5(3):212–220 e6. PubMed PMID: 28957655.
- Alipanahi B, Delong A, Weirauch MT, et al. Predicting the sequence specificities of DNA- and RNA-binding proteins by deep learning. Nat Biotechnol. 2015 Aug;33(8):831–838. PubMed PMID: 26213851.
- Ouyang Z, Snyder MP, Chang HY. SeqFold: genome-scale reconstruction of RNA secondary structure integrating high-throughput sequencing data. Genome Res. 2013 Feb;23(2):377–387. PubMed PMID: 23064747; PubMed Central PMCID: PMCPMC3561878.
- Pop C, Rouskin S, Ingolia NT, et al. Causal signals between codon bias, mRNA structure, and the efficiency of translation and elongation. Mol Syst Biol. 2014 Dec 23;10:770. PubMed PMID: 25538139; PubMed Central PMCID: PMCPMC4300493.
- Lorenz R, Bernhart SH, Honer Zu Siederdissen C, et al. ViennaRNA package 2.0. Algorithms Mol Biol. 2011 Nov 24;6:26. PubMed PMID: 22115189; PubMed Central PMCID: PMCPMC3319429.
- Zinshteyn B, Gilbert WV. Loss of a conserved tRNA anticodon modification perturbs cellular signaling. PLoS Genet. 2013;9(8):e1003675. PubMed PMID: 23935536; PubMed Central PMCID: PMCPMC3731203.
- Lareau LF, Hite DH, Hogan GJ, et al. Distinct stages of the translation elongation cycle revealed by sequencing ribosome-protected mRNA fragments. Elife. 2014 May 09;3:e01257. PubMed PMID: 24842990; PubMed Central PMCID: PMCPMC4052883.
- Albert FW, Muzzey D, Weissman JS, et al. Genetic influences on translation in yeast. PLoS Genet. 2014 Oct;10(10):e1004692. PubMed PMID: 25340754; PubMed Central PMCID: PMCPMC4207643.
- Young SK, Palam LR, Wu C, et al. Ribosome elongation stall directs gene-specific translation in the integrated stress response. J Biol Chem. 2016 Mar 18;291(12):6546–6558. PubMed PMID: 26817837; PubMed Central PMCID: PMCPMC4813566.
- Nissley DA, Sharma AK, Ahmed N, et al. Accurate prediction of cellular co-translational folding indicates proteins can switch from post- to co-translational folding. Nat Commun. 2016 Feb 18;7:10341. PubMed PMID: 26887592; PubMed Central PMCID: PMCPMC4759629.
- Abadi M, Barham P, Chen J, et al. TensorFlow: a system for large-scale machine learning. In: Software available from tensorfloworg; Savannah, GA; 2016. p. 265–283.
- Nair V, Hinton GE, editors. Rectified linear units improve restricted boltzmann machines. International Conference on International Conference on Machine Learning; Haifa, Israel; 2010. p. 807–814.
- Kingma DP, Ba J. Adam: A method for stochastic optimization. Computer Sci. San Diego, CA; 2015.
- Ioffe S, Szegedy C Batch normalization: accelerating deep network training by reducing internal covariate shift; 2015. p.448–456.
- Bengio Y. Practical recommendations for gradient-based training of deep architectures. In K.-R. Müller, G. Montavon, and G. B. Orr, editors, Neural Networks: Tricks of the Trade. Springer; 2012. p. 437–478. doi:10.1007/978-3-642-35289-8_26.
- Gorochowski TE, Ignatova Z, Bovenberg RA, et al. Trade-offs between tRNA abundance and mRNA secondary structure support smoothing of translation elongation rate. Nucleic Acids Res. 2015 Mar 31;43(6):3022–3032. PubMed PMID: 25765653; PubMed Central PMCID: PMCPMC4381083.
- Kertesz M, Wan Y, Mazor E, et al. Genome-wide measurement of RNA secondary structure in yeast. Nature. 2010 Sep 2;467(7311):103–107. PubMed PMID: 20811459; PubMed Central PMCID: PMCPMC3847670.
- Kudla G, Murray AW, Tollervey D, et al. Coding-sequence determinants of gene expression in escherichia coli. Science. 2009 Apr 10;324(5924):255–258. PubMed PMID: WOS:000265024400047. English.
- Tuller T, Carmi A, Vestsigian K, et al. An evolutionarily conserved mechanism for controlling the efficiency of protein translation. Cell. 2010 Apr 16;141(2):344–354. PubMed PMID: 20403328.
- Wan Y, Qu K, Ouyang Z, et al. Genome-wide measurement of RNA folding energies. Mol Cell. 2012 Oct 26;48(2):169–181. PubMed PMID: 22981864; PubMed Central PMCID: PMC3483374. English.
- Martin KC, Ephrussi A. mRNA localization: gene expression in the spatial dimension. Cell. 2009 Feb 20;136(4):719–730. PubMed PMID: WOS:000263688200021. English.
- Gandin V, Miluzio A, Barbieri AM, et al. Eukaryotic initiation factor 6 is rate-limiting in translation, growth and transformation. Nature. 2008 Oct 2;455(7213):684–688. PubMed PMID: 18784653; PubMed Central PMCID: PMCPMC2753212.
- Mao Y, Liu H, Liu Y, et al. Deciphering the rules by which dynamics of mRNA secondary structure affect translation efficiency in Saccharomyces cerevisiae. Nucleic Acids Res. 2014 Apr;42(8):4813–4822. PubMed PMID: 24561808; PubMed Central PMCID: PMCPMC4005662.
- Boel G, Letso R, Neely H, et al. Codon influence on protein expression in E. coli correlates with mRNA levels. Nature. 2016 Jan 21;529(7586):358–363. PubMed PMID: 26760206; PubMed Central PMCID: PMCPMC5054687.
- Mao Y, Li Q, Wang W, et al. Number variation of high stability regions is correlated with gene functions. Genome Biol Evol. 2013;5(3):484–493. PubMed PMID: 23407773; PubMed Central PMCID: PMCPMC3622296.
- Mao Y, Li Q, Zhang Y, et al. Genome-wide analysis of selective constraints on high stability regions of mRNA reveals multiple compensatory mutations in escherichia coli. Plos One. 2013 Sep 27;8(9):e73299. PubMed PMID: 24086278; PubMed Central PMCID: PMC3785496. English.
- Zhang J, Kuo CCJ, Chen LA. GC content around splice sites affects splicing through pre-mRNA secondary structures. Bmc Genomics. 2011 Jan 31;12. PubMed PMID: WOS:000287481000001. English. DOI:10.1186/1471-2164-12-90
- Supek F. The code of silence: widespread associations between synonymous codon biases and gene function. J Mol Evol. 2016 Jan;82(1):65–73. PubMed PMID: 26538122.
- Ingolia NT, Brar GA, Rouskin S, et al. The ribosome profiling strategy for monitoring translation in vivo by deep sequencing of ribosome-protected mRNA fragments. Nat Protoc. 2012 Jul 26;7(8):1534–1550. PubMed PMID: 22836135; PubMed Central PMCID: PMCPMC3535016. English.
- Ingolia NT, Lareau LF, Weissman JS. Ribosome profiling of mouse embryonic stem cells reveals the complexity and dynamics of mammalian proteomes. Cell. 2011 Nov 11;147(4):789–802. PubMed PMID: 22056041; PubMed Central PMCID: PMCPMC3225288.
- Li GW, Burkhardt D, Gross C, et al. Quantifying absolute protein synthesis rates reveals principles underlying allocation of cellular resources. Cell. 2014 Apr 24;157(3):624–635. PubMed PMID: 24766808; PubMed Central PMCID: PMCPMC4006352.
- Reuter JS, Mathews DH. RNAstructure: software for RNA secondary structure prediction and analysis. BMC Bioinformatics. 2010 Mar 15;11:129. PubMed PMID: 20230624; PubMed Central PMCID: PMCPMC2984261.
- Murtagh F, Legendre P. Ward‘s Hierarchical agglomerative clustering method: which algorithms implement ward‘s criterion? J Classif. 2014 Oct;31(3):274–295. PubMed PMID: WOS:000345142200002. English.