
ABSTRACT
The precise increase and decrease of hormone ecdysone are critical for accurate development in insects. Most previous works focus on transcriptional activation of ecdysone production; however, little is known about the mechanism of switching off ecdysone biosynthesis after ecdysis. Here, we showed that the precursor microRNA-14 (pre-miR-14) encodes two mature miRNAs in silkworm; both of these two mature miRNAs regulate various genes in the ecdysone-signalling pathway. Bmo-miR-14-5p targets on nine genes whereas Bmo-miR-14-3p targets on two genes in the same pathway. These two mature miRNAs increased immediately after the ecdysis, efficiently suppressing the 20-hydroxyecdysone (20E) biosynthesis, the upstream regulation, and the downstream response genes. Knocking down either of two mature miRNAs or both of them delays moult development, impairing development synchrony in antagomir-treated groups. In addition, overexpressing Bmo-miR-14-5p but not Bmo-miR-14-3p significantly affected the 20E titer and increased the moulting time variation, suggesting that Bmo-miR-14-5p, though it is less abundant, has more potent effects in development regulation than Bmo-miR-14-3p. In summary, we present evidence that a pre-miRNA encodes two mature miRNAs targeting on the same pathway, which significantly improves miRNA regulation efficiencies to programmatically switch off ecdysone biosynthesis.
Introduction
Insect metamorphosis is triggered by steroid hormone 20-hydroxyecdysone (20E), which is produced primarily in the prothoracic gland (PG) under a series of enzymes referred to as the Halloween genes [Citation1,Citation2]. Several signalling cascades involve in ecdysteroidogenesis, including mitogen-activated protein kinase (MAPK) signalling cassette [Citation3], insulin/insulin-like growth factor signalling (IIS) [Citation4], and the TGFβ/Activin signalling [Citation5]. The response genes of 20E, ecdysone receptor (EcR), ecdysone-inducible nuclear receptor (E75) and CYP18A1 mediate development transition, i.e. larva-larva, larva-pupa, and pupa-adult, with a feedback regulation of ecdysone signalling [Citation6,Citation7]. The periodical increase and decrease of 20E titer are critical for robust metamorphosis development [Citation8]. The 20E should be timely cleared after ecdysis. Two mechanisms have been reported to clear circulating ecdysone in the cells. One is CYP18A1 inactivates the ecdysone and induces rapid decline of circulating ecdysone following a peak. Cyp18A1 expression is activated by a high level of ecdysone [Citation9]. The other is E23, an ecdysone-inducible gene, encodes an ABC transporter to pump ecdysone out of the cells [Citation10]. Besides the ecdysone degradation, the ecdysone production should be paused after ecdysis; however, the mechanism of turning off ecdysone production remains a mystery.
MicroRNAs (miRNAs) are a type of small noncoding RNAs that have crucial roles in the post-transcriptional regulation of insect metamorphosis [Citation11]. For example, Bmo-miR-281 and Bmo-let-7 interact with targets in the ecdysone pathway. Knocking down these miRNAs induces developmental arrest in silkworm [Citation12,Citation13]. In Drosophila melanogaster, ecdysone induces the upregulation of let-7-Complex (let-7, miR-100, and miR-125) and the downregulation of miR-34 [Citation14]. Dme-miR-14 modulates a positive auto-regulatory loop to control ecdysteroid signaling in metamorphosis [Citation15]. Silencing Dicer-1 in the hemimetabolous cockroach, Blattella germanica, led to increase of juvenile hormone (JH) and upregulation of Krüppel homologue 1 (Kr-h1), the target of the miR-2 family miRNAs (miR-2, miR-13a, and miR-13b) that induce nymphoid features in the next moult [Citation16,Citation17]. Similarly, knocking down Dicer-1 interfered with the nymph–nymph and nymph–adult transition in the migratory locust Locusta migratoria [Citation18]. Lmi-miR-133 suppressed henna and pale in the dopamine synthesis pathway, conferring phenotypic plasticity in the locust [Citation19]. Nlu-miR-8-5p and Nlu-miR-2a-3p target Br-C, membrane-bound trehalase (Tre-2), and phosphoacetylglucosamine mutase (PAGM) inducing defective moulting and causing high mortality in Nilaparvata lugens [Citation20].
Though tens of miRNAs have been reported to regulate metamorphosis development by interacting with various target genes, it is still unknown whether one single miRNA can suppress ecdysone biosynthesis simultaneously. If a miRNA can suppress many genes in ecdysone biosynthesis pathway, it can be speculated that this miRNA might have great potential in pest control. To this end, we predicted miRNAs that can target ecdysone biosynthesis pathway and found that the precursor of miR-14 (Bmo-pre-miR-14) encodes two mature miRNAs, Bmo-miR-14-3p and Bmo-miR-14-5p. Both of these two mature miRNAs repress several genes in ecdysone-signalling pathway, efficiently blocking ecdysone biosynthesis and leading to robust development synchrony.
Results
Bmo-miR-14 suppresses the ecdysone-signalling pathway
To identify whether miRNA acts as a suppressor of ecdysone biosynthesis, we first concatenated a pathway associated with hormone regulation of insect development (‘ecdysone signalling pathway’), including the ecdysone biosynthesis pathway, genes regulating ecdysone biosynthesis, and downstream ecdysone response genes (). To predict putative interactions between miRNAs and genes in ecdysone-signalling pathway, we used rapid amplification of cDNA ends (RACE) strategy to amplify the 3ʹ UTR sequences of 15 genes in the pathway, and four additional ecdysone-inducible genes (BmPi3k, BmPunt, BmBabo, and BmRaf). Next, we predicted miRNA-mRNA interaction in these 19 genes using two algorithms, RNAhybrid and miRanda. The results showed that both two mature miRNAs, Bmo-miR-14-5p and Bmo-miR-14-3p, encoding by Bmo-pre-miR-14 target multiple genes in ecdysone-signalling pathway. Bmo-miR-14-5p is predicted to target 12 genes (Additional Figure S1). Since Bmo-miR-14-3p has been previously reported to target E75 and EcR-B in silkworm [Citation21], so we focused on Bmo-miR-14-5p in this work.
Figure 1. The steroid signalling network. The ecdysone-signalling network has been extensively characterized in both D. melanogaster and B. mori and contains three sections: a regulatory pathway that controls ecdysteroidogenesis, the ecdysteriod biosynthesis pathway itself, and a downstream signalling pathway that is responsive to the presence of ecdysteroids (e.g., ecdysone receptor (EcR)). Pathways in the network in B. mori include Ras signalling (KO 04014), MAPK signalling (KO 04010), TGFβ/Activin signalling (KO 04350), insulin signalling (KO 04910), Pi3k-Akt signalling (KO 04151), as well as insect hormone biosynthesis (KO 00981). The schematic illustration of the ecdysone-signalling network was modified from diagrams in three previous reports [Citation5–Citation7]. The hairpin structures indicate confirmed Bmo-miR-14-5p targeting in the 3ʹ UTR sequences of various genes in the network. Abbreviations: PTTH, prothoracicotropic hormone; DILPs, Drosophila insulin-like peptides; MAPK, mitogen-activated protein kinase; InR, insulin receptor; 20E, 20-hydroxyecdysone; EcR, ecdysone receptor; USP, ultra-spiracle; Br-C, broad-complex core protein.
![Figure 1. The steroid signalling network. The ecdysone-signalling network has been extensively characterized in both D. melanogaster and B. mori and contains three sections: a regulatory pathway that controls ecdysteroidogenesis, the ecdysteriod biosynthesis pathway itself, and a downstream signalling pathway that is responsive to the presence of ecdysteroids (e.g., ecdysone receptor (EcR)). Pathways in the network in B. mori include Ras signalling (KO 04014), MAPK signalling (KO 04010), TGFβ/Activin signalling (KO 04350), insulin signalling (KO 04910), Pi3k-Akt signalling (KO 04151), as well as insect hormone biosynthesis (KO 00981). The schematic illustration of the ecdysone-signalling network was modified from diagrams in three previous reports [Citation5–Citation7]. The hairpin structures indicate confirmed Bmo-miR-14-5p targeting in the 3ʹ UTR sequences of various genes in the network. Abbreviations: PTTH, prothoracicotropic hormone; DILPs, Drosophila insulin-like peptides; MAPK, mitogen-activated protein kinase; InR, insulin receptor; 20E, 20-hydroxyecdysone; EcR, ecdysone receptor; USP, ultra-spiracle; Br-C, broad-complex core protein.](/cms/asset/1b5537e3-ea47-4033-8584-18d219cf71e9/krnb_a_1629768_f0001_c.jpg)
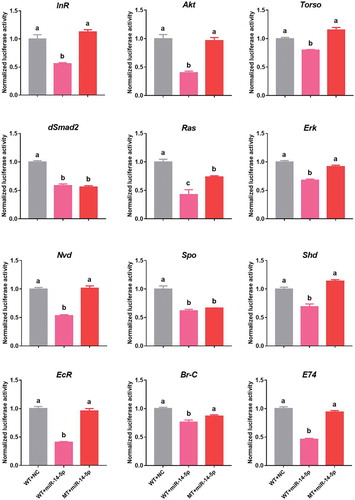
Next, we conducted a dual luciferase assay to confirm the predicted interactions. The 3ʹ UTRs of the 12 putative target genes (as wildtype) and fragments with a deleted binding sites (as mutants) were inserted at downstream of the firefly luciferase gene in a pMIR-REPORT vector, respectively (). These constructs were then separately transfected into HEK293T cells. Compared to the negative control (empty vector), the luciferase activities of nine 3ʹ UTR constructs were significantly reduced when treated with agomir-14-5p (the mimics of Bmo-miR-14-5p). Mutations in the binding sites significantly abolished the suppression effect of agomir-14-5p ().
Figure 2. Binding sites in the 3ʹUTR targets predicted by Bmo-miR-14-5p. Mutants (MT) were generated by mutating (red letters) of complementary bases in the binding region of Bmo-miR-14-5p. Seed sequences were indicated in green. Wild-type (WT) sequences of those mutations are indicated in purple. Mfe, minimum free energy of the binding between miRNA and 3ʹUTRs predicted by RNAhybrid.
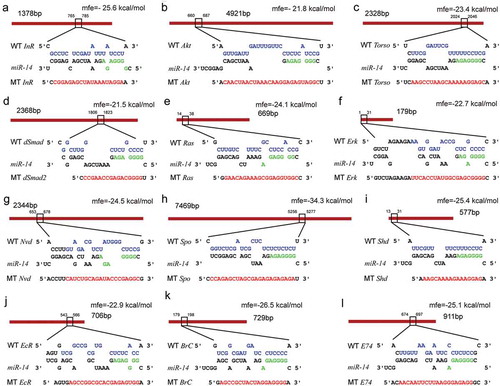
Figure 3. Non-dominate bmo-miR-14-5p targets multiple genes of the ecdysone-signalling network. Dual luciferase reporter assay of 12 predicted targets and Bmo-miR-14-5p in the ecdysone-signalling network. MT, mutants; WT, wild-type; NC, miRNA agomir of negative control. Data are shown as mean ± SEM (n = 6). Statistical significance of differences was assessed by one-way ANOVA followed by Tukey’s multiple comparison test. Different letters above the bars indicate significant differences (p < 0.05).
Two mature mirnas have dissimilar expression patterns
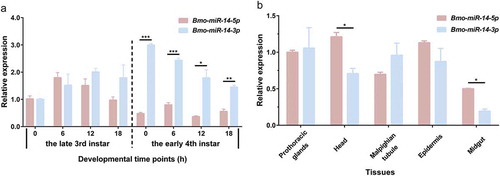
The homologs of Bmo-miR-14-5p are found only in D. melanogaster and Tribolium castaneum whereas homologs of miR-14-3p widely exist in almost all insects (miRBase 22.1) (Additional Figure S2). We did real time-quantitative PCR (qPCR) to study the expression profiles of these two mature miRNAs, showing that Bmo-miR-14-3p is more abundant than Bmo-miR-14-5p. Bmo-miR-14-5p is highly expressed at the end of each instar whereas Bmo-miR-14-3p is the most highly expressed at beginning of each instar (). These two mature miRNAs were constitutively expressed in various tissues (). Furthermore, the abundances of these two mature miRNAs were calculated based on small RNA sequencing data from the miRbase and BmncRNAdb. Consistent with qPCR results, only 18.5% and 36.09% reads were from Bmo-miR-14-5p in two databases, respectively (Additional Figure S3). However, the wide expressions of Bmo-miR-14-5p suggest this non-dominant mature miRNA should also have an essential role in silkworm.
Figure 4. Spatial–temporal expression profiles of the two miR-14 matures in silkworm. (a) Expression of Bmo-miR-14-5p and Bmo-miR-14-3p at the moulting stage. Larvae of 3rd instar and 4th instar at the time stop feeding and after ecdysis, were selected for the detection at 6-h interval, respectively. (b) Expression of Bmo-miR-14-5p and Bmo-miR-14-3p among tissues. Data represent mean ± SEM. All experiments were repeated in triplicates. * p < 0.05, ** p < 0.01, *** p < 0.001 assessed by using Student’s t test.
The expression of two mature miRNAs is negatively related to target genes
To study the expression relationship between Bmo-miR-14-5p and its target genes, we consecutively collected larvae from the first day of the 3rd instar larvae (3L1D) to the second day of pupae (P2) (a total of 18 time points). The results showed that the expression patterns of Bmo-miR-14-5p in the larval stage coincided with the time of moult at a fine-scale, which was one day ahead of the expression of Bmo-miR-14-3p ()). We further estimated the expression of these two mature miRNAs from 3L1D to 4L1D at 6-h intervals, showing that Bmo-miR-14-5p reached the peak at 6 h before ecdysis, and quickly decrease subsequently (Additional Figure S4).
Figure 5. Expression profile of bmo-miR-14-5p and nine confirmed target genes. (a) Expression of Bmo-miR-14-5p and Bmo-miR-14-3p from day 1 of 3rd instar larva (3L1D) to day 2 of pupa (P2). Expression profile of nine validated target genes including four regulatory genes (b), two Halloween genes associated with 20E biosynthesis (c), and three 20E response genes (d). Co-expression analysis showed that Bmo-miR-14-5p was significantly negatively correlated (r < −0.4) to BmShd and and BmEcR), but was moderately negatively correlated (−0.3 < r < −0.4) to BmAkt, BmTorso, BmE74 and BmBrC. Data were presented as mean ± SEM. Three to five individuals were used in each sample for qPCR and all experiments were repeated in triplicates. Expression differences for each gene among developmental times were compared to the expression of 3L1D in pairs. * p < 0.05, ** p < 0.01 assessed by using Student’s t test.
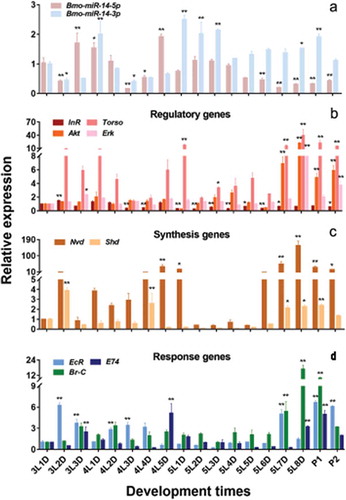
We also estimated the abundance of nine confirmed target genes in the ecdysone-signalling pathway (–)). Pearson correlation analysis showed that the correlation coefficients (r) between each pair of the three regulatory genes BmAkt, BmErk, and BmTorso were 0.903 (BmAkt vs BmErk), 0.717 (BmAkt vs BmTorso) and 0.707 (BmErk vs BmTorso), respectively (Student’s t test, p < 0.001). These genes had similar expression profiles: highly expressed on the last day before moulting but had a low expression at the preliminary stage in each instar. The biosynthetic enzyme genes BmNvd and BmShd had similar expression profiles with a correlation coefficient of 0.341 (Student’s t test, p = 0.012): both were highly expressed on the second to last day before moulting and then decreased sharply. The downstream ecdysone responding genes BmE74 and BmBr-C had a similar expression with a correlation coefficient of 0.462 (Student’s t test, p < 0.001). Among the nine targets, Bmo-miR-14-5p was significantly negatively correlated with BmShd (r = −0.469; Student’s t test, p < 0.001) and BmEcR (r = −0.414; Student’s t test, p = 0.002), but was slightly negatively correlated with BmAkt (r = −0.315; Student’s t test, p = 0.02), BmTorso (r = −0.306; Student’s t test, p = 0.027), BmE74 (r = −0.300; Student’s t test, p = 0.028) and BmBr-C (r = −0.280; Student’s t test, p = 0.04). However, Bmo-miR-14-3p was only negatively correlated with BmEcR (r = −0.322; Student’s t test, p = 0.018). These results show a possible negative regulation between Bmo-miR-14-5p and its target genes in the ecdysone-signalling pathway.
Co-localization of Bmo-miR-14-5p and some target genes in prothoracic gland
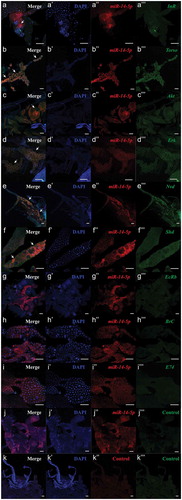
Since ecdysone is synthesized in the prothoracic gland (PG) in insects [Citation22–Citation24], we performed in situ analyses of Bmo-miR-14-5p and its target genes using miRNA/mRNA fluorescence in situ hybridization (FISH) in PG cells. Bmo-miR-14-5p was detected in PG cells, together with the regulatory genes BmInR, BmTorso, BmAkt, and BmErk (–)) and the biosynthetic enzymes BmNvd and BmShd (–)), suggesting Bmo-miR-14-5p interacts directly with the targets in PG cells. Whereas the ecdysone response genes, BmEcR, BmBr-C, and BmE74, were not detected (–)) because their functions were not in PG cells [Citation13,Citation25,Citation26].
Figure 6. Co-localization of bmo-miR-14-5p with the target genes in prothoracic glands. Nucleic probe combined with double fluorophore Cy3 (red) was used to detect the expression of the to bmo-miR-14-5p. While nucleic acid probe combined with double fluorophore FAM (green) was used to detect the target genes. Probes of a scrambled nucleotide sequence and the corresponding sense nucleotide sequence were used as the control for microRNA and the target genes, respectively. Signals of co-localization (yellow) for the miRNA and targets were indicated by white arrows (N = 6). DAPI (blue); scale bar (white) represents 100 μm. The images were visualized using an LSM 810 confocal fluorescence microscope (Zeiss).
Bmo-miR-14-5p controls the production of 20E
To test whether Bmo-miR-14-5p controls the production of 20E, we oversupplied Bmo-miR-14-5p with 1080 pmol agomir-14-5p on the second day in the 3rd instar larvae (3L2D) when Bmo-miR-14-5p had a low expression level (Additional Figure S4). Bmo-miR-14-5p was significantly increased by 11.36-fold at 24 h post-injection (Student’s t-test, p < 0.01) whereas Bmo-miR-14-3p was not affected (). Injection of agomir-14-5p downregulated the expression of all nine target genes (–)) and three targets, Torso, ErK, Br-C, were significantly decreased (Student’s t-test, p < 0.01).
Figure 7. Oversupply or inhibition of bmo-miR-14-5p significantly disturbed the protein accumulation of targets and titers of 20E. (a) Injection of agomir-14-5p significantly increased the abundance of miR-14-5p, whereas injection of antagomir-14-5p significantly decreased the abundance of miR-14-5p at 24 h post injection. The injection has no effect on the expression of miR-14-3p. (b-j) Expression of target genes after overexpression or inhibition of Bmo-miR-14-5p. (k) Injection of agomir-14-5p significantly reduced 20 titers at 24 h post injection whereas antagomir-14-5p treatment led to an increase of 20E titers at 24 h post injection. Data were represented as mean ± SEM with triplicates (n = 3) and analyzed by Student’s t tests. The statistically significant differences are indicated with asterisks. * p < 0.05, ** p < 0.01. (l) Western blotting for determination of the target protein levels. Abundance of proteins were examined by specific antibody against BmAKT, BmSHD, and BmE74 with β-actin as a loading control.
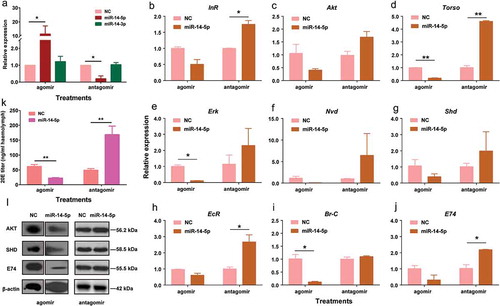
We also inhibited Bmo-miR-14-5p by injecting 1080 pmol antagomir-14-5p (the synthetic inhibitor of miR-14-5p) on the first day in the 3rd instar larvae (3L1D) when Bmo-miR-14-5p was highly expressed (Additional Figure S4). The abundance of Bmo-miR-14-5p was significantly decreased by 87.65% at 24 h post-injection of antagomir-14-5p (, Student’s t-test, p < 0.01). Antagomir-14-5p upregulated the expression of all nine target genes (-)), and four targets, InR, Torso, EcR, and E74, were significantly increased (Student’s t-test, p < 0.01).
The 20E titer in the agomir-14-5p treated group was 49.29 ± 5.26 ng/ml, significantly lower than 61.64 ± 6.36 ng/ml in agomir-NC (agomir negative control) (Student’s t-test, p < 0.05). In contrast, the 20E titer was increased to 168.91 ± 28.43 ng/ml in the antagomir-14-5p treated group (, Student’s t-test, p < 0.05). We successfully obtained the antibodies against three proteins, BmAKT, BmSHD, and BmE74. Whole body western blot indicated that the protein levels were significantly decreased in agomir-14-5p treated group and increased in antagomir-14 treated group ( and Additional Figure S5). It is likely that these three proteins were influenced by the changes of both miR-14-5p and 20E. Taken together, these results showed that Bmo-miR-14-5p controls the 20E production by simultaneously suppressing at least nine target genes in the ecdysone-signalling pathway.
Misexpression of Bmo-miR-14-5p impairs moult synchrony in the silkworm
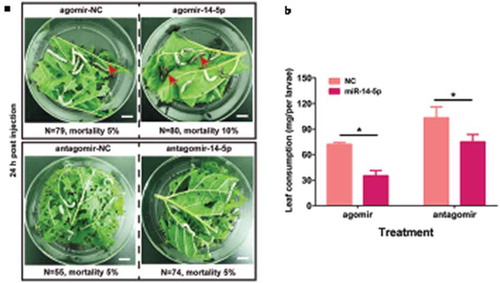
Having shown that Bmo-miR-14-5p controls 20E production, we next asked how the to fine-tune regulations of 20E titer modulate robust development procedures in the silkworm. To this end, we overexpressed Bmo-miR-14-5p with agomir-14 and knocked down it with antagomir-14, then the moulting processes were recorded by using an infrared camera in agomir-14 or antagomir-14 treated groups. The exact moulting time of all studied individuals was determined, and the cumulative moulting rates were calculated at 6-h intervals for each group. There was no statistic difference in mortality between the NC group (5%) and the agomir/antagomir treated group (10% and 5%, respectively). The videos showed that the treated larvae feed actively in the first two days post injection. After a short period of decreased feeding stage, the larvae enter intro pre-ecdysis stage with leg fixation and the newly formed cuticle [Citation27]. However, after oversupply of Bmo-miR-14-5p by agomir-14-5p, the treated larvae apparently fed on fewer mulberry leaves (, Student’s t test, p < 0.05). Only 42% larvae in the agomir-14-5p group showed a typical stop feeding behaviour of pre-ecdysis stage at 48 h post injection, whereas almost 92% of individuals in the agomir-NC group entered this stage (Additional Movie S1). Knocking down antagomir-14-5p induced a similar larval moulting delay. These results suggested that misexpression of Bmo-miR-14-5p impairs moulting synchrony in the silkworm.
Figure 8. Injection with agomir-14-5p or antagomir-14-5p was not lethal but induced significant delay of moulting. (a) The mortality of tested individuals at 24 h after injection of agomir-14-5p. Red arrows indicate the dead individuals. The mortality of tested individuals at 24 h after injection of antagomir-14-5p. Scale bar in white colour indicates 1 cm. N represents the independent animals in each group. (b) Injection of agomir-14-5p or antagomir-14-5p lead to a reduction of mulberry leaf consumption. Data were presented as mean ± SEM (n = 3). * p < 0.05 assessed by Student’s t test.
Bmo-miR-14-5p regulation of moult development is dose-dependent
Having shown that Bmo-miR-14-5p modulates moulting synchrony by controlling 20E production, we next asked whether this modulation is dose-dependent. To this end, we oversupplied Bmo-miR-14-5p by injecting different amounts of agomir-14-5p (135, 270, 540, and 1080 pmol) into 3L2D larvae. The results showed that all four treatments induced a delay of moulting to a varying degree with a dose-dependence (). To quantify the delay effect on the development timing, fitting curve line of the moulting time for each group was plotted (). A moderate amount of agomir-14-5p (270 pmol and 540 pmol) induced a significant delay of moulting (, Student’s t test, p < 0.01). Moreover, moulting times of both groups showed a mild variance (Levene’s test, p = 0.08), while injection of 1080 pmol agomir-14-5p induced a statistical difference of variation than the control group (Levene’s test, p = 0.003).
Figure 9. Oversupply and inhibition of Bmo-miR-14-5p delayed the moulting timing with an increased variation. (a) Cumulative molting rate of larvae injected with different amounts of agomir-14-5p. (b) Fitting curve for moulting rate distribution of larvae injected with different amounts of agomir-14-5p. (c) Moulting time point for larvae injected with different amounts of agomir-14-5p. (d) Cumulative moulting rate of larvae injected with agomir-14-3p. (e) Fitting curve for moulting rate distribution of larvae injected with agomir-14-5p. (f) Moulting time point for larvae injected with agomir-14-3p. (g) Cumulative moulting rate of larvae rescued with 20E when injected with agomir-14-5p. (h) Fitting curve for moulting rate distribution of larvae rescued with 20E when injected with agomir-14-5p. (i) Moulting time point for larvae rescued with 20E when injected with agomir-14-3p. (j) Cumulative moulting rate of larvae injected with antagomir-14-5p and antagomir-14-3p. (K) Fitting curve for moulting rate distribution of larvae injected with antagomir-14-5p and antagomir-14-3p. (l) Moulting time point for larvae injected with antagomir-14-5p and antagomir-14-3p. The least squares fit method was used for the nonlinear regression fitting with Gaussian distribution. Data represent mean ± SEM (N = 20). Variances of each group were assessed by Levene’s test and mean was assessed by Student’s t test or Mann–Whitney U test. * P < 0.05, ** P < 0.01, *** P < 0.001.
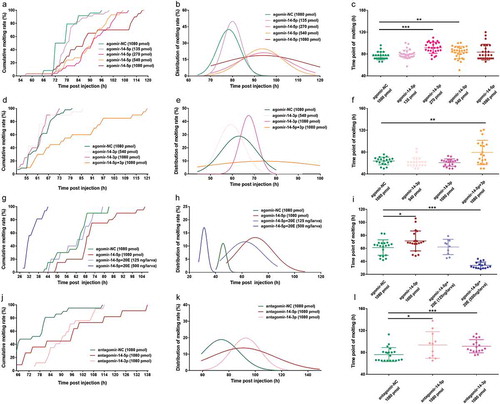
We next asked whether the change of Bmo-miR-14-3p abundance had a similar effect on the moulting timing. We injected two different amounts of agomir-14-3p (540 pmol and 1080 pmol) to 3L2D larvae. The results showed that the oversupply of Bmo-miR-14-3p had no or a limited effect on the moulting time (, Student’s t test, p > 0.05), including the moulting time variation (–), Levene’s test, p > 0.05). However, when both Bmo-miR-14-5p and Bmo-miR-14-3p were oversupplied simultaneously, a significant delay of moulting (Mann–Whitney U test, p < 0.05) and increasing of moulting time variation (Levene’s test, p < 0.001) were observed (). These results showed that Bmo-miR-14-5p has a more potent role in regulating insect moulting than Bmo-miR-14-3p though the former is less abundant.
To confirm that delayed moulting in the agomir-14-5p group was caused by the change of 20E titer, we performed rescue experiments with injecting two different amounts of 20E (125 or 500 ng 20E per larva). Application of 125 ng 20E (per larva) successfully rescued moulting delay (62.2 ± 3.71 h) to the agomir-NC level (61.3 ± 2.66 h) (, Student’s t-test, p = 0.837). Application of 500 ng 20E led to a significantly precocious moulting (34.0 ± 1.24 h) (Mann–Whitney U test, p < 0.001) with an extremely reduced moulting time variation (Levene’s test, p = 0.005) (–)). These results indicated that 20E titer should be maintained at a reasonable level.
We next knocked down Bmo-miR-14-5p using antagomir-14-5p in the 3L1D larvae immediately after ecdysis. The last individual to moult was at 138 h post injection in the antagomir-14-5p group, which was obviously later than that in the antagomir-NC group (114 h) (). The average moulting time in the antagomir-14-5p group (93.6 ± 7.30 h) significantly increased than that in the antagomir-NC group (76 ± 2.80 h) (Mann–Whitney U test, p < 0.05) with a greater moulting time variation (Levene’s test, p = 0.013) (–)). While the injection of antagomir-14-3p only led to a delay of moulting (Student’s t test, p = 0.001) but with no effect on moulting time variation (Levene’s test, p = 0.914) (–)). These results imply that knockdown of either Bmo-miR-14-5p or Bmo-miR-14-3p delayed the moulting, and the former had an additional effect on moulting time variation.
Discussion
The fast accumulation of ecdysone before ecdysis and the quick clearance of ecdysone after ecdysis are critical for robust development in insects [Citation28,Citation29]. Here we showed that Bmo-miR-14 regulation of nine target genes in the ecdysone-signalling pathway ensures the hormone 20E to be maintained at a reasonable titer at corresponding development stages. Bmo-miR-14 and its target genes form an incoherent regulation that suppress unwanted transcripts after the larval transition, acting as a buffer to avoid major fluctuations in the 20E titer. The expression of Bmo-miR-14-5p is low before the peak of ecdysone accumulation and dramatically increased after this peak (). In the rescue experiments, the higher titer of 20E led to a lower level of moulting time variation, indicating that regulation of Bmo-miR-14-5p was dose-dependent.
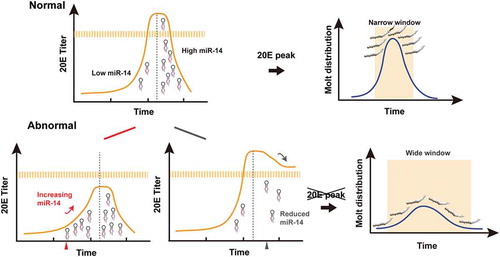
Figure 10. The model for Bmo-miR-14 confers developmental timing. Bmo-miR-14 acts as a canalizing gene to buffer the fluctuation of 20E levels, ensuring reasonable developmental synchrony within a narrowed molting time. To initiate the molting process, 20E is rapidly accumulated to reach a peak. Prior to the moult, Bmo-miR-14-5p must be kept at a very low level. However, once the moulting process is completed, 20E must be cleared quickly to ensure robust development. Then, a rapid increase in the abundance of Bmo-miR-14-5p is needed to stop the production of unwanted transcripts at this stage. The high abundance of miR-14 at the post-ecdysis stage is essential. Either oversupply of Bmo-miR-14-5p at the pre-ecdysis stage or inhibition of Bmo-miR-14-5p at the post-ecdysis stage will disrupt the 20E peak, and lead to a wide variance of moulting timing during development.
A recent report showed that complete loss of Bmo-miR-14 locus led to a precocious wandering stage whereas ubiquitous overexpression of Bmo-miR-14 led to delayed larval development [Citation21]. However, that work mainly focused on Bmo-miR-14-3p regarding miRNA expression and target prediction, and the overexpression and disruption of Bmo-miR-14 occur at the pre-miRNA level. Abundance of both the two mature miRNAs was probably changed after genome editing. Here, using the chemically modified oligonucleotides miRNA agomir and antagomir, we successfully changed the expression of both Bmo-miR-14-5p and Bmo-miR-14-3p. It showed that Bmo-miR-14-5p has a more potent role in regulating moult development. Most miRNAs were discovered to have a notable strand bias between the two matures with a potential of functional implications [Citation30,Citation31]. Though Bmo-miR-14-5p is less abundant, it simultaneously targets nine genes in the ecdysone-signalling pathway, which should improve its regulation ability by inhibiting these target genes together than any one gene alone [Citation32].
It has been widely known that miRNA normally acts as buffer to modulate mRNA function with a moderate efficiency. Most previous studies reported a simple mode of ‘one miRNA, one target’ in the regulation of insect development [Citation33–Citation35]. We recently reported that ‘multiple miRNA, multiple targets’ forms a complex network to regulate insect metamorphosis in the rice stem borer Chilo suppressalis and D. melanogaster [Citation36]. Here, we presented a fine-tuned regulation system where the precursor of Bmo-miR-14 encodes two mature miRNAs and these two mature miRNAs jointly suppress many genes in the ecdysone-signalling pathway; Bmo-miR-14-5p targets nine genes and Bmo-miR-14-3p targets two genes. This system of ‘one pre-miRNA, two mature miRNAs, multiple targets’ in the same pathway significantly improve the regulation capacity of a single pre-miRNA. This interesting finding incurs us to re-conceptualize miRNA functions and may re-explain the subtle effects of miRNA depletion [Citation37]. We also used other two miRNA target prediction tools including PITA [Citation38] and TargetScan [Citation39] to predict targets, finding that several additional miRNAs (mostly non-conserved miRNAs, i.e. Bmo-miR-6497, Bmo-miR-2778 and Bmo-miR-993) can also target the ecdysone-signalling pathway (Additional Table S1). This suggests that more miRNAs might be involved in the regulation of ecdysone clearance after ecdysis.
The discovery of miRNAs has shed light on the mechanism of development synchrony [Citation40,Citation41]. Several miRNAs have been reported to confer developmental synchrony. For example, Lmi-miR-276 enhances the expression of brm to promote egg-hatching synchrony in locusts [Citation28]. Another example is five miRNAs that canalize the pathway of E[spl]-C and Brd-C to control the scutellar bristle number in fruit flies, suggesting buffer roles of miRNA regulation [Citation42,Citation43]. Here we present evidence that miR-14 confers development synchrony in the silkworm. It is interesting that both inhibition of Bmo-miR-14 or overexpression of Bmo-miR-14 impair development synchrony. It is because we misexpressed Bmo-miR-14 at different timepoint. We overexpressed Bmo-miR-14 to prevent the 20E accumulation to reach a threshold to initiate ecdysis, whereas we inhibit Bmo-miR-14 to prevent the 20E clearance which maintains 20E at an abnormal high level after ecdysis. These results, taken together, showed that the misexpression of Bmo-miR-14 leads to abnormal fluctuation of 20E titers and thus impairs moult development synchrony (). In conclusion, we reported that one miRNA produces two mature miRNAs which target on multiple genes in the ecdysone-signalling pathway, suppressing ecdysone production after ecdysis and ensuring development synchrony and robust in silkworm.
Materials and methods
Insects
The silkworm, B. mori strain P50 (Dazao), was reared on fresh mulberry leaves at 27 ± 1°C under a photoperiod of 16 hour/8 hour (light/dark) with a relative humidity of 70–80%.
Mirna target prediction
We used the ipathCons algorithm to integrate a comprehensive ecdysone-signalling network, including the pathway of 20E biosynthesis, the upstream regulatory pathways, and the downstream response genes [Citation44]. mRNA sequences of all 15 genes in the ecdysone-signalling pathway of silkworm were obtained from InsectBase [Citation45]. To obtain the full-length 3ʹ UTRs of genes in the ecdysone-signalling network, we performed rapid amplification of cDNA ends (RACE) using a SMARTerTM RACE cDNA Amplification kit (Clontech, Mountain View, CA, USA). The RACE-PCRs were designed according to the user manual. Gene-specific primers and nested gene-specific primers are shown in Additional Table S2. The NCBI accession numbers of genes for target prediction are listed in Additional Table S3. For target prediction, two miRNA target prediction programs, miRanda [Citation46] and RNAhybrid 2.0 [Citation47], were used with default parameters. The cut-off for the restricted free energy was set as −20 kJ/mol.
Mirna-14 family analysis
The mature miR-14 sequences in 12 insects (Apis mellifera, Nasonia vitripennis, D. melanogaster, Anopheles gambiae, Culex quinquefasciatus, Aedes aegypti, Heliconius melpomene, Manduca sexta, B. mori, Tribolium castaneum, Acyrthosiphon pisum, and Plutella xylostella) were obtained from miRBase (22.1) [Citation48], and mature sequences in the other 5 species, N. lugens, Laodelphax striatellus, C. suppressalis, Scirpophaga incertula and Spodoptera exigua, were retrieved from previous reports [Citation36,Citation49–Citation51]. The mature sequences of miRNAs were aligned using GeneDoc 2.7 (https://genedoc.software.informer.com).
Dual luciferase assay
Genomic DNA of B. mori was extracted with DNAiso Reagent (Takara Bio, Shiga, Japan) following the manufacturer’s instructions. The 3ʹ UTR fragments containing the predicted miR-14 target sites were cloned into the pMIR-REPORT™ vector (Obio, Shanghai, China) using the Mlu I and Hind III sites with primers in Additional Table S2. To introduce mutations in the miRNA binding sites, a fragment amplified by forward and reverse primers with mutated sites complementary to the target sites was homologously recombined to pMIR-REPORT™ vector using the CloneEZ™ Kit (Genescript, Nanjing, China). The pRL-CMV vector (Promega, Madison, WI, USA) was used as a Renilla luciferase control reporter vector. HEK293T cells were co-transfected with 0.2 μg of the luciferase reporter vector and 0.01 μg empty vector or mutant vector and agomir-14 at a 1:1 ratio using Lipofectamine™ 2000 reagent (Invitrogen, Carlsbad, CA, USA) according to the manufacturer’s instructions. Activities of the firefly and Renilla luciferases were measured 48 h after transfection using the Dual-Glo Luciferase Assay System (Promega) with Infinite M1000 (Tecan, Männedorf, Switzerland). Data are represented as the ratio of Renilla to firefly luciferase activity with six independent replicates after normalization.
Real time quantitative PCR (qPCR)
Whole bodies or dissected tissues of two larval individuals were harvested as a biological replicate and flash frozen with liquid nitrogen. Total RNA was extracted using TRIzol Reagent (Invitrogen, Carlsbad, CA) following the manufacturer’s protocol. For qPCR, PrimeScript™ RT reagent kit with gDNA Eraser (Takara Bio, Shiga, Japan) was used to prepare the Oligo (dT)-primed cDNA. mRNA qPCR primers were designed using Integrated DNA Technologies (http://www.idtdna.com/Primerquest/Home/Index). QPCR reactions were performed using SYBR Premix Ex Taq™ (Tli RNaseH Plus, Takara Bio) according to the manufacturer’s instructions. To measure miRNA by qPCR, a miScript II RT kit (QIAGEN, Hilden, Germany) was used to prepare universal cDNA templates, and specific primers (bmo-miR-14-5p, ID: 174,665,519) were customized with miScript Primer Assays (QIAGEN). QPCRs were performed using a miRNA SYBR Green PCR kit (QIAGEN) for gene expression assays. Fluorescence signals were analyzed using a PRISM ABI 7300 instrument (Applied Biosystems, Foster City, CA, USA). The program for qPCR was as follows: 95°C for 30 s at the initial action step, 40 cycles at 95°C for 5 s, and 60°C for 34 s. The program for miRNA qPCR was 95°C for 15 min at the initial action step, 40 cycles at 95°C for 15 s, 55°C for 30 s, and 70°C for 34 s. Data were analyzed using the 2−ΔΔCt method of relative quantification [Citation52]. As endogenous controls, ribosomal protein gene RP49 and 5s rRNA were used to quantify the mRNA and miRNA expression levels, respectively. Dissociation curves were determined for each miRNA and mRNA target analyzed to confirm unique amplification. The qPCR primers used in this analysis are listed in Additional Table S2. Each treatment was conducted with three biological replicates, and significant differences were evaluated using Student’s t-tests in SPSS 22.0 (IBM, Armonk, NY, USA).
Co-localization of miRNA and targets by fluorescence in situ hybridization (FISH)
For co-localization of miRNA and targets, antisense RNA detection probes for Bmo-miR-14-5p and target genes were designed and labelled with double fluorophore Cy3 and FAM, respectively, at Gefan Biotechnology Company (Shanghai, China). A scrambled sequence and the sense probe for target genes were used as the negative control. Silkworm larvae at the 3rd instar were dissected in cold PBS buffer and prothoracic glands were fixed in 4% paraformaldehyde for 2 h, and then incubated for hybridization with the detection probes at 37°C for 24 h according to standard procedures [Citation53,Citation54]. The samples were washed in PBS with 5% Triton X-100 (v/v) and stained with DAPI (Sigma-Aldrich, St. Louis, MO, USA) at room temperature for 30 min. Signals of the miRNA and its target were detected using an LSM 810 confocal fluorescence microscope (Carl Zeiss SAS, Germany). The probes of miRNA and target genes are listed in Additional Table S2.
Treatment with agomir, antagomir, and 20E
Agomir is a chemically synthetic, cholesterol-conjugated double-stranded miRNA mimics with modification of 2ʹ-methoxy groups and phosphonothioates, and antagomir is a synthetic, single-stranded RNA analogue complementary to miRNAs with the same modifications [Citation55,Citation56]. Both micrONTM miRNA agomir-14-5p and micrOFFTM antagomir-14-5p were synthesized by RiBoBio company (Guangzhou, China). For oversupply of miRNAs, larvae in day 2 of the 3rd instar (3L2D) were used because of a low transcript level of bmo-miR-14-5p assessed by qPCR at this growth stage. One μl of a gradient concentration of agomir-14-5p diluted from a stock solution (1080 pM) was injected into the larvae using a Nano-injector (WPI, Sarasota, FL). Agomir of a randomly shuffled sequence was used as the negative control. For the miRNA knockdown, larvae in day 1 of the 3rd instar (3L1D) were injected with antagomir-14-5p because of a relatively high transcript level at this time point. For the rescue experiment, 125 ng or 500 ng of 20-hydroxyecdysone (Aladdin Industrial Corporation, Shanghai, China) dissolved in 1 µl ethanol was injected into at the larva 24 h post injection. Ethanol without 20E was injected as a control. About 20 individuals were used for each treatment, and all experiments were carried out three times independently. Phenotypic observation of the treated larvae throughout the moulting process was done using a camera (HDR-XR550, SONY, Japan). The expression of target genes was measured at 24 h post injection.
Western blotting
Silkworm whole body was lysed in Tris-saturated phenol and the cell lysates were centrifuged at 15,000 × g for 10 min at 4°C, after which the supernatant was collected. Total proteins were quantified using the Pierce BCA protein assay kit (Thermo Fisher, Rockford, IL, USA), separated by 10% SDS-PAGE, and transferred to a nitrocellulose membrane (GE Healthcare, Amersham, UK). The membrane was incubated with a polypeptide antibody produced by Abmart (Shanghai, China) against BmAKT, BmSHD, and BmE74 overnight at 4°C and then the protein was detected using horseradish peroxidase-conjugated anti-mouse IgG (1:5000 dilution; Abmart) as the secondary antibody. The bands were visualized using an ECL kit (Merck Millipore, Burlington, MA, USA). Rabbit anti-β-actin was used as the primary antibody for normalization. To quantify the protein amount in each band of the films, densitometry was conducted with ImageJ 1.50i (https://imagej.nih.gov/ij/).
20E titer measurement
Hemolymph biological samples were prepared as described previously [Citation57,Citation58]. Briefly, silkworm larvae were collected consecutively at 6-h intervals. Hemolymph (100 μl) was sampled with 30% (w/v) phenylthiourea (PTU) and stored at −80° C . Nine volumes of methanol were added into the sample to extract 20-hydroxyecdysone (20E). After centrifugation at 10,000 × g for 10 min, the supernatant was evaporated and diluted with 20 μl EIA buffer for measurement. A 20-hydroxyecdysone EIA Kit (Cayman Chemical, Ann Arbor, MI, USA) was used to determine the 20E titer according to the manufacturer’s instructions. A standard curve of 20E obtained by a 4-parameter logistic curve-fitting was used to determine the concentration of each sample in duplicate.
Statistical analysis
All data are shown as the mean ± standard error (n ≥ 3). n indicates the biological replicates and N represents the independent animals. For all data, when two groups were compared, significance was assessed using Student’s t test or Mann–Whitney U test if there are no equal variances detected by Levene’s test (p < 0.05). When more than two groups were compared, one-way ANOVA was used to assess the significance of Tukey’s multiple comparison test using SPSS v22.0 software (SPSS).
Author’s contributions
FL designed the work. KH and HX performed the bioinformatics analysis of miRNA identification, conservation analysis and target predictions. KH, HX and YS carried out the experiments of miRNA target validation, oversupply and knockdown experiments. YX and KH determined the titers of ecdysone. GS and YX conducted the experiments for gene expression. KH completed and improved the figures. FL and KH wrote the manuscript.
Availability of data and materials
3’UTR sequences for target prediction obtained by 3ʹRACE has been deposited in the NCBI database. All the accession number of mRNA sequences has been made available in additional Table S3.
Supplemental Material
Download Zip (10.1 MB)Acknowledgments
We would like to thank Professor Muwang Li in Jiangsu University of Science and Technology for providing us the silkworms.
Disclosure statement
No potential conflict of interest was reported by the authors.
Supplementary material
The supplemental data for this article can be accessed here.
Additional information
Funding
Related Research Data
References
- Rewitz KF, Rybczynski R, Warren JT, et al. The Halloween genes code for cytochrome P450 enzymes mediating synthesis of the insect moulting hormone. Biochem Soc Trans. 2006;34:1256–1260.
- Niwa R, Niwa YS. Enzymes for ecdysteroid biosynthesis: their biological functions in insects and beyond. Biosci Biotech Bioch. 2014;78:1283–1292.
- Rewitz KF, Yamanaka N, Gilbert LI, et al. The insect neuropeptide PTTH activates receptor tyrosine kinase Torso to initiate metamorphosis. Science. 2009;326:1403–1405.
- Garofalo RS. Genetic analysis of insulin signaling in Drosophila. Trends Endocrinol Metab. 2002;13:156–162.
- Gibbens YY, Warren JT, Gilbert LI, et al. Neuroendocrine regulation of Drosophila metamorphosis requires TGFβ/Activin signaling. Development. 2011;138:2693–2703.
- Niwa YS, Niwa R. Transcriptional regulation of insect steroid hormone biosynthesis and its role in controlling timing of molting and metamorphosis. Dev Growth Differ. 2016;58:94–105.
- Yamanaka N, Rewitz KF, O’Connor MB. Ecdysone control of developmental transitions: lessons from drosophila research. Annu Rev Entomol. 2013;58 MR Bed. 497–516.
- Truman JW, Riddiford LM. Endocrine insights into the evolution of metamorphosis in insects. Annu Rev Entomol. 2002;47:467–500.
- Guittard E, Blais C, Maria A, et al. CYP18A1, a key enzyme of Drosophila steroid hormone inactivation, is essential for metamorphosis. Dev Biol. 2011;349:35–45.
- Hock T, Cottrill T, Keegan J, et al. The E23 early gene of Drosophila encodes an ecdysone-inducible ATP-binding cassette transporter capable of repressing ecdysone-mediated gene activation. Proc Natl Acad Sci USA. 2000;97:9519–9524.
- Belles X. MicroRNAs and the evolution of insect metamorphosis. Annu Rev Entomol. 2017;62:111–125.
- Ling L, Ge X, Li Z, et al. MicroRNA Let-7 regulates molting and metamorphosis in the silkworm, Bombyx mori. Insect Biochem Mol Biol. 2014;53:13–21.
- Jiang J, Ge X, Li Z, et al. MicroRNA-281 regulates the expression of ecdysone receptor (EcR) isoform B in the silkworm, Bombyx mori. Insect Biochem Mol Biol. 2013;43:692–700.
- Sempere LF, Sokol NS, Dubrovsky EB, et al. Temporal regulation of microRNA expression in Drosophila melanogaster mediated by hormonal signals and broad-Complex gene activity. Dev Biol. 2003;259:9–18.
- Varghese J, Cohen SM. microRNA miR-14 acts to modulate a positive autoregulatory loop controlling steroid hormone signaling in Drosophila. Genes Dev. 2007;21:2277–2282.
- Lozano J, Montanez R, Belles X. MiR-2 family regulates insect metamorphosis by controlling the juvenile hormone signaling pathway. Proc Natl Acad Sci U S A. 2015;112:3740–3745.
- Gomez-Orte E, Belles X. MicroRNA-dependent metamorphosis in hemimetabolan insects. Proc Natl Acad Sci U S A. 2009;106:21678–21682.
- Wang Y, Yang M, Jiang F, et al. MicroRNA-dependent development revealed by RNA interference-mediated gene silencing of LmDicer1 in the migratory locust. Insect Sci. 2012;20:53–60.
- Yang M, Wei Y, Jiang F, et al. MicroRNA-133 inhibits behavioral aggregation by controlling dopamine synthesis in locusts. PLoS Genet. 2014;10:e1004206.
- Chen J, Liang Z, Liang Y, et al. Conserved microRNAs miR-8-5p and miR-2a-3p modulate chitin biosynthesis in response to 20-hydroxyecdysone signaling in the brown planthopper, Nilaparvata lugens. Insect Biochem Mol Biol. 2013;43:839–848.
- Liu Z, Ling L, Xu J, et al. MicroRNA-14 regulates larval development time in Bombyx mori. Insect Biochem Mol Biol. 2018;93:57–65.
- Gilbert LI, Song Q, Rybczynski R. Control of ecdysteroidogenesis: activation and inhibition of prothoracic gland activity. Invert Neurosci. 1997;3:205–216.
- Gilbert LI, Rybczynski R, Warren JT. Control and biochemical nature of the ecdysteroidogenic pathway. Annu Rev Entomol. 2002;47:883–916.
- Gilbert LI, Warren JT. A molecular genetic approach to the biosynthesis of the insect steroid molting hormone. Insect Hormones. 2005;73:31–57.
- Sekimoto T, Iwami M, Sakurai S. 20-hydroxyecdysone regulation of two isoforms of the Ets transcription factor E74 gene in programmed cell death in the silkworm anterior silk gland. Insect Mol Biol. 2007;16:581–590.
- Ijiro T, Urakawa H, Yasukochi Y, et al. cDNA cloning, gene structure, and expression of Broad-Complex (BR-C) genes in the silkworm, Bombyx mori. Insect Biochem Mol Biol. 2004;34:963–969.
- Kiguchi K, Agui N. Ecdysteroid levels and developmental events during larval molting in the silkworm, Bombyx mori. J Insect Physiol. 1981;27:805–812.
- He J, Chen Q, Wei Y, et al. MicroRNA-276 promotes egg-hatching synchrony by up-regulating brm in locusts. Proc Natl Acad Sci U S A. 2016;113:584–589.
- Norris MJ, Richardss OW. Accelerating and inhibiting effects of crowding on sexual maturation in two species of locusts. Nature. 1964;203:784–785.
- Cai Y, Yu X, Zhou Q, et al. Novel microRNAs in silkworm (Bombyx mori). Funct Integr Genomics. 2010;10:405–415.
- Okamura K, Phillips MD, Tyler DM, et al. The regulatory activity of microRNA star species has substantial influence on microRNA and 3 ‘ UTR evolution. Nat Struct Mol Biol. 2008;15:354–363.
- Bracken CP, Scott HS, Goodall GJ. A network-biology perspective of microRNA function and dysfunction in cancer. Nat Rev Genet. 2016;17:719–732.
- Cheng CY, Hwang CI, Corney DC, et al. miR-34 cooperates with p53 in suppression of prostate cancer by joint regulation of stem cell compartment. Cell Rep. 2014;6:1000–1007.
- Concepcion CP, Han YC, Mu P, et al. Intact p53-dependent responses in miR-34-deficient mice. PLoS Genet. 2012;8:e1002797.
- Hwang CI, Matoso A, Corney DC, et al. Wild-type p53 controls cell motility and invasion by dual regulation of MET expression. Proc Natl Acad Sci U S A. 2011;108:14240–14245.
- He K, Sun Y, Xiao H, et al. Multiple miRNAs jointly regulate the biosynthesis of ecdysteroid in the holometabolous insects, Chilo suppressalis. RNA. 2017;23:1817–1833.
- Vidigal JA, Ventura A. The biological functions of miRNAs: lessons from in vivo studies. Trends Cell Biol. 2015;25:137–147.
- Kertesz M, Iovino N, Unnerstall U, et al. The role of site accessibility in microRNA target recognition. Nat Genet. 2007;39:1278–1284.
- Agarwal V, Bell GW, Nam JW, et al. Predicting effective microRNA target sites in mammalian mRNAs. Elife. 2015;4:e05005.
- Hornstein E, Shomron N. Canalization of development by microRNAs. Nat Genet. 2006;38:20–24.
- Posadas DM, Carthew RW. MicroRNAs and their roles in developmental canalization. Curr Opin Genet Dev. 2014;27:1–6.
- Lai EC, Tam B, Rubin GM. Pervasive regulation of Drosophila Notch target genes by GY-box-, Brd-box-, and K-box-class microRNAs. Genes Dev. 2005;19:1067–1080.
- Meir E, von Dassow G, Munro E, et al. Robustness, flexibility, and the role of lateral inhibition in the neurogenic network. Curr Biol. 2002;12:778–786.
- Zhang Z, Yin C, Liu Y, et al. iPathCons and iPathDB: an improved insect pathway construction tool and the database. Database (Oxford). 2014; 2014:bau105.
- Yin C, Shen G, Guo D, et al. InsectBase: a resource for insect genomes and transcriptomes. Nucleic Acids Res. 2016;44:801–807.
- Enright AJ, John B, Gaul U, et al. MicroRNA targets in Drosophila. Genome Biol. 2003;5:R1.
- Kruger J, Rehmsmeier M. RNAhybrid: microRNA target prediction easy, fast and flexible. Nucleic Acids Res. 2006;34:451–454.
- Kozomara A, Griffiths-Jones S. miRBase: annotating high confidence microRNAs using deep sequencing data. Nucleic Acids Res. 2014;42:68- 73.
- Xu HJ, Chen T, Ma XF, et al. Genome-wide screening for components of small interfering RNA (siRNA) and micro-RNA (miRNA) pathways in the brown planthopper, Nilaparvata lugens (Hemiptera: delphacidae). Insect Mol Biol. 2013;22:635–647.
- Zhang YL, Huang QX, Yin GH, et al. Identification of microRNAs by small RNA deep sequencing for synthetic microRNA mimics to control Spodoptera exigua. Gene. 2015;557:215–221.
- He K, Xiao H, Sun Y, et al. Transgenic microRNA-14 rice shows high resistance to rice stem borer. Plant Biotechnol J. 2019;17:461–471.
- Livak KJ, Schmittgen TD. Analysis of relative gene expression data using real-time quantitative PCR and the 2(T)(-Delta Delta C) method. Methods. 2001;25:402–408.
- Yang M, Wang Y, Jiang F, et al. miR-71 and miR-263 jointly regulate target genes Chitin synthase and chitinase to control locust molting. PLoS Genet. 2016;12:e1006257.
- Nuovo GJ, Elton TS, Nana-Sinkam P, et al. A methodology for the combined in situ analyses of the precursor and mature forms of microRNAs and correlation with their putative targets. Nat Protoc. 2009;4:107–115.
- Krutzfeldt J, Rajewsky N, Braich R, et al. Silencing of microRNAs in vivo with ‘antagomirs’. Nature. 2005;438:685–689.
- Stenvang J, Petri A, Lindow M, et al. Inhibition of microRNA function by antimiR oligonucleotides. Silence. 2012;3:1–17.
- Liu S, Li K, Gao Y, et al. Antagonistic actions of juvenile hormone and 20-hydroxyecdysone within the ring gland determine developmental transitions in Drosophila. Proc Natl Acad Sci U S A. 2018;115:139–144.
- Satake S, Kaya M, Sakurai S. Hemolymph ecdysteroid titer and ecdysteroid-dependent developmental events in the last-larval stadium of the silkworm, Bombyx mori: role of low ecdysteroid titer in larval-pupal metamorphosis and a reappraisal of the head critical period. J Insect Physiol. 1998;44:867–881.