
ABSTRACT
Splicing-affecting mutations can disrupt gene function by altering the transcript assembly. To ascertain splicing dysregulation principles, we modified a minigene assay for the parallel high-throughput evaluation of different mutations by next-generation sequencing. In our model system, all exonic and six intronic positions of the SMN1 gene’s exon 7 were mutated to all possible nucleotide variants, which amounted to 180 unique single-nucleotide mutants and 470 double mutants. The mutations resulted in a wide range of splicing aberrations. Exonic splicing-affecting mutations resulted either in substantial exon skipping, supposedly driven by predicted exonic splicing silencer or cryptic donor splice site (5′ss) and de novo 5′ss strengthening and use. On the other hand, a single disruption of exonic splicing enhancer was not sufficient to cause major exon skipping, suggesting these elements can be substituted during exon recognition. While disrupting the acceptor splice site led only to exon skipping, some 5′ss mutations potentiated the use of three different cryptic 5′ss. Generally, single mutations supporting cryptic 5′ss use displayed better pre-mRNA/U1 snRNA duplex stability and increased splicing regulatory element strength across the original 5′ss. Analyzing double mutants supported the predominating splicing regulatory elements’ effect, but U1 snRNA binding could contribute to the global balance of splicing isoforms. Based on these findings, we suggest that creating a new splicing enhancer across the mutated 5′ss can be one of the main factors driving cryptic 5′ss use.
Introduction
RNA splicing is an essential mRNA processing step, producing one or more transcript isoforms, and is tightly regulated to guarantee correct protein expression. Specific RNA sequence motifs, especially donor and acceptor splice sites (5′ss and 3′ss, respectively) and branch point, are required for correct exon recognition and subsequent spliceosome assembly. Recognizing an exon is modulated by cis-acting splicing regulatory elements (SREs). These elements are classified as exonic (ESEs) or intronic (ISEs) splicing enhancers and exonic (ESSs) or intronic (ISSs) splicing silencers. These sequences recruit diverse splicing factors that modify exon recognition and spliceosome assembly [Citation1].
In silico evaluation of the mutations’ effect in SREs is a challenge. Despite an obvious improvement in many algorithms, their real use for predicting mutation impact on RNA splicing efficiency is limited because of exon recognition complexity or a higher degeneracy of the splicing factors’ binding sequences [Citation2–Citation5]. The algorithms are thus dependent on extensive datasets [Citation6–Citation8] including those based on experimental work. Expanding the possibilities of high-throughput technologies can thus contribute to improving these algorithms. Moreover, both direct and non-direct proof of mutations’ impact on RNA splicing can also be helpful for clinical geneticists.
Exon recognition itself is dependent on 5′ss interaction with U1 snRNA [Citation9,Citation10], which is typically mediated by Watson-Crick (WC) base-pairing. Vertebrate 5′ss display a relatively high 5′ss sequence diversity. While consensus sequence CAG/GTAAGT can form WC base-pairs, other 5′ss U1 snRNA duplexes contain mismatched base pairs and the 5′ss selection is related to the thermodynamic stability of these duplexes [Citation11]. Alternatively, the duplex formation can occur in shifted or bulged register [Citation12–Citation14]. Later in the splicing process, U1 snRNP must be replaced by U4/U6-U5 tri-snRNP, which exactly defines the cleavage site. However, a U4/U6-U5 tri-snRNP binding site does not need to overlap the U1 binding site [Citation15,Citation16], which enables the use of a relatively weak 5′ss.
To better understand the principles of exon recognition, we chose SMN1 exon 7 as a model system and performed a systematic analysis of all possible exonic and six intronic variants using next-generation sequencing (NGS) technology. Inactivating mutations in the SMN1 lead to spinal muscular atrophy (SMA) development and, among others, truncation of the last 16 amino acids caused by exon 7 skipping, inactivating the protein [Citation17]. Thus, even the mutations that do not influence the amino acid composition, such as e-3C>T, can result in disease outbreak [Citation18]. Promisingly, the impact of abnormal splicing patterns causing mutations can be rescued by exogenous intervention inducing cryptic 5′ss usage and thereby maintaining exon 7 inclusion [Citation19].
SMN1 exon 7 inclusion itself is regulated by a set of SREs. Among the first detected variants included in exon 7 recognition was a nucleotide exchange C/T in the sixth exonic position, which is a natural polymorphism differentiating SMN1 from SMN2, a paralogous gene with decreased exon 7 inclusion [Citation20]. The SMN2 variant induces exon skipping (ES) through hnRNP A1/A2 binding sequence creation [Citation21], although it seems that the SMN1 variant can bind splicing enhancer SRSF1 [Citation22]. The middle part of SMN1 consists of an A/G rich region binding hTra2β1 [Citation23–Citation25], PSF [Citation26] and indirectly SRp30c [Citation25], hnRNP-G [Citation27] or TDP-43 [Citation28]. At the 3′ end of SMN1 exon 7, the RNA sequence can form a terminal stem-loop structure, stabilization of which promotes ES [Citation29]. Other important elements are located in introns 6 and 7. Miyajima et al. [Citation30] identified a cis-element within intron 6, whose deletion led to increased exon inclusion. Similarly, SMN1 intron seven contains additional elements promoting/repressing exon 7 inclusion. Thus, TIA1/TIAL1 binding to U-rich elements located downstream of authentic exon 7 5′ss supports exon 7 inclusion [Citation31], while hnRNPA1/A2 binding to intronic motif ISS-N1 represses it [Citation32].
In this work, we applied a high-throughput approach to elucidate the impact of all possible single nucleotide mutations on SMN1 exon 7 splicing in the artificial context of the surrounding exons in the minigene. This approach revealed different mutations’ diverse effect in the 5′ss region on ES and the use of cryptic 5′ss. To explain such a wide variety between different mutations, we tested two hypotheses. First, we hypothesized that U1 snRNP preserved the ability to bind mutated 5′ss and helped to recognize distant cryptic 5′ss due to a shifted U1 snRNP binding mechanism. The second hypothesis assumed that a mutation in 5′ss resulted in a new ESE creation, subsequently supporting the U1 snRNP binding to an extremely weak 5′ss.
Results
Design and properties of mutagenesis library
To systematically map splicing affecting mutations in SMN1 exon 7, a three-exonic minigene with the middle SMN1 exon 7 was prepared and subsequently mutated in the whole coding region and neighbouring three intronic nucleotides. To enable the exact coupling of detected splicing isoform with the corresponding causal mutation, first exon was barcoded with 14-nt barcode sequence (; Supplementary Figure S1).
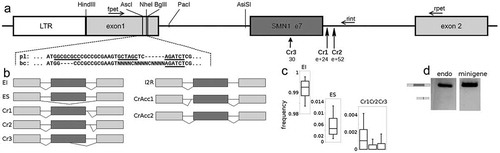
Figure 1. SMN1 exon 7 in the experimental system. (A) Scheme of minigene containing exon 7 of the SMN1 gene. Boxes represent exons, lines introns. Part of the first exon is shown as a nucleotide sequence, where pl corresponds to exonic sequence before barcoding and bc after barcoding. Underlined nucleotides represent restriction sites used during plasmid library construction. BglII and Hind III restriction sites are used for exon 1 replacement. During this procedure, original exon 1 is replaced with the barcoded one and NheI and AscI restriction sites are lost, which can be used to control successful barcoding. Arrows represent primers used for amplification preceding NGS. Primers fpet and rint are designed for mutant characterization (after preceding intron excision by PacI and AsiSI) and primers fpet and rpet for splicing analysis. Cryptic 5′ss are depicted including their positions. (B) Schematic representation of detected transcripts. (C) Frequency of particular transcript isoforms in wt minigenes detected using NGS. A frequency is depicted as a bar-plot, where boxes correspond to quartiles and whiskers to 0.1 and 0.9 percentiles, respectively. (D) Wt transcript profiling using agarose electrophoresis for endogenous SMN1 and a minigene. SMN1 exon 7 skipping is visible only as a very blurred band
The final plasmid library consisted of about 3,800 differently barcoded minigene variants sufficiently expressed in transfected HeLa cells (Supplementary Figure S1). About 1,660 plasmids represented wild-type (wt) minigenes and the others represented mutated minigenes with at least one mutation inside the mutated region. In the case of single mutations, 180 different mutations were expected. A typical mutation was represented by 6 (median) different plasmids and the highest number of plasmids with an identical mutation was 25 (the number of plasmids per single mutation are depicted in Supplementary Figure S2). Additionally, single mutations outside the targeted region were also detected (Supplementary Figure S3). From these ones, only e+4A>G was added to the subsequent analysis because of its interesting transcript profile ( and ).
Figure 2. The effect of single nucleotide substitutions on splicing. A diagram depicts frequencies of ES (at the upper panel) and authentic 5′ss usage (at the lower panel) in transcripts containing SMN1 gene exon 7 of all analysed mutations as a heat map, where red and blue colours represent aberrant transcripts (ES at the upper panel and usage of cryptic and de novo 5′ss at the lower panel). Mutations are positioned in the panel according to their position inside the mutated region (depicted along the x-axis with marked wt nucleotide) and mutation (y-axis). Black colour in the panel represents wt nucleotides, green colour non-analysed mutations. Checkmark indicates a statistically significant decrease in the frequency of appropriate transcript variants (P < 0.01) and asterisks mutations with a statistically significant decrease of frequency above the threshold of 1%
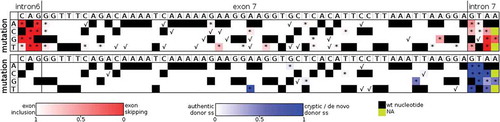
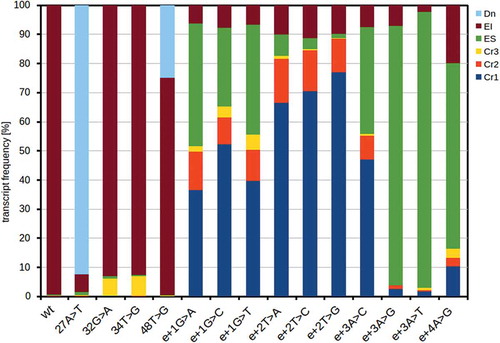
Figure 3. Proportion of transcripts in mutants causing de novo and cryptic 5′ss usage. Exon skipping (ES), exon inclusion (EI; normal splicing isoform only), cryptic 5′ss (Cr1, 2, 3) and de novo 5′ss (Dn) splicing variants frequencies are depicted. Corresponding statistics, incl. standard deviations and p-values for differences among mutations, is available in Supplementary Table S1
High-throughput analysis captured a wide variety of splicing isoforms
Owing to the design of our method, we were able to detect 9 different transcripts and analyse complex splicing changes. In the wt minigene, the normally spliced (exon inclusion) transcript prevailed, but ES was also detected, which corresponded to endogenously expressed SMN1 (). Among other detected transcripts, using cryptic (Cr) and de novo splice sites occurred as well. Thus, the detected transcripts were: normally spliced isoform that used both authentic splice sites, ES, transcripts using cryptic 5′ss Cr1 (located in the intronic position e+24; ), Cr2 (position e+52) or Cr3 (exonic position 30, i.e. c.768), transcripts using de novo 5′ss (exonic position 26 [c.764] due to the mutation 27A>T; or in the exonic position 48 [c.786] due to the mutation 48T>G). The least frequent transcripts were those using the intronic cryptic 3′ss (intronic position e-36), or exonic cryptic 3′ss (exonic position 7, [c. 745]). Cryptic 3′ss use was extremely rare (totally about 2/100,000 and 13/100,000 reads, respectively) and therefore these were not considered in the subsequent analyses.
The impact of single mutations on SMN1 exon 7 RNA splicing
One of the main advantages of this approach was the possibility to test the effect of single mutations, which can help to identify regions carrying functional SREs. Out of 181 evaluated single mutations, 58 showed significantly increased ES proportion (P < 0.01; , upper part), but only 37 of them exceeded a threshold of 1%. Nine of these 37 mutations were located in the authentic 3′ss. The mildest effect among 3′ss mutations was observed in e-3C>T, where ES reached 11%, which perfectly correlated with a moderate 3′ss strength decline as predicted by MaxEnt (). Excluding splice site mutations, the strongest effect was detected for 51A>G (ES 31%) and 23A>T (ES 24%). For most of the splicing-affecting mutations, we predicted the cause of this disruption using various prediction tools (SpliceAid2 [Citation33], EX-SKIP [Citation34], ESRseq [Citation6], MaxEnt [Citation35], HEXplorer [Citation36]) and combined it with data from the literature. All these findings, including the corresponding ESRseq and Hexplorer scores, are summarized in and discussed in depth later.
Table 1. Summary of splicing affecting mutations revealed by NGS. For the purposes of this table, the percentage of aberrant splicing was estimated from NGS data, considering a total number of aberrant reads and subtracting the average number of chimeric (normally spliced) reads. Probable causes of mutations were predicted based on the profile of created minigene transcripts, described splicing regulations and in silico predictions using MaxEnt, Ex-SKIP and others. MaxEnt scores for individual splice sites are presented in the notes column
Fifteen mutants showed significantly increased cryptic or de novo splice site use ( and ). There were two single mutations (32G>A and 34T>G) characterized by increased Cr3 use (), both showing increased Cr3 strength (MaxEnt 7.46, and 9.05, respectively vs. 3.68 of wt). The strongest effect on splicing was observed in the 27A>T variant that forms a strong de novo 5’ss (MaxEnt 10.29) used in 88%. Another de novo 5′ss, created by a 48T>G mutation, showed MaxEnt score 6.6 and use in 21%.
The most remarkable changes were detected in mutants affecting the authentic 5′ss (). Surprisingly, the mutations’ effects differed extensively. While e+3A>G and e+3A>T mutations caused massive ES, all e+2 mutations showed only slight changes in the ES frequency, but the use of both intronic cryptic sites Cr1 and Cr2 was greatly increased. All mutations in position e+1 and mutation e+3A>C had an intermediate pattern of these splicing isoforms.
NGS results verification
To prove NGS data reliability, the impact of selected single mutations was verified using classical minigene assay. Capillary electrophoresis was used to quantify minigene transcripts. Splicing profiles for all tested minigenes (wt, 51A>G, 23A>T, 6C>T and e+2T>C) (Supplementary Figure S5) corresponded to the profile obtained in the NGS experiment with a minor shift towards a higher abundance of normally spliced minigene in the NGS experiment. This phenomenon was observed in all tested mutations and the wt minigene, including mutations in AG and GT dinucleotides of the 3′ss and 5′ss, respectively. These nucleotides’ mutations were expected to lead to complete splicing disruption, as was demonstrated in the verification experiment (Supplementary Figure S5). We hypothesized that these observed ‘contaminations’ were caused by chimeric sequences formed from barcoded exon 1 of the minigene and the middle exon belonging to a different transcript. Therefore, we compared the incidence of non-mutated SMN1 read in the population of transcripts with barcodes belonging to single nucleotide mutations (Supplementary Figure S6). This type of chimeric sequence mostly accounted for 3–10% of the reads, which correlated well with the number of normal transcripts observed in AG and GT mutants. These findings show that chimeric sequence creation could explain the slight shift in transcript isoform frequency.
Since the most abundant transcript is normal exon inclusion, its frequency was slightly overestimated at the expense of all other isoforms. However, all previously detected splicing affecting mutations (incl. 6C>T; ) were confirmed in the NGS experiment and despite this slight inaccuracy, changes in the aberrant transcript frequency remained statistically significant.
Comparing aberrant transcript frequencies with data from literature showed that the effect of mutations on RNA splicing efficiency is less conspicuous in our experiments. To test whether this effect can be caused by the selected cell line used for NGS, we compared the wt transcript profile, 23A>T and 51A>G both in HeLa and HEK-293 cells (). The latter are more often used to evaluate splicing defects in SMN1 exon 7. Indeed, ES was more frequent in HEK-293 cells for all these minigenes, but the difference reached 10% at most.
Figure 4. Comparison of transcript levels in different cells. The results were acquired with standard minigene assay and exon skipping (ES) and exon inclusion (EI) rates were measured using capillary electrophoresis
Altogether, it seems that cells used for this experiment, in combination with the specific pET derived minigene context impacted on the rate of a transcript isoform. Yet our experiment appeared to be very sensitive, detecting all splicing aberrations published so far.
The impact of double mutations
There were 461 different double mutants inside a mutated region with 1–4 different plasmids per mutant (Supplementary Figure S3, S7 and S8). Similar to single mutations, ES was a predominant aberrant transcript. Most double mutants affecting splicing contained one mutation shown to affect splicing as a single nucleotide variant. The second mutation deepened or compensated for the effect of the first one (). Additionally, a few cases where the mutations affected splicing only in combination were detected, but their number was surprisingly low () and the effect rather minor. To find a possible ESE hit by these mutations, the number of mutations resulting in enhanced ES was calculated for each position (). The highest numbers were acquired for positions 20–27, which represent a region probably binding PSF and hTra2β1 [Citation26]. This region was also affected by single mutations, but typically the ES counted less than 1% ().
Figure 5. The effect of chosen double mutations on splicing. A significant decrease in exon inclusion was observed in variants containing one mutation revealed among single mutations affecting splicing (A) or in variants where no mutation affected splicing (B). For comparison, appropriate single mutations were also included (grey column in A). To predict which region is responsible for predominant ES, the number of mutations in exon positions contributing to enhanced ES were counted (C). Error bars represent SD
Similar to single mutants, cryptic and de novo 5′ss use was observed. For example, double mutant 24A>G 26G>T created a strong de novo 5′ss (MaxEnt 7.92) used in 90% (median) reads or similarly, mutant 48T>G 53G>T (MaxEnt 9.72) led to complete de novo 5′ss use.
Mutations of the authentic 5′ss
One of the most important observations from the mutation set represents a diverse effect of mutations in 5′ss region on exon skipping (ES) and cryptic 5′ss use. Therefore, we investigated these mutations in more details. 5′ss mutations typically cause ES, as demonstrated also for SMN1 exon 7 e+1G>C [Citation37]. However, Singh et al. [Citation19] showed that this mutation can also lead to Cr1 and Cr2 use if artificial U1 snRNA binds to specific loci near authentic/cryptic 5′ss. In our minigene context, Cr1 (MaxEnt 0.76), Cr2 (4.88) and Cr3 (3.68) were used more often, which allowed us to discriminate between mutations predominantly causing ES and mutations resulting in cryptic 5′ss use. Individual mutations’ effect was very diverse, both for single mutations and double mutants (, Supplementary Figure S9). Interestingly, cryptic 5′ss use correlated neither with the strength of the mutated authentic 5′ss, as we demonstrated for mutations non-affecting GT using MaxEnt prediction, nor with stem-loop structure formation across the 5′ss [Citation29] (data not shown).
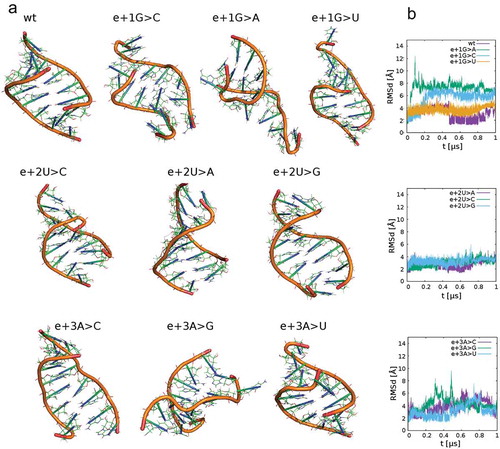
Based on the findings of Singh et al. [Citation19], we speculated that the capacity of mutated 5′ss to bind U1 snRNA may be the major discriminant between ES and cryptic 5’ss use. Therefore, we simulated whether mutated 5′ss bind U1 snRNA and consequently promote distant cryptic 5′ss splicing. Analysing the built RNA duplexes along simulations revealed that the U1 snRNA could form stable duplexes with e+2T>V variant sequences of the authentic 5′ss with a similar efficiency to wt 5′ss, while binding to other mutated sequences is less probable (, Supplementary Figure S10). Additionally, the RNA duplex stability of two double mutants (e+1G>A e+2T>C and e+1G>T e+2T>C) with U1 snRNA was tested in MD simulations. While cryptic 5′ss use is nearly equal for both mutants, only e+1G>A e+2T>C mutant shows sufficient stability in MD simulations. Thus cryptic 5′ss use cannot be fully explained just by U1 binding to the authentic splice site.
Figure 6. RNA structures of studied RNA duplexes from molecular dynamics simulations after 1 microsecond (A). The structures contain one strand from 5ʹ-mRNA and a second one from 5ʹ-U1 snRNA. Time development of Rmsd values for these systems (B). The plots reveal RNA conformation stability in the course of the simulations, i.e. small Rmsd values indicate good agreement with the initial A-RNA geometry (e.g. systems e+2U>C, A, G), larger Rmsd values indicate RNA conformation instability (e.g. e+1G>C,A,U). Instabilities in these models can be interpreted as unsuccessful duplex formation events
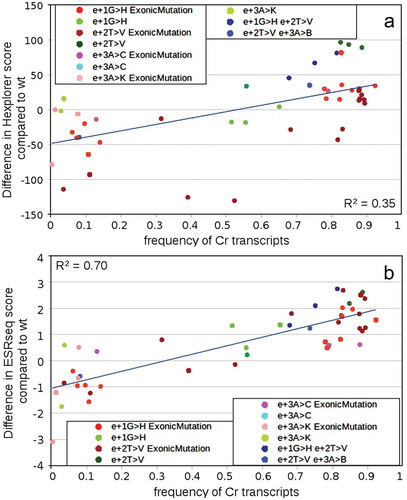
We hypothesised that any mutation disrupting U1 snRNA binding should result in ES, unless it is compensated by ESE creation supporting a weaker, distant 5′ss. Therefore, we analysed the possibility that an SRE was created by mutation across the original 5′ss. The most informative results were obtained using HEXplorer and ESRseq. Scores were counted for each mutation in the centre of the appropriate 21-mer, or 11-mer using HEXplorer and ESRseq, respectively. Although a single score change does not provide information about binding a specific splicing factor, the increase in both algorithms’ scores were associated with increased exon inclusion. Both algorithms showed that mutations with a substantial score increase tend to have a significantly higher cryptic 5′ss use and vice versa. Compared to HEXplorer algorithm, the ESRseq scores’ relationship with cryptic 5′ss use revealed higher linear dependency, as demonstrated by a higher coefficient of determination r [Citation2] counted for linear regression (0.35 vs. 0.7, respectively; ). Therefore, we speculate that ESE creation over the 5′ss might have promoted the cryptic 5′ss usage.
Figure 7. Predicting SRE motifs in SMN1 exon7 variants containing intronic 5′ss mutations. HEXplorer score and ESRseq score were calculated for all single and double mutations identified in the NGS experiment and plotted against the frequency of all transcripts using cryptic 5′ss to disclose the potential dependence of cryptic 5′ss usage on splicing regulators binding across former authentic 5′ss and 3ʹ end of exon 7. HEXplorer scores and ESRseq scores were counted for these mutations’ positions for every mutation or mutation combination separately and in the case of double mutants, the average values of both scores for the position of these mutations were counted. HEXplorer score (A) and ESRseq score (B) of wt variant was subtracted from corresponding mutations scores (mut-wt) for all available mutations to reflect local SRE changes
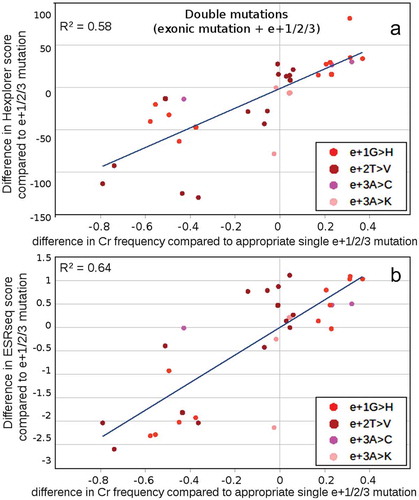
To confirm a predominant role of SRE influence over the 5′ss in driving the Cr 5′ss use, we performed additional multiple mutant analysis. Combining specific mutations in positions e+1/2/3 with exonic mutations, the typical splicing profile was modified in both directions towards an increase or decrease in cryptic 5′ss use (Supplementary Figure S9). To elucidate SRE participation at the end of exon 7 on these shifts, we analysed the differences in HEXplorer and ESRseq score for double mutants (exonic mutation combined with e+1/2/3 mutation) and compared them to the score of the corresponding single intronic mutation and correlated them with the corresponding differences in cryptic 5′ss use (). If the impact of e+1/2/3 mutations on RNA splicing was modulated through the exonic SREs, changes in cryptic 5′ss use would positively correlate with the differences in HEXplorer and ESRseq score. Indeed, this was what we observed. Surprisingly, opposed to the previous SRE predictions across the 5′ss, HEXplorer provided better predictive value. In fact, nearly all positive (negative) score shifts corresponded to higher (lower) cryptic 5′ss use. Sorting double mutants according to the exonic mutation position (Supplementary Figure S11) indicated that mutations in the last three nucleotides of the exon lead to lower cryptic 5′ss use and mutations in positions 48–51 to higher cryptic 5′ss usage. This data indicates the SRE change has a major influence on cryptic 5′ss use, at least in our sequence context. Thus, the transformation of 5′ss to ESE can be a major factor driving cryptic 5′ss use.
Figure 8. Modifying effect of exonic mutations on HEXplorer and ESRseq scores of intronic mutants. To elucidate how exonic mutations modify the effect of intronic mutations in e+1, e+2 and e+3 positions, HEXplorer scores (A) and ESRseq (B) scores of double mutants were compared with the appropriate single intronic mutants (double mut – single mut) and plotted against changes in cryptic 5′ss frequency in comparison with this frequency determined for appropriate single intronic mutant. The correlation shows the diversifying effect of exonic mutations on intronic mutations caused by SRE motif creation
Nucleotide exchanges as SMA determinants
To check the relevance of our results for selected single mutations (), we searched the literature for splicing-affecting mutations. Mutations causing 3′ss decreased strength typically results in ES, which is coupled with SMA outbreak [Citation38–Citation40]. ES abolishes the last 16 amino acids, which disrupts SMN1 oligomerization and subsequently its function [Citation17]. Mutation e-3C>T causes slight decrease in 3′ss strength (MaxEnt score 10.42 compared to 10.92 for wt) and only mild SMA phenotype, which nicely correlates with the detected ES frequency (20%) [Citation15]. Similarly, mutations in the 5′ss induce ES [Citation20,Citation37,Citation38]. In our experiments, e+1G>C mutation caused both ES and cryptic 5′ss use, although cryptic 5′ss usage frequency was higher compared to the published values [Citation19]. From the perspective of SMA development, any mutation inducing exclusively cryptic 5′ss use is expected to be benign, preserving an unimpaired reading frame because of the presence of natural stop codon inside exon 7. Unfortunately, no mutation in e+2 position have been described yet.
Additionally, the exonic mutation 29G>T was found to cause SMA through ES induction when using patient’s RNA [Citation41]. It was predicted to disrupt hTra2β1 ESE. In our experiment, this mutation also showed a high level of ES, on the contrary to any other single variant in this region. Therefore, we suppose that ESS creation rather than ESE disruption is responsible for this effect. Generally, all mutations described as disease-causing in patients were detected in our experiments, while some other mutations were not described in literature. We predict that especially 23A>T and 51A>G should induce ES also invivo. The impact of mutations such as 27A>T, 48T>G or even e+2T>V is uncertain, because only ES is associated with SMA. Exon 7 inclusion regardless of the particular 5′ss used can provide sufficient SMN1 function.
Discussion
Methodological concept of parallel evaluation of splicing-affecting mutations
In this study, we present a high-throughput analysis of splicing-affecting mutations in SMN1 exon 7 and surrounding intronic nucleotides. In recent years, it was shown that such data help to improve knowledge about splicing regulation and can contribute to developing more efficient in silico prediction tools [Citation6,Citation7,Citation36,Citation42–Citation44]. To this point, there are at least two different approaches, either a relatively short sequence in a precisely defined region is extensively varied [Citation7,Citation43], or the whole region is mutated in order to evaluate the effect of local mutations in the context of the wt surroundings [Citation42,Citation44]. We applied the second approach and specifically adopted it to analyse de novo and cryptic splice sites and even reveal mutations having a very minor effect on splicing.
For these purposes, we constructed a minigene containing ‘default’ first and last exons derived from pET plasmid and cloned SMN1 exon 7 to its multiple cloning site. This approach enables any minigene of interest to be created with no necessity for multiple mutagenesis and subcloning. The disadvantage of this approach is the absence of natural neighbouring exons, which can modify the output and thus it is suitable especially for research on a general level. The major advantage is that with several hundreds to thousands of reads per mutant, we were able to detect the differences in splicing pattern at a percentage level, as described for 6C>T. Despite this precision, the detected abundance of transcripts were, in most cases (including donor/acceptor dinucleotides) shifted toward an overrated level of normal splicing isoform. Such a shift was detected in other experiments as well [Citation42]. We showed that these changes are predominantly caused by the presence of chimeras and suggested three possible sources for chimeric sequences. First, the products go through several PCR amplification steps in NGS library preparation and multi-template PCR is susceptible to chimera production [Citation45]. Second, thousands of plasmids can occupy the same nucleus [Citation46] and be subjected to homologous recombination [Citation47] during standard transfection. And third, these chimeric sequences could originate from a trans-splicing event [Citation48]. Regardless of the chimeric sequences’ origin, accurate transcript frequency measurement requires their exclusion from appropriate datasets. One of the possible solutions for this problem could be an additional third exon minigene barcoding.
For our experiment, we selected an SMN1 exon 7 as a well-described splicing system. Although differing in aberrant splicing isoform quantity and type from published levels, our data proved the splicing disruption for all previously described mutations. In this regard, our data offer three possible explanations for these differences: First, the above-mentioned chimeras lead to overestimated normal splicing, second, SMN1 exon 7 skipping is less frequent in HeLa cells compared to other more commonly used cell types like HEK (), and third, using a different minigene might play a role. As an example, the detected lower effect of the 6T>C mutation (when compared to the major ES described for the SMN2 exon 7 bearing exactly this mutation) could result from the different minigene context. It was shown that the increased SMN2 exon 7 skipping rate is supported by relatively distal elements promoting ES, such as hnRNP A1 binding motifs located in the intron 7 [Citation21], or another ISS inside intron 6 [Citation30]. More specifically, our minigene contains the SMN1 intronic context, while it was shown that besides the 6C>T change, other SMN2-specific nucleotides in intron 7 notably participate in exon 7 exclusion [Citation21]. In addition, it is generally accepted that the minigene context (such as the promoter, surrounding exons, etc.) influences the aberrant splicing rate.
Diverse effect of splicing-affecting mutations
Overall, only a limited number of mutations causing normal splicing disruption was detected in our experimental system and in most of them, the effect could be clearly coupled with a probable cause. Among them, 5′ss or 3′ss disruption and de novo 5′ss creation dominated. Occasionally, several single nucleotide mutations led to ES by influencing exonic SREs. ESS creation seems to be a more probable reason for changing the splicing pattern than ESE disruption, as indicated by the solitary incidence of these mutations; other substitutions in the same or any neighbouring nucleotide position did not affect the splicing pattern. For example, mutation 29G>T was predicted to disrupt hTra2β1 ESE [Citation41]. However, other mutations in the hTra2β1 ESE, including mutations in the same position, did not result in such substantial aberrant splicing (this work, [Citation41]). In an AG-rich region (nt 18–30), only a few single and double mutations resulted in slight ES, which showed that only more complex changes in target sequences could decrease exon recognition. This region is recognized at least by hTra2β1 [Citation23–Citation25], PSF [Citation26] and their interaction partners hnRNP G [Citation27] and SRSF9 [Citation25]. Binding each of these splicing regulators can promote exon inclusion. Besides, other splicing regulatory proteins such as SRSF1 [Citation22], hnRNP Q [Citation49] or TIA-1 [Citation31] can promote exon inclusion recruiting distinct elements. Each element in an exon containing multiple splicing enhancer elements can activate correct splicing [Citation50] and the splicing efficiency may not be dependent on the number of ESEs [Citation51]. Considering the partially degenerate nature of ESEs, including those binding hTra2β1 [Citation52,Citation53], high exon 7 occupancy with ESEs and an exons’ requirement not to have all ESEs occupied with splicing factors [Citation54] suggests the hypothesis that a decline in binding one splicing enhancer can be compensated by binding another one or being beaten with splicing silencer.
Various mutations in the intronic part of the 5′ss resulted in a highly variable transcript profile. While mutations e+3A>T and e+3A>G caused nearly total ES, mutations in the e+2 position substantially promoted cryptic 5′ss use and mutations in e+1 and e+3A>C showed both these effects. From previous experiments, it seems that activating the distal 5′ss is negatively correlated with the strength of the proximal 5′ss [Citation55]. However, SMN1 exon7 is not this case. We tested two major hypotheses. Based on an analysis of RNA duplex stability in molecular dynamics (MD) simulations, we tested whether U1 snRNA can bind to the mutated region of the authentic 5′ss and promote cryptic 5′ss recognition. It was shown that artificial U1 snRNAs can promote the use of both downstream and upstream 5′ss from a distance [Citation16,Citation19,Citation56] and similarly, shifted endogenous U1 snRNA base-pairing enables efficient exon recognition [Citation13]. Competition assay with mutant RNA oligos [Citation11] showed a significantly decreased duplex stability with both e+1 and e+2 mutated positions. Among all of them, e+2U>C is the strongest competitor, but still weaker than mutants in e+3 or e+4 positions. In SMN1 5′ss the consensual exonic CAG sequence is replaced with GGA. Thus, standard WC base pair C=G in the last exonic position must be replaced with mismatched A+/C pair, which efficiently stabilizes the duplex. The stability of duplex with mismatches is probably increased by other factors including U1 snRNP components, such as U1-C [Citation11], or additional splicing factors such as SRSF1 [Citation57] or TIA [Citation58]. Indeed, in our models, e+2T>V mutants showed the best duplex stability and the highest rate of cryptic 5′ss use.
In general, cryptic 5′ss activation itself was detected in many genes, but the exact mechanism has remained mostly unclear. For example, an e+1G>T mutation in the Fibrinogen β-chain gene leads to cryptic 5′ss use only if SRSF1 binds to an upstream region [Citation59], which nicely corresponds to the ESE function in promoting exon recognition. In SMN1 exon 7, there is a very similar situation, because a mutation in the authentic 5′ss region lies upstream of cryptic 5′ss and can be accompanied with ESE creation, as supported by HEXplorer and ESRseq score alterations for e+2T>V mutants. In other mutations such as e+1G>H, U1 snRNA binding is disrupted, which releases an RNA molecule around the authentic 5′ss to the splicing factor binding and subsequently enhances the efficiency of cryptic 5′ss recognition. However, it is not clear if possible competition between the U1 snRNP and splicing factor binding can influence cryptic 5′ss recognition. Since the differences in single mutations’ splicing patterns did not enable us to distinguish between the impact of ESEs and U1 snRNA binding, we used a higher plasmid library variability generated in our NGS experiment, and analysed a series of double mutants with one mutation between positions e+1 and e+3 and a second mutation upstream. While modelling the RNA duplex’s stability of selected double mutants with U1 snRNA did not support a correlation between duplex stability and cryptic 5′ss use, HEXplorer and ESRseq score alterations, whose values are supposed to correspond with SRE creation/disruption [Citation6,Citation36], reflected cryptic 5′ss use nicely. Nearly all mutations in exonic nucleotides 48–51 increased both HEXplorer score and cryptic 5′ss usage, whereas mutations in exonic nucleotides 52–54 decreased both of them. The increased number of ESEs increases the probability of splicing enhancer molecule binding to the exon [Citation54] and helps the exon to be recognized. Therefore, cryptic 5′ss use emerges from the fact that the sequence downstream of original exon 7 does not contain any normally recognizable 5′ss, and appropriate 5′ss mutants carry new additional ESEs overlapping the original 5′ss in the context of a newly defined and prolonged exon. Although this global view indicates that ESEs’ influence prevails, in single cases, U1 snRNA binding to mutated 5′ss could contribute to changes in splicing pattern. U1 snRNA binding to non-5′ss sequences has been earlier proven [Citation60] and additionally, this binding can potentiate the use of a near 5′ss [Citation19].
Conclusions
The use of the new high-throughput approach for detection of splicing-affecting mutations enabled us to evaluate the effect of all possible single nucleotide mutations and a lot of multiple mutations on splicing. The data indicated that the major factor preventing the exon to be correctly recognized is the creation of strong ESSs and strong de novo 5′ss. On the other hand, cryptic 5′ss activation is driven by mutations that destroy authentic 5′ss and simultaneously increase ESE strength across the mutated authentic 5′ss. U1 snRNA binding properties tune the abundance of transcripts in 5′ss mutants.
Material and methods
Gene annotation
The SMN1 sequence was acquired from the National Center for Biotechnology Information and all positions were numbered according to the transcript NM_022874.2 and protein NP_075012.1. For the purpose of this text, the numbering was simplified to reflect the position within exon 7. Thus, position 1 corresponds to the first exonic position, intronic nucleotides upstream of intron6-exon7 junction are marked ‘e-’ and intronic nucleotides downstream of exon 7 are marked ‘e+’. Nucleotide abbreviations follow IUPAC recommendations. The original exon 7 and neighbouring introns, and all corresponding nucleotides are referred to as wild type (wt).
Principles of the NGS-based method to detect splicing-affecting mutations
To develop an NGS-based method for parallel detection of different transcript isoforms in a pool of different minigene variants, a three-exonic minigene containing specific sequence elements was designed ().
In the first step of the procedure, a plasmid library with different variants of the middle exon was created. It included two substeps. In the first one, the middle exon was mutagenised and in the second, the whole plasmid library from the first substep was subjected to intragenic barcode insertion into the first minigene exon to produce the final plasmid library. Thus, every middle exon variant was uniquely characterized by one or more specific barcodes in the first exon. In the second step, this plasmid library was sequenced by NGS to determine which barcode was assigned to the mutation. For this purpose, the whole plasmid library was cut by PacI and AsiSI and the longer fragment was re-ligated in concentrations favouring re-circularization. These shortened plasmids were subjected to PCR amplification of the minigene and subsequently sequenced. In the third step, the plasmid library was transfected into the human cells and analysed using RT-PCR followed by NGS. Therefore, RNA from these cells was extracted, reversely transcribed and amplified using primers fpet and rpet hybridized to the first and last exon of the minigene construct. Both PCR products from steps two and three were analysed in the same NGS run. This approach enabled us to directly assign any transcript (incl. ES) to the corresponding mutation in the exonic or intronic region based on a barcode in the first exon (Supplementary Figure S1).
Minigene construction
The minigene containing the SMN1 exon 7 was derived from the Exontrap plasmid pET01 (MoBiTec). The final expression cassette is depicted in . The upstream phosphatase-derived part of the first exon was removed from the pET01 expression cassette. Additionally, AscI, NheI and BglII restriction sites were introduced into the first exon, a PacI site into the first intron 15 nucleotides downstream of the first exon, and a PciI site into the second intron 18 nt upstream of the second exon. This plasmid was used to insert SMN1 exon 7 (including 254 nt of upstream intron and 324 nt of the downstream intron) into ApaI and SmaI restriction sites within the multiple cloning site. Additionally, an AsiSI restriction site was inserted 53 nucleotides upstream of SMN1 exon 7. The nucleotide sequence of this plasmid was verified by Sanger sequencing and the potential influence of these modifications on splicing effectivity was excluded by standard minigene assay.
Plasmid library construction
Plasmid was independently mutated by site-directed mutagenesis with a series of six mutagenesis primers (Generi-Biotech): SMN1_f1: AGC TAT TTT TTT TAA CTT CCT TTA TTT TCC TTA cag ggt ttc aGA CAA AAT CAA AAA GAA GGA AGG; SMN1_f2: CTT TAT TTT CCT TAC AGG GTT TCA gac aaa atc aAA AAG AAG GAA GGT GCT CA; SMN1_f3: AGG GTT TCA GAC AAA ATC Aaa aag aag gaA GGT GCT CAC ATT CCT TA; SMN1_f4: TCA GAC AAA ATC AAA AAG AAG Gaa ggt gct cac ATT CCT TAA ATT AAG GAG TAA GT; SMN1_f5: AAG AAG GAA GGT GCT CAC att cct taa aTT AAG GAG TAA GTC TGC; SMN1_f6: GAA GGT GCT CAC ATT CCT TAA Att aag gag taA GTC TGC CAG C and their complementary reverse counterparts, where lower-case letters correspond to degenerate positions with 12% of non-original nucleotides (4% of each nucleotide) and 88% of original wt nucleotides (depicted) [Citation61]. After E. coli transformations, about 5 000 colonies were scraped out of the Petri dishes and pooled into one homogeneous glycerol stock and stored at −80°C. The plasmid library was isolated from these bacteria with QIAprep Spin Miniprep Kit (Qiagen), according to the manufacturer’s instructions. The first exon was replaced with a barcoded one as follows (): using similar plasmid without an AscI restriction site as a template, a fragment of the first exon was re-amplified with primers BC_f_HindIII: GCA CCT CAA GCT TCC TG and BC_r_BglII: AAA AAA AGA TCT NNN NGN NNN GNN NNA CTT TCG CGG CGG G and subsequently inserted into the HindIII and BglII restriction sites of plasmids containing SMN1 exon 7. After transformation, about 5 000 colonies were collected, homogeneous glycerol stock prepared and stored at −80°C. To check the efficiency of barcoding, plasmid DNA was isolated and subsequently digested by NheI. According to the electrophoretic gel analysis, non-barcoded plasmids should not exceed 10% of the whole plasmid library. Additionally, 20 colonies were picked from the library and independently sequenced to confirm the presence of mutations inside SMN1 exon and correct barcoding. Individual plasmids containing the chosen mutations were mutated by appropriate mutagenesis primers and standard mutagenesis procedure as described above. Four mutations (18A>G, 19A>C, 19A>T, 21A>C) were missing in the plasmid library. The four missing mutations were added to the analysis afterwards to complete the whole set of single mutations. These later added minigenes were analysed separately by classical minigene assay using capillary electrophoresis to quantify minigene transcripts. None of these mutations affected the splicing pattern compared to the wt minigene.
Cell culture and transfection
Two different cell lines were used, HeLa and HEK-293. Both lines were obtained from European Collection of Authenticated Cell Cultures (ECACC). HeLa cells were maintained in an RPMI 1640 medium (Sigma-Aldrich) supplemented with 10% FCS (Sigma-Aldrich) and HEK-293 cells in DMEM (Sigma-Aldrich) supplemented with 10% FCS. Cells were seeded into a 12-well plate one day prior to the transfection. Both cell lines were transfected using 2.4 μl XtremeGene 9 (Roche) and 400–800 ng plasmid DNA. Cells were grown for a subsequent 24 h and processed to RNA analysis. It was done either separately with one unique plasmid, and subsequently analysed by capillary electrophoresis or with the whole plasmid library (overall six independent transfections were made in separated cultivation wells in two different days), and subsequently sequenced by NGS. With the exception of the NGS experiment, all transcript analyses were assessed at least in duplicates and all corresponding data are presented as average values.
RNA extraction and RT-PCR analysis
Total RNA from cells was isolated using the innuPREP Micro RNA Kit and innuPREP DNase I Digest Kit (Analytik Jena). Potential DNA contamination was excluded by PCR using PCR primers fpet: CAG GCT TTT GTC AAC AG and rpet: GCA CTG ATC CAC GAT G and pure RNA as a template. The RNA quantity was determined by spectrophotometry (NanoDrop 2000c, Thermofisher). cDNA were synthetized using random hexamers and Transcriptor First Strand cDNA Synthesis Kit (Roche).
PCR amplification and NGS library preparation
For the purposes of the standard minigene assay (one transfection – one plasmid), PCR with rpet and FAM-labeled fpet primer was performed using recombinant Taq DNA Polymerase (Thermofisher). Transcripts were detected using capillary electrophoresis (Applied Biosystems™ 3500 Series Genetic Analyzer, Thermofisher).
For NGS-based transcript isoform analysis, minigene transcripts were amplified by fpet and rpet primers and Q5 High-Fidelity DNA Polymerase (New England Biolabs) to ensure low error rates and purified using a QIAquick PCR Purification Kit (Qiagen). To get suitable products for genotyping, the barcoded plasmid library was digested with PacI and AsiSI. Longer plasmid fragments missing most of the first intron in the expression cassette were purified from the electrophoretic gel (Qiaquick Gel extraction kit, Qiagen) and re-ligated by T4 DNA ligase (NEB) in 100 μl of the reaction mixture with plasmid concentration 1 ng/μl to re-circularize the shortened plasmids. Re-ligated plasmids were electrophoretically separated and the open-circle plasmid form was purified from the gel. The exonic parts were subsequently amplified using fpet and rint primers: ATT CAC TTT CAT AAT GCT and Platinum Pfx DNA Polymerase (Thermofisher). NGS libraries from both plasmid and transcript PCR products were prepared using KAPA HTP/LTP Library Preparation Kit (Roche) and tagged with unique 6-mer barcode sequences. These libraries were pooled and diluted with 20% PhiX and sequenced on an Illumina MiSeq.
Endogenous SMN1 expression in HeLa cells was checked after PCR amplification using primers SMN1f6: GTC CAG ATT CTC TTG ATG ATG C and SMN1r8: GTG GTG TCA TTT AGT GCT GCT C.
Computational analysis
Raw sequence data quality was checked using FastQC. Unpaired reads from each sample were independently aligned to a corresponding reference sequence using the procedure in the Rsubread R/Bioconductor package [Citation62]. Individual reads from plasmid sequencing samples were grouped according to the barcode sequence inside the first exon, using our own scripts and variants called using GATK HaplotypeCaller version 3.3–0. For the purposes of transcript analysis, the number of individual reads were counted for each plasmid and transcript isoform separately (Supplementary Table S1). Each plasmid was represented by 227 reads on average (median) and ranged from the tenth to several hundred reads (Supplementary Figure S4). ES frequency was calculated as a ratio of ES from all identified transcript isoform reads and the counterpart value corresponds to exon inclusion (EI). Identically, using the cryptic 5′ss was calculated as a ratio of corresponding reads from all reads carrying the SMN1 exon.
To test the similarity in the expression pattern in minigenes containing the same mutation but different barcode, the Mantel-Haenszel chi-squared test was used. This analysis confirmed that in most cases the splicing pattern in these minigenes is not significantly different (Supplementary Table S1).
To test the mutations’ impact on splicing, six independent transfections were carried out. The statistical significance of the difference in ES frequency or cryptic 5′ss use frequency was evaluated using the Mantel-Haenszel chi-squared test with continuity correction and an additional filter based on a 1% threshold for changes in frequency was applied.
The splice site strength was calculated using MaxEnt [Citation35]. To assess the effect of SREs, the following algorithms were used: SpliceAid2 [Citation33], EX-SKIP [Citation34], HEXplorer [Citation36] and ESRseq score matrix [Citation6]. HEXplorer and ESRseq scores were calculated as the difference between the given score for wt and each mutation or double mutation. Both algorithms calculate the scores for the exact mutation position, but in the case of double mutants, the score is modified as well, if the second mutation shares the same hexamers. Therefore, the scores were calculated for both positions. Typically, HEXplorer and ESRseq scores were very similar for both positions and their average value was calculated.
Molecular dynamics (MD) simulations
The interaction between mRNA and U1 snRNA was studied using MD simulations. Therefore, we built RNA duplexes consisting of one strand from mRNA and a second one from U1snRNA by the NAB module of AMBER 14 [Citation63]. The duplexes were built as a right-handed A-RNA using a parmbsc0 OL3 force field [Citation64]. Mismatched base pairs were built in cis-Watson-Crick cis-WC/WC geometry as standard canonical pairs. For adenine/cytosine (A/C) pair and C/C pair we used protonated nucleotide versions, i.e. A+ and C+ from the AMBER package, to create cis-WC/WC A+/C and C+/C base pairs according to the RNA base pair classification [Citation65]. Force field parameters for pseudouridine were taken from the modified residues library [Citation66] and adjusted according to the force field used. Each RNA duplex was solvated by a periodic octahedral box of TIP3P water molecules extending 10 Å from the solute and neutralized with sodium counterions using AMBER’s Xleap module. The equilibration and production setup used in this study corresponds to the standard protocol applied by the ABC consortium for large-scale MD nucleic acid studies [Citation67]. Equilibrated duplexes were simulated for 1 microsecond. The MD trajectories were processed using AMBER’s Ptraj module and visualized using the VMD program [Citation68]. Stability of RNA duplex conformations was monitored using Root mean square deviation (Rmsd), which indicates the deviation in a superposition of MD structures and the initial A-RNA geometry. Base pair step parameters characterizing the mutual orientation of base pairs in the duplex, .i.e. three rotational parameters (roll, tilt and twist) and three translational parameters (shift, slide and rise) were analysed along the trajectories using program Curves [Citation69].
Data Availability
Sequencing data are available at Sequence Read Archive (Bioproject ID: PRJNA507345).
Supplemental Material
Download Zip (10.5 MB)Acknowledgments
We thank Dr Pavel Mazura and Dr Boris Tichý for sharing their experiences with mutagenesis procedure and NGS, respectively. We also thank Lucie Kopálková for her excellent technical help. This work was supported by the Ministry of Health of the Czech Republic (16-34414A), by the Grant Agency of the Czech Republic (GA16-11619S/2016) and by Ministry of Education, Youth and Sports of the Czech Republic (MUNI/A/1298/2018). NGS data were obtained in collaboration with CF Genomics CEITEC MU and supported by the NCMG research infrastructure (LM2015091 funded by MEYS CR). Computational resources were provided by the CESNET LM2015042 and the CERIT Scientific Cloud LM2015085, provided under the programme “Projects of Large Research, Development, and Innovations Infrastructures”.
Disclosure statement
The authors declare no conflict of interest.
Additional information
Funding
Related Research Data
References
- Wang Z, Burge CB. Splicing regulation: from a parts list of regulatory elements to an integrated splicing code. RNA. 2008;14:802–813.
- Bruun GH, Doktor TK, Borch-Jensen J, et al. Global identification of hnRNP A1 binding sites for SSO-based splicing modulation. BMC Biol. 2016;14:54.
- Grodecká L, Buratti E, Freiberger T. Mutations of pre-mRNA splicing regulatory elements: are predictions moving forward to clinical diagnostics? Int J Mol Sci. 2017;18:1668.
- König J, Zarnack K, Rot G, et al. iCLIP reveals the function of hnRNP particles in splicing at individual nucleotide resolution. Nat Struct Mol Biol. 2010;17:909–915.
- Tacke R, Manley JL. The human splicing factors ASF/SF2 and SC35 possess distinct, functionally significant RNA binding specificities. Embo J. 1995;14:3540–3551.
- Ke S, Shang S, Kalachikov SM, et al. Quantitative evaluation of all hexamers as exonic splicing elements. Genome Res. 2011;21:1360–1374.
- Rosenberg AB, Patwardhan RP, Shendure J, et al. Learning the sequence determinants of alternative splicing from millions of random sequences. Cell. 2015;163:698–711.
- Xiong HY, Alipanahi B, Lee LJ, et al. RNA splicing. The human splicing code reveals new insights into the genetic determinants of disease. Science. 2015;347:1254806.
- Lerner MR, Boyle JA, Mount SM, et al. Are snRNPs involved in splicing? Nature. 1980;283:220–224.
- Siliciano P, Guthrie C. 5ʹ splice site selection in yeast - genetic alterations in base-pairing with U1 reveal additional requirements. Genes Dev. 1988;2:1258–1267.
- Kondo Y, Oubridge C, van Roon A-M-M, et al. Crystal structure of human U1 snRNP, a small nuclear ribonucleoprotein particle, reveals the mechanism of 5ʹ splice site recognition. Elife. 2015;4:e04986.
- Roca X, Akerman M, Gaus H, et al. Widespread recognition of 5ʹ splice sites by noncanonical base-pairing to U1 snRNA involving bulged nucleotides. Genes Dev. 2012;26:1098–1109.
- Roca X, Krainer AR. Recognition of atypical 5ʹ splice sites by shifted base-pairing to U1 snRNA. Nat Struct Mol Biol. 2009;16:176–182.
- Tan J, Ho JXJ, Zhong Z, et al. Noncanonical registers and base pairs in human 5ʹ splice-site selection. Nucleic Acids Res. 2016;44:3908–3921.
- Brackenridge S, Wilkie AOM, Screaton GR. Efficient use of a “dead-end” GA 5ʹ splice site in the human fibroblast growth factor receptor genes. Embo J. 2003;22:1620–1631.
- Cohen JB, Snow JE, Spencer SD, et al. Suppression of mammalian 5ʹ splice-site defects by U1 small nuclear RNAs from a distance. Proc Natl Acad Sci USA. 1994;91:10470–10474.
- Lorson CL, Strasswimmer J, Yao JM, et al. SMN oligomerization defect correlates with spinal muscular atrophy severity. Nat Genet. 1998;19:63–66.
- Vezain M, Gérard B, Drunat S, et al. A leaky splicing mutation affecting SMN1 exon 7 inclusion explains an unexpected mild case of spinal muscular atrophy. Hum Mutat. 2011;32:989–994.
- Singh NN, Del Rio-Malewski JB, Luo D, et al. Activation of a cryptic 5ʹ splice site reverses the impact of pathogenic splice site mutations in the spinal muscular atrophy gene. Nucleic Acids Res. 2017;45:12214–12240.
- Lorson CL, Hahnen E, Androphy EJ, et al. A single nucleotide in the SMN gene regulates splicing and is responsible for spinal muscular atrophy. Proc Natl Acad Sci USA. 1999;96:6307–6311.
- Kashima T, Rao N, David CJ, et al. hnRNP A1 functions with specificity in repression of SMN2 exon 7 splicing. Hum Mol Genet. 2007;16:3149–3159.
- Cartegni L, Krainer AR. Disruption of an SF2/ASF-dependent exonic splicing enhancer in SMN2 causes spinal muscular atrophy in the absence of SMN1. Nat Genet. 2002;30:377–384.
- Chen Y-C, Chang J-G, Jong Y-J, et al. High expression level of Tra2-β1 is responsible for increased SMN2 exon 7 inclusion in the testis of SMA mice. PLoS ONE. 2015;10:e0120721.
- Hofmann Y, Lorson CL, Stamm S, et al. Htra2-beta 1 stimulates an exonic splicing enhancer and can restore full-length SMN expression to survival motor neuron 2 (SMN2). Proc Natl Acad Sci USA. 2000;97:9618–9623.
- Young PJ, DiDonato CJ, Hu D, et al. SRp30c-dependent stimulation of survival motor neuron (SMN) exon 7 inclusion is facilitated by a direct interaction with hTra2 beta 1. Hum Mol Genet. 2002;11:577–587.
- Cho S, Moon H, Loh TJ, et al. PSF contacts exon 7 of SMN2 pre-mRNA to promote exon 7 inclusion. Biochim Biophys Acta. 2014;1839:517–525.
- Hofmann Y, Wirth B. hnRNP-G promotes exon 7 inclusion of survival motor neuron (SMN) via direct interaction with Htra2-beta1. Hum Mol Genet. 2002;11:2037–2049.
- Bose JK, Wang I-F, Hung L, et al. TDP-43 overexpression enhances exon 7 inclusion during the survival of motor neuron pre-mRNA splicing. J Biol Chem. 2008;283:28852–28859.
- Singh NN, Singh RN, Androphy EJ. Modulating role of RNA structure in alternative splicing of a critical exon in the spinal muscular atrophy genes. Nucleic Acids Res. 2007;35:371–389.
- Miyajima H, Miyaso H, Okumura M, et al. Identification of a cis-acting element for the regulation of SMN exon 7 splicing. J Biol Chem. 2002;277:23271–23277.
- Singh NN, Seo J, Ottesen EW, et al. TIA1 prevents skipping of a critical exon associated with spinal muscular atrophy. Mol Cell Biol. 2011;31:935–954.
- Beusch I, Barraud P, Moursy A, et al. Tandem hnRNP A1 RNA recognition motifs act in concert to repress the splicing of survival motor neuron exon 7. Elife. 2017;6:e25736.
- Piva F, Giulietti M, Burini AB, et al. SpliceAid 2: a database of human splicing factors expression data and RNA target motifs. Hum Mutat. 2012;33:81–85.
- Raponi M, Kralovicova J, Copson E, et al. Prediction of single-nucleotide substitutions that result in exon skipping: identification of a splicing silencer in BRCA1 exon 6. Hum Mutat. 2011;32:436–444.
- Yeo G, Burge CB. Maximum entropy modeling of short sequence motifs with applications to RNA splicing signals. J Comput Biol. 2004;11:377–394.
- Erkelenz S, Theiss S, Otte M, et al. Genomic HEXploring allows landscaping of novel potential splicing regulatory elements. Nucleic Acids Res. 2014;42:10681–10697.
- Ronchi D, Previtali SC, Sora MGN, et al. Novel splice-site mutation in SMN1 associated with a very severe SMA-I phenotype. J Mol Neurosci. 2015;56:212–215.
- Lefebvre S, Bürglen L, Reboullet S, et al. Identification and characterization of a spinal muscular atrophy-determining gene. Cell. 1995;80:155–165.
- Wu S, Li Y-L, Cheng N-Y, et al. c.835-5T>G variant in SMN1 gene causes transcript exclusion of exon 7 and spinal muscular atrophy. J Mol Neurosci. 2018;65:196–202.
- Sheng-Yuan Z, Xiong F, Chen Y-J, et al. Molecular characterization of SMN copy number derived from carrier screening and from core families with SMA in a Chinese population. Eur J Hum Genet. 2010;18:978–984.
- Qu Y-J, Bai J-L, Cao -Y-Y, et al. A rare variant (c.863G>T) in exon 7 of SMN1 disrupts mRNA splicing and is responsible for spinal muscular atrophy. Eur J Hum Genet. 2016;24:864–870.
- Julien P, Miñana B, Baeza-Centurion P, et al. The complete local genotype-phenotype landscape for the alternative splicing of a human exon. Nat Commun. 2016;7:11558.
- Ke S, Anquetil V, Zamalloa JR, et al. Saturation mutagenesis reveals manifold determinants of exon definition. Genome Res. 2018;28:11–24.
- Braun S, Enculescu M, Setty ST, et al. Decoding a cancer-relevant splicing decision in the RON proto-oncogene using high-throughput mutagenesis. Nat Commun. 2018;9:3315.
- Kalle E, Kubista M, Rensing C. Multi-template polymerase chain reaction. Biomol Detect Quantif. 2014;2:11–29.
- Cohen RN, Van der Aa MAEM, Macaraeg N, et al. Quantification of plasmid DNA copies in the nucleus after lipoplex and polyplex transfection. J Control Release. 2009;135:166–174.
- Kucherlapati RS, Spencer J, Moore PD. Homologous recombination catalyzed by human cell extracts. Mol Cell Biol. 1985;5:714–720.
- Sharp PA. Trans splicing: variation on a familiar theme? Cell. 1987;50:147–148.
- Chen -H-H, Chang J-G, Lu R-M, et al. The RNA binding protein hnRNP Q modulates the utilization of exon 7 in the survival motor neuron 2 (SMN2) gene. Mol Cell Biol. 2008;28:6929–6938.
- Schaal TD, Maniatis T. Multiple distinct splicing enhancers in the protein-coding sequences of a constitutively spliced pre-mRNA. Mol Cell Biol. 1999;19:261–273.
- Hertel KJ, Maniatis T. The function of multisite splicing enhancers. Mol Cell. 1998;1:449–455.
- Tacke R, Tohyama M, Ogawa S, et al. Human Tra2 proteins are sequence-specific activators of pre-mRNA splicing. Cell. 1998;93:139–148.
- Tsuda K, Someya T, Kuwasako K, et al. Structural basis for the dual RNA-recognition modes of human Tra2-β RRM. Nucleic Acids Res. 2011;39:1538–1553.
- Jobbins AM, Reichenbach LF, Lucas CM, et al. The mechanisms of a mammalian splicing enhancer. Nucleic Acids Res. 2018;46:2145–2158.
- Hicks MJ, Mueller WF, Shepard PJ, et al. Competing upstream 5ʹ splice sites enhance the rate of proximal splicing. Mol Cell Biol. 2010;30:1878–1886.
- Dal Mas A, Rogalska ME, Bussani E, et al. Improvement of SMN2 pre-mRNA processing mediated by exon-specific U1 small nuclear RNA. Am J Hum Genet. 2015;96:93–103.
- Jamison SF, Pasman Z, Wang J, et al. U1 snRNP-ASF/SF2 interaction and 5ʹ splice site recognition: characterization of required elements. Nucleic Acids Res. 1995;23:3260–3267.
- Förch P, Puig O, Martínez C, et al. The splicing regulator TIA-1 interacts with U1-C to promote U1 snRNP recruitment to 5ʹ splice sites. Embo J. 2002;21:6882–6892.
- Spena S, Tenchini ML, Buratti E. Cryptic splice site usage in exon 7 of the human fibrinogen Bbeta-chain gene is regulated by a naturally silent SF2/ASF binding site within this exon. RNA. 2006;12:948–958.
- Wassarman KM, Steitz JA. Association with terminal exons in pre-mRNAs: a new role for the U1 snRNP? Genes Dev. 1993;7:647–659.
- Filipi T, Mazura P, Janda L, et al. Engineering the cytokinin-glucoside specificity of the maize β-D-glucosidase Zm-p60.1 using site-directed random mutagenesis. Phytochemistry. 2012;74:40–48.
- Liao Y, Smyth GK, Shi W. The Subread aligner: fast, accurate and scalable read mapping by seed-and-vote. Nucleic Acids Res. 2013;41:e108.
- Case D, Babin V, Berryman J, et al. AMBER 14. San Francisco: University of California; 2014.
- Zgarbová M, Otyepka M, Sponer J, et al. Refinement of the cornell nucleic acids force field based on reference quantum chemical calculations of glycosidic torsion profiles. J Chem Theory Comput. 2011;7:2886–2902.
- Leontis NB, Stombaugh J, Westhof E. The non-Watson-Crick base pairs and their associated isostericity matrices. Nucleic Acids Res. 2002;30:3497–3531.
- Aduri R, Psciuk BT, Saro P, et al. AMBER force field parameters for the naturally occurring modified nucleosides in RNA. J Chem Theory Comput. 2007;3:1464–1475.
- Lavery R, Zakrzewska K, Beveridge D, et al. A systematic molecular dynamics study of nearest-neighbor effects on base pair and base pair step conformations and fluctuations in B-DNA. Nucleic Acids Res. 2010;38:299–313.
- Humphrey W, Dalke A, Schulten K. VMD: visual molecular dynamics. J Mol Graph. 1996;14:33–8, 27–8.
- Lavery R, Moakher M, Maddocks JH, et al. Conformational analysis of nucleic acids revisited: curves+. Nucleic Acids Res. 2009;37:5917–5929.
- Kashima T, Manley JL. A negative element in SMN2 exon 7 inhibits splicing in spinal muscular atrophy. Nat Genet. 2003;34:460–463.