
 ?Mathematical formulae have been encoded as MathML and are displayed in this HTML version using MathJax in order to improve their display. Uncheck the box to turn MathJax off. This feature requires Javascript. Click on a formula to zoom.
ABSTRACT
LncRNAs play crucial roles in cellular processes and their regulatory effects in the adult brain and neural stem cells (NSCs) remain to be entirely characterized. We report that 10 lncRNAs (LincENC1, FABL, lincp21, HAUNT, PERIL, lincBRN1a, lincBRN1b, HOTTIP, TUG1 and FENDRR) are expressed during murine NSCs differentiation and interact with the RNA-binding protein ELAVL1/HuR. Furthermore, we characterize the function of two of the deregulated lncRNAs, lincBRN1a and lincBRN1b, during NSCs’ differentiation. Their inhibition leads to the induction of differentiation, with a concomitant decrease in stemness and an increase in neuronal markers, indicating that they exert key functions in neuronal cells differentiation. Furthermore, we describe here that HuR regulates their half-life, suggesting their synergic role in the differentiation process. We also identify six human homologs (PANTR1, TUG1, HOTTIP, TP53COR, ELDRR and FENDRR) of the mentioned 10 lncRNAs and we report their deregulation during human iPSCs differentiation into neurons. In conclusion, our results strongly indicate a key synergic role for lncRNAs and HuR in neuronal stem cells fate.
Introduction
Neural stem cells (NSCs) are multipotent stem cells present in the central nervous system (CNS) with self-renewing capabilities and the ability to generate all the main cellular phenotypes present in the nervous system, including neurons, astrocytes and oligodendrocytes [Citation1]. NSCs were first observed as resident progenitors in the sub-ventricular zone (SVZ) and dentate gyrus of the mouse brain [Citation2], and have later found a strong use in regenerative medicine [Citation3–Citation9]. In that context, NSCs are described to act both by releasing anti-inflammatory soluble factors and by differentiating into cellular components of the CNS [Citation4–Citation12]. Many progresses have been made in understanding the factors that regulate adult NSCs’ specification, proliferation and differentiation, but much remains to be understood, especially the potential involvement of RNA-binding proteins (RBPs) and long non-coding RNAs (lncRNAs) in these processes [Citation13].
LncRNAs are defined as RNA molecules longer than 200 bp which can be classified as intergenic (lincRNAs), intronic, and cis-antisense [Citation14]. They have been endowed with a gene expression regulatory ability, although their role is not limited to this function. Several well-studied examples of lncRNAs suggest that they can operate through distinct modes, including working as signals, scaffolds for protein–protein interactions, molecular decoys, and guides to target elements in the genome or transcriptome [Citation15]. The claim that lncRNAs could play a crucial role in development was supported by the evidence that the ablation of specific lincRNAs, such as PERIL and FENDRR, could cause perinatal lethality in mouse knockout models [Citation16]. Indeed, a fundamental role in normal anatomical development has also been shown for the lncRNA HOTTIP, which activates the expression of certain Homebox A (HOXA) genes, crucial for distal identity and thus correct limb development [Citation17]. Moreover, a panel of lncRNAs were found to be specifically expressed in the adult brain and/or embryonic-stem derived NSC (ES-NSC), suggesting a potential role for them in the development of the CNS. In particular, lincBRN1a, lincBRN1b, FABL, FENDRR, HAUNT, lincp21 and TUG1 were found to be expressed in ES-NSCs, implicating them in the biology and cellular function of ES-NSCs [Citation16]. Furthermore, two lncRNAs, lincBRN1a and lincBRN1b, have been strongly correlated to neural development processes in murine knockout models [Citation18]. This might be due to their potential regulation of the neighbouring Pou3f3 locus, which has been shown to have a role in coordinating neurogenesis and cortex development [Citation19]. Indeed, the two lncRNAs present specific expression patterns in the adult brain. They have complementary expression in the cerebral cortex, where lincBRN1a is strongly expressed in layers II/III–IV and at lower levels in layers V–VI and lincBRN1b is mainly expressed in layer V. Furthermore, lincBRN1a and lincBRN1b have been shown to be expressed in the hippocampus and in the medial habenular nucleus, respectively [Citation18].
The roles that lncRNAs play at a cellular level are often favoured by the interaction with partner proteins, which guide their ability to activate or repress gene expression or to post-transcriptionally regulate other RNAs [Citation15]. Even so, very little is known about their post-transcriptional and half-lives’ regulation [Citation20]. Indeed, the mechanism by which their own turnover is regulated is still largely unexplored, and some evidences suggest that a similar mechanism to the cis-trans, mRNA UTR-RNA-binding protein (RBP) interaction could take place [Citation20]. HuR/ELAV1 (Human Antigen R; HuR) is a member of the RBP ELAV (embryonic lethal abnormal version) family, well studied for its role in RNA splicing and mRNA post-transcriptional regulation [Citation21–Citation23]. HuR has recently been correlated to stem cells’ pluripotency for its interaction with lncRNAs, such as linc-MD1, which is involved in muscle development [Citation24]. HuR has also been reported to influence lincp21’s decay in mouse fibroblasts, where this interaction has been proposed to regulate the translation of a subset of target mRNAs [Citation25,Citation26]. Furthermore, HuR is able to influence the stemness state of mesenchymal stem cells by regulating the mRNA turnover of the SOX2 master gene [Citation27]. Less is known about the regulatory pathways in which HuR and lncRNAs are involved, and their molecular mechanisms of action, particularly in neural precursor cells’ differentiation.
Here, we aimed to investigate the potential role of HuR’s binding to specific lncRNAs during neural development. In particular, we focused on 11 lncRNAs (lincENC1, FABL, lincBRN1a, lincBRN1b, lincp21, HOTTIP, HAUNT, TUG1, PERIL, FENDRR and Mdgt) which have been selected for their role in murine development [Citation16]. We describe their interaction with the RBP HuR, and we investigate the role that HuR plays in regulating their half-life during NSCs differentiation. Moreover, we report that the silencing of two of them (lincBRN1a and lincBRN1b) and the inhibition of HuR’s activity (by siRNA or by using the specific inhibitor dihydrotashinone) leads to the increase in differentiation potential of NSCs, suggesting a role for the interaction in the maintenance of the NSCs’ stemness state.
Materials and methods
Chemicals and antibodies
Di-hydrotashinone (DT, 1 µM, D0947, Sigma-Aldrich); actinomycin-D (1 μg/ml, CID 2019, Sigma-Aldrich); thiazolyl blue tetrazolium bromide – MTT (M2128, Sigma-Aldrich); anti-Nestin (MAB353, Millipore); anti-DCX (sc8066, Santa Cruz); anti-HuR (390,600, Invitrogen); anti-βTubIII (MMS-435P, Covance); anti-MAP2 (Ab5622, Millipore); anti-GFAP (PRB571c, Covance); anti-GalC (Mab 342, Millipore); anti-Olig2 (Ab9610, Millipore); pluripotent stem cells 4-Marker Immunocytochemistry Kit (A24881, Thermo Fisher); 4,6, diamino-2-phenyl-l-indole di-hydrocloride–DAPI (D259542, Sigma-Aldrich), Alexa Fluor® 488 (Life Technologies) Alexa Fluor® 546 (Life Technologies), cresyl-violet (Sigma-Aldrich), Peroxidase AffiniPure Goat Anti-Rabbit/Mouse IgG (Jackson).
Primary cells isolation and differentiation
NSCs were obtained from 6-week-old CD-1 albino mice; their isolation, growth and characterization were performed following an already described protocol [Citation28,Citation29]. Briefly, cells were isolated from the subventricular zone (SVZ) of adult male mice (CD-1) immediately after their sacrifice by cervical dislocation. Brains were removed and tissues containing the SVZ region were dissected, transferred to Earl’s Balanced Salt Solution (Life Technologies) containing 1 mg/ml papain (27 U/mg; Sigma-Aldrich), 0.2 mg/ml cysteine (Sigma-Aldrich), and 0.2 mg/ml EDTA (Sigma-Aldrich) and incubated for 45 min at 37°C on a rocking platform. Tissues were then transferred in DMEM–F12 medium (Euroclone), and mechanically dissociated with a pasteur pipette. Cells were collected by centrifugation (200 g, 10 min, room temperature), and re-suspended in DMEM–F12 medium (Euroclone) containing 2 mm l-glutamine (Euroclone), 0.6% glucose (Sigma-Aldrich), 9.6 gm/ml putrescine (Sigma-Aldrich), 6.3 ng/ml progesterone (Sigma-Aldrich), 5.2 ng/ml sodium selenite (Sigma-Aldrich), 0.025 mg/ml insulin (Sigma-Aldrich), 0.1 mg/ml transferrin (Sigma-Aldrich), and 2 μg/ml heparin (sodium salt, grade II; Sigma-Aldrich), bFGF (human recombinant, 10 ng/mL; Life Technologies) and EGF (human recombinant, 20 ng/mL; Life Technologies). NSCs precursors were maintained in culture in the previously mentioned medium. Differentiation of NSCs was performed by plating the dissociated stem cells at the density of 15,000 cells/cm2 in the presence of adhesion molecules (Matrigel™, BD Biosciences), and bFGF (10ng/ml) for 48 h, then cells were exposed to the same medium without bFGF and with the addition of fetal bovine serum (2% vol/vol; Euroclone) for the following 5 days as previously described [Citation29]. The extent of differentiation was then determined by immunocytochemistry [Citation29]. To inhibit HuR’s interaction with target RNAs cells were treated with dihydrotashinone (DT) 1 μM (Sigma-Aldrich D0947) [Citation30].
Tissue collection and processing, histology and immunohistochemistry
Animals were anaesthetized by intraperitoneal injection of 4% cloralium hydrate (Sigma-Aldrich) in distilled water, and perfused with 4% paraformaldehyde (Sigma-Aldrich) in phosphate buffer (PBS) (Life Technologies) 0.1 M pH 7.4 by trans-cardiac perfusion. Brains were dissected and post-fixed overnight in the same fixative, cryoprotected with 30% sucrose (Sigma-Aldrich), quickly frozen, stored at −80°C, and sectioned by means of a cryostat (CM 1850, Leica Microsystems). Sections (20 µm) were rinsed with PBS, treated with blocking solution (Life Technologies) and incubated with the appropriate primary antibody with antibodies against Nestin (monocl. 1:200; Millipore MAB353); doublecortin (DCX, polycl. 1:500; Santa Cruz sc8066); HuR (monocl. 1:250; Invitrogen 390,600); Glial Fibrillary Acidic Protein (GFAP, polycl. 1:1000; Covance PRB571c) overnight at 4°C. The sections were then washed with PBS and incubated with appropriate secondary antibodies (Alexa Fluor® 488 and 546, Life Technologies) for 2 hat room temperature. Sections were then washed in PBS, nuclei were stained with DAPI (1 µg/ml final concentration, 10 min at room temperature), mounted using the FluorSave Reagent (Calbiochem, Merck Chemical, Darmstadt, Germany), and analyzed by confocal microscopy (Confocal laser scanning microscopy platform Leica TCS SP8, Leica Microsystems). In control determinations, primary antibody was omitted and replaced with equivalent concentrations of unrelated IgG of the same subclass. The ImageJ software was used for microphotographic digital analysis. The positive pixels were quantified against the negative background eliciting an index score which includes fibres and neuronal bodies. The microscope light intensity of the laser was the same for all analyzed sections and for determining the background optical density. For the quantification of positive cells, the number of cells positive to the staining was counted with respect to the total nuclei number. For cresyl violet staining sections (20 µm) were rinsed thoroughly with PBS and stained for 10 min with pre-heated cresyl-violet (Sigma-Aldrich). Sections were then left to cool down and subsequently immersed in 95% ethanol for 5 min. Slides were then left to dry and inserted in isopropanol for 3 min and then placed in xylene for another 3 min and then covered with a coverslip.
Immunocytochemistry analysis
Cells were seeded on ethanol-washed glass coverslips, maintained in the appropriate culture medium, and then processed for immunocytochemistry following already described protocol [Citation29]. Briefly, cells were fixed with 4% paraformaldehyde in PBS (Life Technologies) 0.1 M pH 7.4 for 10 min at room temperature, and then washed with PBS. The coverslips were incubated overnight at 4°C in PBS containing 10% normal goat serum (NGS, Thermo Fisher), 0.3% Triton X-100 (BDH), and the appropriate primary antibody. Cells characteristics were assessed by immunocytochemistry with antibodies against Nestin (monocl. 1:200; Millipore MAB353); Doublecortin (DCX, polycl. 1:500; Santa Cruz sc8066); HuR (monocl. 1:250; Invitrogen 390,600); βTubIII (monocl. 1:500; Covance; MMS-435P); Microtubule-Associated Protein 2 (MAP2, polycl. 1:1000; Millipore Ab5622); Glial Fibrillary Acidic Protein (GFAP, polycl. 1:1000; Covance PRB571c); Galactocerebrosidase (GalC, monocl. 1:200; Millipore, Mab 342); Olig2 (polycl. 1:500; Millipore Ab9610). After thorough washing with PBS and 10% NGS, cells were reacted for 45 min (room temperature) with the appropriate secondary antibody (Alexa Fluor® 488 and 546, Life Technologies). Nuclei were stained with DAPI (1µg/ml final concentration, 10 min at room temperature) mounted using the FluorSave Reagent (Calbiochem, Merck Chemical, Darmstadt, Germany), and analyzed by confocal microscopy (Confocal laser scanning microscopy platform Leica TCS SP8, Leica Microsystems). In control experiments, primary antibodies were omitted and replaced with equivalent concentrations of unrelated IgG of the same subclass. For the iPSCs characterization, the Pluripotent Stem Cells 4-Marker Immunocytochemistry Kit was used (Thermo Fisher A24881). The ImageJ software was used for microphotographic digital analysis. The positive pixels were quantified against the negative background eliciting an index score which includes fibres and neuronal bodies. The microscope light intensity of the laser was the same for all analyzed sections and for determining the background optical density. For the quantification of positive cells, the number of cells positive to the staining was counted with respect to the total nuclei number.
Colorimetric assay for mammalian cells survival
MTT assay was performed as described by Slikker and colleagues [Citation31]. Briefly, 15,000 cells/well were seeded in 48-wells plate and differentiated or not, following the previously described protocol [Citation29]. Cells were treated or not with 1 μM DT or silenced for HuR’s expression for 24 h before testing. Ensight™ multimode plate reader (Perkin Elmer) was used to measure absorbance at 560 nm.
RNA immunoprecipitation (RIP)
RIP was performed as reported in Latorre et al. 2016 [Citation27] . Briefly, cells were cultured in the different experimental conditions (NSCs grown in floating conditions treated or not with DT, and differentiated NSCs treated or not with DT) and at the end of the treatments were syringed with a U-100 insulin needle in 500 µl lysis NT2 buffer (50 mM tris-HCl pH7.7, 150 mM NaCl, 1 mM MgCl2; 0.05% NP40, 1 U/µl RNase IN, 20 mM DTT, 1% BSA, Protease inhibitor cocktail) chilled at 4°C. Lysate was centrifuged at 10,000 g for 10 min then the supernatant was pre-cleared by interaction with protein-A-coated agarose beads (equilibrated in NT2 buffer) overnight at 4°C in constant shaking (100 µl slurry beads/500 µl lysate). 150 µl of the pre-cleared lysate was then incubated with protein A-coated agarose beads anti-HuR antibody (or control unrelated IgG) conjugated for 6 h at 4°C and then washed twice in NT2 buffer. 20 µl protein A-coated slurry agarose beads were conjugated with 4 µg antibody at room temperature for 2 h, washed and equilibrated in NT2 lysis buffer before use. RNA was isolated from the different samples (immunoprecipitated anti-HuR, unrelated IgG and precleared input) using TriZol Reagent (Invitrogen) following standard protocol. The RNA quality was assessed using a spectrophotometer (NANOPhotometer® NP80, IMPLEN) and visualized on agarose gel. Total RNA (1 μg) was reverse transcribed using iScript cDNA synthesis kit (Bio-Rad) following the manufacturer’s instructions and used as template for Real-Time RT-PCR analysis [Citation27]. Real-Time RT-PCR was performed with StepOnePlusTM Real-Time PCR System (Thermo Fisher) using iQ SYBR Green Supermix (Bio-Rad). Genes were quantified in triplicates, and the results were analyzed as fold enrichment relative to unrelated IgG, used as IP negative control. Fold enrichment was calculated using the 2−ΔΔCt method, with respect to unrelated IgG.
Real time-PCR
Total RNA from cultured cells and tissue samples was isolated using TRIzol Reagent (Invitrogen) following standard protocol. The RNA quality was assessed using a spectrophotometer (NANOPhotometer® NP80, IMPLEN) and visualized on agarose gel. Total RNA (1 μg) was reverse transcribed using iScript cDNA synthesis kit (Bio-Rad) according to the manufacturer’s instructions. Using gene sequences available from NCBI for target genes (www.ncbi.nlm.nih.gov/nucleotide) PCR oligonucleotide primers for target genes were selected. This was done with the NCBI’s Primer-BLAST tool (Supplementary Table 1). Real-Time PCR was performed with StepOnePlusTM Real-Time RT-PCR System (Thermo Fisher) using iQ SYBR Green Supermix (Bio-Rad). Genes were quantified in triplicates, m-GAPDH was used as housekeeping gene for mouse samples and h-GAPDH was used as housekeeping gene for human samples. Gene expression was calculated using the 2−ΔΔCt method.
Gene silencing
Cells were silenced for HuR, lincBRN1a and lincBRN1b by transient transfection with commercially available siRNA (HuR MU00109-1 Sigma-Aldrich; lincBRN1a SIL. SEL. PRE-DSG. SIRNAn516613 and n254090 Life Technologies; lincBRN1b SIL. SEL. PRE-DSG. SIRNAn397945 and n397954 Life Technologies). MISSION® siRNA Universal Negative Control was used in Mock samples (SIC001). Transfection was performed using Lipofectamine™ RNAiMAX (Invitrogen) following the manufacturer’s instructions. Both in NSCs state and in differentiation conditions the silencing lasted for 7 days and siRNA molecules were added to the medium every 48 h.
Mutagenesis and luciferase activity
LncRNA sequences containing HuR-binding sites (lincBRN1a: GAGGTATTTGAAAGGCAATCAGCCCGACCGTCCCCCTAGA; lincBRN1b: TATTAAAATAATAGTAATAAAAATAAGAATAATAATTAAA) were synthesized as double-strand DNA by Life Technologies manufacturer. They were then cloned into a pMirTarget plasmid (Origene, Rockville, MD). Plasmid 3ʹUTR SOX2 was used as control [Citation27]. The Pierce Firefly Luciferase Flash Assay Kit (Sigma-Aldrich) was used according to manufacturer’s instructions 24 h after transfection with Lipofectamine™ 2000 (Invitrogen).
Western blot
Cell protein extracts were obtained by means of RIPA lysis buffer. Equal amounts of solubilized proteins were heated in Laemmli sample buffer (Bio-Rad) containing 2-βmercaptoethanol (70 mM, Sigma), separated by SDS-PAGE gel 10% and electroblotted onto a nitrocellulose membrane (GE Healthcare, Amersham™). Membranes were then blocked in 5% slim milk (diluted in TBS with 0.05% Tween-20) and probed with the appropriate primary antibody against HuR (monocl. 1:200; Invitrogen 390,600); β-actin (monocl 1:1000; Sigma-Aldrich A1978) overnight at 4°C. The membrane was then incubated with specific secondary antibody Peroxidase AffiniPure Goat Anti-Rabbit/Mouse IgG (1:10,000 dilution; Jackson). Proteins were visualized by means of an enhanced chemiluminescence detection system (ECL™, Amersham, Arlington Heights, IL). After acquisition by a GelDocTM image capture system (Kodak), the proteins present on the nitrocellulose membrane were quantified using ImageJ software.
iPS obtainment and differentiation to neural stem cells
About 5 × 10⁵ PBMCs were cultured for 4 days in 24-well plates in PBMCs medium (StemPro™-34 + SCF 100 ng/mL, FLT-3 100 ng/mL, IL-3 20 ng/mL, IL-6 20 ng/mL). Cells were transfected using viruses provided by CytoTune®-iPS 2.0 Sendai Reprogramming Kit (Invitrogen). After 24 h, the medium was replaced with fresh complete PBMCs medium to remove the CytoTune™ 2.0 Sendai reprogramming vectors. After 2 days, cells were plated on vitronectin-coated culture dishes in complete StemPro™-34 medium (Invitrogen) and the spent medium was replaced every day for 4 days. After 7 days from transfection, the StemPro™-34 medium was replaced in Essential 8 Medium (Invitrogen) changing it every day for 3 weeks. Undifferentiated colonies were manually picked and plated on vitronectin-coated well (Invitrogen). Colonies were split using 0.5 mM EDTA for five passages. At passage 6, the differentiation was started by replacing essential 8 medium with PSC neural induction medium (neurobasal medium supplemented with Neural Induction Supplement, Invitrogen). After 7 days, iPSCs differentiated into NSCs. NSCs were then differentiated into Neurons for the following 8 days (Neurobasal Medium supplemented with B-27, Invitrogen).
Statistical analysis
Data are expressed as mean ± SD. When only two value sets were compared, the statistical analysis was performed with Student’s t-test. When three or more value sets were analyzed, one-way ANOVA was used and Bonferroni’s post-test was applied. The Prism 5 software (GraphPad Software Inc., La Jolla, CA) was used assuming a P value less than 0.05 as the limit of significance.
Results
LncRNAs expression levels change during neural differentiation of primary NSCs in vitro
In this work, we decided to investigate the expression of a panel of 11 lncRNAs in neural differentiation. These lncRNAs have been investigated in murine knock out models and have been shown to be necessary for life and correct development [Citation16]. The aim was to investigate the role that they play in neural development, analyzing their expression levels in NSCs and during the differentiation process. NSCs are neural precursor cells derived from the sub-ventricular zone (SVZ), a neurogenic niche present in the adult mouse brain [Citation32,Citation33]. When cultured in standard medium, in absence of serum and in presence of growth factors (bFGF 20 ng/ml and EGF 20 ng/ml) [Citation28], NSCs form spheroid-shaped floating cell aggregates named neurospheres. Neurospheres can be dissociated and induced to differentiate when plated in differentiation media, following a specific time schedule and in the presence of an adhesion substrate (Matrigel™) [Citation28,Citation29]. To investigate the expression of the 11 lncRNAs during the differentiation process samples were collected at day 1, 3 and 8 (Supplementary Figure 1(a)). Our results report that lincENC1, FABL, lincp21, HAUNT and PERIL were down-regulated during neural differentiation () and Supplementary Figure 1(b)), whilst lincBRN1a, lincBRN1b, TUG1 and FENDRR showed the opposite behaviour () and Supplementary figure 1(b)). HOTTIP is not significantly deregulated suggesting that it probably does not have a strong implication in this process, and Mdgt was not expressed, in line with previous literature which demonstrated that this lncRNA is not particularly expressed in the brain and in ES-NSCs () and Supplementary figure 1(b)) [Citation16]. GAPDH was used as an endogenous control.
Figure 1. Expression analysis of a pool of lncRNAs during mice NSCs differentiation
LincBRN1a and lincBRN1b have a role in stemness’ maintenance
We decided to focus on the role of two lncRNAs, lincBRN1a and lincBRN1b, in the differentiation of NSCs, analyzing more in depth their possible targets. Indeed, the role of lincBRN1a and lincBRN1b in brain development has already been characterized in murine knock out models, providing a solid scientific basis for our subsequent analyses [Citation18]. Our aim was to characterize this process at a more microscopic level, investigating what happens at a cellular level. To do so, we silenced lincBRN1a and lincBRN1b and evaluated the effect that they play in NSCs and during the differentiation process. We thus performed neurospheres formation assays and NSCs differentiation assays both in standard conditions (mock) and in the presence of siRNAs for the two lncRNAs (siBRN1a.1, siBRN1a.2; siBRN1b.1, siBRN1b.2). The efficiency of the silencing was evaluated by means of Real Time-PCR (Supplementary figure 2(a)). In NSCs, all the four siRNAs were efficient in silencing the two investigated lncRNAs (Supplementary Figure 2) and were used for further experiments (Real Time-PCR and immunofluorescence analysis). NSCs maintained in standard stem cell medium and silenced for these lncRNAs were still able to aggregate and form neurospheres ()) which, after 7 days of lincBRN1a and lincBRN1b’s silencing, resulted significantly increased in number, for all silencing except for the one involving siBRN1a.1 ()). Similarly, the neurospheres’ dimension resulted significantly increased when silenced with siBRN1a.2 and siBRN1b.1 () and Supplementary Figure 2(b)).
Figure 2. Silencing of lincBRN1a and lincBRN1b in NSCs
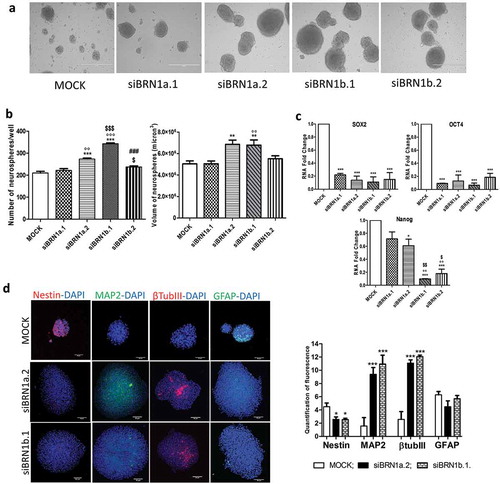
Stemness markers SOX2, Nanog and OCT4 were all reduced in conditions silencing lincBRN1b, and SOX2 and OCT4 were also reduced when siBRN1a was silenced ()). Immunofluorescence analysis showed that when either lincBRN1a or lincBRN1b were silenced there was a reduction in the expression of neural precursor marker Nestin, and an increase in neuronal markers MAP2 and βTubIII. Astrocyte marker GFAP remained unchanged ()).
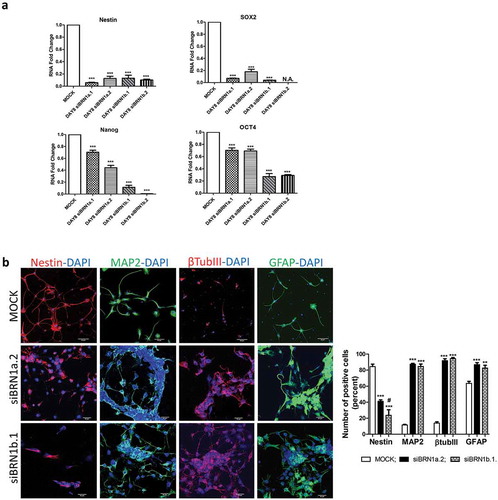
NSCs were then induced to differentiate both in standard conditions (mock) and in the presence of siRNAs for the lncRNAs (siBRN1a.1, siBRN1a.2, siBRN1b.1 and siBRN1b.2) and, under silencing conditions, NSCs were still able to differentiate (Supplementary Figure 3(a)). The silencing was efficient for all four siRNAs, with an efficiency of 90% for siBRN1a.1 and siBRN1a.2 and an efficiency of 75% for siBRN1b.1 and siBRN1b.2 (Supplementary Figure 3(b)). Both stemness (SOX2, Nanog and OCT4) and neural precursors (Nestin) markers resulted reduced after 8 days of differentiation in the presence of the silencing ()). By immunofluorescence analysis we investigated the expression of classical neural differentiation markers and we found that, when the expression of lincBRN1a and lincBRN1b was inhibited, this resulted in an increase in neuronal markers (MAP2 and βTubIII), an increase in the astrocyte marker GFAP and a decrease in the expression of neural precursor marker Nestin ()). Together, these results show that the absence of lincBRN1a and lincBRN1b leads to an increase in the differentiation ability of NSCs, suggesting their implication in the maintenance of cellular stemness.
Figure 3. Silencing of lincBRN1a and lincBRN1b in differentiated NSCs
The RBP HuR binds to lncRNAs both in neurospheres and during neuronal differentiation
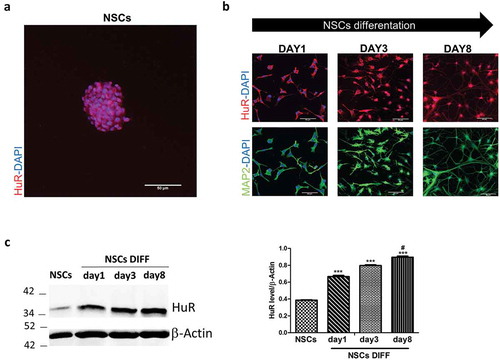
LncRNAs often exert their roles in concomitance with partner proteins that guide their ability to activate or repress gene expression or to post-transcriptionally regulate other RNAs. The RBP HuR has recently been correlated to stem cells’ pluripotency in muscle differentiation in relation to the lncRNA MD1 [Citation24], and to this end, we decided to investigate whether HuR possibly interacts with the panel of lncRNAs that were found deregulated during NSC differentiation. HuR’s expression was investigated by immunofluorescence analysis in the subventricular zone (SVZ) of adult mouse brain, from which NSCs were isolated. The protein results notably expressed in this brain area (Supplementary Figure 4(a)), and the immunofluorescence analysis shows that HuR in this region co-localizes mostly with Nestin and Doublecortin (DCX), markers of neural precursor cells, but not with Glial Fibrillary Acidic Protein (GFAP), an astrocyte marker (Supplementary Figure 4(b)). Neurospheres also show a strong expression of HuR ()). NSCs were then differentiated for 8 days and the expression of microtubule associated protein (MAP2), a neuronal-specific marker, was evaluated by immunofluorescence in order to verify neuronal differentiation ()). HuR’s expression is significantly increased throughout the in vitro differentiation process, as shown both with immunofluorescence and western blot analysis (,)) [Citation28,Citation29].
Figure 4. HuR’s expression in mouse brain stem cell niches and during mice NSCs differentiation in vitro
A bioinformatics analysis was performed in order to investigate the presence of potential HuR-binding sites in the lncRNAs sequences and three different in silico approaches were used ()). Firstly, the RNA-Protein Interaction Prediction (RPISeq, http://pridb.gdcb.iastate.edu/RPISeq/) was used to test the possible interaction between the lncRNAs and HuR. A score >0.5 was considered ‘positive’ (following the guidelines provided by the website) for a possible interaction (YES) and all the lncRNAs showed a possible interaction with the RBP. Secondly, the RBPmap database (http://rbpmap.technion.ac.il/1541972084/results.html) was used to identify the number of potential interaction sites obtained with a ‘high stringency’ filter. All of the lncRNAs analyzed have at least 1 potential binding site for HuR, except for lincBRN1a. However, when a low stringency was applied, 2 potential binding sites for HuR were found also in lincBRN1a. Lastly, the lncRNAs sequences were aligned to the RNAbp database (RBPDB, http://rbpdb.ccbr.utoronto.ca/index.php) [Citation34]. This database allows for identification of all potential RNAbp-binding sites, using a default threshold score of 0.8 (indicated by the website as the optimal cut-off in order to have a ‘confident’ score of the lncRNAs-protein interaction). All the RNAs analyzed showed confident HuR-binding sites, ranging from 3 to 69, which presented to be analogous to the U-rich sequences bound by HuR. This last database only allows for comparison with the human HuR, which is however conserved between species. Together, the three approaches demonstrated a real potential interaction between the lncRNAs and HuR.
Figure 5. LncRNAs and HuR interact and this interaction influences lncRNAs’ expression
We then decided to validate in vitro these in silico observations, and we tested HuR’s binding to the full investigated panel of lncRNAs in neurospheres condition and after differentiation (day 8) by RNA-immunoprecipitation-assay (RIP) ()). HuR binds to lincENC1, FABL lincp21, HAUNT, and PERIL when in NSCs state; instead, lincBRN1a, lincBRN1b, HOTTIP, TUG1 and FENDRR were mostly found bound to HuR after differentiation. The results seem to indicate that HuR binds more copy numbers of the investigated lncRNAs at the time-point when these are more expressed, suggesting a possible sponging mechanism of action for the RNAbp during the differentiation process.
HuR’s activity is involved in neurospheres formation and maintenance of stemness
In order to evaluate HuR’s role in neurospheres formation and NSCs differentiation, we tested the effects of its inhibition both by molecular means, with siRNA molecules, and by pharmacological means, with dihydrotanshinone (DT 1µM), an RNA-HuR interaction interfering agent [Citation30,Citation35]. NSCs were maintained in stem cell medium for 8 days in either standard conditions (mock), in the presence of siHuR or in the presence of DT, to evaluate their ability to form neurospheres (), Supplementary Figure 5(a)). The siRNA molecule efficiently inhibited HuR’s expression by 85% (Supplementary Figure 5(b)). NSCs formed neurospheres presenting different morphology when either siHuR or DT was added to the culture medium (Supplementary figure 5(a)). Indeed, the presence of DT leads to the inability of NSCs to form neurospheres, as they remained in a single cell state (Supplementary Figure 5(c)), and for this reason, no further studies were performed. Even so, the viability assay shows no toxicity in either of the two conditions (Mock, siHuR or DT) indicating that HuR’s inhibition does not lead to cell death (Supplementary Figure 5(d)). HuR’s silencing caused the downregulation of stemness master genes, such as SOX2, NANOG and OCT4 (Supplementary Figure 5(e)) and the neurospheres formed were decreased both in number and dimensions (Supplementary Figures 5(f,g)). HuR’s silencing induced the up-regulation of MAP2 and βTubIII (neuronal markers) together with the down-regulation of Nestin (neural precursor marker) and GFAP’s (astrocyte marker) expression in NSCs ()). This indicates that HuR’s silencing leads to a differentiation of NSCs, suggesting a role for HuR in the maintenance of neurospheres’ stemness.
Figure 6. HuR’s inhibition and silencing in neurospheres and in differentiated NSCs
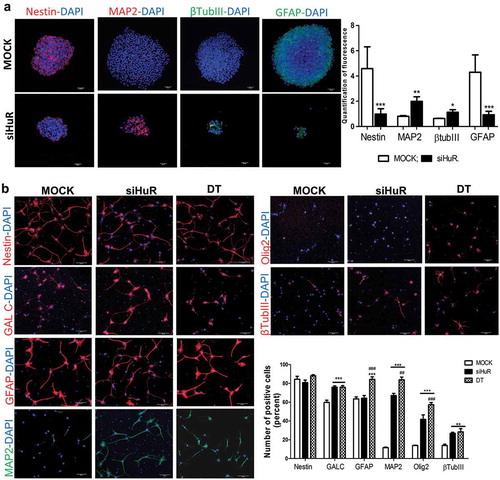
NSCs were then differentiated following the previously described 8-day protocol, and the effects of HuR’s inhibition by pharmacological (DT) and molecular (siHuR) means were evaluated. In all three conditions (mock, siHuR and DT), NSCs were able to differentiate into neurons (), Supplementary 6(a)) and maintained their vitality (Supplementary figure 6(b)). Immunofluorescence analysis showed that DT treatment and HuR’s silencing during the differentiation procedure lead to an up-regulation of cells positive to both neuronal markers (MAP2 and βTubIII) and to oligodendrocytes markers (GALC and Olig2). GFAP (astrocyte marker) positive cells increased only during DT treatment, whilst Nestin (neural precursor marker) positive cells remained constant during both DT treatment and HuR’s silencing ()). Together, these results suggest that HuR is necessary to maintain the cell stemness state, and its silencing or pharmacological inhibition induces an early reprogramming of NSCs towards a neuronal precursors commitment.
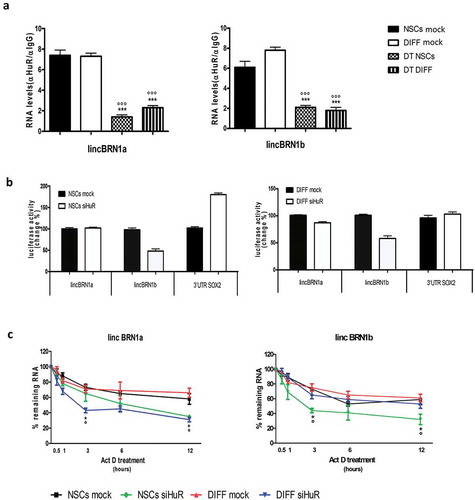
HuR regulates the stability of lincBRN1a and lincBRN1b both in neurospheres and during neuronal differentiation
We decided to further investigate the role that HuR has in regulating the stability of lincBRN1a and lincBRN1b. RIP assay was performed in neurospheres and after differentiation (day 8) in the presence or absence of DT ()). DT treatment decreased the expression levels of lincBRN1a and lincBRN1b in NSCs and at the end of the 8-day differentiation process (), Supplementary Figure 7). To further investigate the role of HuR’s binding in regulating the lncRNAs homeostasis, we performed a reporter assay in which the investigated U-Rich sequences (see Materials and Methods section for specific sequences) were cloned into a luciferase reporter plasmid mimicking the 3ʹUTR of the luciferase cDNA ()) [Citation27]. The constructs were tested in both stemness and differentiation conditions in presence of HuR’s ablation (siHuR). The results showed that U-Rich elements present in lincBRN1b are necessary for luciferase activity together with HuR’s expression in stem cells status. Furthermore, the same elements in lincBRN1b, and to a modest extent in lincBRN1a, are necessary in the differentiated status ()). Actinomycin-D, an inhibitor of transcription [Citation36], was added both to neurospheres and to differentiated NSCs. This resulted in a gradual modification of the decay rate of the investigated lncRNAs ()). The RNA expression levels were monitored at 30 min, 1, 3, 6, and 12 h after actinomycin-D treatment in the presence or absence of HuR’s molecular down-regulation (siHuR). Actinomycin-D is a transcription inhibitor, and thus its addition to the cell’s growing medium allows to investigate the decay rates of the RNA molecules. HuR’s silencing resulted in different modulations of the lncRNAs decays relatively to the cellular differentiation status. LincBRN1a is affected both in NSCs and during differentiation. Specifically, in the NSCs state, the half-life decreases from being over 12 h to 6 h 24 min when HuR is silenced, indicating that HuR has a role in stabilizing this lncRNA. Similarly, during differentiation, HuR’s silencing decreases lincBRN1a’s half-life from over 12 h to 2 h 43 min. HuR’s downregulation increases lincBRN1b’s decay rate in NSCs state. In this case, the decay rate decreases from over 12 h to 2 h 49 min. Results suggest that HuR’s binding to the different lncRNAs plays different roles depending on cell status (neurospheres or differentiated neurons). This may suggest for a time-dependent role of these lncRNAs during the neuronal differentiation process.
Figure 7. Investigation of the interaction between HuR and lincBRN1a/lincBRN1b
Murine lncRNAs present human homologues and four of these are deregulated during iPSCs’ differentiation
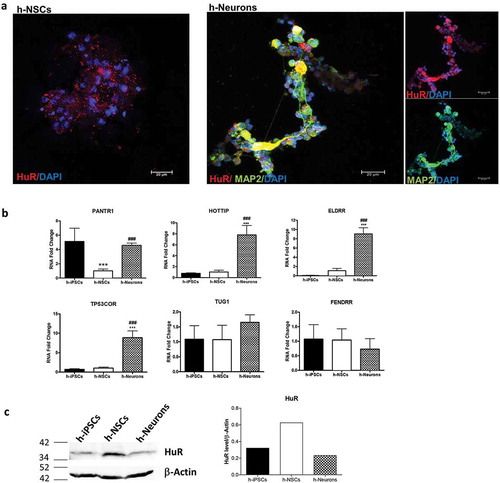
For the panel of lncRNAs investigated, the presence of human homologues was evaluated according to NCBI guidelines and according to Mouse Genome Database (http://www.informatics.jax.org/marker/MGI:3780541). When no homology was detected, sequence-based similarity was evaluated using Blast online tool. Human homologues were found for lincENC1 (Human name: LINC01157), ELDRR (Human name: ELDRR), lincBRN1a (Human name: PANTR1), lincp21 (Human name: TP53COR), HOTTIP (Human name: HOTTIP), TUG1 (Human name: TUG1) and FENDRR (Human name: FENDRR) (). For the ones for which it was possible to obtain a reference sequence and thus design primers, subsequent analyses were performed. These were: PANTR1, TUG1, HOTTIP, TP53COR, ELDRR and FENDRR. To investigate the role for these homologues in human stem cells, induced pluripotent stem cells (iPSCs) were obtained from PBMCs of n = 3 healthy subjects and then induced to differentiate, firstly into NSCs and then into neurons. Immunofluorescence analysis demonstrated positivity to stemness markers SSEA4, OCT4, SOX2 and TRA-1–60 (Supplementary Figures 8(a,b)). RT-PCR analysis shows the presence of the virus injected SeV, Klf4, c-Myc and KOS, indicating successful reprogramming (Supplementary Figure 8(c)). The expression of the lncRNAs was then evaluated in the pluripotency state (iPSCs) and during their differentiation to neural precursors (h-NSCs) and then neurons (h-Neurons) ()). Whilst HOTTIP, TP53COR, ELDRR, TUG1 and FENDRR showed no significant deregulation, PANTR1 was significantly downregulated in h-NSCs. During neuronal differentiation, HOTTIP, TP53COR, ELDRR and PANTR1 expression was increased. No significant deregulation was found for TUG1 and FENDRR. Furthermore, HuR is present in iPSCs, h-NSCs and h-Neurons, as shown by immunofluorescence and western blot analysis ().
Table 1. Identification of human homologues of murine lncRNAs
Figure 8. Expression of HuR and human homologues of lncRNAs during neuronal differentiation of h-iPSCs
Discussion
In recent years, our understanding of the molecular mechanisms regulating adult NSCs (NSCs) specification, proliferation and differentiation has increased, with several works focusing their efforts on the comprehension of these mechanisms [Citation2–Citation4,Citation13,Citation37]. lncRNAs are a class of RNA molecules, and although not much is known concerning their mechanism of action, they seem to be necessary for correct cellular functioning. Indeed, the genetic ablation of certain lncRNAs implies strong cellular and developmental dysfunctions [Citation38,Citation39]. Aberrant lncRNA expression has been associated with some of the most devastating neurological diseases including glioma [Citation40], schizophrenia [Citation41], Alzheimer’s disease [Citation42], developmental delay [Citation43], and autism [Citation44]. Moreover, analyses performed in some specific cell lineage or in pathologic CNS conditions, such as schizophrenia, report that the expression of lncRNAs is dynamically regulated during CNS development NSCs differentiation [Citation45,Citation46]. Furthermore, the state of activation in neurons is responsible for their regulation [Citation41,Citation47]. To dissect the functional and physiologic role of lncRNAs, loss-of-function and gain-of-function experimental approaches are required. Following these approaches, it has been possible to clarify crucial processes in which these molecules are involved, such as XIST, which exerts a fundamental role in the random inactivation of the X chromosome [Citation48], Air which is crucial for imprinting control at the Igf2r locus [Citation49], HOTAIR that controls the expression of the HOXD gene family [Citation50], and HOTTIP that affects the expression of the HOXA gene family [Citation17]. It has been shown that specific lncRNAs are necessary for mouse brain development and NSCs differentiation [Citation16]. Here, we firstly report the presence of a global deregulation in this panel of lncRNAs (lincENC1, FABL, lincBRN1a, lincBRN1b, lincp21, HOTTIP, HAUNT, TUG1, PERIL and FENDRR) during NSCs’ differentiation into neural precursors, thus suggesting a role for them in this process. We then decided to investigate the role that two lncRNAs, lincBRN1a and lincBRN1b, play at a cellular level, in order to gain insights into what could be the molecular pathway in which they are involved. Indeed, their importance in macroscopic brain development has already been characterized in murine models, where lincBRN1a and lincBRN1b have been shown to be expressed in specific layers of the cerebral cortex, in the hippocampus (lincBRN1a) and in the habenular nucleus (lincBRN1b) [Citation18]. In mice, lincBRN1a and lincBRN1b are flanking both sides of the POU-domain gene family member Pou3f3 (Brn1), a key transcription factor involved in cortical development [Citation19,Citation51]. LincBRN1b shares a bidirectional promoter with Pou3f3, whereas lincBRN1a is located ∼13.2 kb downstream of Pou3f3 in the opposite orientation [Citation18]. These two lncRNAs have been investigated during mouse brain development and have been shown to be specifically and dynamically regulated in the adult brain [Citation18]. Transcriptome analysis of the whole brain at E14.5 in specific knock out animals revealed that the ablation of the Pantr1 locus resulted in significant up-regulation of some neuronal progenitor markers such as Nestin, Notch1, Pax3, and Pax6, and significant down-regulation of mature neural cell-type markers including many canonical astrocyte markers such as Gfap, S100b, Aldh1l1, Fabp7, and Gap43 [Citation18].
Here, we demonstrated that these are also present in NSCs isolated from the SVZ, and that their expression levels increase during neuronal differentiation. By silencing means, we demonstrated that the loss of the two lncRNAs, both in neurospheres state and during the differentiation process, leads to a strong induction of the differentiation process, with an increase in neuronal markers and a decrease in stemness markers. This indicates a potential role for the two lncRNAs in the maintenance of the stemness process, as they could be crucial regulators of genes involved in neuronal differentiation. Analyses performed in the adult brain of knock out mice suggested to Goff and co-workers that these two lncRNAs have a strikingly different expression pattern in the adult brain [Citation18]. More in-depth analysis, with tools such as RNAseq and gene expression modulation experiments, is however needed to identify the specific targets of these lncRNAs. Even so, our second aim was to find a potential interactor through which these lncRNAs could exert their functions. HuR is a well-characterized RBP promoting cellular proliferation and involved in mRNA splicing and stabilization [Citation21–Citation23]. This protein is present within the cell in the nuclear and cytoplasmic sub-compartments and cooperates with splicing and translation regulatory factors [Citation52–Citation54]. Moreover, it was recently demonstrated that HuR is involved in SOX2 mRNA homeostasis and stemness maintenance [Citation27]. Here, we report HuR’s ability to bind the lncRNAs under analysis and to modulate their half-lives. Moreover, we demonstrate that when HuR’s activity is inhibited during NSCs’ differentiation there is an increase in stemness potential. Indeed, HuR’s silencing and pharmacological inactivation also lead to an increase in neuronal markers and a decrease in stemness markers, with similar results as to the ones obtained when lincBRN1a and lincBRN1b were silenced. This indicates a concordant and possibly synergic action for the molecules in the differentiation process of NSCs, probably due to their physical interaction. Moreover, we show that this binding is crucial for their turnover homeostasis. It has been demonstrated that HuR binds to linc-MD1 and H19 lncRNA. The level of linc-MD1 expression positively correlated with HuR protein abundance, as does the level of miR-675, a microRNA embedded in H19 lncRNA [Citation24,Citation55,Citation56]. These authors showed that HuR regulates the fate of linc-MD1 and H19 lncRNA/miR-675, as the cellular depletion of HuR enhances the processing of linc-MD1 into miR-133b and of H19 lncRNA into miR-675. HuR’s role in myogenesis and embryogenesis shows its interaction with lncRNAs, regulating their processing to microRNAs and fine-tuning the differentiation program acting on the microRNA developmental reservoir [Citation13]. In this paper, we firstly report HuR’s ability to bind U-rich regions of lincBRN1a and lincBRN1b. Indeed, HuR’s inhibition leads to an increase in their decay rates, thus suggesting a role for the protein in lncRNAs’ stabilization and regulation of the half-life. The increase in lncRNAs turnover does not necessarily imply a lack of function as the modification of lncRNAs stability can also influence the time and the localization of their activity. Again, more experiments with big data set analysis of regulatory pathways, such as microarrays, high-through put proteomic and next-generation sequencing will be necessary to determine the precise targets of these interactions.
In conclusion, our data on HuR’s inhibition in neurospheres and in NSCs’ differentiation encourage us to speculate that the interaction between HuR and specific lncRNAs involved in neural differentiation can be a proper target for a fine-tune modulation of stemness and differentiation. This mechanism could potentially also be translated to human lineages, where homologues are present for six of the lncRNAs under investigation (lincBRN1a/PANTR1, TUG1, FENDRR, HOTTIP, FABL/ELDRR and lincp21/TP53COR), one of which (PANTR1) manifests a significant deregulation when differentiated from human iPSCs into NSCs. Moreover, the expression levels of HOTTIP,TP53COR, ELDRR, and PANTR1 were increased during neuronal differentiation of h-NSCs . This opens a new path of research that may help a better understanding of new post-transcriptional mechanisms that regulate the expression of RNAs involved in NSC differentiation. A deregulation of these molecules could be present in neurodevelopmental and neurodegenerative diseases, allowing for the investigation of new disease-pathways. Moreover, the interaction between HuR and certain lncRNAs may represent also a new potential pharmacological target allowing cell precursor’s conversion to neurons for their application in regenerative medicine. Together, these results support and evidence the importance of certain lncRNAs in neural development, and they show the importance of HuR in regulating their stability and thus functionality.
Authors contributions
S.C., C.C., A.M.D.G. designed the study.
T.G., S.C., F.R., E.L., S.M., M.B., O.P., M. C. F. G. performed experiments and analyzed data.
S.C., C.C., A.P., A.M.D.G. wrote or contributed to the writing of the paper.
Supplemental Material
Download Zip (34.1 MB)Acknowledgments
The authors are deeply grateful to Professor Alfredo Gorio (University of Milan, Italy) for his scientific support and unswerving encouragement to the work. Moreover, authors acknowledge the economic support by FAIP (Federazione Associazioni Italiane Paratetraplegici), “Neurogel-en-March” Foundation (France) to AG, Fondazione “Romeo and Enrica Invernizzi” to AMDG, Fondazione Regionale per la Ricerca Biomedica (FRRB) (Regione Lombardia, TRANS_ALS, project nr. 2015-0023, to AG, AMDG and CC). Federica Rey would like to acknowledge and thank the Fondazione Fratelli Confalonieri for financial support during her PhD.
Disclosure statement
No potential conflict of interest was reported by the authors.
Supplementary material
Supplemental data for this article can be accessed here.
Related Research Data
References
- Vishwakarma SK, Bardia A, Tiwari SK, et al. Current concept in neural regeneration research: NSCs isolation, characterization and transplantation in various neurodegenerative diseases and stroke: A review. J Adv Res. 2014;5(3):277–294.
- Temple S. Division and differentiation of isolated CNS blast cells in microculture. Nature. 1989;340(6233):471–473.
- Rossi F, Cattaneo E. Opinion: neural stem cell therapy for neurological diseases: dreams and reality. Nat Rev Neurosci. 2002;3(5):401–409.
- Decimo I, Bifari F, Krampera M, et al. Neural stem cell niches in health and diseases. Curr Pharm Des. 2012;18(13):1755–1783.
- Carelli S, Giallongo T, Marfia G, et al. Exogenous adult postmortem neural precursors attenuate secondary degeneration and promote myelin sparing and functional recovery following experimental spinal cord injury. Cell Transplant. 2015;24(4):703–719.
- Carelli S, Giallongo T, Viaggi C, et al. Grafted neural precursors integrate into mouse striatum, differentiate and promote recovery of function through release of erythropoietin in MPTP-treated mice. ASN Neuro. 2016;8:5.
- Carelli S, Giallongo T, Gombalova Z, et al. EPO-releasing neural precursor cells promote axonal regeneration and recovery of function in spinal cord traumatic injury. Restor Neurol Neurosci. 2017;35(6):583–599.
- Carelli S, Giallongo T, Viaggi C, et al. Recovery from experimental parkinsonism by intrastriatal application of erythropoietin or EPO-releasing neural precursors. Neuropharmacology. 2017;119:76–90.
- Carelli S, Giallongo T, Gombalova Z, et al. Counteracting neuroinflammation in experimental Parkinson’s disease favors recovery of function: effects of Er-NPCs administration. J Neuroinflammation. 2018;15(1):333.
- Ferraiuolo L, Frakes A, Kaspar BK. Neural stem cells as a therapeutic approach for amyotrophic lateral sclerosis. Mol Ther. 2013;21(3):503–505.
- Pluchino S, Zanotti L, Deleidi M, et al. Neural stem cells and their use as therapeutic tool in neurological disorders. Brain Res Brain Res Rev. 2005;48(2):211–219.
- Carelli S, Giallongo T, Gerace C, et al. Neural stem cell transplantation in experimental contusive model of spinal cord injury. J Vis Exp. 2014;(94). DOI:10.3791/52141.
- Flynn RA, Chang HY. Long noncoding RNAs in cell-fate programming and reprogramming. Cell Stem Cell. 2014;14(6):752–761.
- St Laurent G, Wahlestedt C, Kapranov P. The Landscape of long noncoding RNA classification. Trends Genet. 2015;31(5):239–251.
- Wang KC, Chang HY. Molecular mechanisms of long noncoding RNAs. Mol Cell. 2011;43(6):904–914.
- Sauvageau M, Goff LA, Lodato S, et al. Multiple knockout mouse models reveal lincRNAs are required for life and brain development. Elife. 2013;2:e01749.
- Wang KC, Yang YW, Liu B, et al. A long noncoding RNA maintains active chromatin to coordinate homeotic gene expression. Nature. 2011;472(7341):120–124.
- Goff LA, Groff AF, Sauvageau M, et al. Spatiotemporal expression and transcriptional perturbations by long noncoding RNAs in the mouse brain. Proc Natl Acad Sci U S A. 2015;112(22):6855–6862.
- Dominguez MH, Ayoub AE, Rakic P. POU-III transcription factors (Brn1, Brn2, and Oct6) influence neurogenesis, molecular identity, and migratory destination of upper-layer cells of the cerebral cortex. Cereb Cortex. 2013;23(11):2632–2643.
- Clark MB, Johnston RL, Inostroza-Ponta M, et al. Genome-wide analysis of long noncoding RNA stability. Genome Res. 2012;22(5):885–898.
- Colombrita C, Silani V, Ratti A. ELAV proteins along evolution: back to the nucleus? Mol Cell Neurosci. 2013;56:447–455.
- Zucal C, D’Agostino V, Loffredo R, et al. Targeting the multifaceted HuR protein, benefits and caveats. Curr Drug Targets. 2015;16(5):499–515.
- Milani P, Amadio M, Laforenza U, et al. Posttranscriptional regulation of SOD1 gene expression under oxidative stress: potential role of ELAV proteins in sporadic ALS. Neurobiol Dis. 2013;60:51–60.
- Legnini I, Morlando M, Mangiavacchi A, et al. A feedforward regulatory loop between HuR and the long noncoding RNA linc-MD1 controls early phases of myogenesis. Mol Cell. 2014;53(3):506–514.
- Wilusz CJ, Wilusz J. HuR and translation–the missing linc(RNA). Mol Cell. 2012;47(4):495–496.
- Yoon JH, Abdelmohsen K, Srikantan S, et al. LincRNA-p21 suppresses target mRNA translation. Mol Cell. 2012;47(4):648–655.
- Latorre E, Carelli S, Caremoli F, et al. Human antigen R binding and regulation of SOX2 mRNA in human mesenchymal stem cells. Mol Pharmacol. 2016;89(2):243–252.
- Gritti A, Bonfanti L, Doetsch F, et al. Multipotent neural stem cells reside into the rostral extension and olfactory bulb of adult rodents. J Neurosci. 2002;22(2):437–445.
- Marfia G, Madaschi L, Marra F, et al. Adult neural precursors isolated from post mortem brain yield mostly neurons: an erythropoietin-dependent process. Neurobiol Dis. 2011;43(1):86–98.
- D’Agostino VG, Lal P, Mantelli B, et al. Dihydrotanshinone-I interferes with the RNA-binding activity of HuR affecting its post-transcriptional function. Sci Rep. 2015;5:16478.
- Slikker W, Liu F, Rainosek SW, et al. Ketamine-induced toxicity in neurons differentiated from neural stem cells. Mol Neurobiol. 2015;52(2):959–969.
- Lois C, Alvarez-Buylla A. Proliferating subventricular zone cells in the adult mammalian forebrain can differentiate into neurons and glia. Proc Natl Acad Sci U S A. 1993;90(5):2074–2077.
- Gage FH, Coates PW, Palmer TD, et al. Survival and differentiation of adult neuronal progenitor cells transplanted to the adult brain. Proc Natl Acad Sci U S A. 1995;92(25):11879–11883.
- Cook KB, Kazan H, Zuberi K, et al. RBPDB: a database of RNA-binding specificities. Nucleic Acids Res. 2011;39(Database issue):D301–308.
- Lal P, Cerofolini L, D’Agostino VG, et al. Regulation of HuR structure and function by dihydrotanshinone-I. Nucleic Acids Res. 2017;45(16):9514–9527.
- Koba M, Konopa J. Actinomycin D and its mechanisms of action. Postepy Hig Med Dosw (Online). 2005;59:290–298.
- Baser A, Skabkin M, Kleber S, et al. Onset of differentiation is post-transcriptionally controlled in adult neural stem cells. Nature. 2019;566(7742):100–104.
- Batista PJ, Chang HY. Long noncoding RNAs: cellular address codes in development and disease. Cell. 2013;152(6):1298–1307.
- Andersen RE, Lim DA. Forging our understanding of lncRNAs in the brain. Cell Tissue Res. 2018;371(1):55–71.
- Ramos AD, Attenello FJ, Lim DA. Uncovering the roles of long noncoding RNAs in neural development and glioma progression. Neurosci Lett. 2016;625:70–79.
- Barry G. Integrating the roles of long and small non-coding RNA in brain function and disease. Mol Psychiatry. 2014;19(4):410–416.
- Faghihi MA, Modarresi F, Khalil AM, et al. Expression of a noncoding RNA is elevated in Alzheimer’s disease and drives rapid feed-forward regulation of beta-secretase. Nat Med. 2008;14(7):723–730.
- Talkowski ME, Maussion G, Crapper L, et al. Disruption of a large intergenic noncoding RNA in subjects with neurodevelopmental disabilities. Am J Hum Genet. 2012;91(6):1128–1134.
- Ziats MN, Rennert OM. Aberrant expression of long noncoding RNAs in autistic brain. J Mol Neurosci. 2013;49(3):589–593.
- Mercer TR, Qureshi IA, Gokhan S, et al. Long noncoding RNAs in neuronal-glial fate specification and oligodendrocyte lineage maturation. BMC Neurosci. 2010;11:14.
- Ramos AD, Diaz A, Nellore A, et al. Integration of genome-wide approaches identifies lncRNAs of adult neural stem cells and their progeny in vivo. Cell Stem Cell. 2013;12(5):616–628.
- Lipovich L, Dachet F, Cai J, et al. Activity-dependent human brain coding/noncoding gene regulatory networks. Genetics. 2012;192(3):1133–1148.
- Penny GD, Kay GF, Sheardown SA, et al. Requirement for Xist in X chromosome inactivation. Nature. 1996;379(6561):131–137.
- Sleutels F, Zwart R, Barlow DP. The non-coding air RNA is required for silencing autosomal imprinted genes. Nature. 2002;415(6873):810–813.
- Rinn JL, Kertesz M, Wang JK, et al. Functional demarcation of active and silent chromatin domains in human HOX loci by noncoding RNAs. Cell. 2007;129(7):1311–1323.
- McEvilly RJ, de Diaz MO, Schonemann MD, et al. Transcriptional regulation of cortical neuron migration by POU domain factors. Science. 2002;295(5559):1528–1532.
- Meisner NC, Filipowicz W. Properties of the regulatory RNA-binding protein HuR and its role in controlling miRNA repression. Adv Exp Med Biol. 2010;700:106–123.
- Yuan Z, Sanders AJ, Ye L, et al. HuR, a key post-transcriptional regulator, and its implication in progression of breast cancer. Histol Histopathol. 2010;25(10):1331–1340.
- von Roretz C, Beauchamp P, Di Marco S, et al. HuR and myogenesis: being in the right place at the right time. Biochim Biophys Acta. 2011;1813(9):1663–1667.
- Zou T, Jaladanki SK, Liu L, et al. H19 long noncoding RNA regulates intestinal epithelial barrier function via MicroRNA 675 by interacting with RNA-binding protein HuR. Mol Cell Biol. 2016;36(9):1332–1341.
- Keniry A, Oxley D, Monnier P, et al. The H19 lincRNA is a developmental reservoir of miR-675 that suppresses growth and Igf1r. Nat Cell Biol. 2012;14(7):659–665.