
ABSTRACT
With the advance of high-throughput sequencing technology numerous new regulatory small RNAs have been identified, that broaden the variety of processing mechanisms and functions of non-coding RNA. Here we explore small non-coding RNA (sncRNA) expression in central parts of the physiological stress and anxiety response system. Therefore, we characterize the sncRNA profile of tissue samples from Amygdala, Hippocampus, Hypothalamus and Adrenal Gland, obtained from 20 pigs. Our analysis reveals that all tissues but Amygdala and Hippocampus possess distinct, tissue-specific expression pattern of miRNA that are associated with Hypoxia, stress responses as well as memory and fear conditioning. In particular, we observe marked differences in the expression profile of limbic tissues compared to those associated to the HPA/stress axis, with a surprisingly high aggregation of 3´-tRNA halves in Amygdala and Hippocampus. Since regulation of sncRNA and RNA cleavage plays a pivotal role in the central nervous system, our work provides seminal insights in the role/involvement of sncRNA in the transcriptional and post-transcriptional regulation of negative emotion, stress and coping behaviour in pigs, and mammals in general.
Introduction
During the last decade, small non-coding RNA (sncRNA) have emerged as another crucial regulator in controlling gene expression and post-transcriptional modification. Small non-coding RNA are short RNA structures of 16–38 nucleotides (nts) and best-known for their involvement in post-transcriptional regulation of target RNAs via RNA interference, such as microRNA and single interference RNA (siRNA) [Citation1]. However, with the recent advance in high-throughput sequencing technology, novel small non-coding RNA structures with diverse regulatory functions are being identified at a rapid pace. Among these newly discovered types of small, RNA-like structures are small nucleolar RNA (snoRNA), Y RNA and tRNA-derived RNA fragments (tRFs), to name only a few. The advances in RNA biology are of particular importance for the brain and the central nervous system. Among all mammalian tissues, the brain has the most divergent transcriptional profile and is characterized by robust expression and modification of a large variety of ncRNAs and a high degree of RNA splicing and editing activity [Citation2–Citation4]. Dysregulation of any part within these intricate processes, such as upon ischaemic injury or exposure to excessive stress conditions, has been shown to account for disruption of brain function and severe damage [Citation5]. Accordingly, there is increasing interest and effort in the characterization of these distinct RNA classes, their molecular function and their role in neuronal development and maintenance. This, however, requires and demands innovations in both sequencing technologies and in computational and systems biology.
In this study, we explore the brain-specific sncRNA expression and RNA splicing patterns that influence central parts of the physiological stress and anxiety response system by characterizing the sncRNA profile of four central tissues of the limbic system and HPA/stress axis. Tissues samples of the adrenal gland and three different areas of the brain, i.e. amygdala, hippocampus and hypothalamus, were collected from 20 pigs and used for small RNA deep sequencing. Due to the high similarity between pigs and humans in regard to physiology and genome content, pigs provide an excellent model for medical research.
Amygdala and hippocampus are anatomically adjacent limbic regions in the forebrain and play crucial roles in the regulation of behavioural responses and cognitive capabilities [Citation6–Citation8]. Further, the amygdala harbours the lateral nucleus (LA), which is a core locus for the generation of fear memories and fear conditioning [Citation9–Citation11]. Upon major stress- or fearful emotional events amygdala and hippocampus closely interact to induce the formation of long-term memory [Citation12]. The hypothalamic-pituitary-adrenal axis (HPA axis) on the other hand, is the major neuroendocrine system that controls critical parts in the adaptive regulation of stress as well as mood, emotions and sexuality [Citation13]. The adrenal gland plays a pivotal role in the secretion of stress hormones, such as catecholamines and glucocorticoids; a process tightly regulated by the sympathetic nervous system, hypothalamus and pituitary gland, to provide a controlled reaction to stress [Citation14,Citation15].
Our analysis revealed that all tissues but amygdala and hippocampus have distinct sncRNA profiles, which resonate with tissue localization and attributed function. We identified tissue-specific expression of miRNA clusters that are associated to hypoxia, stress responses as well as memory and fear conditioning. Further, we observed a general aggregation of 5´-tRNA halves in all tissues and an unexpected high accumulation of 3´-tRNA halves in amygdala and hippocampus. This provides further evidence that small non-coding RNA and their tRNA cleavage products are involved in the transcriptional and post-transcriptional regulation of negative emotion/anxiety, stress and coping behaviour in pigs and mammals in general.
Results
Tissue samples of the adrenal gland and three different areas of the brain, i.e. amygdala, hippocampus and hypothalamus, were collected from 20 pigs and used for small RNA deep sequencing. The amount of total reads, clean reads and mapped reads obtained from sequencing are listed in for each tissue. The majority of clean reads (94.55%) have been mapped to the sus-scrofa genome (v11.1).
Table 1. Read counts (in Million) and mapping statistics, obtained from all samples of the respective tissue.
As a result of the subsequent annotation, we were able to determine 1410 distinct genomic features that relate to sncRNA species/transcripts. This translates to 80.69% (326,14 M) of the total amount of clean reads. Note that we distinguish between genomic features with high- and low-confidence. Genomic features that correspond to annotated regions or have been confirmed/identified as structural intact miRNA by mirdeep are considered as high confidence annotations. Remaining genomic features that have been annotated by the homology-based screen against non sus-scrofa RNA structures available in the RNAcentral database are considered as low confidence annotations. The corresponding mapping and annotation statistics are listed in supplementary table 1. Please note, in the following these genomic features, i.e. the annotated loci on the sus scrofa genome, will be referred to as sncRNA genes, and their expression products as sncRNA transcripts. The set of annotated sncRNA genes/transcripts is composed of the three main sncRNA structures (miRNA, rRNA, tRNA), various short RNA types of low abundance (yRNA, piRNA and snoRNA) and a small remaining fraction of unmatched or unknown reads (cf. Supp. Fig. 1). With respect to read length distribution, we found a main fraction consisting of sus scrofa miRNA. In addition, we detected another main fraction of reads with length > 30 nt. Thereby 5´-tRNA and 3´-tRNA halves formed the majority of reads with length 31–34 nt and 35–39 nt, respectively (cf. Supp. Fig. 1).
Genomic positions of annotated sncRNA
To illustrate the genomic positions of sncRNA that have been successfully mapped and annotated, we used a circular representation of the sus scrofa genome (assembly version 11.1) as displayed in . The scale of the circular genome map is 2 Mb; accordingly, every sncRNA gene located within a 2 Mb bin is depicted as single-coloured tile. Colour and transparency of a tile encode for the sncRNA class (e.g. tRNA red, miRNA blue) and the mean transcript abundance of the respective sncRNA gene. Since typically more than one sncRNA gene is located within such a 2 Mb bin – or locus, tiles are stacked and sorted according to mean transcript abundance. Note, that we used the mean transcript abundance, defined as the mean of normalized read counts to the respective sncRNA gene (feature counts) overall samples, as an approximate measure of transcriptional activity of each sncRNA gene. In addition, the figure contains a heatmap depicting the general transcript abundance for each tissue and locus. Here the general transcript abundance is calculated by the mean of normalized read counts to the respective tissue overall sncRNA genes located within the given 2 Mb interval and serves as a measure for the general transcript activity within each tissue for every locus. These measures allowed us to compare the expression of individual sncRNA genes as well as the general transcription activity in tissues, at and between different loci.
Figure 1. Circular representation of the sus scrofa genome and sncRNA annotation obtained from our data set. (a) According to the legend on the right-hand side, the outer ring depicts the chromosome and genomic position (in 2Mb intervals). Stacked and coloured tiles correspond to annotated loci on the sus scrofa genome (referred to as sncRNA genes). Tiles are stacked and sorted according to mean transcript abundance; its colour and transparency encode for the sncRNA class (miRNA – blue, snoRNA – green, rRNA – yellow, tRNA – red) and the mean transcript abundance of the respective sncRNA gene. The (black-and-white) heatmap depicts the general transcript abundance (from high (black) to no activity (white)) for each locus and tissue with the following order (from outside to the inside of the circle): Amygdala, Hippocampus, Hypothalamus, Adrenal gland. The undirected links in the centre of the image indicate tRNA gene copies. See legend in (b) or text for more details.
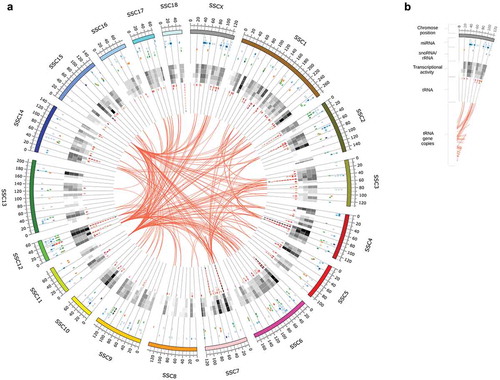
As indicated in , sncRNA are encoded on all chromosomes, despite chromosome Mt (mitochondrial) and Y (not shown). However, the number and distribution of encoded regions greatly differs between the various chromosomes. Chromosomes with a large number of encoded sncRNA genes and high transcriptional activity are chromosome 4, 6, 7 and in particular 12, whereas chromosome 8, 11, 13 and 16 contain very few sncRNA genes, and a comparatively low transcriptional activity.
Further, we find that tRNA genes are highly repetitive and have a high copy number, being both clustered at certain loci and distributed among the entire genome. Loci with a very prominent cluster of tRNA gene copies are located, for example, at chromosome 3:45–50 Mb, 4:85–100 Mb, 7:20–25 Mb and 12:50–60 Mb. To better illustrate the distribution of tRNA gene copies, each tRNA gene copy is further connected with an undirected link as displayed in the centre of . Note, that only links between tRNA gene copies with a relevant (max-normalized read count higher than 100) expression are shown to improve the clarity and comprehensibility of the figure.
Composition of small ncRNA strongly varies between tissues
Next, we determined the composition of small ncRNA transcripts in each tissue, based on annotation and subsequent classification of the transcripts into various sncRNA types. This means, all normalized read counts of transcripts that belong to the same sncRNA type are aggregated sample-wise and then used to obtain the average sncRNA composition for each tissue, as shown in .
Figure 2. (a) Average sncRNA composition for each tissue, based on a sample-wise aggregation of all normalized read counts of transcripts that belong to the same sncRNA type. (b) Tissue-specific distribution of sample-wise aggregated (normalized) read counts of major sncRNA types. (c) Two-dimensional biplot of the first two principal components of the normalized transcript count matrix for each tissue and the top 15 variables (transcripts) with the highest variable loading. (d) Heatmap of top 50 sncRNA transcripts with the highest mean of normalized counts.
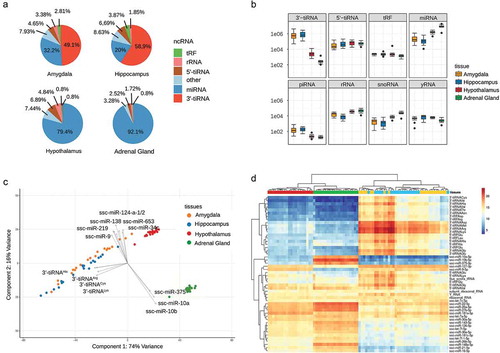
The sncRNA composition varies substantially between the different tissues (see ). In adrenal gland the sncRNA profile is dominated by miRNA: on average, 92.1% of all (normalized) reads in tissue samples of adrenal gland belong to this class of sncRNA. In contrast to that, tissue samples from the brain provide a more diverse sncRNA profile. While all brain tissues contain a similar fraction of 5´-tRNA halves (2.8–0.8%), the fraction of miRNA and in particular 3´-tRNA halves differs considerably between brain tissues. While in hypothalamus 79.4% of all clean reads are miRNA, hippocampus and amygdala comprise comparatively low levels of miRNA (20% and 32.2%). At the same time, hippocampus and amygdala contain a considerable fraction (58.9% and 49.1%) of 3´-tRNA halves, which are almost absent in hypothalamus and adrenal gland.
Boxplots of the normalized read counts for each individual sncRNA class and tissue, as depicted in , allow a more detailed inspection of how the individual sncRNA classes are distributed among tissue samples and further provide a direct comparison also for sncRNA structures of low abundance. In accordance with the previously described results, the general expression level of 3´-tRNA halves and miRNA are significantly different between amygdala/hippocampus and hypothalamus/adrenal gland (cf. ). Among the lowly expressed sncRNA, only piRNA and snoRNA provide different expression levels between tissue samples from amygdala/hippocampus and hypothalamus/adrenal gland, whereas yRNA and the typically considered ‘housekeeping’ rRNA are not specifically distributed between tissue samples.
sncRNA expression profiling reveals highly diverse transcription patterns in brain tissues and adrenal gland
The principal component analysis provides more information on how different the individual tissues are with regard to their sncRNA expression profile and which transcripts are most responsible for the separation. shows the first two principal components of the normalized read count matrix for each tissue. While hypothalamus and adrenal gland are separated into well-defined clusters, tissue samples from amygdala and hippocampus are not well separated. Furthermore, includes the top 15 variables with the highest variable loading, i.e. transcripts with the largest contribution to the first two principal components. From this, we can deduce that the separation between the hypothalamus and the other brain tissues is primarily driven by 3´-tRNA halves, whereas miRNA mainly contribute to the differences between the three brain tissues and adrenal gland. In particular, the expression of mir-10 and mir-375 on the one, and mir-9, mir-219, mir-138, mir-124a/b and mir-34c on the other hand, are responsible for the separation of AG and brain tissues.
The clustering obtained by PCA is further supported by hierarchical clustering of the top 50 sncRNA with highest normalized base mean counts as shown in the heatmap of . While all tissue samples from hypothalamus and adrenal gland are classified in two distinct clusters, sncRNA in amygdala and hippocampus appear to cluster among individual groups rather than among the tissues. Clustering of the top 50 sncRNA further indicates various groups of co-regulated sncRNA with varying distribution among the tissue samples. Accordingly, the first cluster contains 3´-tRNA halves that are highly and almost exclusively expressed in amygdala and hippocampus; mir-10 and mir-375, which are highly expressed only in the adrenal gland, belong to a second cluster. Additional sncRNA clusters comprise transcripts with a high abundance level in all tissue samples, such as ribosomal RNA and Y-RNA, but also 5´-tRNA halves and various miRNA (let-7 a/c, mir-22, mir-26a, mir-27b and miR-181). In addition, we observe highly abundant miRNA transcripts either in adrenal gland or hypothalamus (mir-16, mir-21, mir-148a, etc.) or in all brain tissues (mir-9 and mir-127).
Tissue-specific sncRNA
Despite the great differences in the sncRNA profiles, we found that comparatively few sncRNAs are exclusively expressed in one tissue. The Venn diagram in the supplemental shows the number of transcripts that are expressed in a certain set of tissues. In fact, the vast majority of all sncRNA was present in all four tissues (97%). Only adrenal gland contained one sncRNA transcript that was not expressed in any other tissue. In addition, a few sncRNA were solely present in brain regions (11) or in functionally related tissues of amygdala/hippocampus (3) and hypothalamus/adrenal gland (9). Moreover, most of these sncRNA were of low-confidence, i.e. they have been annotated based on homology to non-sus scrofa sncRNA entries in RNA-central. However, brain-specific sncRNA formed an exception here, as several high-confidence sus scrofa miRNA such as mir-105, mir-124a, mir-1264, were exclusively expressed in all three brain regions, but not in the adrenal gland.
Differentially expressed sncrna transcripts
Next, we calculated all differentially expressed transcripts (DET) by pairwise comparison between all tissues. We considered transcripts as tissue-specific or over-expressed, if their expression was significantly (FDR < 5%) higher in the respective tissue compared to all other tissues, i.e. transcripts that are differentially expressed in all pairwise tests performed for the respective tissue. We observed strong tissue-dependent differences regarding the amount and type of transcripts that are specifically expressed in a single tissue. For example, amygdala and hippocampus contain very few tissue-specific over-expressed transcripts (2 and 12), compared to hypothalamus (87) and adrenal gland (158). In amygdala mir-129a and mir-383 were over-expressed. In hippocampus we identified mir-320, Y-RNA and splicing products derived from Ser-tRNA as over-expressed sncRNA transcripts with the highest abundance. Further, the top 15 over-expressed sncRNA (based on normalized base means) of the hypothalamus and adrenal gland are listed in .
Table 2. Top 15 over-expressed sncRNA (based on normalized base means) for each tissue. Transcripts are considered over-expressed in a certain tissues, if their expression is significantly higher in the respective tissue compared to all other tissues, i.e. transcripts that are differentially expressed (FDR < 0.05) in all pairwise tests performed for the respective tissue. Tables of all DETs obtained from pairwise comparisons between all tissues including FDR values can be found in the supplementary material (Supplementary Table 2).
Over-expression of diverse sncRNA distinguish brain and function-specific tissues
To reveal whether specific sncRNA types were primarily over-expressed in a functional unit we pooled our samples in terms of functional tissues and performed another differential expression analysis between these groups. This means we compared the sncRNA transcription profile of amygdala and hippocampus, as parts of the limbic system, with the hypothalamus and adrenal gland, as parts of the HPA axis. Likewise we compared all three brain tissues with the extracranial tissue adrenal gland. For a more detailed consideration of the DETs in terms of sncRNA type and expression fold change, we employed a bar plot in which height and colour indicate the fold change and the sncRNA type of all DETs. This provides a comprehensive visualization of the general sncRNA profile of all DET as illustrated in &. Further, we employed modified Vulcan plots (&) and MA plots (&), which also consider the type of sncRNA. Data table corresponding to , and , are in supplementary table 3a and 3b, respectively.
Figure 3. Differentially expressed transcripts between tissue samples coloured according to sncRNA type (a–c) Limbic system (Amygdala and Hippocampus) vs. HPA Axis (Hypothalamus and Adrenal gland); (d–f) Brain (Amygdala, Hippocampus and Hypothalamus) vs Adrenal gland.
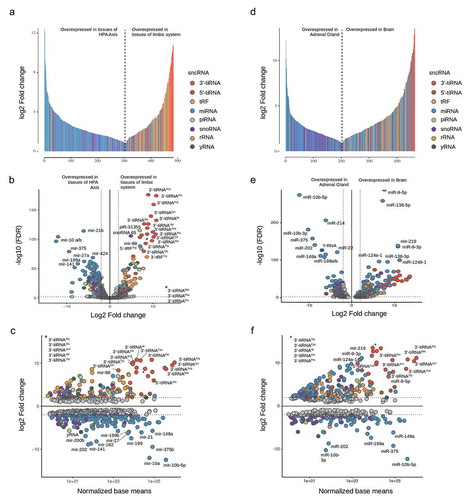
In tissue samples of the HPA axis almost exclusively miRNA were overexpressed whereas samples from the limbic system were primarily enriched in 3ʹtRNA halves (cf. ). Another observation was, that among all miRNA that were differentially expressed between the limbic system and HPA axis, peculiarly few miRNA were over-expressed in the limbic system. Most notably, the expression and fold change values of 3´-tRNA transcripts were peculiarly high in general: the vast majority of 3´-tRNA transcripts were characterized by outstandingly high expression levels, while the expression levels of miRNA and other sncRNA species were approximately uniformly distributed. At the same time, aggregated 3´-tRNA fragments possessed the highest fold change values for samples of the limbic system when compared to samples of the HPA axis. This indicates a strong and exclusive aggregation of 3´-tRNA fragments in amygdala and hippocampus.
We identified several miRNAs (e.g. mir-10-a, mir-10-b and mir-214) in the adrenal gland and in brain tissues (e.g. mir-138 and mir-9) with high expression and fold change values. The sncRNA with the highest ratio of fold change and (-log10) FDR/base mean values are marked in –. Apparently these miRNA are specifically expressed and aggregated in their respective tissue or functional unit, as fold change values for these miRNA are extraordinarily high in the corresponding pairwise comparisons.
Discussion
Here we applied deep sequencing of short non-coding RNA (sncRNA) on sus scrofa tissue samples of the amygdala, hippocampus, hypothalamus and adrenal gland. We characterized the sncRNA profile of each tissue, i.e. the tissue-specific composition of sncRNA classes (based on normalized read counts) and further obtained differential expression of specific sncRNA transcripts that are either tissue- or functionally related. Thereby we identified tissue-specific sncRNA and several function-specific clusters of sncRNA that are either aggregated in all tissues or linked to functional units of the limbic system or the HPA axis. Based on the transcriptional profile we were able to derive insights in how similar tissue are regulated and what are the key drivers for tissue-specific regulatory mechanisms.
sncRNA markers of hypoxia and tissue damage
Besides the housekeeping sncRNA species of Y-RNA and ribosomal RNA, the majority of sncRNA with general high abundance in all four tissues are related to stress or hypoxia and most likely result from exsanguination and biopsy of tissue samples. As depicted in , the top50 sncRNA with homogeneous abundance comprise 5´-tRNA halves (derived from tRNA-Gly, tRNA-Lys and tRNA-Val) and various miRNA (e.g. let-7a/c, mir-30a and mir-181a). 5´-tRNA halves are well-accepted markers of cell stress or hypoxic conditions [Citation16–Citation18]. Several studies show that hypoxia and other stressors, such as nutrient starvation [Citation19], pathological tissue injuries [Citation20] and infections [Citation21] stimulate the Angiogenin-mediated production of tRNA halves to prevent apoptosis and to promote cell survival [Citation22–Citation26].
Let-7a/c and in particular mir-181a are prominent hypoxia markers [Citation27,Citation28] and mir-30a significantly promotes cell apoptosis and autophagy [Citation29]. Similarly, abundant miRNA with slightly higher aggregation in the adrenal gland, such as mir-16, mir-21, mir-26a, belong to the group of verified hypoxia-related miRNA, also termed Hypoxamirs [Citation27,Citation28]. In addition, we identified various clusters of highly abundant, but tissue-specific Hypoxamirs. For instance, we observe the exclusive expression of mir-448 and mir-1264 in amygdala and mir-1298 in all brain samples. Intriguingly, the mir-448/1264/1298 cluster is highly upregulated during the early phase of stroke as demonstrated in ischaemia mouse model [Citation30]. In contrast to that, samples of HPA axis tissues comprise highly abundant members of the mir-200 family (mir-141, mir-200a, mir-200b, mir-200c) and mir-183 family (mir-182, mir-183); both of which have been reported to be upregulated after the onset of ischaemia [Citation31]. Mir-98 is another inflammation-related miRNA, which, however, is specifically aggregated in tissue samples of amygdala and hippocampus. Together with let-7g (which is also overexpressed in amygdala and hippocampus in comparison to hypothalamus and adrenal gland) mir-98 protects the blood-brain barrier under neuroinflammatory conditions [Citation32].
Function-and tissue-specific expression of miRNA
We found that comparatively few sncRNAs were exclusively expressed in one tissue (cf. Suppl. Fig. 2), i.e. were completely absent in a subset of tissues. Only three high-confidence sus-scrofa miRNA, mir-105, mir-124a, mir-1264, were exclusively expressed in all three brain regions, but not in the adrenal gland. This resonates well with previous studies on mammalian tissue-specific miRNA expression, as brain-enriched mir-124 is well conserved from worms to humans and is estimated to be the most abundant miRNA in the brain [Citation33]; Mir-105 as well as mir-1264 have been implicated in brain-specific functions [Citation30,Citation34].
Concordantly, most highly abundant and differentially expressed miRNA in brain tissues (against adrenal gland), such as mir-9, mir-124, mir-129, mir-138, mir-448, have been previously classified as brain-specific in human and mice [Citation35]. Thereby mir-9 and mir-138 are of particular interest due to their attributed role in memory and fear conditioning. In fact, brain-enriched mir-9 regulates synaptic plasticity and memory and its inhibition in the hippocampus results in learning and memory deficits [Citation36,Citation37]. Mir-138 on the other hand, is locally enriched at synaptic sites and its expression level in the hippocampus is associated with the formation of fear memory [Citation38]. Mir-138 affects the formation of fear memory by modifying the expression of the downstream target gene calpain 1 (Capn1) with major implications on the synaptic plasticity. Recently mir-129 has also been associated with memory retention, in addition to its neuroprotective role on hypoxic-ischaemic brain injuries [Citation39]. As shown by Fernandez et al. [Citation40] mir-129 and mir-144 play a major role in the modulation of the hippocampal microRNA-mRNA regulatory network upon physical exercise, which eventually lead to improvements in memory detention.
Elevated levels and distribution of tRNA fragments
In our tissue samples, we found elevated levels of various small RNA fragments derived from tRNA. tRNA-derived RNA fragments are divided in two main classes, tRNA halves and tRNA-derived fragments (tRFs). tRNA halves are produced by Angiogenin-dependent cleavage in the anticodon loop and result in RNA fragments of 30–35 (5´-tRNA halves) or 35–40 nt (3´-tRNA halves) length [Citation41,Citation42]. tRFs are shorter sequences of 13 to 20 at length and either result from DICER or Angiogenin induced cleavage at either ends or in the anticodon loop [Citation43]. While mature tRNA play an essential role in the synthesis of proteins by decoding the nucleotide triplets encoded in the mRNA into the amino acid sequence of the target protein [Citation44,Citation45], RNA fragments derived from cleaved tRNA are being more and more recognized to have major regulatory roles in cells [Citation16].
tRNA fragments have been found in small quantities in cells or circulating in blood under normal conditions [Citation19]. Their abundance typically varies between different cell types and tissues showing generally no correlation with the abundance of parent tRNAs [Citation16]. This is also the case in our data set. The different types of tRNA fragments are highly heterogeneously distributed among the tissues analysed in this study (cf. ).
5´-tRNA halves possess a similar expression level among all tissues, 3´-tRNA halves are highly aggregated in amygdala/hippocampus complex, and tRFs are accumulated in brain tissues, but not in the adrenal gland. The uneven distribution of different tRNA-derived fragments indicates a tissue-specific expression and cleavage activity, hence varying, yet unknown regulatory roles for the individual tRNA fragments.
Functional implications of tRNA-derived RNA fragments
There are numerous regulatory processes and diseases that have been recently associated with tRNA fragments, but in most cases, their exact molecular roles in the respective context have yet to be elucidated as well as their localization, relative abundance, and stability [Citation16,Citation43]. However, two main functions have crystallized from accumulating a number of studies: a) tRNA-derived fragments as regulators of gene silencing and tRNA halves as regulators of gene expression and cell survival under stress conditions. tRNA halves are generated by cleavage of the anticodon loop under metabolic stress [Citation18,Citation19,Citation46–Citation48]. This process appears to be highly conserved, as oxidative stress- induced tRNA cleavage has been shown to occur in yeast, plants and mammalian cells to a similar extend [Citation49]. Accordingly, tRNA halves are often considered as tRNA-derived, stressed induced RNAs, known as tiRNA. In a recent study using animal models of tissue damage tRNA halves were found to be valuable in vivo biomarkers for the severity of tissue damage [Citation50]. Stress-mediated cleavage of tRNA is completed by nuclease angiogenin, a member of the RNase A family [Citation42]. In response to stress, ANG is translocated from the nucleus into the cytoplasm and released from RNH1 and subsequently cleaves cytoplasmic tRNA into 5´- and 3´-tRNA halves [Citation41]. Angiogenin and Rny1 also act as sensors of cellular damage and foster cell death [Citation51,Citation52]. Recently, tRNA halves formed by angiogenin have been implicated in the attenuation of protein synthesis and the formation of stress granules (SG) [Citation25,Citation26,Citation53,Citation54]. Stress granules contain stalled pre-initiation complexes indicating an impact of 5`-tRNA halves on the translation initiation machinery. Surprisingly, transfection of 5´-tRNA halves, but not 3´-tRNA halves, inhibits translation in cultured cells [Citation26]. Similarly, in mouse and human serum tRNA fragments are derived exclusively from the 5´-ends of mature tRNAs [Citation19].
Based on the distribution and the molecular functions of 5´ tRNA halves obtained to date, we assume that the elevated, but evenly distributed 5´-tRNA halves may be the direct consequence of exsanguination and the resulting ischaemic conditions in the tissues. On the contrary, the exact regulatory and biochemical functions of 3´-tRNA are still mostly unknown. Accordingly, both reason and implications for the exceptionally high aggregation of 3´-tRNA in the amygdala/hippocampus complex remains elusive. Notably, the biopsy of amygdala and hippocampus is far more difficult than, for example, hypothalamus. Therefore, amygdala and hippocampus were supposedly somewhat longer subject to hypoxic conditions during biopsy. However, the question remains, why only 3´-tRNA were elevated in these tissues, but not 5´tRNA despite being subject to the same cleavage mechanism.
Expression profiles emphasize the distinct regulatory roles of sncRNA in the limbic system and HPA axis
Amygdala and hippocampus share an almost identical expression profile in regard to their composition of sncRNA classes (based on normalized read counts) and differential expression of specific sncRNA transcripts. We expected a similar result when comparing amygdala and hippocampus to the third brain tissue, hypothalamus, which is also associated to the limbic system. However, we obtained surprisingly diverse expression profiles with regard to sncRNA types as well as individual sncRNA for the hypothalamus and adrenal gland. In fact, we identified more DET between hypothalamus and the other two brain regions than between hypothalamus and adrenal gland. This means, based on the numbers of differentially expressed transcripts, the transcription pattern of hypothalamus is far more distinct to the other two brain regions than expected and even appears to be more similar to the adrenal gland. Amygdala and hippocampus act concordantly to achieve the homoeostatic state previous to the initial stress response. Accordingly, cortisol levels in the AH complex have been inversely associated with the functional connectivity between amygdala and hippocampus, which in turn is enhanced immediately after the stress response to increase coping capacity [Citation55–Citation57]. The differences in the transcriptional profiles thus reflect the antagonistic roles of the amygdala/hippocampus complex as part of the limbic system and hypothalamus as part of the HPA axis and further emphasize the distinct regulatory roles of sncRNA not only in certain tissues but also in tissues that are part of the same organ (e.g. brain) or belong to the same regulatory system (e.g. HPA axis or limbic system). tRFs can be derived from the processing of the parental tRNA, however lack of correlation has been reported between mature or precursor tRNA and their respective tRF abundance in different animal tissues [Citation58], or under distinct conditions [Citation59]. Soares et al. also reported that tRF are generated in a regulated route of specific processing, rather than a random degradation process [Citation58]. In addition, recently a study showed differential tRNA gene expression resulting in changes in the abundance of tRNA-derived fragments (tRFs) but not of mature tRNAs [Citation60]. Lastly, the strong variation among samples and the high expression of 3´-tRNA halves represent marked differences in the sncRNA transcription pattern between amygdala and hippocampus on the one and hypothalamus and adrenal gland on the other side. These results do not only underscore the differences in sncRNA composition between the tissues. In our view, they also suggest a highly specific, yet unknown regulatory function of 3´-tRNA halves in the limbic system; and add another layer to the intricate processes of post-transcriptional regulation of negative emotion, stress and coping behaviour.
Material and methods
Sample collection, RNA isolation
Pigs from a German Landrace herd were reared, performance-tested, sampled, and used for this study. Animal care and tissue collection procedures were approved by the Animal Care Committee of the Leibniz Institute for Farm Animal Biology and carried out in accordance with the approved guidelines for safeguarding good scientific practice at the institutions in the Leibniz Association and the measures were taken to minimize pain and discomfort and accord with the guidelines laid down by the European Communities Council Directive of 24 November 1986 (86/609/EEC). Veterinary inspection of live pigs and their carcases and organs after slaughter confirmed a lack of any impairments, disease symptoms, or pathological signs. At an average age of 157 days post natum, the experimental pigs were weighed, electronarcotized and slaughtered by exsanguination. The pig’s brains and adrenal gland were swiftly removed during exsanguination for tissue sampling. The amygdala (including sub-nuclei), the hippocampus and hypothalamus were anatomically localized and excised using a stereotaxic atlas of the porcine brain as a reference guide [Citation61]. Tissue samples were flash-frozen in liquid nitrogen and stored at −80°C for transcriptome profiling. Isolation of total RNA from all tissue samples was carried out according to the manufacturer’s specifications using TRI Reagent (Sigma-Aldrich, Taufkirchen, Germany) and RNeasy (Qiagen, Hilden, Germany) kits. Integrity of the isolated RNA was validated by agarose gel electrophoresis (1% agarose gel), RNA quantity was measured on the NanoDrop ND-1000 spectrophotometer (Peqlab, Erlangen, Germany). All RNA was kept at −80°C until use.
Small RNA sequencing
Small RNA species were purified using a miRNeasy Mini Kit (Qiagen, Hilden, Germany). Briefly, total RNA was extracted from 30 to 50 mg of the brain and adrenal tissue samples using the QIAzol lysis reagent (Qiagen, Hilden, Germany). Large RNAs were separated by an RNeasy Mini spin column and a separate fraction enriched in miRNA and other small RNA species was further purified using an RNeasy MinElute spin column according to the manufacturer’s recommendation. Integrity of the total RNA was estimated using an Agilent RNA 6000 Nano kit and the enrichment and quantity of small RNAs including miRNAs were assessed using an Agilent small RNA kit on the 21,000 Bioanalyzer system (Agilent, Santa Clara, CA, USA). Small RNA library preparation was carried out using TruSeq Small RNA Library Preparation Kit according to the user’s guide (Illumina, San Diego, CA, USA). Essentially, 250 ng of small RNA fraction was ligated to the RNA 3´Adapter and then to the RNA 5´Adapter, respectively. The adapter-ligated RNA was reverse transcribed to generate cDNA and PCR amplified for 15 cycles to enrich the cDNA library. Each library was size-separated on 6% polyacrylamide gel. Two bands corresponding to 145–160 nt and >160–300 nt of DNA fragments were excised from the gel and recovered using a standard ethanol precipitation with glycogen and NaOAc. Quality of the DNA library was assessed on a 2100 Bioanalyzer using the High Sensitive DNA assay (Agilent, Santa Clara, CA, USA) and a KAPA library quantification kit (KAPA Biosystems, Wilmington, NC, USA). Multiplexed libraries were parallel sequenced for 60 bp single-reads using the high-output mode of an Illumina HiSeq2500 at the Institute of Genome Biology, Leibniz Institute for Farm Animal Biology (FBN), Dummerstorf, Germany. The base call (BCL) files from the sequencing run were de-multiplexed and converted into the FASTQ files using the bcl2fastq2 conversion software, v2.19 (Illumina, San Diego, CA, USA). The raw fastq files were quality-checked using FastQC, version 0.11.5. The raw data was submitted to a public database, ArrayExpress with the accession number (E-MTAB-7499).
Pre-processing – adapter trimming, quality control, read collapsing
Short RNA libraries raw reads in the range of 65,0M to 149,7M were obtained from the given tissues samples using Illumina HiSeq sequencing. In a first step adapter trimming and quality control was applied using flexbar and fastqc to filter out contaminated sequences and low-quality reads [Citation62–Citation64]. To further condense the data set we removed all reads of vanishingly small abundance, i.e. all sequences with less than 10 reads in any library. For means of annotation, all reads with an identical sequence within the set of clean reads were collapsed into a set of unique sequences. Throughout the manuscript we refer to the set of reads that have passed trimming and quality/abundance filtering as clean reads, and the set of unique sequences we refer to as unique reads. To account for the CCA sequence that is added to the 3ʹ tail of tRNA during post-transcriptional processing, we additionally clipped all clean reads that comprise a CCA sequence at the 3ʹ tail before mapping.
Identification and classification of sncRNA types
Unique and clipped reads were mapped to the current release of sus scrofa genome RefSeq assembly 11.1 (GCF_000003025.6) using bowtie (with alignment mode -v, allowing two mismatches and reporting all best alignments according to the ‘best-strata’ mode). For subsequent annotation, we used the sus scrofa specific annotation release 106, produced by the NCBI eukaryotic genome annotation pipeline. In addition, miRDeep2 was used (standard settings [Citation65]) to annotate existing miRNA with high confidence and identify potential novel miRNA. To complement our annotation with special emphasis on non-coding RNA structures other than miRNA, we used the pig specific high-confidence annotation set of non-coding RNAs, provided by Anthon et al. [Citation66]. The results of the small non-coding RNA classification were further improved by employing a homology-based search against RNAcentral (https://rnacentral.org) [Citation67]. This means previously unclassified reads are aligned to non sus-scrofa RNA structures available in the RNAcentral database. RNAcentral contains annotated RNA structures of all species; however, search results are solely ranked by mapping quality without any regard of taxonomic similarity. Since ncRNA structures are well conserved among closely related species, we further considered taxonomic similarity in addition to alignment quality, to judge the confidence and reliability of the RNA classification.
Data analysis
Note that, due to the high repetitive occurrence of certain sncRNA genes, in particular tRNA, we carefully investigated the nature of ambiguously mapped reads, instead of removing them from the data set during or immediately after mapping. Therefore, we applied additional constraints to differentiate and subsequently remove random hits or non-sncRNA/pseudogene products (e.g. non-miRNA local hairpins) after annotation and before normalization. Important constraints we use are e.g. read coverage and read localization. Reads were removed whose surrounding does not encode functional secondary pre ncRNA structures or that map to non-functional parts of such structures, such as loops. This information was provided by miRDeep2 and the pig specific high-confidence annotation set of non-coding RNAs. Finally, reads with multiple and/or conflicting annotations, i.e. with varying sncRNA entities, were also removed. Note that, remaining multi mappers that result from (functional) sncRNA gene copies are counted only once for the corresponding sncRNA transcript.
If not otherwise stated, reported read counts are normalized for sequencing depth and RNA composition using the median of ratios method provided by DESeq2 [Citation68]. For visualization and clustering approaches variance-stabilizing transformation was applied [Citation68]. Differential expression of transcripts and corresponding FDR (i.e. adjusted p-values, based on Benjamin Hochberg algorithm) were estimated using DESeq2 (default settings) based on mapped read counts. Transcripts with FDR values < 0.05 are considered as differentially expressed. Expression filtering was applied to remove all transcripts with less than 10 normalized read counts per mapped reads in all tissues samples.
To specifically refer to tRNA halves derived from tRNA cleavage due to oxidative stress and hypoxia, we refer to the notation as presented in [Citation48,Citation69] throughout this manuscript. Further, our results, in particular regarding differential miRNA expression, might be biased by the varying expression levels of tRNA between the tissues. Neither our data nor existing studies of our knowledge provide sufficient evidence that miRNA and tRNA expression (or rather the aggregation of tRNA cleavage products) are dependent or independent cellular processes. Therefore, to complement our analysis, we applied the same analysis for a data set consisting of mature miRNA only. The results of this additional analysis is available in the supplemental material (cf. Supplementary Figures 3–5 and Supplementary Tables 3(a/b) and 4(a/b)) indicating that there is no admixture of the tRF and miRNA population. To obtain an estimate of sample-specific tRNA transcription other than by mature tRNA, we consider small RNA genes that are transcribed by RNA polymerase III (Pol III). In eukaryotic cells RNA Polymerase III transcribes tRNA and other sncRNA genes, such as e.g. 5S rRNA and U6 snRNA, which are all typically considered as house-keeping genes [Citation70]. U6 is often applied as a control probe in Northern Blots. Analysing the sample-specific distribution of U6 and 5S (sus-scrofa specific) transcription levels will provide a general measure of Pol III-mediated transcription and indicate differential transcription between tissues or samples. In addition, sample-specific size factors estimated from transcription levels of U6/5S can be subsequently used for in-silico normalization of tRNA. Thereby the estimated size factors account for the read coverage of each library/sample without being biased by sncRNA transcripts with differential transcription or accumulation [Citation71]. Regarding tissue-specific (mature) tRNA abundance that may affect the differential tRNA fragment (tRF) profile among the tissues or samples; we further applied U6/5S-based normalization of tRNA. The results of this additional analysis are available in the supplemental material (cf. Supplementary Figures 6–7 and Supplementary Tables 5(a/b)). Supplementary Figures 6–7 and Supplementary Tables 5(a/b) shows that the transcription levels of both U6 and 5S are very similar between the tissues and also between the samples (as indicated by small dispersion between tissue samples). Reads counts from both U6 snRNA and 5S rRNA are almost equally distributed between samples of brain tissues. In contrast to that, read counts of both sncRNA classes are higher in Adrenal Gland, in particular for U6 snRNA. These results strongly indicate that POL III – mediated transcription (which includes tRNA) is at the same level in brain tissues and slightly increased in Adrenal Gland.
Availability of data and materials
The sncRNAseq data that support the findings of this study are available in ArrayExpress with the accession number (E-MTAB-7499).
Supplemental Material
Download Zip (8.9 MB)Acknowledgments
The authors thank Joana Bittner, Nicole Gentz and Annette Jugert for excellent technical assistance.
Disclosure statement
No potential conflict of interest was reported by the authors.
Supplementary material
Supplemental data for this article can be accessed here.
Additional information
Funding
Related Research Data
References
- Qureshi IA, Mehler MF. Emerging roles of non-coding RNAs in brain evolution, development, plasticity and disease. Nat Rev Neurosci. 2012;13(8):528–541.
- Gustincich S, Sandelin A, Plessy C, et al. The complexity of the mammalian transcriptome. J Physiol. 2006;575:321–332.
- Kapranov P, Laurent GS, Raz T, et al. The majority of total nuclear-encoded non-ribosomal RNA in a human cell is ’dark matter’ un-annotated RNA. BMC Biol. 2010;8(1):149.
- Marta Melé PG, Ferreira FR, DeLuca DS, et al. The human transcriptome across tissues and individuals. Science. 2015;348(6235):660–665
- Kaur P, Liu F, Tan JR, et al. Non-coding RNAs as potential neuroprotectants against ischemic brain injury. Brain Sci. 2013;3(1):360–395.
- Joseph L. The amygdala. Curr Biol. 2007;17(20):R868–R874.
- Mei B, Li C, Dong S, et al. Distinct gene expression profiles in hippocampus and amygdala after fear conditioning. Brain Res Bull. 2005;67(1):1–12.
- Davis M, Rainnie D, Cassell M. Neurotransmission in the rat amygdala related to fear and anxiety. Trends Neurosci. 1994;17(5):208–214.
- Nader K, Majidishad P, Amorapanth P, et al. Damage to the lateral and central, but not other, amygdaloid nuclei prevents the acquisition of auditory fear conditioning. Learn Mem. 2001;8(3):156–163.
- Adolphs R. What does the amygdala contribute to social cognition? Ann N Y Acad Sci. 2010;1191(1):42–61.
- Fox AS, Oler JA, Tromp DPM, et al. Extending the amygdala in theories of threat processing. Trends Neurosci. 2015;38(5):319–329.
- Richter-Levin G, Akirav I. Amygdala-hippocampus dynamic interaction in relation to memory. Mol Neurobiol. 2000;22(1):11–20.
- Sean MS and Vale WW. The role of the hypothalamic-pituitary-adrenal axis in neuroendocrine responses to stress. Dialogues Clin Neurosci. 2006;8(4):383–395.
- Herman JP, McKlveen JM, Ghosal S, et al. Regulation of the hypothalamic-pituitary-adrenocortical stress response. Compr Physiol. 2016;6(2):603–621.
- Burford NG, Webster NA, Cruz-Topete D. Hypothalamic-pituitary-adrenal axis modulation of glucocorticoids in the cardiovascular system. Int J Mol Sci. 2017;18(10):2150.
- Anderson P, Ivanov P. tRNA fragments in human health and disease. FEBS Lett. 2014;588(23):4297–4304.
- Blanco S, Sabine Dietmann JV, Flores SH, et al. Aberrant methylation of tRNAs links cellular stress to neuro-developmental disorders. Embo J. 2014;33(18):2020–2039. ISSN 0261-4189, 1460-2075.
- Saikia M, Krokowski D, Guan B-J, et al. Genome-wide identification and quantitative analysis of cleaved tRNA fragments induced by cellular stress. J Biol Chem. 2012;287(51):42708–42725.
- Dhahbi JM, Spindler SR, Atamna H, et al. 5ʹtRNA halves are present as abundant complexes in serum, concentrated in blood cells, and modulated by aging and calorie restriction. BMC Genomics. 2013;14:298.
- Mishima E, Inoue C, Saigusa D, et al. Conformational change in transfer RNA is an early indicator of acute cellular damage. J Am Soc Nephrol. 2014;25(10):2316–2326.
- Selitsky SR, Baran-Gale J, Honda M, et al. Small tRNA-derived RNAs are increased and more abundant than microRNAs in chronic hepatitis b and c. Sci Rep. 2015;5. DOI:10.1038/srep07675.
- Torrent M, Chalancon G, de Groot NS, et al. Cells alter their tRNA abundance to selectively regulate protein synthesis during stress conditions. Sci Signal. 2018;11(546):6409.
- Blanco S, Frye M. Role of RNA methyltransferases in tissue renewal and pathology. Curr Opin Cell Biol. 2014;31:1–7.
- Saikia M, Jobava R, Parisien M, et al. Angiogenin- cleaved tRNA halves interact with cytochrome c, protecting cells from apoptosis during osmotic stress. Mol Cell Biol. 2014;34(13):2450–2463.
- Ivanov P, Elizabeth O’Day MM, Emara GW, et al. G-quadruplex structures contribute to the neuroprotective effects of angiogenin-induced tRNA fragments. PNAS. 2014;111(51):18201–18206.
- Emara MM, Ivanov P, Hickman T, et al. Angiogenin-induced tRNA-derived stress-induced RNAs promote stress-induced stress granule assembly. J Biol Chem. 2010;285(14):10959–10968.
- Nallamshetty S, Chan SY, Loscalzo J. Hypoxia: A master regulator of MicroRNA biogenesis and activity. Free Radic Biol Med. 2013;64:20.
- Riggs CL, Amanda Summers DE, Warren GE, et al. Small non-coding RNA expression and vertebrate anoxia tolerance. Front Genet. 2018;9. DOI:10.3389/fgene.2018.00230.
- Jiang L-H, Zhang H-D, Tang J-H. MiR-30a: A novel biomarker and potential therapeutic target for cancer. J Oncol. 2018;2018:1–9.
- Uhlmann S, Mracsko E, Javidi E, et al. Genome-wide analysis of the circulating miRNome after cerebral ischemia reveals a reperfusion-induced MicroRNA cluster. Stroke. 2017;48(3):762–769.
- Lee S-T, Chu K, Jung K-H, et al. MicroRNAs induced during ischemic preconditioning. Stroke. 2010;41(8):1646–1651.
- Rom S, Dykstra H, Zuluaga-Ramirez V Reichenbach NL, et al. miR-98 and let-7g* protect the blood-brain barrier under neuroinflammatory conditions. J Cereb Blood Flow Metab. 2015;35(12):1957–1965.
- Lagos-Quintana M, Rauhut R, Yalcin A, et al. Identification of tissue-specific MicroRNAs from mouse. Curr Biol. 2002;12(9):735–739.
- Zhao Y, Zhang J, Yang H, et al. Memory retrieval in addiction: a role for miR-105-mediated regulation of d1 receptors in mPFC neurons projecting to the basolateral amygdala. BMC Biol. 2017;15(1):128.
- Landgraf P, Rusu M, Sheridan R, et al. A mammalian microRNA expression atlas based on small RNA library sequencing. Cell. 2007;129(7):1401–1414.
- Wang W, Kwon EJ, Tsai L-H. MicroRNAs in learning, memory, and neurological diseases. Learn Mem. 2012;19(9):359–368.
- Sim S-E, Lim C-S, Kim J-I, et al. The brain-enriched MicroRNA miR-9-3p regulates synaptic plasticity and memory. J Neurosci. 2016;36(33):8641–8652.
- Da-wei L, Liu J-Z, Shu-chen L, et al. Fear conditioning downregulates miR-138 expression in the hippocampus to facilitate the formation of fear memory. NeuroReport. 2018;29(16):1418.
- Zhou X-M, Liu J, Wang Y, et al. microRNA-129-5p involved in the neuro-protective effect of dexmedetomidine on hypoxic-ischemic brain injury by targeting COL3a1 through the wnt/β-catenin signaling pathway in neonatal rats. J Cell Biochem. 2018. DOI:10.1002/jcb.26704
- Fernandes J, Vieira AS, Kramer-Soares JC, et al. Hippocampal microRNA-mRNA regulatory network is affected by physical exercise. Biochim Biophys Acta Gen Subj. 2018;1862(8):1711–1720.
- Yamasaki S, Ivanov P, Guo-Fu H, et al. Angiogenin cleaves tRNA and promotes stress-induced translational repression. J Cell Biol. 2009;185(1):35–42.
- Hanjiang F, Feng J, Liu Q, et al. Stress induces tRNA cleavage by angiogenin in mammalian cells. FEBS Lett. 2009;583(2):437–442.
- Raina M, Ibba M. tRNAs as regulators of biological processes. Front Genet. 2014;5. DOI:10.3389/fgene.2014.00171
- Richard G. Toward a more complete view of tRNA biology. Nat Struct Mol Biol. 2008;15(10):1007–1014.
- Phizicky EM, Hopper AK. tRNA biology charges to the front. Genes Dev. 2010;24(17):1832–1860.
- Martyna Nowacka PM, Strozycki PJ, Hojka-Osinska A, et al. Identification of stable, high copy number, medium-sized RNA degradation intermediates that accumulate in plants under non-stress conditions. Plant Mol Biol. 2013;83(3):191–204.
- Dhahbi JM. 5ʹtRNA halves: The next generation of immune signaling molecules. Front Immunol. 2015;6. DOI:10.3389/fimmu.2015.00074.
- Pavel Ivanov MM, Emara JV, Gygi SP, et al. Angiogenin-induced tRNA fragments inhibit translation initiation. Mol Cell. 2011;43(4):613–623.
- Thompson DM, Cheng L, Green PJ, et al. tRNA cleavage is a conserved response to oxidative stress in eukaryotes. RNA. 2008;14(10):2095–2103.
- Qing L, Bin H, Guo-wen H, et al. tRNA-derived small non-coding RNAs in response to ischemia inhibit angiogenesis. Sci Rep. 2016;6:srep20850.
- Thompson DM, Parker R. Stressing out over tRNA cleavage. Cell. 2009;138(2):215–219.
- Hou Y-M, Yang X. Regulation of cell death by transfer RNA. Antioxid Redox Signal. 2013;19(6):583–594.
- Gebetsberger J, Wyss L, Mleczko AM, et al. A tRNA-derived fragment competes with mRNA for ribosome binding and regulates translation during stress. RNA Biol. 2017;14(10):1364–1373.
- Lyons SM, Gudanis D, Coyne SM, et al. Identification of functional tetramolecular RNA g-quadruplexes derived from transfer RNAs. Nat Commun. 2017;8. DOI:10.1038/s41467-017-01278-w.
- Hermans EJ, Hein JF, van Marle L, et al. Stress-related noradrenergic activity prompts large-scale neural network reconfiguration. Science. 2016;334(6059):1151–1153.
- Vaisvaser S, Lin T, Admon R, et al. Neural traces of stress: cortisol related sustained enhancement of amygdala-hippocampal functional connectivity. Front Hum Neurosci. 2013;7:313.
- Kiem SA, Andrade KC, Spoormaker VI, et al. Resting state functional MRI connectivity predicts hypothalamus-pituitary-axis status in healthy males. Psychoneuroendocrinology. 2013;38(8):1338–1348.
- Soares AR, Fernandes N, Reverendo M, et al. Conserved and highly expressed tRNA derived fragments in zebrafish. BMC Mol Biol. 2015;16:22.
- Lee YS, Shibata Y, Malhotra A, et al. A novel class of small RNAs: tRNA-derived RNA fragments (tRFs). Genes Dev. 2009;23:2639–2649.
- Torres AG, Reina O, Stephan-Otto Attolini C, et al. Differential expression of human tRNA genes drives the abundance of tRNA-derived fragments. Proc Natl Acad Sci USA. 2019;116:8451–8456.
- Felix B, Leger ME, Albe-Fessard D, et al. Stereotaxic atlas of the pig brain. Brain Res Bull. 1999;49(1):1–137.
- Dodt M, Roehr JT, Ahmed R, et al. FLEXBAR-flexible barcode and adapter processing for next-generation sequencing platforms. Biology (Basel). 2012;1(3):895–905. ISSN 2079-7737.
- Roehr JT, Dieterich C, Knut R. Flexbar 3.0 - SIMD and multicore parallelization. Bioinformatics. 2017;3318:2941–2942. ISSN 1367-4811.
- Andrews S. Fastqc: a quality control tool for high throughput sequence data; 2010. [cited 2018 Jan 10]. Available from: http://www.bioinformatics.babraham.ac.uk/projects/fastqc
- Friedländer MR, Mackowiak SD, Na L, et al. miRDeep2 accurately identifies known and hundreds of novel microRNA genes in seven animal clades. Nucleic Acids Res. 2012;40(1):37–52.
- Anthon C, Hakim Tafer JH, Havgaard BT, et al. Structured RNAs and synteny regions in the pig genome. BMC Genomics. 2014;15:459.
- TheRNAcentralConsortium. Rnacentral: a comprehensive database of non-coding rna sequences. Nucleic Acids Res. 2017;45(D1):D128–D134.
- Love MI, Huber W, Anders S. Moderated estimation of fold change and dispersion for RNA-seq data with DESeq2. Genome Biol. 2014;15(12):550.
- Yang XL. tRNA-derived G-quadruplex protects motor neurons. Proc Natl Acad Sci U S A. 2014;111(51):18108–18109.
- Dieci G, Fiorino G, Castelnuovo M, et al. The expanding RNA polymerase III transcriptome. Trends Genet. 2007;23(12):614–622.
- Anders S, Huber W. Differential expression analysis for sequence count data. Genome Biol. 2010;11:106.