
ABSTRACT
RNA structure prediction programs remain imperfect and many substructures are still identified by manual exploration, which is most efficiently conducted within an RNA structure drawing program. However, most nucleic acid structure drawing programs have limited capability for structure modification (i.e., breaking and forming new bonds between bases), often requiring that the structure notation be textually edited. RNA2Drawer was developed to allow for graphical structure editing while maintaining the geometry of a drawing (e.g., ellipsoid loops, stems with evenly stacked base pairs) throughout structural changes and manual adjustments to the layout by the user. In addition, the program allows for annotations such as colouring and circling of bases and drawing of tertiary interactions (e.g., pseudoknots). RNA2Drawer can also draw commonly desired elements such as an optionally flattened outermost loop and assists structure editing by automatically highlighting complementary subsequences, which facilitates the discovery of potentially new and alternative pairings, particularly tertiary pairings over long-distances, which are biologically critical in the genomes of many RNA viruses and cannot be accurately predicted by current structure prediction programs. Additionally, RNA2Drawer outputs drawings either as PNG files, or as PPTX and SVG files, such that every object of a drawing (e.g., bases, bonds) is an individual PPTX or SVG object, allowing for further manipulation in Microsoft PowerPoint or a vector graphics editor such as Adobe Illustrator. PowerPoint is the standard for presentations and is often used to create figures for publications, and RNA2Drawer is the first program to export drawings as PPTX files.
Introduction
Nucleic acid structures are commonly depicted in 2-dimensional drawings such as those produced by programs such as VARNA [Citation1], RnaViz [Citation2], and XRNA [Citation3]. Although existing programs can produce publication-quality drawings of an initial structure with a variety of layout algorithms, these programs typically have limited faculties for modifying the drawn structure (i.e., breaking and forming different bonds between bases). In most programs, the structure can only be modified by textually editing the structure notation (RnaViz, XRNA). Additionally, modifying the structure usually requires creating a new drawing, which loses annotations (e.g., base colourings) made in the previous drawing, or requires resetting the layout of the entire drawing, which loses previous manual adjustments to the layout (VARNA). Structure prediction programs remain imperfect, especially for long sequences (> 250 nt), and possible alternative structures are frequently identified by manual exploration, which is most readily accomplished graphically within the drawn structure.
Several recently created programs, e.g., forna [Citation4], RiboSketch [Citation5] and jViz.RNA 4.0 [Citation6] (here on referred to as jViz), emphasize graphical editing of the structure of a drawing. These three programs can draw structures in planar graph layouts, which forna and RiboSketch produce using the NAView algorithm [Citation7,Citation8]. In these programs, bonds are formed and broken by clicking on the bond/bases involved, and the layout of a drawing is adjusted by manual translation/rotation of selections of bases and, in forna and RiboSketch, by force-based simulation [Citation4]. Although manual manipulation of bases and force-based simulation allow for rapid adjustments to the layout of a drawing, it is difficult to maintain the geometry of a drawing, resulting in contorted loops and bent stems with uneven stacking of base pairs. Drawings can also become disorderly over the course of a large number of manual manipulations of the structure if the geometry of stems and loops is not enforced by the drawing program, which complicates long sessions of manual structure exploration.
Sparse structures (i.e., structures with sections of well-defined structure connected by long unpaired stretches) are routinely drawn to highlight well-studied regions within a larger sequence. The long unpaired stretches of sparse structures produce large extrusions with the NAView layout algorithm and are difficult to control in force-based simulation. Sparse structures are better drawn with an ellipsoid outermost loop or, more typically, a flat outermost loop, such as can be drawn by VARNA or StructureLab [Citation9], a software suite combining RNA structure prediction and visualization.
While forna, RiboSketch, and jViz allow graphical editing of the structure of a drawing, complementary subsequences that might engage in alternative pairings must still be found manually within the drawing. Finding complementary subsequences within an RNA can be laborious even for short sequences, especially when including GU wobble pairs. Automatic highlighting of complementary subsequences would reveal proximal and distal alternative pairings more rapidly. Long-distance tertiary pairings, commonly involving hairpin terminal and internal loops, are biologically critical for many RNA viruses [Citation10,Citation11], and structure prediction programs remain incapable of their accurate prediction.
RNA2Drawer was developed to allow the drawing of structures with geometrically strict layouts and commonly desired structural motifs (e.g., ellipsoid loops and a flat outermost loop), while also allowing manual layout adjustment and graphical structure editing aided by automatic highlighting of complementary subsequences. As detailed below, additional features of RNA2Drawer include drawing of tertiary interactions, annotations such as colouring, circling and shading of bases, and exporting drawings as PPTX and SVG files. In exported PPTX and SVG files, each object of a drawing (e.g., bases, bonds) is an individual PPTX or SVG object, allowing for further manipulation in Microsoft PowerPoint or a vector graphics editor such as Adobe Illustrator.
User Guide/Free Download: https://github.com/pzhaojohnson/RNA2Drawer/blob/master/README.md#rna2drawer
Results
Input
RNA2Drawer can draw structures from a CT or dot-bracket notation file, such as those generated by an RNA prediction program such as Mfold [Citation12]. RNA2Drawer can also draw RNA and DNA sequences typed in via a top-level menu or read from a file containing the sequence (e.g., a FASTA file or plain text file). Such sequences are initially drawn with no base pairs. As with any drawing, base pairs can be formed and broken graphically. RNA2Drawer can also draw substructures of a larger structure contained in any of the above formats.
Output
RNA2Drawer exports drawings as PPTX or SVG files, such that every object of the drawing (e.g., bases, bonds) is an individual PPTX or SVG object in the exported file. For example, each base is exported as a text object and each base pair bond is exported as a line object, allowing further manipulation in PowerPoint or a vector graphics editor such as Illustrator. Such applications also have rich faculties for creating the final image of a drawing in a wide range of formats (e.g., PNG, TIFF, JPEG). Additionally, RNA2Drawer can export drawings in VARNA format, as well as export screenshots in PNG format.
Three layouts
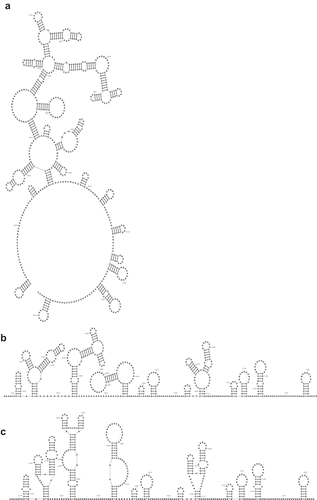
RNA2Drawer draws structures in ‘radial’, ‘flat base’ and ‘rigid’ layouts. In the ‘radial’ layout, all loops have an ellipse shape ()). Stems can be radially pivoted around loops to adjust the layout of the drawing. To help avoid base overlaps in the initial layout of a drawing, the angles of stems are radialized in a manner similar to the NAView algorithm, with loops farther away from the outermost loop being compacted to reduce the size of the drawing. In the ‘flat base’ layout, the outermost loop is flattened, while maintaining the ellipse shape of all inner loops ()). Stems can be shifted along the flat outermost loop in addition to being radially pivoted around inner loops. In the ‘rigid’ layout, all stems point in the same direction, which involves drawing triangular multibranch loops ()).
Figure 1. Structure drawings in the (a) ‘radial’, (b) ‘flat base’, and (c) ‘rigid’ layouts.
Graphical structure editing with highlighting of complementary subsequences
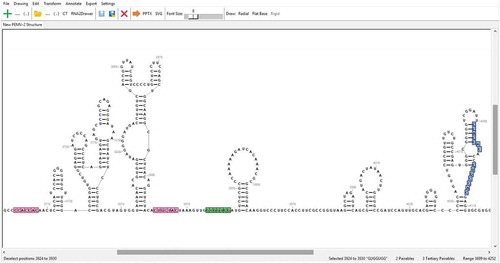
The structure of a drawing can be easily modified in RNA2Drawer. Sequential subsequences are selected using the mouse and arrow keys (). Subsequences complementary to the selected subsequence are automatically highlighted, distinguishing between pairings that can be incorporated into the secondary structure and those that would be tertiary. The option is also available to not highlight GU/GT pairings, as well as to highlight imperfect complementary subsequences (of equal length to the selected subsequence) based on a percentage of required matches. Clicking on a complementary subsequence forms the pairing in the secondary structure or opens a top-level menu for adding a tertiary interaction, with the base positions for the interaction filled in. Conversely, clicking on a selected subsequence will break all base pairs involving the bases in the selected subsequence. The layout of a drawing is automatically adjusted to changes in the secondary structure, and the user can further adjust the layout by radially pivoting stems around loops.
Figure 2. A screenshot of the graphical user interface. Positions 3,924 to 3,930 are currently selected and highlighted in green. Highlighted in pink are two complementary subsequences whose pairings could be incorporated into the secondary structure, and highlighted in blue are two complementary subsequences whose pairings would be tertiary. At the bottom is the information bar, which displays helpful information such as (from left to right) what clicking the mouse will currently do, the currently selected subsequence and its positional range, the numbers of complementary subsequences, and the positional range of the entire sequence.
Noncanonical base pairs can be incorporated into the secondary structure via a top-level menu, or represented as a tertiary interaction. Currently, RNA2Drawer cannot symbolically notate the bonds of noncanonical base pairs to indicate their type, as in the Leontis and Westhof notation [Citation13], though users can draw such bond notations in exported PPTX and SVG files with PowerPoint or a vector graphics editor.
Customization and drawing of tertiary interactions
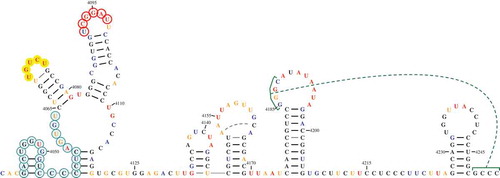
RNA2Drawer gives users precise control over many aspects of a drawing (e.g., base font, highlighting and numbering, base and bond colour, etc.) via top-level menus (). A complete list of customizable features is contained in the user guide. Bases, or circling of bases, can be coloured according to chemical structure probing data (e.g., SHAPE [Citation14]). RNA2Drawer also draws tertiary interactions by drawing two lines over the participating subsequences that ‘cap’ them and a curved, movable line connecting the two capping lines (). The two capping lines can be optionally omitted, which is useful when representing a noncanonical base pair as a tertiary interaction.
Figure 3. Example of a highly customized drawing. All manipulations were accomplished within the RNA2Drawer program. The font of bases and numbering is Times New Roman in bold. The width and length of the area occupied by a base are 1.6 and 1.6 units, respectively. The sequence numbering offset is 4,039, the numbering interval is 15, and numbering starts at position 4,050. Bases are coloured by structure probing data, and the colour of numbering is black. Circles with varying outline and fill colours/transparencies are drawn behind select subsequences. The thickness of base pair bonds is 1.5 units, and the padding between base pair bonds and participating bases is 1 unit. GC and AU bonds are coloured black, while GU and noncanonical bonds are coloured grey. The noncanonical bond between positions 4,180 and 4,201 is incorporated into the secondary structure, while the noncanonical bond between positions 4,153 and 4,162 is represented as a tertiary interaction with the capping lines omitted. The pseudoknot between positions 4,185 to 4,188 and 4,249 to 4,252 is also represented by a tertiary interaction.
Interoperation with other drawing programs
RNA2Drawer can draw structures with a fixed layout from a file containing the coordinates of bases. This allows other drawing programs to make use of RNA2Drawer’s faculties for customizing a drawing and exporting drawings as PPTX and SVG files. Full details are in the user guide for how to format a file containing base coordinates to be drawn by RNA2Drawer. Notably, RNA2Drawer can draw a structure from the X and Y base coordinates contained in a RiboSketch (RS) file.
Discussion
compares features of RNA2Drawer with features of other nucleic acid drawing programs. RNA2Drawer’s geometrically strict drawing style promotes the production of publication-quality drawings of nucleic acid structures and additionally allows for long sessions of structure exploration, for which the ability of RNA2Drawer to highlight complementary subsequences aids in the discovery of new structural features and long-distance tertiary pairings. RNA2Drawer allows for graphical structure editing of drawings with a flat outermost loop. The ‘rigid’ layout drawn by RNA2Drawer aids comparisons among structures drawn with a flat outermost loop as well, as biologically insignificant structural differences (e.g., small differences in the lengths of stems and unpaired stretches) have only a minor effect on the drawing overall, bringing into focus major conserved structural features such as the number of hairpins/stems and the branching pattern of stems.
Table 1. Comparison of RNA2Drawer with other nucleic acid structure drawing programs.
Many aspects of a drawing can be precisely customized within RNA2Drawer, and drawings exported as PPTX and SVG files can be further customized using the rich faculties of PowerPoint and vector graphics editors such as Illustrator. RNA2Drawer files exported as PPTX and SVG files can be integrated into larger figures with text labels and shapes drawn around structural features. Although RnaViz allows for some annotations such as text labels, nucleic acids structure drawing programs inherently are not meant to substitute for illustration generating programs, and therefore RNA2Drawer was designed to pass preliminary figures to the dedicated programs in a compatible format requiring no intermediate conversion steps.
Materials and methods
RNA2Drawer is written in Python 3 using the Tkinter and Pmw modules for the graphical user interface. PPTX files are generated using the python-pptx module, and names of colours are converted to RGB values using the webcolors module. The binary distribution of RNA2Drawer for the Microsoft Windows operating system was generated with PyInstaller. Source and test code and documentation for manual tests are available via the user guide/download link above.
Acknowledgments
The content of this publication does not necessarily reflect the views or policies of the Department of Health and Human Services, nor does mention of trade names, commercial products, or organizations imply endorsement by the U.S. Government. This study used computational resources and support of the National Cancer Institute’s Advanced Biomedical Computing Centre.
Disclosure statement
No potential conflict of interest was reported by the authors.
Additional information
Funding
Related Research Data
References
- Darty K, Denise A, Ponty Y. VARNA: interactive drawing and editing of the RNA secondary structure. Bioinformatics. 2009;25(15):1974–1975.
- De Rijk P, Wuyts J, De Wachter R. RnaViz 2: an improved representation of RNA secondary structure. Bioinformatics. 2003;19(2):299–300.
- UCSC XRNA. [cited 2019 Aug 19]. http://rna.ucsc.edu/rnacenter/xrna/xrna.html
- Kerpedjiev P, Hammer S, Hofacker IL. Forna (force-directed RNA): simple and effective online RNA secondary structure diagrams. Bioinformatics. 2015;31(20):3377–3379.
- Lu JS, Bindewald E, Kasprzak WK, et al. RiboSketch: versatile visualization of multi-stranded RNA and DNA secondary structure. Bioinformatics. 2018;34(24):4297–4299.
- Shabash B, Wiese KC. jViz.RNA 4.0-visualizing pseudoknots and RNA editing employing compressed tree graphs. PLoS ONE. 2019;14(5):e0210281.
- Bruccoleri RE, Heinrich G. An improved algorithm for nucleic acid secondary structure display. Comput Appl Biosci. 1988;4(1):167–173.
- Shapiro BA, Maizel J, Lipkin LE, et al. Generating non-overlapping displays of nucleic acid secondary structure. Nucleic Acids Res. 1984;12:75–88.
- Shapiro BA, Kasprzak W. STRUCTURELAB: a heterogeneous bioinformatics system for RNA structure analysis. J Mol Graph. 1996;14(4):194–205.
- Simon AE. 3’UTRs of carmoviruses. Virus Res. 2015;206:27–36.
- Nicholson BL, White KA. Functional long-range RNA-RNA interactions in positive-strand RNA viruses. Nat Rev Microbiol. 2014;12(7):493–504.
- Zuker M. Mfold web server for nucleic acid folding and hybridization prediction. Nucleic Acids Res. 2003;31(13):3406–3415.
- Leontis NB, Westhof E. Geometric nomenclature and classification of RNA base pairs. RNA. 2001;7(4):499–512.
- Wilkinson KA, Merino EJ, Weeks KM. Selective 2’-hydroxyl acylation analyzed by primer extension (SHAPE): quantitative RNA structure analysis at single nucleotide resolution. Nat Protoc. 2006;1(3):1610–1616.
- Byun Y, Han K. PseudoViewer: web application and web service for visualizing RNA pseudoknots and secondary structures. Nucleic Acids Res. 2006;34(Web Server issue):W416–W42.
- Elias R, Hoksza D. TRAVeLer: a tool for template-based RNA secondary structure visualization. BMC Bioinformatics. 2017;18(1):487.
- Weinberg Z, Breaker RR. R2R–software to speed the depiction of aesthetic consensus RNA secondary structures. BMC Bioinformatics. 2011;12:3.
- Jossinet F, Westhof E. Sequence to Structure (S2S): display, manipulate and interconnectRNA data from sequence to structure. Bioinformatics. 2005;21(15):3320–3321.
- Jossinet F, Ludwig TE, Westhof E. Assemble: an interactive graphical tool to analyzeand build RNA architectures at the 2D and 3D levels. Bioinformatics. 2010;26(16):2057–2059.