
ABSTRACT
Although deregulated circulatory miRNA signatures during diabetes have been identified for some years now, the effects of such miRNAs on several target tissues are not yet thoroughly investigated. The skin that is nourished by components present in the circulation exhibits several notable abnormal features during diabetes. We, therefore, hypothesized that such altered circulatory miRNA levels might be critical in the onset and progression of impaired skin health during diabetes. RNA sequencing from blood samples of normal and type 2 diabetic human subjects identified 9 upregulated and 19 downregulated miRNAs. miR-98-5p was significantly downregulated and its overexpression down-regulated PPP1R15B levels in HaCaT cells and this was prevented by the miR-98-5p inhibitor. This was validated in human primary epidermal keratinocytes and further supported by a dual reporter luciferase assay of the PPP1R15B 3ʹUTR where miR-98-5p significantly decreased the luciferase activity which was prevented in the presence of the miRNA inhibitor and by mutation in the miRNA binding site. By targeting PPP1R15B, miR-98-5p increases levels of p-eIF2α, BiP and CHOP. Consequently, there was induction of apoptosis accompanied with decreased proliferation in the presence of miR-98-5p. Conversely, miR-98-5p inhibition alone inhibited apoptosis and promoted proliferation. Taken together, our data suggest that by targeting PPP1R15B, miR-98-5p induces apoptosis and decreases proliferation. As opposed to this since circulatory miR-98-5p levels are decreased in diabetes, we believe that this decrease in the circulation that feeds the skin layers might be a major contributor of hyperproliferation as seen in the skin during diabetes.
Abbreviations: miRNAs: MicroRNAs; PPP1R15B: PPP1R15B: Protein Phosphatase 1 Regulatory Subunit 15B; TGFβR1: Transforming Growth Factor Beta Receptor 1; ER: Endoplasmic Reticulum; Bip: Binding Immunoglobulin Protein; Chop: CCAAT-enhancer-binding protein homologous protein; p-eIF2α: Eukaryotic Translation Initiation Factor 2a; Bax: Bcl2-associated X protein; Bcl-2: B-cell CLL/lymphoma 2; PCNA: Proliferating Cell Nuclear Antigen; K5: Cytokeratin 5; qRT-PCR: Quantitative Real-Time PCR; ESCC: Oesophageal squamous cell carcinoma; HCC: Hepatocellular carcinoma; CTHRC1: Collagen triple helix repeat containing 1; SALL4: Sal-like protein 4; TNFα: Tumour Necrosis Factor alpha; PGC-1β: Peroxisome Profilerator-activated receptor-γ coactivator-1β; IGF2BP1: Insulin-like growth factor 2 mRNA binding protein 1.
Introduction
The skin is the largest organ of the body and serves as the outermost barrier that protects the inner organs from any kind of damage [Citation1]. It primarily acts by preventing the invasion of pathogens, by maintaining water and solute balance [Citation2,Citation3] and warding off external assaults. Stratum corneum mainly forms the physical barrier [Citation1] and it consists of corneocytes, cytoskeletal elements and lipid-enriched intercellular domains [Citation1,Citation4]. Lipids synthesized in the keratinocytes and extruded into the extracellular domains during epidermal differentiation form extracellular lipid-enriched layers that significantly contribute towards the protective layer of the skin [Citation1,Citation5]. Epidermal gap and adherens junctions, desmosomes and cytoskeletal elements also form part of such a physical barrier [Citation6]. Also, innate and adaptive immune systems in the skin allow it to effectively fight infections [Citation7]. The skin provides a first line of defence against any infection or assault that the body encounters [Citation7], and therefore, skin health is of immense significance for the overall well-being of an individual. The skin is nourished via the circulation and the blood components are crucial in maintaining the normal physiology of the skin tissue. Although the epidermis does not contain blood vessels, but its deepest layers are nourished by the blood capillaries that are present in the upper layer of the dermis. This serves to provide nourishment, material exchange and waste removal from the epidermis. There are a considerable number of vessels that feed the skin cells, hair follicles and sebaceous glands. However, during some pathological states, the abnormal composition of the blood makes the skin prone to several metabolic alterations that interfere with the normal functioning of the skin.
Type 2 diabetes is a chronic inflammatory metabolic disorder that is associated with decreased insulin responsiveness accompanied by diminished insulin secretion from the pancreas [Citation8,Citation9]. In addition to these cellular deregulations, levels of several circulatory moieties are also altered during diabetes that are frequently considered as reliable biomarkers of the onset and progression of diabetes and its complications [Citation10–Citation12]. In the recent past, it has been demonstrated that several microRNAs (miRNAs) are released into the circulation during metabolic disorders including type 2 diabetes and these have emerged as valuable tools to evaluate the disease initiation and progression [Citation13–Citation15].
MicroRNAs (miRNAs) are small ~22 nucleotides long, endogenously produced RNA species that regulate gene expression by either mRNA (target) degradation or translational repression [Citation16–Citation18]. Altered levels of miRNAs are associated with several diseases [Citation19–Citation21] wherein they modulate several physiological and pathological cellular pathways [Citation22]. Several of these altered miRNAs are released out into the circulation where they are more stable and possess a longer half-life as compared to other circulatory nucleotides[Citation23]. miRNAs were first reported to be present in the circulation, specifically, in the platelets, erythrocytes, and nucleated blood cells [Citation24]. They are remarkably stable under diverse harsh conditions and subsequent studies suggested that such endogenous circulatory miRNAs are protected in a manner that helps them escape the circulatory degrading machinery. miRNAs are presumably packaged in microparticles like exosomes, microvesicles, and apoptotic bodies [Citation25,Citation26] or associated with RNA-binding proteins (Argonaute2) [Citation27] or lipoprotein complexes (high-density lipoprotein) (HDL) [Citation28] and this helps them to smoothly evade degradation [Citation29].
Although there are several reports of altered circulatory miRNA signatures during diabetes [Citation30], not much has been done on the consequences of such altered circulatory miRNAs during impaired skin health that is associated with diabetes. Here, we sought to evaluate if these altered miRNAs might affect the skin health [Citation31,Citation32] and if so, the mechanisms involved.
Results
Differential expression of circulatory miRNAs in type 2 diabetic human subjects
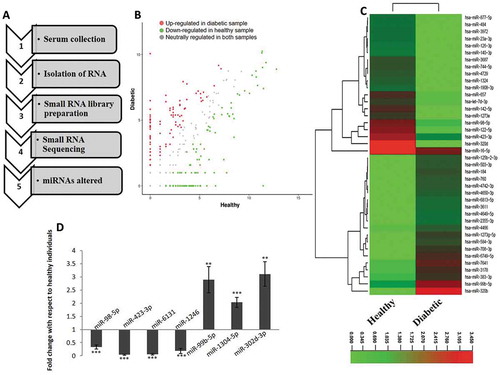
Fasting blood samples were collected from healthy and type 2 diabetic human subjects (n = 5 from each group). The biochemical parameters of the subjects taken for the study are given in . RNA was isolated and small RNA sequencing and analysis was done and the workflow is shown in ). Approximately, a total of 51 and 81 million raw reads were generated from the normal and diabetic subjects, respectively (). After removing adapter contaminants, the filtered and processed unique reads of about 2.3 and 1.6 million in the normal and diabetic populations, were mapped onto the human miRNA database. Among these unique reads, about 21% and 24% from the normal and diabetic sets, mapped onto the human miRNA database. Expression of miRNAs was quantified on the basis of their FPKM values and 81 miRNAs were up-regulated and 154 were down-regulated with a fold change of ≥ ± 1.2. The scatter plot of these altered miRNAs in the diabetic subjects as compared to those in the healthy individuals together with the heat map is shown in . From these, a list of the highly altered miRNAs with specific fold changes ≥ ± 2.0 (9 upregulated and 19 downregulated) is shown in . Four down-regulated and three up-regulated miRNAs were taken for qRT-PCR validation of the RNA sequencing data. Fold changes of miRNA expression in diabetic samples were calculated with respect to that of the healthy samples. As in the RNA sequencing data, levels of miR-98-5p, miR-423-3p, miR-6131 and miR-1246 were significantly down-regulated while those of miR-99b-5p, miR-1304-5p and miR-302d-3p were significantly up-regulated in the diabetic subjects as compared to normal healthy subjects ()).
Table 1. Characteristics of the individuals (Normal/Diabetic).
Table 2. RNA sequencing data summary (raw reads, aligned reads, expressed genes).
Table 3. Altered miRNAs (upregulated/downregulated) with a FC ≥ ± 2.
Figure 1. Differentially expressed circulatory miRNAs in type 2 diabetic subjects (a) The workflow of profiling serum miRNAs and identification of differentially regulated miRNAs. (b) Scatterplot showing the status of circulatory miRNAs in healthy and type 2 diabetic patients. (c) Heat map of altered miRNA signatures in type 2 diabetic individuals as compared to healthy individuals. (d) For validation of the RNA sequencing data, four down-regulated and three up-regulated miRNAs were quantified by qRT-PCR. 200 pg of total RNA was reverse transcribed and subjected to qPCR using Miscript SYBR green and miRNA-specific primer assays. n = 5 each from healthy and diabetic individuals. U6 was used as the normalization control. **p < 0.01 and ***p < 0.001 as compared to healthy individuals.
miRNAs’ target prediction
Almost all the upregulated miRNAs had very low endogenous levels as evident from the reads (); we, therefore, focused on the downregulated miRNAs that had comparatively increased endogenous expression (). Predicted targets to the altered downregulated miRNAs with a fold change of ≥ 2 were extracted using TargetScan, miRDB and PicTar ()).
Figure 2. Target prediction of miRNAs. (a) Altered miRNAs with a fold change of ≥ ±2 were taken and targets were extracted from miRDB, PicTar and TargetScan. A consensus list of predicted targets to the 19 downregulated miRNAs suggested a set of 293 genes. (b) Genes targeted by one miRNA (88.1%), two miRNAs (5.5%), three miRNAs (5.1%) and four miRNAs (0.3%) is shown.
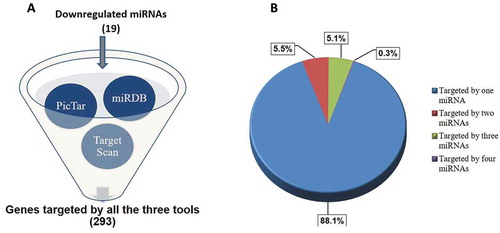
A consensus list of targets to the downregulated miRNAs (predicted by the three tools namely miRDB, TargetScan and PicTar) were prioritized to increase the possibility of the targets getting validated. Further, this list of common targets (293 genes) was categorized on the basis of the downregulated miRNAs targeting these genes. A pie chart categorization of these genes targeted by one miRNA (261, 88.1%), two miRNAs (16, 5.5%), three miRNAs (15, 5.1%) and four miRNAs (1, 0.3%) is depicted in ). We hypothesized that more the number of miRNAs targeting a gene, more would be the physiological relevance of altered levels of that gene in the skin during diabetes. We narrowed down to a list of 17 important genes targeted by three or more downregulated miRNAs (). From this, potential gene targets with possible relevance to skin physiology during diabetes, namely TGFβR1 (transforming growth factor, beta receptor 1) [Citation33,Citation34] and PPP1R15B (protein phosphatase 1, regulatory subunit 15B) [Citation35] were prioritized. These genes were targeted by three miRNAs: hsa-miR-98-5p, hsa-let-7i-5p, hsa-let-7d-5p and these were taken up for subsequent validation.
Table 4. Genes predicted to be targeted by three or more of the down-regulated miRNAs.
miR-98-5p downregulates PPP1R15B levels in HaCaT cells
To assess if miR-98-5p targets TGFβR1 or PPP1R15B, HaCaT cells were transfected with either the scramble or miR-98-5p mimic (1–50 nM). After 48 h, cell lysates were evaluated for the protein levels of PPP1R15B and TGFβR1. There was a dose-dependent decrease in PPP1R15B protein levels suggesting that this protein is possibly targeted by this miRNA ()). However, levels of TGFβR1 did not show any change and therefore is possibly not a direct target of miR-98-5p. miR-98-5p also significantly decreased the mRNA levels of PPP1R15B ()) further suggesting that this gene is targeted by miR-98-5p. The miR-98-5p mediated decrease in the PPP1R15B protein levels in the presence of the miR-98-5p mimic (50 nM) was almost completely prevented in the presence of the miR-98-5p inhibitor (75 nM) suggesting the specificity of the miR-98-5p effect ()). At the dose of 50 nM of the miR-98-5p mimic, the transfection efficiency obtained was around 70% and the cellular miR-98-5p levels increased by approximately 2000 fold over its endogenous levels (~18,000 copies/cell). Also, there was a significant increase in endogenous PPP1R15B levels in HaCaT cells transfected with the miR-98-5p inhibitor alone ()).
Figure 3. miR-98-5p downregulates PPP1R15B levels in HaCaT cells. (a) HaCaT cells transfected with either the scramble (Scr) or miR-98-5p were lysed after 48 h and 50 ug of lysate was subjected for western blot analysis using anti-PPP1R15B and anti-TGFβR1 antibodies. β-actin and GAPDH were used as the loading control. Densitometric analysis of the blots is given below the respective blots. (b) Total RNA was isolated from cells incubated as in (a) and the mRNA levels of the PPP1R15B were quantified using qRT-PCR and normalized to the levels of 18S rRNA. (c) HaCaT cells were transfected with either the scramble or the miR-98-5p mimic alone or with its inhibitor (75 nM) and after 48 h of incubation, lysates were probed for the protein levels of PPP1R15B. β-actin was taken as the loading control. (d) HaCaT cells were transfected with the scramble (Scr) or the miR-98-5p inhibitor (50, 75 nM) and after 48 h, the levels of PPP1R15B were analysed by Western Blot analyses. β-actin was taken as the normalization control. (e) HaCaT cells were transfected with either the wild-type (WT) or mutated (Mut) PPP1R15B 3ʹ UTR and cotransfected with the miR-98-5p mimic (50 nM) alone or with its inhibitor (75 nM). After 48 h of transfection, cells were lysed, and luciferase activities were measured. Results are expressed as values of Renilla luciferase values normalized to those of firefly luciferase. (f) Normal human primary epidermal keratinocytes were transfected with either the scramble (Scr) or the miR-98-5p mimic (50 nM) and after 48 h, total RNA was isolated and the transcript levels of PPP1R15B were quantified by qRT-PCR. Experiments were performed in triplicate and values are presented as means ± SEM. ***p < 0.001, **p < 0.01 and *p < 0.05, as compared to scramble (Scr). ###p < 0.001 and #p < 0.05 as compared to the miR-98-5p mimic alone.
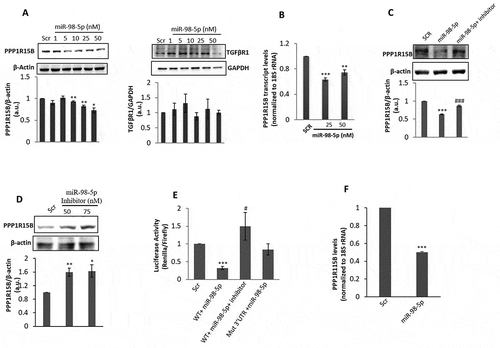
To further validate the miR-98-5p-PPP1R15B interaction, the 3ʹUTR of PPP1R15B was cloned into a psiCheck2 vector. As shown in ), miR-98-5p mimic significantly decreased the luciferase activity of the reporter plasmid containing the PPP1R15B 3ʹUTR and this decrease was prevented, both in the presence of the miR-98-5p inhibitor and with the PPP1R15B 3ʹUTR clone harbouring a mutation in the binding site of miR-98-5p. Collectively, these suggest that miR-98-5p binds to the 3ʹUTR of PPP1R15B, and this interaction specifically regulates PPP1R15B levels within the cell. That miR-98-5p targets PPP1R15B was also validated in normal human primary epidermal keratinocytes wherein transfection of miR-98-5p into these cells (where the endogenous levels of miR-98-5p are approximately 20,000 copies per cell) significantly decreased the transcript levels of PPP1R15B ()).
PPP1R15B is a protein phosphatase that functions to dephosphorylate eIF2α and promotes translation initiation. The status of phosphorylated eIF2α is a major determinant of ER stress within the cell. Increased levels of p-eIF2α is an indicator of ER stress and this sets in as an adaptive measure to stall protein translation and attempt to rescue the cell from the ER stress being encountered. However, prolonged elevated p-eIF2α levels facilitate CHOP induction and apoptosis, mediated by ATF4. Since miR-98-5p inhibits PPP1R15B, we hypothesized that this might promote accumulation of p-eIF2α and associate with apoptosis through ATF4 and CHOP ()) We assessed if PPP1R15B and TGFβR1 might be targeted by let-7i-5p and let-7d-5p (as predicted by online tools and given in ), but found that none of these genes were targeted by these downregulated small RNA species (data not shown).
Figure 4. miR-98-5p induces BiP and CHOP levels in HaCaT cells. (a) A schematic view of the potential consequences of PPP1R15B inhibition by overexpressing miR-98-5p where by targeting and inhibiting PPP1R15B, miR-98-5p might be regulating apoptotic processess in the cell by interfering with the intermediate cellular events. (b) HaCaT cells transfected with either the scramble (Scr) or the miR-98-5p mimic were lysed after 48 h of transfection and protein lysates (70 ug) was subjected for western blot analysis using anti-BiP antibody. β-actin was used as the loading control. Densitometric analysis of the same is given below. (c) Cells incubated as in (b) were used for RNA isolation and transcript levels of BiP at 48 h of transfection were determined by qRT-PCR using gene-specific primers. 18S rRNA was used as the endogenous control. (d) Total RNA was isolated from scramble or miR-98-5p transfected cells and transcript levels of CHOP were also quantified by qRT-PCR using gene-specific primers at 48 and 72 h of transfection. 18S rRNA was used as the endogenous control. (e) Cells transfected as in (b) were lysed and lysates (70 ug) were used to assess p-eIF2α and total eIF2α levels. The expression of total and phosphorylated eIF2α was evaluated by western blot analysis. HSC70 was used as the loading control. Densitometric analysis of the blot is given below. Experiments were performed in triplicate and values are presented as means± SEM. ***P< 0.001, **P< 0.01 and *P< 0.05, as compared to scramble transfected cells (Scr).
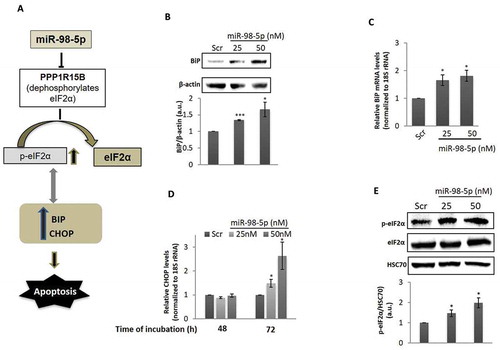
miR-98-5p increases BiP and CHOP levels in HaCaT cells
To further work on this hypothesis, HaCaT cells were transfected with either the scramble or miR-98-5p (25 and 50 nM) and after 48 h of incubation, there was a significant increase in the levels of BiP, both at protein as well as transcript levels (). However, CHOP did not show any change at 48 h. Interestingly, on increasing the time of incubation, i.e. at 72 h, levels of CHOP significantly increased, both at 25 and 50 nM doses of miR-98-5p ()). CHOP, therefore, seems to be induced as a late event during miR-98-5p incubation. Together with this, levels of p-eIF2α were significantly increased in the presence of miR-98-5p without any change in the total levels of eIF2α ()).
miR-98-5p induces apoptosis in HaCaT cells
Since CHOP induction is identified as a potent apoptotic inducer, we subsequently assessed the roles of these events on apoptosis in the cells. HaCaT cells were transfected either with the scramble or with the miR-98-5p mimic alone or together with its inhibitor for 72 h and on completion of incubation, levels of the pro-apoptotic protein, Bax and the anti-apoptotic protein, Bcl-2 were evaluated. miR-98-5p significantly increased the levels of Bax and down-regulated the levels of Bcl-2 () suggesting a critical role of this miRNA in promoting apoptosis. Also, such effects of miR-98-5p on both, Bax and Bcl-2 were completely prevented in the presence of the miR-98-5p inhibitor suggesting a specific effect of this miRNA on apoptosis ().
Figure 5. miR-98-5p induces apoptosis in HaCaT cells. HaCaT cells transfected with either the scramble (Scr) or the miR-98-5p mimic were lysed after 72 h and the expression of Bax (a) and Bcl-2 (b) was evaluated by western blot analysis using specific antibodies. HSC70 and β-actin were used as the loading control. HaCaT cells were transfected with either the scramble or the miR-98-5p mimic or with miR-98-5p mimic plus its inhibitor (75 nM) and after 72 h of incubation, lysates were probed for the protein levels of Bax (c) and Bcl-2 (d). HSC70 and β-actin were used as the loading control. Densitometric analyses of the blots are given below with the respective blots. Cells transfected with the scramble (Scr) or the miR-98-5p mimic (e) or the miR-98-5p inhibitor (f) were labelled with Annexin V and after 15 min of incubation, cells were analysed for apoptosis by flow cytometry. Quantitative data of Annexin V positive cells are depicted in the graphs below. (g) HaCaT cells were transfected with either the scramble (Scr) or PPP1R15B siRNA (50 nM) and after 72 h, the levels of cleaved caspase 3, a marker for apoptosis was evaluated by Western Blot analyses. HSC70 was taken as the loading control. Experiments were performed in triplicate and values are presented as means ± SEM. ***p < 0.001, **p < 0.01 and *p < 0.05, as compared to scramble (Scr). ###p < 0.001 as compared to the incubation with miR-98-5p mimic alone.
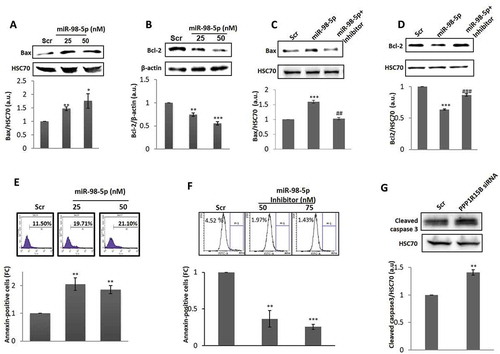
To further confirm this, scramble or miR-98-5p transfected cells were stained with Annexin V-FITC and the per cent of Annexin V positive cells were evaluated. As compared to the scramble, there was around two-fold increase in the annexin-V positive cells, thereby confirming that miR-98-5p induces apoptotic cell death ()). This was also validated using the miR-98-5p inhibitor and as shown in ), there was a significant decrease in annexin V positive cells in the presence of the miR-98-5p inhibitor alone (75 nM). To further assert that this effect of miR-98-5p on apoptosis is presumably through PPP1R15B inhibition, we inhibited the cellular levels of PPP1R15B using a specific siRNA. At a dose of 50 nM of PPP1R15B siRNA (PPP1R15B levels were inhibited by 70%, data not shown), there was a significant increase of apoptosis when compared to scramble transfected cells as measured by increased cleaved caspase 3 levels ()).
miR-98-5p decreases proliferation in HaCaT cells
Increased apoptosis in the presence of miR-98-5p as shown above might also be associated with cellular proliferation. To confirm this, the proliferative potential of miR-98-5p transfected cells was evaluated. As compared to scramble, miR-98-5p transfected cells showed significant decrease in the levels of the proliferative markers namely K5 and PCNA ()) that was prevented in the presence of the miR-98-5p inhibitor ()). To further validate these results, carboxyfluorescein diacetate N-succinimidyl ester (CFSE) Dye was used to quantify proliferation. As in the Western blots, miR-98-5p showed increased cellular fluorescence content at 72 h when compared to scramble suggesting that cells were less proliferative in the presence of miR-98-5p ()). Interestingly, in the presence of the miR-98-5p inhibitor alone, there was a significant increase in cell proliferation at a dose of 75 nM ()). Also, when PPP1R15B siRNA (50 nM) was used to inhibit PPP1R15B levels, the levels of the proliferation marker, PCNA, was significantly decreased as compared to scramble transfected cells ()), similar to that observed in miR-98-5p mimic transfected cells. Similar effects of PPP1R15B inhibition on apoptosis and proliferation have been shown by Shahmoradgoli et al.Citation36. Such changes in apoptosis and proliferation are likely to impact keratinocyte migration that is an important aspect of healthy and abnormal skin physiology. We, therefore, sought to evaluate the effect of miR-98-5p on keratinocyte migration. As shown in ), miR-98-5p caused a significant increase in cell migration, suggesting its possible role in the migration phenotype of these cells.
Figure 6. miR-98-5p decreases proliferation in HaCaT cells. (a) HaCaT cells transfected with either the scramble (Scr) or the miR-98-5p mimic were lysed after 72 h of transfection and 20 ug of lysate was subjected for western blot analysis using anti-cytokeratin 5 (K5) and anti-PCNA antibodies. β-actin and HSC70 were used as the loading control, respectively. Densitometric analysis of the blots is given below with the respective blots. (b) HaCaT cells transfected with either the scramble or miR-98-5p or with the miRNA plus its inhibitor (75 nM) were lysed after 72 h and 20 ug of lysate was subjected for western blot analysis using anti-cytokeratin 5 (K5) and anti-PCNA antibodies. β-actin and HSC70 were used as the loading control, respectively. Densitometric analysis of the blots is given below the respective blots. (c) CFSE dye was used to examine cell proliferation using Flow Cytometry. Scramble (Scr) or miR-98-5p mimic (c) or miR-98-5p inhibitor (d) transfected cells were monitored for cell proliferation using CFSE as described in the Materials and Methods section. (e) HaCaT cells were transfected with either the scramble or PPP1R15B siRNA (50 nM) and after 72 h, the levels of PCNA, the cell proliferation marker was evaluated by Western Blot analyses. HSC70 was taken as the loading control. Experiments were performed in triplicate and values are presented as means ± SEM. ***P< 0.001, **P< 0.01 and *P< 0.05, as compared to scramble (Scr); ##p < 0.01 as compared to the incubation with miR-98-5p mimic alone.
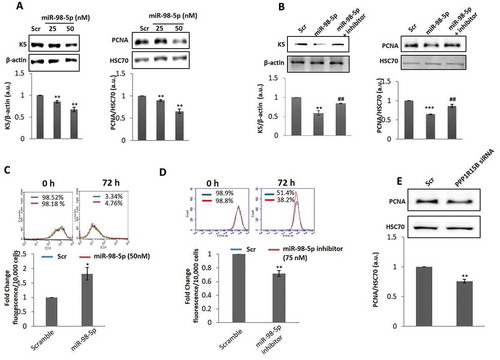
Figure 7. miR-98-5p promotes cell migration. (a) HaCaT cells grown on six-well plates were transfected with either the scramble or miR-98-5p (50 nM) and after 48 h, a wound was made on the cell layer with a pipette tip. The movement of cells across this wound edge after 24 h was observed and photographed. The graph below shows the wound area covered in scramble and miR-98-5p transfected cells at 24 h. All experiments were done in triplicate and data are means±SEM. *p < 0.05 as compared to scramble transfected cells. (b) A schematic representation of the possible in vivo situation in diabetic individuals where the circulatory levels of miR-98-5p are significantly downregulated as evident from . Under these conditions, since miR-98-5p is downregulated, the levels of its target, PPP1R15B would be elevated and this will dephosphorylate p-eIF2α into eIF2α and initiate protein translation. Simultaneously, levels of BiP and CHOP are expected to decrease, accompanied by decreased apoptosis and cell migration, but hyperproliferation in keratinocytes.
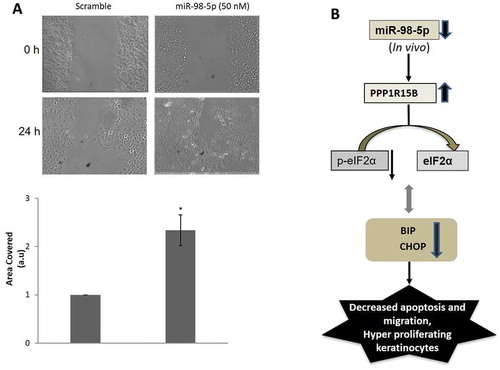
Results until now demonstrate that increased miR-98-5p levels decrease PPP1R15B levels, induce apoptosis and migration and decrease proliferation. However, RNA sequencing results show that miR-98-5p levels are significantly low in the circulation in diabetic subjects (). This decrease in the circulation during diabetes will also possibly be reflected by a decrease in the skin environment that is nourished by the components in the circulation. Therefore, in the in vivo context, when the levels of circulatory miR-98-5p are decreased during diabetes, the levels of its target, PPP1R15B in the skin, would possibly increase and this, instead of promoting apoptosis and cell migration, would attenuate these and promote cellular proliferation ()). These events might be one of the reasons of hyperproliferation in the keratinocytes as seen during type 2 diabetes [Citation37]. Also, the decreased apoptotic processes under these conditions might interfere with the tightly orchestrated patterns of tissue or wound repair [Citation38] and impaired cell migration would be critical in delayed wound closure, a phenotype associated with diabetes [Citation39,Citation40].
Discussion
In this study, we sought to understand the epidermal effects of circulatory miRNAs that are altered during diabetes. Our data show that one such altered miRNA, miR-98-5p, that is significantly downregulated in diabetic human subjects, targets PPP1R15B and promotes apoptosis and cell migration but inhibits proliferation in HaCaT cells.
In C. elegans, it was first discovered that the let-7 family controls the developmental timing of cell differentiation and proliferation [Citation41,Citation42]. miR-98 is among the 12 members of the let-7 miRNA family and is an intronic miRNA present on chromosome X [Citation43] and has been shown to be involved in modulation of adipocyte function [Citation44] and in osteoarthritis by controlling TNFα expression [Citation45]. Other studies show miR-98 to be a regulator of tumorigenesis [Citation46,Citation47]. miR-98 functions as a tumour suppressor and is decreased in many types of cancer where it targets different genes and inhibits their expression [Citation48]. Its levels are decreased in metastatic tumours as compared to primary tumours [Citation47]. In breast cancer cells, miR-98 has been shown to inhibit the process of cell proliferation, growth, survival, invasion as well as angiogenesis [Citation47]. In oesophageal squamous cell carcinoma (ESCC), it has been shown that miR-98 expression was reduced and its overexpression inhibited the migration and invasion of ESCC cells [Citation49]. In tissues of hepatocellular carcinoma (HCC) and in hepatoma cell lines, the expression of miR-98 is downregulated and its overexpression suppressed cell proliferation, migration and invasion. miR-98 also acts as a tumour suppressor in HCC via downregulating CTHRC1 expression [Citation50]. In HCC tissues, the expression of miR-98 is downregulated via SALL4 and its overexpression suppresses the tumour growth [Citation51]. In ischaemic or hypoxic conditions, miR-98 plays a crucial role in regulating cell survival by targeting caspase-3 [Citation52]. In hyperlipidaemia, oleanolic acid exerts its hypolipidemic function via miR-98-5p/PGC-1β axis [Citation53]. summarizes some of the effects of miR-98 in diverse cellular contexts that substantiates the significance of this miRNA within a cell.
Table 5. Major effects of deregulated miR-98 expression.
Deregulated circulatory miRNA signatures are now identified in diverse diseased states and this has put forth their potential as novel biomarkers [Citation54,Citation55]. Cellular miRNAs are generally associated with specific cells or tissues. The extracellular miRNAs found in body fluids facilitate tissue crosstalk and such signature profiles are normally considered indicators of a specific disease phenotype. Circulatory miRNAs are present in the serum, plasma, saliva, cerebrospinal fluid various blood cells and platelets. Often such circulatory miRNAs might also affect processes within tissues that are fed by the blood vessels and are, therefore, in direct contact with the constituents of the circulation [Citation56–Citation58].
Here, we show that circulatory levels of miR-98-5p are significantly down-regulated during diabetes. Using bioinformatics and experimental tools, we identify, PPP1R15B as a major target of miR-98-5p. PPP1R15B, located on Chr 1q 32.1 in humans, is a protein-phosphatase and a constitutive repressor of eIF2α phosphorylation and thereby, a critical regulator of translation during cellular stress [Citation59,Citation60]. A homozygous missense mutation in PPP1R15B is associated with severe microcephaly, short stature and intellectual disability [Citation61]. Also, the same mutation that affects a conserved amino acid with the protein phosphatase 1 (PP1) binding domain results in pancreatic β-cell apoptosis and diabetes [Citation35]. As a result, there is dysregulated eIF2α phosphorylation that is critical during ER stress-induced β-cell death associated with diabetes. PPP1R15B deficient β-cells demonstrate increased eIF2α phosphorylation and are prone to apoptosis. PPP1R15B deficient mice have low birth-weight, faint survival, impaired erythropoiesis and the embryonic fibroblasts showed increased eIF2α phosphorylation [Citation62].
We show that miR-98-5p targets PPP1R15B and elevates BiP and CHOP levels, thereby, inducing apoptosis and this is associated by decreased cellular proliferation. It is known that prolonged ER stress induces apoptotic cell death by interfering with diverse cellular processes. In the skin, during diabetes, ER stress-associated processes are a major contributor of skin ulcers and impaired wound healing [Citation63]. As compared to the normal wounds, impaired wounds during diabetes, show sustained induction of ER stress markers together with production of pro-inflammatory mediators [Citation63]. The skin during diabetes also demonstrates increased proliferation. Such increased keratinocyte proliferation is observed in chronic ulcers during diabetes [Citation37]. Therefore, a critical balance between proliferation and ER stress-induced apoptosis determines the deregulated physiology in the skin during diabetes.
Our results show that increased levels of miR-98-5p are associated with decreased proliferation in keratinocyte cells. Other cells like endothelial cells or dermal fibroblasts that are in constant contact with the circulation are also prone to be affected by deregulated circulatory miRNA signatures. However, in this study, we aimed to study the effects of altered circulatory miRNAs on keratinocytes specifically; more so because of their significance in the structural and immunomodulatory functions of the skin, although the effects in other cells cannot be overlooked. In the context of our data, since the circulatory levels of miR-98-5p () are decreased during diabetes, we think that such decreased levels of this miRNA in the circulation that feed the cellular layers of the skin might be a major contributor of hyperproliferation patterns as observed in the skin during diabetes. In a separate context, miR-98-5p levels are downregulated in hepatocellular carcinoma and its overexpression has been shown to inhibit cell proliferation and induce apoptosis, by targeting IGF2BPI [Citation64].
To conclude, by targeting PPPIR15B, miR-98-5p decreases proliferation and induces apoptosis in keratinocytes. These events assume importance considering the participation of these cellular events in several cutaneous complications associated with diabetes. Therefore, altered circulating miR-98-5p levels emerge as a significant contributor of the onset and progression of the complications in the skin during diabetes.
Materials and methods
Subject recruitment
Subjects were recruited at Samatvam Endocrinology and Diabetes Centre, Bangalore, India. Healthy and recently diagnosed type 2 diabetic male subjects (n = 5) aged >18 years were taken for the study. The inclusion criteria were based on fasting glucose values (healthy <100 mg/dl and type 2 diabetic >126 mg/dl). Subjects with a history of smoking or under any anti-diabetic medications or with any diabetic complications were excluded from the study. The study was approved by Unilever Independent Research Ethics Committee (UIEC), India and by the Ethics committee, Jnana Sanjeevini Medical Centre (a part of the Samatvam Endocrinology and Diabetes Centre), Bangalore India. Informed written consent was obtained from all study subjects. Some characteristics and physiological parameters of normal and diabetic subjects are given in .
Serum collection
Blood was collected from healthy and diabetic subjects fasted for 12 h and allowed to clot for 30 min. Tubes were centrifuged for 10 min at 1,000–1,300 g and serum was collected in RNase free tubes and stored in −80°C till further processing.
Isolation of circulating nucleic acid and small RNA library preparation
RNA was isolated from 5 ml of serum at the Genomics facility of Genotypic Technology (www.genotypic.co.in) using Qiamp Circulating Nucleic acid kit (Qiagen, Hilden, Germany) according to the manufacturer’s instructions (Bangalore, India). The isolated RNA was analysed using a bioanalyzer (Agilent, CA, USA) to check for their quantity and integrity. Quantity of total RNA was around 7.6 ± 2.6 ng/µl and 14.4 ± 2.2 ng/µl from the normal and diabetic subjects, respectively. The average RIN value of the normal samples was 7.58 ± 0.49 while that of the diabetic samples was 7.22 ± 0.62. Small RNA libraries for sequencing were prepared using the Illumina TruSeq Small RNA library kit (Illumina CA, USA) according to the manufacturer’s instructions. Briefly, 3′ adaptors were ligated to the specific 3′OH group of RNAs followed by 5′ adaptor ligation. The ligated products were reverse transcribed with Superscript III Reverse transcriptase by priming with Reverse transcriptase primers. The cDNA was enriched, barcoded by PCR (21 cycles) and cleaned. The library was size selected in the range of 140–160 bp (corresponding to cDNAs from miRNAs) followed by overnight gel elution and salt precipitation using glycogen, 3M Sodium Acetate and absolute ethanol. The precipitate was re-suspended in nuclease-free water. The prepared library was quantified (Qubit Thermo Fischer Scientific, USA) and validated for quality by running on a High Sensitivity Bioanalyzer Chip (Agilent, CA, USA).
Small RNA sequencing
The libraries were sequenced using the Illumina HiSeq platform (Next Seq500) (CA, USA). sRNA-workbench V3.0_ALPHA was used to trim the TruSeq adapter sequences and length filtering (minimum length 16 bp and maximum 36 bp) was done. Sequences ≥16 bp and ≤36 bp length were considered for identification of known miRNAs. Homology search of these sequenced miRNAs was done against human mature miRNA sequences retrieved from miRbase-21 database.
Differential gene expression (DGE) analysis
The differentially regulated miRNAs between healthy and diabetic sera were identified using DGE analysis. miRNAs altered with fold changes of ≥ ± 1.2 were considered to be differentially regulated. miRNAs expressed in at least three samples (healthy and diabetic) were considered for further analysis. A scatter plot and heatmap of the altered miRNA were generated. Raw data of the sequenced reads from normal and diabetic human sera have been deposited in the SRA with a series number SRP132974.
qRT-PCR validation
Differentially regulated microRNAs as obtained by RNA sequencing were validated by qRT-PCR. Based on the fold changes, four down-regulated and three up-regulated microRNAs were taken for validation. Two hundred picograms of total RNA was used for cDNA synthesis and reverse transcription was carried out using the Qiagen miscript II RT kit (GmBH, Germany) following the manufacturer’s instructions. Reverse transcription was performed using Hispec buffer provided within the kit that enables only mature miRNA quantification. miRNA expression was quantified by qRT-PCR using miscript SYBR green PCR kit (GmBH, Germany) and Miscript primer assays for hsa-miR-98-5p, hsa-miR-423-3p, hsa-miR-6131, hsa-miR-1246, hsa-miR-99b-5p, hsa-miR-1304-5p and hsa-miR-302d-3p (Qiagen, GmBH, Germany) in an Applied Biosystem 7500 Real-Time PCR System (Thermofisher, USA) system. U6 was taken as the normalization control. Relative miRNA expression was calculated using the 2−ΔΔCt method.
Bioinformatic miRNA target prediction
Predicted targets of miRNAs were extracted from miRDB (www.mirdb.org), TargetScan (www.targetscan.org) and PicTar (www.pictar.mdc-berlin.de). A consensus list of targets common to all the three tools was considered to prioritize on the genes to be taken for validation.
Cell culture
Immortalized human keratinocyte cells (HaCaT) were obtained from NCCS, Pune, India and grown in Dulbecco’s modified Eagle’s medium (DMEM/F12 (1:1), Sigma Chemical Co., St. Louis, MO, USA) enriched with 10% foetal calf serum (GIBCO Laboratories, Grand Island, NY) at 37ºC and in an atmosphere of 5% CO2.
miRNA transfection
hsa-miR-98-5p mimic (Cat no C-300515-05-0005), the inhibitor (Cat no IH-300515-07-0005) and the scramble were purchased from Dharmacon (Lafayette, CO, USA). HaCaT cells were plated in six-well plates and allowed to grow to around 40% confluence in DMEM/F12 media with 10% FBS. Cells were transfected with either the scramble or hsa-miR-98-5p mimic at different doses of (1–50 nM) or mimic plus the miR-98-5p inhibitor (75 nM) by using Lipofectamine 2000 (Invitrogen, CA, USA) and Opti-MEM (Invitrogen, CA, USA) according to the manufacturer’s instructions. Cells were incubated for 48 or 72 h and on termination of incubation, RNA was isolated or cells were lysed for protein isolation as described below. Transfection efficiency was evaluated using siGLO (Dharmacon, Lafayette, CO, USA) and by measuring the fluorescence of the transfected cells by flow cytometry (BD Accuri C6 plus, BD, New Jersey, USA). Also, cells were transfected with either the scramble or the miR-98-5p inhibitor (75 nM) or PPP1R15B siRNA (50 nM) for 72 h and evaluated for apoptosis and proliferation.
Quantitative reverse transcriptase (RT)-PCR
RNA from scramble and miR-98-5p transfected cells was isolated using TRIzol (Ambion, Life Technologies, Germany) according to manufacturer’s protocol. The quality was checked by agarose gel electrophoresis and quantification was done using Infinite 200 PRO plate reader (Tecan, MAENNEDORF, Switzerland). One microgram RNA from each sample was reverse-transcribed and the cDNA was subjected to Real-Time PCR (Applied Biosystems) using SyBR-Green PCR Master Mix (Applied Biosystems, CA, USA) and gene-specific primers for PPP1R15B (forward: 5′-tgaggattgggatgaggaag-3′ and reverse: 5′-tctggcagcagtctgaattg-3′), BiP (forward: 5′-catcacgccgtcctatgtcg-3′ and reverse: 5′cgtcaaagaccgtgttctcg-3′) and CHOP (forward: 5′-gcgcatgaaggagaaagaac-3′ and reverse: 5′ccaattgttcatgcttggtg-3′). 18s rRNA (forward: 5′-agaaacggctaccacatcca-3′ and reverse: 5′agtgtgacgttgacatccgta3′) was used as the normalization control. Relative gene expression was calculated using the 2−ΔΔCt method. For quantification of endogenous miR-98-5p levels in HaCaT and primary keratinocytes, serial dilutions (0.02 fmol/µl–2 pmol/µl) of the miRNA were reverse transcribed and amplified by qRT-PCR. A standard curve was generated and used to quantify endogenous levels of miR-98-5p in HaCaT cells and primary keratinocytes.
Western blotting
On termination of incubation, scramble or miR-98-5p mimic or miR-98-5p and the inhibitor transfected cells were washed twice with ice-cold 1X PBS (Phosphate-buffered saline) and lysed in RIPA lysis buffer (Sigma, St. Louis, MO, USA) containing protease inhibitors (Calbiochem, Darmstadt, Germany). To evaluate the effects of the inhibitor alone, HaCaT cells were transfected with either the scramble or miR-98-5p inhibitor (50 and 75 nM) for 48 h and lysed as above. Lysates were centrifuged at 13,000 rpm for 30 min at 4°C and 50 µg of protein samples were resolved on SDS-PAGE, transferred to nitrocellulose membranes (Merck Millipore Limited, Ireland) and probed with anti-PPP1R15B (1:1000; Abcam, Cambridge, UK), anti-TGFβR1 (1:2000, Abcam), anti-BiP (1:1000; Cell Signaling Technology (CST, MA, USA), anti-eIF2α (1:1000; CST), anti-p-eIF2α (1:1000; CST), anti-Bax (1:1000; CST), anti-Bcl-2 (1:1000; CST), anti-Cytokeratin 5 (K5) (1:1000; Abcam), caspase 3 (1:1000, CST) and anti-PCNA (1:1000; CST) antibodies. After washing in 1X TBST, membranes were incubated for 1 h with appropriate HRP linked secondary antibodies and immunoreactive bands were detected by using the ECL Western Blotting Kit (Thermo Fisher Scientific, MA, USA). HSC70 and β-actin (Santa Cruz Biotechnology, CA, USA) were used as a loading control. HaCaT cells transfected with either the scramble or PPP1R15B siRNA (50 nM) were subjected to Western Blot analysis for assessing the levels of cleaved caspase 3 and PCNA, as markers of apoptosis and cell proliferation, respectively.
Cloning, mutagenesis, and luciferase assays
Luciferase reporter constructs in a psiCheck2 vector (Promega Corporation, Madison, WI) were generated by cloning the 3ʹuntranslated region (UTR) of the human PPP1R15B gene using forward (5′ccgctcgaggagagaagtaatggcaaggcc-3′) and reverse (5′ataagaatgcggccgcgtgtgtgcctgtaatcccag3′) primers spanning the binding sites for miR-98-5p and mutations were generated using a site-directed mutagenesis kit (Agilent Technologies, Santa Clara, CA) and mutation-specific primers (forward: 5′gaatttttcatcagaagtgcttacagggttacgcaatcagtttacaatctacctggtcattattttat3′ and reverse: 5′ ataaaataatgaccaggtagattgtaaactgattgcgtaaccctgtaagcacttctgatgaaaaattc3′). HaCaT cells were co-transfected with either the wild-type or mutated 3ʹ UTR clones along with the miR-98-5p mimics and/or miR-98-5p hairpin inhibitors. After 48 h, the luciferase activity was assayed using a dual luciferase assay kit (Promega Corporation) and luminescence was measured on an Infinite M200 Pro Multimode Reader (TECAN, Männedorf, Switzerland). Renilla luciferase values were normalized to those of firefly luciferase.
Flow cytometry (FACS)
To quantitate apoptosis, scramble or miR-98-5p or miR-98-5p inhibitor (75 nM) transfected HaCaT cells were washed with 1X PBS and trypsinized. The pellet was suspended in 1X binding buffer and cells were stained with 2 µl Annexin V-FITC and incubated for 10 min. The fluorescence of the cells was determined using flow cytometry (FACS Calibur, Beckton Dickinson, New Jersey, USA). Results are expressed as fold change in annexin V positive cells.
Cell proliferation was quantified using Carboxyfluorescein diacetate N-succinimidyl ester (CFSE Dye). Scramble or miR-98-5p (50 nM) or miR-98-5p inhibitor (75 nM) transfected HaCaT cells were incubated with freshly prepared CFSE (Invitrogen, USA) at a concentration of 0.5 nM/well of six-well plates. After incubation at 37ºC for 15 min, cells were washed and cultured in DMEM/F12 with 10% FBS. After 72 h, the cells were trypsinized, washed in 1X PBS and the fluorescence of the pelleted cells was determined using FACS (FACS Calibur, Beckton Dickinson, New Jersey, USA).
Cell migration assay
HaCaT cells were transfected with the scramble and miR-98-5p mimic (50 nM) and after 48 h, a wound was made with a sterile 10 µL pipette tip, such that cells along the wound are scrapped off and a sharp visible line at the wound edge is left. Cells were washed with PBS to remove cell debris, and the culture medium was replaced with serum-free DMEM-F12 media and cells were imaged. After 24 h, cells were similarly photographed under a phase-contrast microscope (X10, Ti-S, NIKON, NY, USA). The time-dependent movement of cells into the wound area at 24 h was monitored and quantified using the Image J software (https://imagej.nih.gov/ij/).
Primary epidermal keratinocytes
Adult Normal Human Epidermal Keratinocytes (aNHEKs) were purchased from Lonza (MD, USA) and maintained in keratinocyte basal media supplemented with bovine pituitary extract, insulin, transferrin, hydrocortisone, gentamicin/amphotericin-B-1000, human epidermal growth factor and epinephrine. Cells were incubated at 37°C in 5% CO2 and allowed to grow until 70% confluence prior to transfection. Cells were transfected with either the scramble or hsa-miR-98-5p (50 nM) using Liopofectamine 2000 (Invitrogen, CA, USA). After 48 h, total RNA was isolated using TRIZOL and cDNA was synthesized using 1 ug of RNA from each incubation. Transcript levels of PPP1R15B were assessed by quantitative Real-time PCR (Applied Biosystems, CA, USA) using SYBR green Master Mix as described above. 18S rRNA was used as an internal control and relative gene expression was calculated with the 2−ΔΔCt method.
Densitometric analysis
Protein expression was analysed by densitometric analysis performed with Alpha Ease software (Alpha Innotech Corporation, CA, USA). A rectangular box was drawn surrounding each band and pixel intensities were analysed by the program.
Statistical analysis
All experiments were done in triplicates and statistical significance was calculated using the student’s t-test. A value of at least p < 0.05 was considered as statistically significant. Data are expressed as means ± SEM.
Acknowledgments
This work was supported by funding from the Unilever Industries Pvt Ltd., Bangalore, India and Council of Scientific and Industrial Research, New Delhi, India. RK and DK acknowledge Unilever Industries Pvt Ltd., Bangalore, India and the Council of Scientific and Industrial Research, New Delhi for their fellowships, respectively. The authors thank Genotypic Technology Pvt. Ltd., Bangalore, India for the small RNA sequencing of normal and diabetic sera samples. The authors acknowledge the help provided by Mr Bijay R Pattnaik at CSIR-Institute of Genomics and Integrative Biology for the help during the FACS experiments.
Disclosure statement
No potential conflict of interest was reported by the authors.
Additional information
Funding
References
- Lee SH, Jeong SK, Ahn SK. An update of the defensive barrier function of skin. Yonsei Med J. 2006;47:293–306.
- Madison KC. Barrier function of the skin:“la raison d’etre” of the epidermis. J Invest Dermatol. 2003;121:231–241.
- Potts RO, Francoeur ML. Lipid biophysics of water loss through the skin. Proc Nat Acad Sci. 1990;87:3871–3873.
- Bouwstra J, Honeywell-Nguyen P. Skin structure and mode of action of vesicles. Adv Drug Deliv Rev. 2002;54:S41–S55.
- Bouwstra JA, Honeywell-Nguyen PL, Gooris GS, et al. Structure of the skin barrier and its modulation by vesicular formulations. Prog Lipid Res. 2003;42:1–36.
- Rawlings A, Harding C. Moisturization and skin barrier function. Dermatol Ther. 2004;17:43–48.
- Nestle FO, Di Meglio P, Qin JZ, et al. Skin immune sentinels in health and disease. Nat Rev Immunol. 2009;9:679–691.
- Ashcroft FM, Rorsman P. Diabetes mellitus and the β cell: the last ten years. Cell. 2012;148:1160–1171.
- Kahn SE. The importance of β-cell failure in the development and progression of type 2 diabetes. J Clin Endocrinol Metab. 2001;86:4047–4058.
- Goldberg RB. Cytokine and cytokine-like inflammation markers, endothelial dysfunction, and imbalanced coagulation in development of diabetes and its complications. J Clin Endocrinol Metab. 2009;94:3171–3182.
- Wang TJ, Larson MG, Vasan RS, et al. Metabolite profiles and the risk of developing diabetes. Nat Med. 2011;17:448–453.
- Hu FB, Meigs JB, Li TY, et al. Inflammatory markers and risk of developing type 2 diabetes in women. Diabetes. 2004;53:693–700.
- Ortega FJ, Mercader JM, Moreno-Navarrete JM, et al. Profiling of circulating microRNAs reveals common microRNAs linked to type 2 diabetes that change with insulin sensitization. Diabetes Care. 2014;37:1375–1383.
- Guay C, Regazzi R. Circulating microRNAs as novel biomarkers for diabetes mellitus. Nat Rev Endocrinol. 2013;9:513–521.
- Sebastiani G, Nigi L, Grieco G, et al. Circulating microRNAs and diabetes mellitus: a novel tool for disease prediction, diagnosis, and staging? J Endocrinol Invest. 2017;40:591–610.
- Djuranovic S, Nahvi A, Green R. miRNA-mediated gene silencing by translational repression followed by mRNA deadenylation and decay. Science. 2012;336:237–240.
- Bartel DP. MicroRNAs: genomics, biogenesis, mechanism, and function. cell. 2004;116:281–297.
- Guo H, Ingolia NT, Weissman JS, et al. Mammalian microRNAs predominantly act to decrease target mRNA levels. Nature. 2010;466:835–840.
- Guay C, Roggli E, Nesca V, et al. Diabetes mellitus, a microRNA-related disease? Transl Res. 2011;157:253–264.
- Hébert SS, De Strooper B. Alterations of the microRNA network cause neurodegenerative disease. Trends Neurosci. 2009;32:199–206.
- Szabo G, Bala S. MicroRNAs in liver disease. Nat Rev Gastroenterol Hepatol. 2013;10:542–552.
- Sayed D, Abdellatif M. MicroRNAs in development and disease. Physiol Rev. 2011;91:827–887.
- Joglekar MV, Januszewski AS, Jenkins AJ, et al. Circulating microRNA biomarkers of diabetic retinopathy. Diabetes. 2016;65:22–24.
- Carella A, Benvenuto A, Marinelli T, et al. Circulating microRNAs as novel disease biomarkers: can they be applied in daily clinical practice. J Mol Genet Med. 2017;11:1747–0862.1000241.
- Zernecke A, Bidzhekov K, Noels H, et al. Delivery of microRNA-126 by apoptotic bodies induces CXCL12-dependent vascular protection. Sci Signal. 2009;2:ra81–ra.
- Valadi H, Ekström K, Bossios A, et al. Exosome-mediated transfer of mRNAs and microRNAs is a novel mechanism of genetic exchange between cells. Nat Cell Biol. 2007;9:654–659.
- Arroyo JD, Chevillet JR, Kroh EM, et al. Argonaute2 complexes carry a population of circulating microRNAs independent of vesicles in human plasma. Proc Nat Acad Sci. 2011;108:5003–5008.
- Vickers KC, Palmisano BT, Shoucri BM, et al. MicroRNAs are transported in plasma and delivered to recipient cells by high-density lipoproteins. Nat Cell Biol. 2011;13:423–433.
- Creemers EE, Tijsen AJ, Pinto YM. Circulating microRNAs. Circ Res. 2012;110:483–495.
- Fernandez-Valverde SL, Taft RJ, Mattick JS. MicroRNAs in β-cell biology, insulin resistance, diabetes and its complications. Diabetes. 2011;60:1825–1831.
- Mills SJ, Cowin AJ. MicroRNAs and their roles in wound repair and regeneration. Wound Pract Res. 2013;21:26–40.
- Viticchie G, Lena A, Cianfarani F, et al. MicroRNA-203 contributes to skin re-epithelialization. Cell Death Dis. 2012;3:e435.
- Bitar MS, Labbad ZN. Transforming growth factor-β and insulin-like growth factor-I in relation to diabetes-induced impairment of wound healing. J Surg Res. 1996;61:113–119.
- Igarashi A, Okochi H, Bradham DM, et al. Regulation of connective tissue growth factor gene expression in human skin fibroblasts and during wound repair. Mol Biol Cell. 1993;4:637–645.
- Abdulkarim B, Nicolino M, Igoillo-Esteve M, et al. A missense mutation in PPP1R15B causes a syndrome including diabetes, short stature and microcephaly. Diabetes. 2015;64:3951–3962.
- Shahmoradgoli M, Riazalhosseini Y, Haag D, et al. Protein phosphatase 1, regulatory subunit 15B is a survival factor for ERα‐positive breast cancer. Int J Cancer. 2013;132:2714–2719.
- Usui ML, Mansbridge JN, Carter WG, et al. Keratinocyte migration, proliferation, and differentiation in chronic ulcers from patients with diabetes and normal wounds. J Histochem Cytochem. 2008;56:687–696.
- Greenhalgh DG. The role of apoptosis in wound healing. Int J Biochem Cell Biol. 1998;30:1019–1030.
- Baltzis D, Eleftheriadou I, Veves A. Pathogenesis and treatment of impaired wound healing in diabetes mellitus: new insights. Adv Ther. 2014;31:817–836.
- Davis FM, Kimball A, Boniakowski A, et al. Dysfunctional wound healing in diabetic foot ulcers: new crossroads. Curr Diab Rep. 2018;18:2.
- Reinhart BJ, Slack FJ, Basson M, et al. The 21-nucleotide let-7 RNA regulates developmental timing in Caenorhabditis elegans. nature. 2000;403:901–906.
- Tennessen JM, Thummel CS. Developmental timing: let-7 function conserved through evolution. Curr Biol. 2008;18:R707–R8.
- Roush S, Slack FJ. The let-7 family of microRNAs. Trends Cell Biol. 2008;18:505–516.
- Kajimoto K, Naraba H, Iwai N. MicroRNA and 3T3-L1 pre-adipocyte differentiation. Rna. 2006;12:1626–1632.
- Le LT, Swingler TE, Clark IM. the role of microRNAs in osteoarthritis and chondrogenesis. Arthritis Rheumatol. 2013;65:1963–1974.
- Liu X, Jiang L, Wang A, et al. MicroRNA-138 suppresses invasion and promotes apoptosis in head and neck squamous cell carcinoma cell lines. Cancer Lett. 2009;286:217–222.
- Siragam V, Rutnam ZJ, Yang W, et al. MicroRNA miR-98 inhibits tumor angiogenesis and invasion by targeting activin receptor-like kinase-4 and matrix metalloproteinase-11. Oncotarget. 2012;3:1370–1385.
- Rizos E, Siafakas N, Katsantoni E, et al. Let-7, Mir-98 and Mir-181 as biomarkers for cancer and schizophrenia. PloS One. 2015;10:e0123522.
- Huang S-D, Yuan Y, Zhuang C-W, et al. MicroRNA-98 and microRNA-214 post-transcriptionally regulate enhancer of zeste homolog 2 and inhibit migration and invasion in human esophageal squamous cell carcinoma. Mol Cancer. 2012;11:51.
- Wang CY, Zhang JJ, Hua L, et al. MicroRNA-98 suppresses cell proliferation, migration and invasion by targeting collagen triple helix repeat containing 1 in hepatocellular carcinoma. Mol Med Rep. 2016;13:2639–2644.
- Zhou W, Zou B, Liu L, et al. MicroRNA-98 acts as a tumor suppressor in hepatocellular carcinoma via targeting SALL4. Oncotarget. 2016;7:74059–74073.
- Li H-W, Meng Y, Xie Q, et al. miR-98 protects endothelial cells against hypoxia/reoxygenation induced-apoptosis by targeting caspase-3. Biochem Biophys Res Commun. 2015;467:595–601.
- Chen S, Wen X, Zhang W, et al. Hypolipidemic effect of oleanolic acid is mediated by the miR-98-5p/PGC-1β axis in high-fat diet–induced hyperlipidemic mice. Faseb J. 2016;31:1085–1096.
- Keller A, Meese E. Can circulating miRNAs live up to the promise of being minimal invasive biomarkers in clinical settings? Wiley Interdiscip Rev RNA. 2016;7:148–156.
- De Guire V, Robitaille R, Tetreault N, et al. Circulating miRNAs as sensitive and specific biomarkers for the diagnosis and monitoring of human diseases: promises and challenges. Clin Biochem. 2013;46:846–860.
- Weber JA, Baxter DH, Zhang S, et al. The microRNA spectrum in 12 body fluids. Clin Chem. 2010;56:1733–1741.
- Cui Q, Yu Z, Purisima EO, et al. Principles of microRNA regulation of a human cellular signaling network. Mol Syst Biol. 2006;2:46.
- Etheridge A, Lee I, Hood L, et al. Extracellular microRNA: a new source of biomarkers. Mutat Res. 2011;717:85–90.
- Scheuner D, Song B, McEwen E, et al. Translational control is required for the unfolded protein response and in vivo glucose homeostasis. Mol Cell. 2001;7:1165–1176.
- Jousse C, Oyadomari S, Novoa I, et al. Inhibition of a constitutive translation initiation factor 2α phosphatase, CReP, promotes survival of stressed cells. J Cell Biol. 2003;163:767–775.
- Kernohan KD, Tétreault M, Liwak-Muir U, et al. Homozygous mutation in the eukaryotic translation initiation factor 2alpha phosphatase gene, PPP1R15B, is associated with severe microcephaly, short stature and intellectual disability. Hum Mol Genet. 2015;24:6293–6300.
- Harding HP, Zhang Y, Scheuner D, et al. Ppp1r15 gene knockout reveals an essential role for translation initiation factor 2 alpha (eIF2α) dephosphorylation in mammalian development. Proc Natl Acad Sci. 2009;106:1832–1837.
- Schürmann C, Goren I, Linke A, et al. Deregulated unfolded protein response in chronic wounds of diabetic ob/ob mice: a potential connection to inflammatory and angiogenic disorders in diabetes-impaired wound healing. Biochem Biophys Res Commun. 2014;446:195–200.
- Jiang T, Li M, Li Q, et al. MicroRNA-98-5p inhibits cell proliferation and induces cell apoptosis in hepatocellular carcinoma via targeting IGF2BP1. Oncol Res Featuring Preclinical Clin Cancer Ther. 2017;25:1117–1127.
- Tan B, Wang H, Dong J, et al. Dysregulated miR-98-5p contributes to excessive apoptosis of nucleus pulposus cells by BMP2 in human intervertebral disc degeneration. Biomed Res. 2017;28:9.
- Hu Y-K, Wang X, Li L, et al. MicroRNA-98 induces an Alzheimer’s disease-like disturbance by targeting insulin-like growth factor 1. Neurosci Bull. 2013;29:745–751.
- Yang G, Zhang X, Shi J. MiR-98 inhibits cell proliferation and invasion of non-small cell carcinoma lung cancer by targeting PAK1. Int J Clin Exp Med. 2015;8:20135–20145.
- Li Q, Li X, Wang L, et al. miR-98-5p acts as a target for Alzheimer’s disease by regulating Aβ production through modulating SNX6 expression. J Mol Neurosci. 2016;60:413–420.