
 ?Mathematical formulae have been encoded as MathML and are displayed in this HTML version using MathJax in order to improve their display. Uncheck the box to turn MathJax off. This feature requires Javascript. Click on a formula to zoom.
ABSTRACT
MicroRNAs (miRNAs) are small non-coding RNAs that play essential roles in the regulation of gene function by a mechanism known as RNA silencing. In a previous study, we revealed that miRNA-mediated silencing efficacy is correlated with the combinatorial thermodynamic properties of the miRNA seed–target mRNA duplex and the 5´-terminus of the miRNA duplex, which can be predicted using ‘miScore’. In this study, a robust refined-miScore was developed by integrating the thermodynamic properties of various miRNA secondary structures and the latest thermodynamic parameters of wobble base-pairing, including newly established parameters for I:C base pairing. Through repeated random sampling and machine learning, refined-miScore models calculated with either melting temperature (Tm) or free energy change (ΔG) values were successfully built and validated in both wild-type and adenosine-to-inosine edited miRNAs. In addition to the previously reported contribution of the seed–target duplex and 5´-terminus region, the refined-miScore suggests that the central and 3´-terminus regions of the miRNA duplex also play a role in the thermodynamic regulation of miRNA-mediated silencing efficacy.
1. Introduction
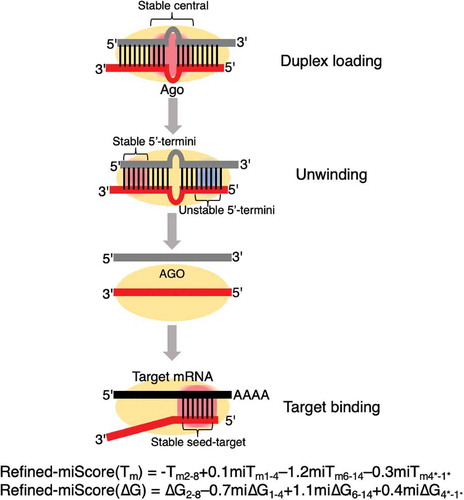
MicroRNAs (miRNAs) are small non-coding RNAs of 20–22 nucleotides (nt) in length that function as guide molecules in miRNA-mediated gene silencing [Citation1]. In the process of miRNA biosynthesis in human cells, primary miRNAs (pri-miRNAs), which adopt long hairpin structures, are initially transcribed by RNA polymerase II from genomic miRNA genes [Citation2]. Mature miRNA duplexes are usually produced in two steps. First, pri-miRNAs are processed by Drosha in the nucleus, generating precursor miRNAs (pre-miRNAs) [Citation3]. Then, pre-miRNAs are exported into the cytoplasm and further cleaved by Dicer, yielding mature miRNAs [Citation4]. In miRNA-mediated gene silencing, a double-stranded mature miRNA duplex is first loaded onto Argonaute (AGO) protein within the RNA-induced silencing complex (RISC), where it subsequently unwinds into single-stranded miRNAs from the thermodynamically less stable end [Citation5–Citation7]. One of the strands is entrapped in AGO and acts as the functional strand (guide strand), while the other strand (passenger strand) is discarded. In most cases, guide strands of miRNAs recognize their mRNA targets in the seed region (nucleotide 2–8 from 5´ end) through Watson-Crick base pairing [Citation8,Citation9] (). Guide strands of miRNAs downregulate the expression of their mRNA targets by recruiting RISCs to the 3´untranslated regions (3´UTR) and mediate mRNA decay via deadenylation or decapping [Citation10,Citation11].
Figure 1. miRNA- and siRNA-mediated gene silencing. (A) In miRNA silencing, miRNA duplex is loaded onto AGO protein within the RISC. Then, miRNA duplex unwinds into single-stranded RNAs from the thermodynamically less stable end. The remaining strand act as guide strand (red). The passenger strand (grey) is discarded. MiRNA guide strand recognizes the seed-matched 3ʹ-UTR region of the target transcripts (black), and mediate mRNA decay via deadenylation or decapping. (B) In siRNA silencing, completely base paired siRNA duplex is loaded onto AGO protein within the RISC. The perfect-matched passenger strand (grey) is then cleaved by AGO at the corresponding position between guide position 10 and 11. The remaining guide strand (blue) either mediate RNAi by recognizing fully base paired target mRNA (black), thus inducing cleavage of the target, or mediate miRNA-like siRNA off-target effect by recognizing seed-matched off-target mRNAs (black).
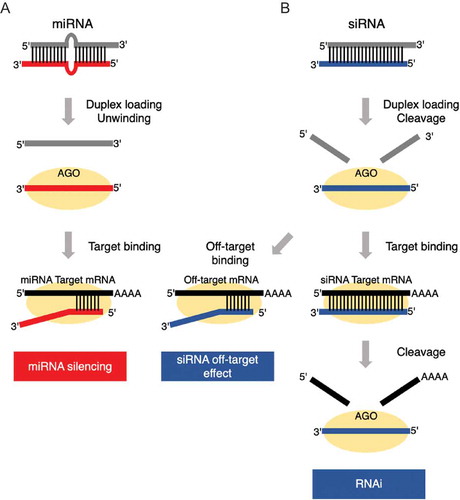
Another type of small RNA, small interfering RNA (siRNA), is frequently used as a silencing agent for intended gene silencing via RNA interference (RNAi) [Citation12]. siRNAs are usually designed as 21 nt RNA duplexes with perfectly base-paired sequence, while miRNAs usually carry internal mismatches, loops, or bulges [Citation1,Citation11]. When an siRNA duplex is loaded onto AGO, the perfect-matched passenger strand is usually cleaved by AGO at the corresponding position between guide position 10 and 11, described as slicer-dependent unwinding [Citation13,Citation14]. In miRNAs, central mismatches around the cleavage site protect the passenger strands from being cleaved, thereby unwound in a slicer-independent manner [Citation14]. Similarly, canonical siRNA targets bearing perfect base complementarities with siRNA guide strands are usually cleaved by AGO. However, siRNAs also exhibit unfavourable miRNA-like off-target effects, where the expression of ‘off-target’ genes with only seed-matched (SM) sequence with siRNA guide strands was downregulated [Citation15] (). Recently, based on such principle, an efficient miRNA-based methodology was developed for the selective targeting of single point-mutated gene transcripts [Citation16].
To estimate the microRNA (miRNA) silencing efficacy and predict the functional machinery of miRNA, we previously presented a mathematical procedure, termed miScore (hereafter, previous-miScore), for predicting miRNA silencing efficacy based on thermodynamic properties of base pairing [Citation17]. A previous study revealed that miRNA-mediated silencing efficacy was closely correlated with the combinatorial thermodynamic stabilities of the seed–target duplex and the 5´-terminus of the miRNA duplex, which can be estimated by the following formula:
Tm2-8 represents the melting temperature (Tm) of the seed–target duplex, while miTm1–5 represents Tm value of the 5 nt long 5´-terminus of the miRNA duplex. This formula was consistent with the previous findings that an RNA strand with an unstable 5´-terminus in the miRNA duplex easily loads onto RISC and miRNA recognizes target mRNAs with seed-complementary sequences, suggesting that these two events are independently and proficiently regulated by the thermodynamics of base-pairing under protein-free conditions [Citation17] (). Consistent with miRNA-mediated silencing, the silencing efficacy of the off-target effect of siRNAs, which have AU-rich 5´-temini, are also positively correlated with the thermodynamic stability of the seed–target duplex [Citation18]. In the slicer-independent unwinding of miRNA, unwinding from the less thermodynamically stable 5´-terminus facilitates the release of passenger strands and AGO incorporation of guide strands [Citation17,Citation19,Citation20]. In slicer-dependent unwinding of siRNAs, passenger strands are cleaved. Thus it may not be necessary to separate the two strands from the less stable 5´-terminus [Citation6,Citation13].
Figure 2. Thermodynamic regulation of miRNA-mediated gene silencing efficacy incorporating previously ignored thermodynamic parameters. (A) Schematic representation of miRNA-mediated gene silencing. Silencing efficacy was previously reported to be positively correlated with melting temperature (Tm) of the seed-target duplex (Tm2–8), and negatively correlated with Tm of 5nt 5´-termini in the miRNA duplex (miTm1–5) with a factor 0.5, shown as a formula: [Citation17]. Thermodynamically stable region = Red box; Thermodynamically unstable region = Blue box. (B) Schematic representation of the base-pairing and RNA secondary structures incorporated in this study. In the calculation of thermodynamics of seed-target duplex region, only Watson-Crick base pairing was considered. In the calculation of thermodynamics of miRNA duplex, the previously ignored thermodynamic parameters of wobble base pairing and miRNA secondary structures were incorporated, in addition to Watson-Crick base pairing. (C) Previously reported silencing efficacies of 21 wild-type miRNAs measured as relative luc activities using luc reporter assay [Citation17]. (D) Luc correlation heatmaps were generated in the seed-target duplex (guide positions 2–8), miRNA duplex (guide positions 1–19), and both ends of miRNA duplex (guide positions 1–10 and passenger positions 10*–1*) to visualized in colour. The correlations between Tm values and luc activities across all possible regions in the (E) seed-target duplex, (F) miRNA duplex, and (G) duplex ends. Similarly, luc correlation heatmaps were also generated for ΔG values in the (H) seed-target duplex, (I) miRNA duplex, and (J) duplex ends. Blue showed negative correlation; red, positive correlation. x = start position; y = end position; * = passenger positions, where positions were counted from 5´-end of the passenger strand. Four regions of miRNA duplex that correlated with luc activities, termed 5´-termini, central, 3´-mid, and 3´-termini regions, were labelled as (1), (2), (3), and (4), respectively.
![Figure 2. Thermodynamic regulation of miRNA-mediated gene silencing efficacy incorporating previously ignored thermodynamic parameters. (A) Schematic representation of miRNA-mediated gene silencing. Silencing efficacy was previously reported to be positively correlated with melting temperature (Tm) of the seed-target duplex (Tm2–8), and negatively correlated with Tm of 5nt 5´-termini in the miRNA duplex (miTm1–5) with a factor 0.5, shown as a formula: P+12×mV×v2+mV×g×h=Constant [Citation17]. Thermodynamically stable region = Red box; Thermodynamically unstable region = Blue box. (B) Schematic representation of the base-pairing and RNA secondary structures incorporated in this study. In the calculation of thermodynamics of seed-target duplex region, only Watson-Crick base pairing was considered. In the calculation of thermodynamics of miRNA duplex, the previously ignored thermodynamic parameters of wobble base pairing and miRNA secondary structures were incorporated, in addition to Watson-Crick base pairing. (C) Previously reported silencing efficacies of 21 wild-type miRNAs measured as relative luc activities using luc reporter assay [Citation17]. (D) Luc correlation heatmaps were generated in the seed-target duplex (guide positions 2–8), miRNA duplex (guide positions 1–19), and both ends of miRNA duplex (guide positions 1–10 and passenger positions 10*–1*) to visualized in colour. The correlations between Tm values and luc activities across all possible regions in the (E) seed-target duplex, (F) miRNA duplex, and (G) duplex ends. Similarly, luc correlation heatmaps were also generated for ΔG values in the (H) seed-target duplex, (I) miRNA duplex, and (J) duplex ends. Blue showed negative correlation; red, positive correlation. x = start position; y = end position; * = passenger positions, where positions were counted from 5´-end of the passenger strand. Four regions of miRNA duplex that correlated with luc activities, termed 5´-termini, central, 3´-mid, and 3´-termini regions, were labelled as (1), (2), (3), and (4), respectively.](/cms/asset/f016da64-d359-487b-a7d0-d93f9f8e4044/krnb_a_1678364_f0002_oc.jpg)
Furthermore, a U/A bias at the 5´-end was observed for miRNA guide strands, allowing easier incorporation into the AGO phosphate-binding pocket [Citation21]. Therefore, the thermodynamics of duplex ends and the U/A preference at the 5´-end collaboratively regulate miRNA functional strand selection, a process that determines which strand is more likely to serve as the guide strand [Citation6].
In adenosine-to-inosine (A-to-I) RNA editing, adenosine is converted to inosine in a deamination reaction catalysed by members of the protein family called adenosine deaminases acting on RNAs (ADARs) [Citation22]. Unlike adenosine which base pairs with uridine, inosine preferably base pairs with cytidine. Therefore, inosine is interpreted as guanosine in the eukaryotic translation machinery [Citation22]. It was reported that A-to-I editing within the protein coding sequence may induce alternation of codons [Citation23,Citation24]. For instance, the A-to-I editing in the coding sequence of the glutamate receptor GluR-B mRNA disturbs its proper neurotransmitter receptor activity [Citation25]. However, a growing body of deep sequencing data revealed that A-to-I editing events are widespread in non-coding regions, such as introns and Alu elements [Citation26–Citation29]. ADAR proteins are also known to affect the biogenesis and maturation of siRNA and miRNA [Citation30].
In humans, A-to-I RNA editing of miRNA differs between tissues and physiological conditions. The majority (~70%) of A-to-I editing events are observed in seed regions [Citation31,Citation32]. When it occurs in miRNA seed regions, target genes are usually redirected from a group of U-containing transcripts (U-targets), where the SM sequence in the 3´UTR region contains a uridine opposite to the A-to-I editing site, to a group of C-containing transcripts (C-targets), where the SM sequence of the 3´UTR regions contains a cytidine opposite to the editing site [Citation33,Citation34]. Furthermore, the I:C base pairing has been reported to be less stable than G:C base pairing [Citation33,Citation35]. Thus, A-to-I edited miRNAs exhibit different silencing efficacies, and such editing in the miRNA seed region could redirect target genes and regulate miRNA-mediated silencing efficacy [Citation33].
In this study, a revised calculation procedure for miRNA thermodynamics was adopted, incorporating updated thermodynamic parameters for wobble base pairing and a variety of miRNA secondary structures. Based on the new procedure, two additional regions of the miRNA duplex that contribute to a higher predictive power were incorporated to build a robust refined-miScore. A series of refined-miScore models, calculated with either Tm or ΔG values, were successfully developed through repeated random sampling and machine learning. The predictive performance of each refined-miScore model was successfully validated in wild-type (A-type) and A-to-I edited miRNAs with annotated A-to-I editing sites.
2. Results
2.1. Thermodynamic stability of the seed–target duplex and four miRNA duplex regions correlate with experimentally determined miRNA-mediated silencing efficacy
To calculate previous-miScore, the thermodynamic parameters for Watson-Crick base pairing and G:U wobble base pairing () were used to predict the miRNA silencing efficacy, but the thermodynamic stabilities of various RNA secondary structures, such as I:U wobble base pairing and I:C base pairing, were not involved [Citation17]. In this study, the thermodynamics of RNA secondary structures were incorporated, including terminal mismatch, dangling end, single mismatch, tandem mismatch, large loop, 1 × 2 loop, and bulge loop (). Their thermodynamic properties were estimated using a series of published predictive models registered in the nearest neighbour parameter database for predicting the stability of nucleic acid secondary structure (NNDB) [Citation36]. The parameters of more recent models that had not yet been used to revise the NNDB models for single mismatch [Citation37], tandem mismatch [Citation38], and 1 × 2 loop [Citation39] were also used in the calculations in this study. Furthermore, updated sets of thermodynamic parameters for G:U [Citation40], I:C [Citation35,Citation41], and I:U [Citation42] were incorporated into the calculation. The sources of all the models and parameters used in this study are summarized in .
Table 1. Thermodynamic parameters used for previous- and refined-miScore.
Because thermodynamic properties of miRNA can be represented by both Tm and ΔG values in the calculation of thermodynamic stabilities of 21 small RNAs [Citation18], a refined-miScore formula can potentially be built based on the revised calculation procedure, incorporating the latest parameters and those of the secondary structures in addition to the previously used parameters for Watson-Crick base pairing and wobble base pairing. To identify the regions that correlate with miRNA-mediated silencing activity, luc correlation heatmaps were generated using the luc reporter assays used in the previous study (17, ) for either Tm or ΔG values in the guide–target duplex region (seed–target positions 2–8), miRNA duplex region (guide positions 1–19), and both ends of miRNA duplex (guide positions 1–10 and passenger positions 10*–1*, where * indicates the position measured from the 5´-end of the passenger strand to integrate the positions of nucleotides from the 3´-end of miRNAs of different length (). Crystal structures of the AGO protein showed that the phosphorylated 5´-end nucleotide of the miRNA guide strand is anchored in the MID domain of AGO [Citation43,Citation44]. However, co-immunoprecipitation experiments revealed that miRNA with U or A at the 5´-end of the guide strand preferably immunoprecipitated with AGO [Citation45,Citation46]. NMR titration analyses revealed that miRNA with U or A at the 5´-end binds the AGO protein with up to 30-fold higher affinity than miRNA with C or G [Citation21]. This may be attributable to the structural features, and may not be estimated by thermodynamics. Furthermore, U is highly conserved at 5´-ends in vertebrates. Therefore, we used miRNAs with Us or As at the 5´-ends to evaluate silencing efficacies.
Based on luc correlation heatmaps generated for Tm values, the whole guide–target region was negatively correlated with relative luc activity, indicating that miRNAs with higher Tm values show stronger silencing activity () in consistent with our previous report [Citation17]. Luc correlation was weaker in the guide–target duplex at guide positions 2–6 compared to guide positions 6–8 (). It was hypothesized that this correlation was partially antagonized by the overlapping region of miRNA duplex with an opposite luc correlation (, G). Thus, the nucleotides at the same positions (guide positions 2–6) may contribute to opposite properties in the seed–target duplex and miRNA duplex, which may explain why guide positions 6–8, rather than the whole seed–target duplex region (positions 2–8), were more strongly correlated with relative luc activities (). As for the miRNA duplex () and both ends of the miRNA duplex (), the 5´-terminus region, central region, 3´-mid region, and 3´-terminus region, were positively, negatively, positively, and negatively correlated with relative luc activities, respectively. All luc correlation patterns of ΔG values were identical to the Tm values but in opposite directions (–J).
To summarize, in addition to the seed–target duplex region, four candidate regions across the miRNA duplex appeared to be correlated with relative luc activities. It should be clarified that a low relative luc activity indicates a high silencing efficacy. Meanwhile, Tm and ΔG are positive and negative thermodynamic indicators, respectively. Based on this understanding, the results indicate that miRNA-mediated silencing efficacy is positively correlated with the thermodynamic stability of the seed–target duplex, and is negatively, positively, negatively, and positively correlated with the thermodynamic stabilities of the 5´-terminus region, central region, 3´-mid region, and 3´-terminus region of the miRNA duplex, respectively. Among them, the contributions of the seed–target duplex and 5´-terminus were similar to those described in previous-miScore [Citation17]. Thus, three previously uncharacterized responsible regions (central, 3´-mid, 3´-terminus) appeared to be correlated with relative luc activities when the latest thermodynamic parameters and those of the secondary structures were incorporated into the calculation of miRNA thermodynamics.
2.2. Determination of the start and end position of each region responsible for RNA silencing activity
To determine the substantial start and end positions of each region in the miRNA duplex responsible for RNA silencing activity, a repeated random sampling process was adopted to sample various combinations of miRNA subgroups (n = 14) from the 21 miRNAs. In each sampling cycle, start (x) and end (y) positions of the regions with either the top 5–10 most positive or negative luc correlations across miRNA duplex were recorded for the randomly sampled 14 miRNAs. The random sampling process was repeated 1000 times, generating a list representing the regions with optimal luc correlations in either direction.
The frequency of optimal x-y positions across miRNA duplexes is shown in . In the calculation of Tm values across guide positions 1–19, the most frequently occurring start and end positions (x-y) of miRNA duplex regions with the top 10 negative luc correlations were guide positions 6–14 (), corresponding to the central region, while the most frequently occurring regions with top 10 positive luc correlations were guide positions 1 (with terminal score) – 3, and 15–16 (), corresponding to the 5´-terminus region and 3´-mid regions, respectively. However, the luc correlations with Tm values across the 3´-end of the guide strand were considered inaccurate, because the miRNA lengths and the positions from the 3´-end varied. Therefore, the luc correlations were calculated using Tm values from the 5´-end of the passenger strand, and the most frequently occurring regions with the top 5 negative luc correlations were passenger positions 4*-1* (), corresponding to the 3´-terminus. The most frequently occurring regions with the top 5 positive luc correlations were passenger positions 8*-4* (), corresponding to the 3´-mid region. The start and end positions of the 3´-mid region determined within guide positions 1–19 were not chosen for further discussion because position discrepancy may introduce statistical nonsignificance when the calculation progresses towards the 3´-end among miRNAs of varied lengths. Instead, the start and end positions determined in the calculation of 10 nt at the 5´-end of the passenger strand were adopted to represent the 3´-mid region. To summarize, for the thermodynamic calculation of Tm values, the most frequently occurring x-y positions were guide positions 1–3 (5´-terminus region), guide positions 6–14 (central region), passenger positions 8*–4* (3´-mid region), and passenger positions 4*–1* (3´-terminus region).
Figure 3. Significant start and end positions of each responsible region in the miRNA duplex. Distribution of start and end positions in miRNA duplex regions of Tm (miTm) with (A) top 10 most negative and (B) top 10 most positive luc correlations across guide position 1–19; (C) top 5 most negative and (D) top 5 most positive luc correlations across passenger positions 10*–1*. Similarly, distribution of start and end positions of miRNA duplex regions of ΔG (miΔG) with (E) top 10 most positive and (F) top 10 most negative luc correlations across guide positions 1–19; (G) top 5 most positive and (H) top 5 most negative luc correlations across passenger positions 10*–1* Repeated sampling was repeated 1000 times in the calculation of each region. * = passenger positions, where positions were counted from 5´-end of the passenger strand. Red background colour = positive luc correlations; blue background colour = negative luc correlations.
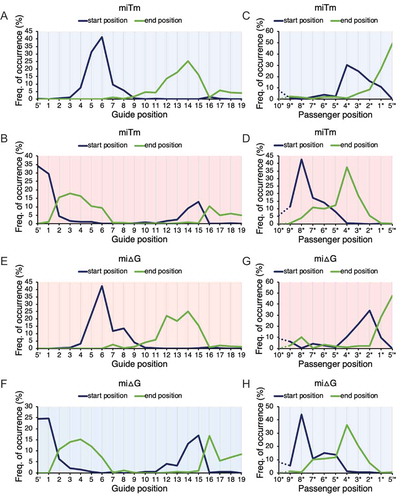
The results of ΔG values were highly but not perfectly consistent with those of Tm values but with opposite luc correlations (–H), in agreement with their roles as negative thermodynamic indicators. The most frequently occurring start (x) and end (y) in the calculation of ΔG values were guide positions 1–4 (5´-terminus region), guide positions 6–14 (central region), passenger positions 8*–4* (3´-mid region), and passenger positions 2*–1* (3´-terminus region).
Because the x-y positions of several regions in the calculation of Tm and ΔG values differed by 1–2 nt in length, those with more than 3 nt were chosen to represent each region substantively and are summarized in . To examine the authentic contributions of the four regions in the miRNA duplex, the calculated Tm and ΔG values of the 5´-terminus region, central region, 3´-terminus region, and 3´-mid region were progressively added to each value of the seed-duplex region in the construction of the refined-miScore: two S models for Tm (S[Tm]) and ΔG (S[ΔG]), where only the Tm and ΔG values of the seed–target region were incorporated; two M1 models for Tm (M1[Tm]) and ΔG (M1[ΔG]), where the values of the seed–target region and 5´-terminus region were incorporated; two M2 models for Tm (M2[Tm]) and ΔG (M2[ΔG]), where the values of the seed–target region, 5´-terminus region, and central region were incorporated; two M3 models for Tm (M3[Tm]) and ΔG (M3[ΔG]), where the values of the seed–target region, 5´-terminus region, central region, and 3´-terminus region were incorporated; and two M4 models for Tm (M4[Tm]) and ΔG (M4[ΔG]), where all values of the four regions of the miRNA duplex were incorporated (). The contribution of the seed–target duplex region (Tm2–8) was normalized as −1 in all Tm models because the whole seed–target duplex region was negatively correlated with luc activity (). The contribution of the seed–target region (ΔG2–8) was normalized as 1 in all ΔG models because the whole seed–target region was positively correlated with luc activity ().
Table 2. Responsible regions determined for refined-miScore construction.
2.3. Construction of a refined miScore through machine learning
In the previous study, we constructed the linear regression model of previous-miScore using the results of silencing activities of 20 arbitrarily chosen miRNAs and identified an additional region (positions 1–5) other than seed–target duplex region [Citation17]. In this study, in addition to the seed–target duplex region, four additional regions of the miRNA duplex, including the 5´-terminus, central, 3´-mid, and 3´-terminus regions, were considered in the construction of the refined-miScore model. A machine learning procedure was adopted to examine the authentic contribution of each region in the miRNA duplex in regulating miRNA-mediated silencing efficacy and determine the factor k of each region representing their relative contributions in the proposed linear regression models of refined-miScore. In each training cycle of machine learning, the miRNA samples (n = 21) were randomly divided into training data (n = 14) and validation data (n = 7). Different k values were randomly assigned to the Tm and ΔG values of each region of the miRNA duplex to maximize the luc correlation of the tested model in the training data. The optimal k values were subsequently tested in the validation data. The whole process was repeated for 1000 times, generating a list of luc correlations of training data (T-correlations), luc correlations of validation data (V-correlations), and associated optimal k sets.
All T- and V-correlations generated during the data training process for each Tm and ΔG models are visualized in box plots in . To obtain a better understanding of the behaviour of the correlation data, T- and V-correlations were first addressed separately. In the training process of Tm models, T-correlations increased stepwise across S(Tm), M1(Tm), M2(Tm), M3(Tm), and M4(Tm), while V-correlations increased stepwise across S(Tm), M1(Tm), M2(Tm), and M3(Tm), then decreased at M4(Tm). Similarly, T-correlations increased stepwise across S(ΔG), M1(ΔG) M2(ΔG), M3(ΔG), and M4(ΔG), whereas V-correlations increased stepwise across S(ΔG), M1(ΔG), and M2(ΔG), reaching a plateau at M3(ΔG), and then decreasing at M4(ΔG). The increasing T-correlations across Tm and ΔG models indicates that all four regions, when assigned with optimal k values, have the potential to maximize the luc correlation of the tested model in randomly selected training data. However, the better predictive performance across all Tm or ΔG models with optimal k sets generated in the training data were only confirmed across S, M1, M2, and M3 models in the validation data. Incorporation of the values of the 3´-mid region in M4 lowered its predictive performance. This observation led to the conclusion that the 5´-terminus, central, and 3´-terminus regions also significantly increased the predictive performance of the refined-miScore model. The declined performance at M4 may be the result of overfitting the nonsignificant contribution of the 3´-mid region in the construction of the refined-miScore model.
Figure 4. A machine learning procedure confirmed the authentic contribution of three miRNA duplex regions. (A) A machine learning procedure was adopted to randomly assign k factors of Tm or ΔG value for each region in the linear regression models to optimize T-correlations (T, red). The optimal k sets generated in the randomly sampled training data were subsequently validated in the validation data (n =7), and shown as V-correlations (V, blue). S indicates the luc correlation with Tm or ΔG value of seed-target duplex only, shown in grey. M1, M2, M3, and M4 indicate the luc correlations with additional effects of Tm or ΔG value of each of four regions in the miRNA duplex to the seed-target value as shown in the text. The training-validation cycle was repeated 1000 times. T-correlations (B) and V-correlations (C) generated using Tm models in training data. T-correlations (D) and V-correlations (E) generated using ΔG models in training data. (F) All the values of S-, T-, and V-correlations, regardless of model types, were integrated and compared. (G) All the values in the models M1-M4 of either Tm (green) or ΔG (yellow), regardless of T or V, were integrated and compared. (H) Mean values of correlations of each model generated in different data types, Tm(T), Tm(V), ΔG(T), and ΔG(V), respectively. The rhombus in the boxes represent mean values (ns: P > 0.05; *: 0.05 ≥ P > 0.01; **: 0.01 ≥ P > 0.001; ***: 0.001 ≥ P > 0.0001; ****: 0.0001 ≥ P).
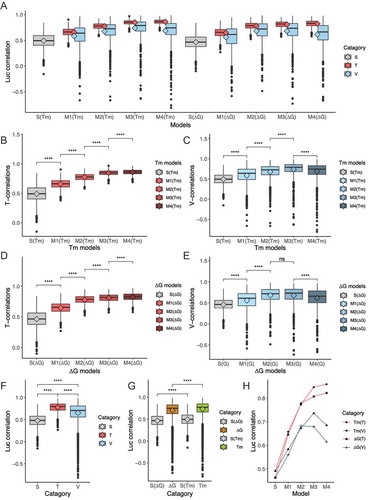
Additional analyses were performed to reveal other significant features of the luc correlation data. When Tm and ΔG data encompassing the whole miRNA duplex region were integrated, both T-correlations and V-correlations were higher than the luc correlations of the S model (seed–target only), and T-correlations appeared to be higher than V-correlations. Thus, training comprehensively enhanced luc correlations of the training models in both training and validation data, and the predictive performance of luc correlations in the validation data was lower than in training models. On the other hand, Tm models exhibited higher luc correlations than ΔG models, suggesting that they had superior predictive performance.
Finally, the mean values of the luc correlations generated in the training and validation data were analysed. Mean values of T(Tm) and T(ΔG) increased progressively from S(Tm) to M4(Tm), and from S(ΔG) to M4(ΔG), respectively. Mean values of V(Tm) increased progressively from S(Tm) to M3(Tm), and dropped from M3(Tm) to M4(Tm). Mean values of V(ΔG) increased progressively from S(ΔG) to M2(ΔG), reaching a plateau between M2(ΔG) and M3(ΔG), and dropped at M4(ΔG) (). This observation suggests that all constructed models (M1–4) exhibit significantly higher luc correlations than seed–target only models (S) including the 5´-terminus, central, and 3´-terminus regions. This greatly enhanced the predictive performance of the models, whereas an additional 3´-mid region impaired performance. It was also noticeable that M2–4 exhibited higher luc correlation coefficients than M1, which confirms the significant contribution of the central and 3´-terminus regions that were not included in previous-miScore [Citation17].
2.4. Estimation of optimal k values associated with each responsible region
In the data training process, k values, which represent the relative contribution of each region (), were randomly assigned to each region to optimize the luc correlation in the training data of the tested model. The distributions of k values with significant predictive performance in both training and validation data are shown in .
In the data training process, 1000 sets of k values were generated that optimized the luc correlation in randomly and repeatedly sampled training data of the tested model. Among all k values (n = 1000), outliers that did not exhibit significant luc correlations were always involved in the training process. To determine a representative k value for each corresponding region, the distribution of significant k values was examined with both T-correlations and V-correlations higher than the threshold.
In the model training process of Tm (–D), significant k values (n = 364, threshold r = 0.6) for the 5´-terminus region (miTm1-4) of M1(Tm) were positively distributed and optimized at 0.4. Significant k values (n = 457, threshold r = 0.7) for the 5´-terminus region (miTm1–4) and the central region (miTm6–14) of M2(Tm) were positively and negatively distributed and optimized at 0.1 and −1.4, respectively. In M3(Tm), the distribution of significant k values (n = 715, threshold r = 0.7) of the 5´-terminus region (miTm1–4), central region (miTm6–14), and 3´-terminus region (miTm4*–1*) exhibited a positive, negative, and negative luc correlation pattern and were optimized at 0.2, −1.4, and −0.3, respectively. In M4(Tm), the distribution of significant k values (n = 608, threshold r = 0.7) of the 5´-terminus region (miTm1–4), central region (miTm6–14), 3´-mid region (miTm8*–4*), and 3´-terminus region (miTm4*–1*) exhibited a positive, negative, positive, and negative pattern and were optimized at 0.1, −1.2, 0.1, and −0.3, respectively.
Figure 5. Distribution of optimal k values in the training process. Distribution of optimal k sets optimizing T-correlations of the tested Tm or ΔG model in the training data was illustrated as the frequency of occurrence across a range of tested k values (−3 ~ 3). In the training process of Tm models, seed-target duplex (Tm2–8) was normalized as −1, and distribution of k values was generated for (A) miTm1–4 in M1(Tm); (B) miTm1–4 and miTm6–14 in M2(Tm); (C) miTm1–4, miTm6–14, and miTm4*–1* in M3(Tm); (D) miTm1–4, miTm6–14, miTm8*–4*, and miTm4*–1* in M4(Tm). In the training process of ΔG models, seed-target duplex (ΔG2–8) was normalized as 1, and distribution of k values was generated for (E) miΔG1–4 in M1(ΔG); (F) miΔG1–4 and miΔG6–14 in M2(ΔG); (G) miΔG1–4, miΔG6–14, and miΔG4*–1* in M3(ΔG); (H) miΔG1–4, miΔG6–14, miΔG8*–4*, and miΔG4*–1* in M4(ΔG). Dotted lines indicate the sum of out-of-bound values that exceed the graph scale. * =passenger position.
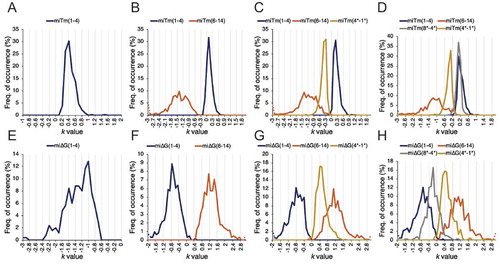
Similarly, the alternative luc correlation pattern of k values was also observed in ΔG models but the distributions were in opposite directions (–H). In the model training process of ΔG, significant k values (n = 249, threshold r = 0.6) for the 5´-terminus region (miΔG1–4) of M1(ΔG) were negatively distributed and were optimized at −1. Significant k values (n = 409, threshold r = 0.7) for the 5´-terminus region (miΔG1–4) and central region (miΔG6–14) of M2(ΔG) were negatively and positively distributed and were optimized at −0.8 and 1.1, respectively. In M3(ΔG), distribution of significant k values (n = 493, threshold r = 0.65) of the 5´-terminus region (miΔG1–4), central region (miΔG6–14), and 3´-terminus region (miΔG 4*–1*) exhibited a negative, positive, and positive luc correlation pattern and were optimized at −0.8, 1.1, and 0.4, respectively. In M4(ΔG), distribution of significant k values (n = 374, threshold r = 0.65) of the 5´-terminus region (miΔG1–4), central region (miΔG6–14), 3´-mid region (miΔG8*–4*), and 3´-terminus region (miΔG4*–1*) exhibited a negative, positive, negative, and positive luc correlation pattern and were optimized at −0.7, 1.1, −0.2, and 0.4, respectively.
In addition to the differentially normalized correlation coefficients of Tm (normalized as −1) and ΔG (normalized as 1) models in the seed–target region prior to the data training process, the highly consistent positive–negative alternation of k values along adjacent regions of the miRNA duplex and the opposite direction of k values in Tm and ΔG models perfectly reflected the pattern observed in the luc correlation heatmaps (–J). Furthermore, k values for the same region were highly consistent and showed little variation between Tm models and ΔG models (). To unify the k values among different models of Tm or ΔG, those with the minimum absolute values were assigned to the corresponding regions to finalize the model construction, because highly dispersed k values might result in over-contribution of the associated region. All finalized Tm and ΔG models are summarized in .
Table 3. Tm and ∆G models constructed through machine learning.
2.5. Validation of the refined-miScore in WT and A-to-I edited miRNAs
To validate the refined-miScore models of Tm and ΔG constructed in this study, six miRNAs (miR-22, miR-376a-1, miR-376a-2, miR-589, miR-99a, miR-455) with annotated A-to-I editing sites in the seed region of the 5p and/or 3p strand that were reported in two independent studies [Citation31,Citation32] or were registered in the Rigorously Annotated Database of A-to-I RNA Editing (RADAR) [Citation47] were chosen to test the refined-miScore models. Both wild-type (WT or A-type) and I-type miRNAs, where the adenosine at the annotated A-to-I editing sites was converted into inosine (), were tested separately.
Figure 6. Verification of refined-miScore models using WT and A-to-I edited miRNAs. (A) In A-to-I RNA editing, adenosine is converted to inosine by a deamination reaction catalysed by ADAR. Unlike adenosine which base pairs with uridine, inosine, similar to guanosine, base pairs with cytidine. (B) When A-to-I editing occurs in the miRNA seed region, target genes (black) can be redirected from U-targets, which bear uridines opposite to the adenosines of the guide strand, to C-targets, which bear cytidines opposite to the inosines at the A-to-I editing site. Here is an example where A-to-I editing is located in the seed-region of 3p guide strand (red), while 5p strand (grey) acts as passenger strand. Luc assay was performed to measure silencing efficacies of guide strands of (C) WT(A-type) (red) and (D) I-type (violet) miRNAs with their seed-matched psiCHECK-SM reporters with U-targets and C-targets, respectively. Bars indicate the standard deviation of triplicated samples from two independent experiments. Luc correlations was directly calculated for each model when all samples were used in (E) A- (n =7) and (f) I-type (n =8) miRNAs. Two sets of ΔG values (Asai group [Citation35] and Znosko group [Citation41]) for I:C base pairing were used in the thermodynamic calculation of I-type miRNAs.
![Figure 6. Verification of refined-miScore models using WT and A-to-I edited miRNAs. (A) In A-to-I RNA editing, adenosine is converted to inosine by a deamination reaction catalysed by ADAR. Unlike adenosine which base pairs with uridine, inosine, similar to guanosine, base pairs with cytidine. (B) When A-to-I editing occurs in the miRNA seed region, target genes (black) can be redirected from U-targets, which bear uridines opposite to the adenosines of the guide strand, to C-targets, which bear cytidines opposite to the inosines at the A-to-I editing site. Here is an example where A-to-I editing is located in the seed-region of 3p guide strand (red), while 5p strand (grey) acts as passenger strand. Luc assay was performed to measure silencing efficacies of guide strands of (C) WT(A-type) (red) and (D) I-type (violet) miRNAs with their seed-matched psiCHECK-SM reporters with U-targets and C-targets, respectively. Bars indicate the standard deviation of triplicated samples from two independent experiments. Luc correlations was directly calculated for each model when all samples were used in (E) A- (n =7) and (f) I-type (n =8) miRNAs. Two sets of ΔG values (Asai group [Citation35] and Znosko group [Citation41]) for I:C base pairing were used in the thermodynamic calculation of I-type miRNAs.](/cms/asset/7e45aacc-96e2-443c-97d7-0e3d05a87d40/krnb_a_1678364_f0006_oc.jpg)
The luc reporter assay was performed to measure the silencing efficacy of the presumed guide strand of A- and I-type miRNAs using U- and C-type psi-CHECK-SM reporters, respectively (). A-type miR-22, which was already included in the model construction process, was excluded to ensure the independence of the test dataset. Nucleotide sequences of all miRNAs except for miR-376a-1 and miR-589 were the same as those registered in miRBase. For miR-376a-1 and miR-589, the silencing efficacy of both strands was tested, because they contain A-to-I editing sites on both strands and both strands were modified to be initiated by A/U. Relative luc activities of A- and I-type miRNAs are shown in . It was confirmed that A-type miRNAs targeted U-reporters () but not C-reporters (Supplementary Fig. S1A), while I-type miRNAs targeted C-reporters () but not U-targets (Supplementay Fig. S1B). The model validation was carried out by calculating the luc correlation of each tested model in all miRNAs of each type (A-type, n = 7; I-type, n = 8).
To evaluate the refined-miScore model, luc correlations of each model were calculated using all tested miRNAs of each type to observe the changes in luc correlations among different models (,F). In A-type miRNAs (n = 7), the luc correlation increased progressively from S(ΔG) to M1(ΔG), M2(ΔG), and M3(ΔG), and dropped at M4(ΔG). As for Tm models, luc correlations increased progressively across S(Tm), M1(Tm), M2(Tm), and M3(Tm), and reached a plateau at M4(Tm) (). In I-type miRNAs, ΔG values were calculated using I:C parameters by either the Asai group [Citation35] or Znosko group [Citation41] and compared, whereas Tm values were not used because they had not yet been comprehensively described by both groups. Among ΔG models tested in I-type miRNAs, the luc correlation increased progressively across S(ΔG), M1(ΔG), M2(ΔG), and M3(ΔG), and dropped at M4(ΔG), and the results using Asai and Znosko parameters showed no significant differences in each model ().
In sum, the contribution of thermodynamics in the seed–target duplex and 5´- and 3´-terminus regions in the miRNA duplex towards a higher luc correlation was confirmed in both Tm and/or ΔG models in all A- and I-type miRNAs. Furthermore, the significant enhancement in luc correlation from M1 to M2 observed in A-type miRNAs suggests that thermodynamic stability of the central region may serve the most essential role in determining the silencing efficacy of miRNA-mediated gene silencing. A-type miRNAs in particular, including the central region in M2, dramatically improved the luc correlation coefficients from 0.68 (M1[Tm]) to 0.89 (M2[Tm]), and from 0.67 (M1[ΔG]) to 0.90 (M2[ΔG]). Comparing the two I:C parameters, the parameters of the Znosko group [Citation41] showed higher luc correlations than those of the Asai group [Citation35] across the S(ΔG) to M3(ΔG) models. However, the enhancement between the M1(ΔG) and M2(ΔG) model using the parameters of the Asai group was larger than between S(ΔG) and M1(ΔG), but the luc correlation between M1(ΔG) and M2(ΔG) using the Znosko group’s parameters was smaller compared to that between S(ΔG) and M1(ΔG), indicating the Asai I:C parameters were similar to the non-I:C parameters shown in ). Overall, the confirmed contribution from the 5´-terminus, central, and 3´-terminus region enabled M3(ΔG) and M3(Tm) to exhibit the highest luc correlation in A-type miRNAs. M3(ΔG) commonly exhibited the greatest predictive performance in I-type miRNAs using either of the I:C parameters. A significant contribution of the 3´-mid region was not confirmed because all M4 exhibited slightly reduced luc correlations than M3 in all A- and I-type miRNAs. This observation is in accordance with the results of the model validation through random sampling, where a decline of V-correlation from at M4 models was constantly observed (, E, H), and indicated that machine learning procedure may be feasible for prediction of miRNA silencing activity even when the sample size is not so large. Overall, M3 models could serve as the refined-miScore with the highest predictive power.
3. Discussion
3.1. A refined strategy adopted for the construction of refined-miScore
In this study, miScore was rebuilt using a refined methodology to allow for higher predictive power and credibility. Thermodynamic parameters for miRNA secondary structures were not taken into consideration in previous-miScore. Because secondary structures play indispensable roles in AGO loading and slicer-independent unwinding of miRNAs [Citation17], the thermodynamic properties of miRNA secondary structures were included in this study. Furthermore, the thermodynamic parameters of wobble base pairing were also updated for higher precision in estimating the thermodynamic properties of miRNAs.
The 5ʹ-terminus region (miTm1–5) in the miRNA duplex bearing the highest luc correlation was chosen for the construction of previous-miScore. In this study, a repeated random sampling procedure was adopted to simultaneously capture multiple contributive regions in the miRNA duplex. Then the substantial contribution of each region was verified over 1000 randomly sampled datasets, which greatly increased the statistical significance. In the end, four regions that may be responsible for silencing activity in the miRNA duplex were characterized and subjected to further investigations.
In the subsequent machine learning process, random k values were assigned to each predetermined region to examine whether the selected regions have the potential to enhance the luc correlation (i.e., the predictive power) of the tested miScore regression models. When all miRNAs were randomly divided into training data (n = 14) and validation data (n = 7), all four regions in the miRNA duplex had the potential to enhance T-correlations of M1–4 across the training data. However, a decline in V-correlations was observed at M4, suggesting that it may not be ideal to include the 3´-mid region in the model due to the overfitting feature of the M4 model. Then the most frequently occurring k value was assigned to the corresponding region to finalize the model construction.
In the subsequent model validation using additional A- and I-type miRNA data, contributions from the 5´-terminus, central, and 3´-terminus regions were successfully validated using ΔG and Tm models in A-type miRNAs and using ΔG models in I-type miRNAs. Because M1 models only integrated the seed–target duplex and 5´-terminus region of the miRNA duplex as described in previous-miScore, they were considered the ‘reconstructed’ previous-miScore. Provided that M3 models constantly exhibited the best predictive performance and showed better performance than M1 models, M3(Tm) and M3(ΔG) could serve as the refined-miScore to estimate the miRNA-mediated silencing efficacy of both wild-type and A-to-I edited miRNAs with greatly enhanced predictive performance compared to previous-miScore (, F). Thus, both M3(Tm) and M3(ΔG) models most accurately predict the miRNA-mediated silencing efficacies, and the robust refined-miScore is assumed to be shown as the following formula:
Refined-miScores (ΔG) of all human miRNAs registered in miRBase were calculated and are shown in Supplemental Table S1. Because the refined-miScore was established using miRNAs with Us or As at the 5´-ends, the silencing efficacies of those with Gs or Cs may not be accurately predicted.
3.2. The regulatory machinery responsible for miRNA silencing efficacy revealed by refined-miScore
In addition to the seed–target duplex region, the 5´-terminus (guide positions 1–4), central (guide positions 6–14), and 3´-terminus (passenger position 4*–1*) regions were found to play a role in regulating miRNA-mediated silencing efficacy. The newly constructed Tm and ΔG models are positive and negative indicators of thermodynamic stability, respectively. A high melting temperature indicates a thermodynamically stable RNA structure with strong base pairing that requires a high temperature to separate the two miRNA strands. Conversely, a low ΔG indicates a stable RNA structure, where a low energy level can be reached upon duplex formation. Therefore, Tm and ΔG models of the refined-miScore suggests common thermodynamic regulation of miRNA-mediated silencing efficacy. Strong miRNA-mediated silencing is expected for a miRNA duplex with a thermodynamically stable seed–target duplex and an unstable 5´-terminus, a stable 3´-terminus, and a stable central region in the miRNA duplex ().
Figure 7. An updated thermodynamic regulatory machinery of miRNA-mediated silencing based on the refined-miScore. In miRNA-mediated gene silencing, authentic miRNA duplex with a thermodynamically stable central (guide position 6–14) structure is preferably loaded onto AGO protein and subsequently unwind from the thermodynamically unstable 5´-end. A thermodynamically stable 3´-end would reinforce the thermodynamic asymmetry thus facilitate unwinding from the less stable 5´-end. The remaining guide strand (red) recognizes its mRNA targets (black) through base pairing across 2–8 nt of the 5´-termini while the passenger strand (grey) is discarded. Silencing efficacy of wild-type and A-to-I edited miRNAs can be predicted by the robust refined-miScore models constructed in this study (a lower score indicates higher silencing efficacy). Thermodynamically stable region = red box; thermodynamically unstable region = blue box.
This discovery is consistent with the previous-miScore formula, where a stable seed–target duplex and an unstable 5´-terminus region in the miRNA duplex promotes efficient miRNA-mediated silencing [Citation17]. Because the thermodynamic stability of the seed–target duplex region is strongly correlated with thermodynamic stability of the siRNA off-target effect [Citation18], it is considered a positive factor promoting strong seed-matched silencing effects in both siRNA-off target effects and miRNA-mediated silencing. Because the structural feature is a hallmark for the differentiated loading and unwinding machinery of siRNAs and miRNAs on the AGO protein [Citation14], the structural features of the miRNA duplex were successfully incorporated in the current study.
In addition to the previously discovered 5´-terminus regions of guide strands, the previously uncalculated 3´-terminus region expands the understanding of the silencing machinery. Both miRNA duplex ends regulate silencing efficacy. Because miRNA unwinding is a passive process that does not require ATP [Citation14,Citation19,Citation20] when miRNA is loaded onto AGO, unwinding is preferentially initiated from the thermodynamically less stable end to expose the first nucleotide, preferably U or A, to be incorporated into the phosphate-binding pocket of AGO [Citation14,Citation21]. On the one hand, the miRNA strand with an unstable 5´-terminus of the presumed guide strand is favoured in the slicer-independent unwinding. On the other hand, the more stable 5´-terminus of the opposite strand (3´-terminus of the guide strand) reinforces the thermodynamic asymmetry between the duplex ends, which encourages, rather than antagonizes, the unwinding of the duplex from the less stable 5´-end.
The newly discovered thermodynamic regulation rules for miRNA duplex ends is also in agreement with the guidelines for designing highly effective siRNAs, where an A/U rich sequence and G/C rich sequence is favoured in the 5´-terminus region of the antisense (guide) strand and sense (passenger) strand, respectively [Citation5,Citation7,Citation48]. However, because including the 5´-terminus score did not improve the performance of previous-miScore in predicting the efficacy of siRNA off-target effects [Citation17] and including siRNA-like fully base-paired miR-1304, miR-5583–2, and miR-374-b impaired the predictive performance of the models constructed in the current study (result not shown), the silencing efficacy of the siRNA off-target effect seems to be solely regulated by the thermodynamic stability of the seed–target duplex [Citation18]. This can be explained by the fact that although thermodynamic asymmetry is essential in siRNA guide strand sorting when the less stable end is anchored into the phosphate-binding pocket of AGO, siRNAs undergo a slicer-dependent unwinding mechanism where cleavage of the passenger strand facilitates its dissociation [Citation13,Citation14]. Therefore, thermodynamic asymmetry is essential for the passive unwinding process from the less stable 5´-end of miRNAs, but not for siRNA cleavage [Citation6,Citation17].
In addition to the miRNA duplex ends, another confirmed region is the central region (guide positions 6–14). On the one hand, while unwinding is passive and ATP free, AGO loading of small RNAs is ATP-dependent. AGO undergoes a conformational change to accommodate bulky small RNA duplexes, mediated by the Hsc70/Hsp90 chaperone [Citation19,Citation49–Citation51]. On the other hand, AGO readily accommodates authentic miRNAs with mismatches or wobble base pairing in the central region (guide positions 8–12) [Citation19,Citation20]. In mice, 61% of miRNAs contain at least one mismatch in the central region [Citation19]. In fact, all miRNA samples used in this study contain at least one central mismatch or wobble base pairing. Therefore, we envision that, for all authentic miRNAs bearing a central mismatch that are readily loaded onto AGO, a higher miRNA-mediated silencing efficacy is expected for miRNAs with a thermodynamically stable central structure to avoid the high energy cost of the ATP-dependent AGO loading of any bulky or highly structured miRNA dulexes. The detailed silencing machinery of authentic miRNAs with central mismatches still remains unknown. Moreover, it is noted that the absolute value of k associated with the central region is around 1 (1.2 for Tm models and 1.1 for ΔG models), which suggests that the contribution of the central region could be about equal to that of the seed–target duplex. The central region provided the most significant enhancement in luc correlation, as demonstrated from M1 to M2 in both Tm and ΔG models. This observation may indicate that the AGO loading process may play an equally essential role in regulating miRNA-mediated silencing efficacy.
The 3´-mid region also exhibited luc correlation in the construction of previous-miScore (guide positions 13–16, annotated as Region B in [Citation17]), and also in the current study (3´-mid region: passenger positions 8*–4*, equivalent to guide positions 12–16). However, including the 3´-mid region in previous-miScore did not improve its performance [Citation17]. Similarly, including the 3´-mid region in M4 deteriorated its predictive performance in this study. The 3´-mid region facilitated seed–target binding by providing supplementary base pairing with the target mRNA [Citation52]. Because all psiCHECK reporters were designed as seed-matched targets in the construction of previous-miScore and in this study, the alternative targeting mode is irrelevant in explaining its exclusion in the model construction. It was also reported that similar to the 5´-terminus, mismatches in the 3´-terminus region were also favoured in the slicer-independent unwinding of the miRNA duplex [Citation14,Citation19,Citation20], which agrees with the negative luc correlation exhibited in the construction of previous-miScore construction and in this study. It was hypothesized that, although a less thermodynamically stable 3´-mid region contributes to duplex unwinding, introducing mismatches within the region may negatively affect the functional asymmetry established by miRNA duplex ends [Citation5,Citation7]. Therefore, we hypothesized that including the negative score of the 3´-mid region in the calculation of the refined-miScore may antagonize the positive contribution of its adjacent 3´-terminus region, impairing the thermodynamic asymmetry and resulting in reduced predictive performance of the refined-miScore.
3.3. Regulatory effects of Ato-I editing on miRNAs
Redirection of the target from a U-target to a C-target by A-to-I editing on the miRNA seed sequence was observed in the luc reporter assay, suggesting that A-to-I editing plays a physiological role in the regulation of gene expression in human cells (,D), Supplementary Fig. S1A,B). Because thermodynamic parameters have recently been characterized for I:C base pairing by multiple research groups, a refined-miScore formula has been established by, and validated with, a luc correlation in I-type miRNAs. However, our validation results for I-type miRNAs were 0.75 using the I:C parameters of the Znosko group and 0.70 using that of the Asai group in M3(ΔG) models, while A-type miRNAs exhibited an extremely high luc correlation up to r = 0.91 (M3[ΔG]). The lower luc correlation of I-type miRNAs may account for the low accuracy of I:C parameters or the shifted angle and distance of the glycosidic bond in I:C wobble base pairs compared to standard Watson-Crick base pairs. Even if that is the case, the refined-miScore (ΔG) may still serve as a promising tool for estimating the silencing efficacy or target redirection by A-to-I editing. On the other hand, A-to-I editing in the non-seed region may also play an essential role in regulating silencing efficacy. In this study, it was observed that A-to-I editing in the 3´-terminus region could affect the silencing efficacy of miR-455 by reinforcing the thermodynamic asymmetry between duplex ends. Future studies could investigate the regulatory effects of non-seed or central A-to-I editing in miRNAs. Because both sets of newly established ΔG values for I:C base pairing perfectly matched our refined-miScore, establishment of a whole set of complete and more precise thermodynamic parameters for inosine is highly expected for better estimation of the thermodynamics of A-to-I edited miRNAs.
4. Materials and methods
4.1. Calculation of miRNA thermodynamics
Both Tm and ΔG values were calculated for seed–target duplex and all possible regions in miRNA duplex among previously reported 21 miRNAs [Citation17], by means of the nearest-neighbour model [Citation53]. Tm values were calculated as follows.
ΔH: Sum of nearest neighbour enthalpy changes (kcal mol−1)
A: Helix initiation constant (−10.8 cal mol−1 K−1)
ΔS: Sum of nearest neighbour entropy changes (kcal mol−1 K−1)
R: Gas constant (1.987 cal deg−1 mol−1)
Ct: Total molecular concentration (100 µM)
[Na+]: Sodium ion concentration (100 mM)
The newly published nearest-neighbour parameters, enthalpy and entropy, were used for the calculation of Watson-Crick base pairing [Citation53], G:U wobble base pairing [Citation40], and for I:U wobble base pairing [Citation42]. In the previous study, an earlier published set of parameters for G:U pairing [Citation54] was used to construct previous-miScore [Citation17]. Recently multiple research groups established parameters for I:C wobble base pairing (Asai group [Citation35], Znosko group [Citation41], and Das group [Citation55]). Since the parameters of the Znosko group are refined parameters of Das group, we used the Asai and Znosko groups’ parameters in this study. Thermodynamic properties of dangling end, terminal mismatch, bulge loop, and large loop were estimated using predictive models described in Nearest-Neighbour Database (NNDB) [Citation36]. Thermodynamic properties of single mismatch [Citation37], tandem mismatch [Citation38], and 1 × 2 loop [Citation39] were estimated using a set of latest models that had not yet been used to revise NNDB.
4.2. Chemical synthesis of miRNA dulexes
RNA oligonucleotides in accord to the single strands of mature wild-type (A-type) miRNAs registered in the miRBase were chemically synthesized (Sigma and GenePharma) and subsequently annealed to form endogenous miRNA duplexes. I-type miRNAs, where adenosine was replaced with inosine at the annotated A-to-I editing sites, were also synthesized. All miRNA sequences used in this study were summarized in Supplementary Tables S2 and S3.
4.3. Construction of seed-matched luciferase reporters
All of the reporter plasmids used in this study were derived from psiCHECK-1 (Promega). Oligonucleotides with three tandem repeats of seed-matched (SM) sequence were synthesized for each presumed miRNA guide strand. For wild-type (A-type) miRNAs, psiCHECK-SM targets carrying uridine opposite to the adenosine at the A-to-I editing site of the corresponding A-type miRNA guide strand were synthesized and termed U-reporters. For I-type miRNAs, psiCHECK-SM targets carrying cytidine opposite to the inosine at the A-to-I editing site of the corresponding I-type miRNA guide strand, were synthesized and termed C-reporters. All oligonucleotides for the construction of SM reporters were synthesized with Xhol/EcoRI sticky ends and inserted into the corresponding restriction enzyme sites within 3´ UTR region of Renilla luciferase (luc) gene in psiCHECK-1, and listed in Supplementary Table S4. SM targets were then used to test the silencing efficacy of the corresponding miRNAs.
4.4. Cell culture and RNA silencing activity assay using luciferase reporter system
Human Hela cells pre-cultured at 37°C in Dulbecco’s Modified Eagle’s medium (DMEM, Invitrogen) with 10% heat-inactivated foetal bovine serum (FBS, Sigma) were inoculated in 24-well culture plates (1.0 × 10⁵ cells ml−1 well−1) 24 h before transfection. Annealed miRNA duplexes (5nM), SM-reporter constructs, and pGL3-control (Promega) were simultaneously transfected using Lipofectamine 2000 (Invitrogen). An siRNA called siGY441, which did not target any SM-reporter constructs, were used as an internal control. Cells were harvested 24 h after transfection, and relative luc activity (Renilla luc activity/firefly luc activity) was measured using a Dual-Luciferase Reporter Assay System (Promega). The pGL3-control encoding firefly luc acts as a control for the calculation of relative luc activity.
4.5. Determination of the regions responsible for RNA silencing through repeated random sampling
Correlation heatmaps were generated using ggplot2 (ver. 3.1.0) in R Studio (ver. 1.1.456) to visualize the correlation (luc correlation) between the previously reported relative luc activities of 21 miRNAs [Citation17] and their Tm or ΔG values over seed-target duplex and across all possible miRNA duplex regions, incorporating previously ignored thermodynamic parameters. A repeated sampling process was adopted to determine the statistically significant start and end positions of each region. In each sampling cycle, 14 out of 21 miRNAs were randomly sampled (116,280 possible combinations in total). Among the selected samples, start (x) and end (y) positions of each of top 5–10 miRNA duplex regions with the highest (most positive) luc correlations, and those with the lowest (most negative) luc correlations were recorded. In the calculation of miRNA duplex ends (guide positions 1–10 and passenger positions 10*–1*, where * indicates the position measured from 5´ end of the passenger strand), miRNA duplex regions with the top 5 highest luc correlations, and those with the top 5 lowest luc correlations were recorded. In the calculation of the whole miRNA duplex region (guide positions 1–19), miRNA duplex regions with the top 10 highest luc correlations, and those with the top 10 lowest luc correlations were recorded. The sampling process was repeated 1000 times, generating 5000 pairwise x-y of duplex regions with the most positive luc correlation, and 5000 pairwise x-y with the most negative luc correlations in the calculation of miRNA duplex ends (guide positions 1–10 and passenger positions 10*–1*). Meanwhile, 10,000 pairwise x-y of duplex regions with the most positive luc correlations and 10,000 with the most negative luc correlations were generated in the calculation of miRNA duplex region (guide positions 1–19). The pseudocode for determining the contributive regions through repeated random sampling were described in Algorithm 1
Algorithm 1. Determination of the contributive regions through repeated sampling
input
A ← A 18 × 18 × 21 matrix of calculated Tm (or ΔG) values of all possible regions (miRNA duplex start position x: from guide position 1 to 18, end position y: from x+ 1 to 19) of 21 miRNAs
B ← A 21-dimensional column vector of luc activity of all 21 miRNAs
for n from 1 to 1000
k ← Random sampling: 14 integers from 1 to 21
Ak ← A [,, k]
Bk ← B [, k]
for each x from 1 to 18:
for each y fromx + 1 to 19
luc corr [x, y] ← correlation (Ak [x, y,], Bk)
end for
end for
top ← list of x and y with the highest 10 luc corr (x, y) value
btm ← list of x and y with the lowest 10 luc corr (x, y) value
topcum ← Add current top to the cumulative list topcum
btmcum ← Add current btm to the cumulative list btmcum
end for
output
topcum #A list of 10*1000 pairwise of x, y corresponds to the highest (most positive) luc corr
btmcum #A list of 10*1000 pairwise of x, y corresponds to the lowest (most negative) luc corr
Distribution of topcum and btmcum was shown in .
In the calculation of 3ʹ-termini region (x: from passenger position10*-1*), x and y with the highest (lowest) 5 luc corr were chosen.
4.6. Model construction through machine learning
In this study, the refined-miScore supposed to be built up is a linear regression model, involving Tm or ΔG values of contributive regions and their associated k values, that shows high luc correlation. In the construction process of refined-miScore calculated with Tm values (Tm model) and ΔG values (ΔG model), the contribution of the seed-target duplex region was normalized as −1 for Tm calculation and 1 for ΔG calculation, in accord to the heatmap result. Among the four regions of miRNA duplex, possibly contributed for RNA silencing activity, were determined, a data training process was adopted to determine the factor k associated with each region. In each training-validation cycle, the miRNA samples (n = 21) were randomly divided into training data (n = 14) and validation data (n = 7) (116,280 possible combinations in total). In the training data, each region of the tested model was randomly and simultaneously assigned with every possible k values ranging from −3 to 3, with an interval of 0.1. The optimal k values correspond to the highest luc correlation for the training data was recorded, and the maximized luc correlations in the training data were recorded as training luc correlations (T-correlations). The optimal k values for each region were subsequently applied to calculate the luc correlation of the tested model in validation data, and the luc correlations in the validation data were recorded as validation luc correlation (V-correlations). The training-validation cycle was repeated 1000 times in the calculation of each Tm or ΔG model, generating a list T-, V- correlations and associated optimal k sets. The pseudocode for model construction through machine learning was described in Algorithm 2
Algorithm 2. Model construction through machine learning (M4(ΔG) model as an example)
input
A ← A 21 × 5 matrix of calculated ΔG values of:
s ← column1: seed-target duplex
m ← column 2: 5ʹ-termini region of miRNA duplex
n ← column 3: central region of miRNA duplex
q ← column 4: 3ʹ-mid region of miRNA duplex,
p ← column 5: 3ʹ-termini region of miRNA duplex
of 21 miRNAs
B ← A 21-dimensional column vector of luc activity of all 21 miRNAs
for n from 1 to 1000
t ← Random sampling: 14 integers from 1 to 21 used as training index
v ← The remaining 7 integers from 1 to 21 used as validation index
At ← A[t,]
Bt ← B[t,]
Av ← A[v,]
Bv ← B[v,]
T-corrmax ← 0 #initiation
for each km from −3 to 3, step by 0.1
for each kn from −3 to 3, step by 0.1
for each kq from −3 to 3, step by 0.1
for each kp from −3 to 3, step by 0.1
k set ← column vector (1, km, kn, kq, kp) #(−1, km, kn, kq, kp) for Tm models
M4(ΔG)t ← matrix product (At, k set)
T-corr ← correlation (M4(ΔG)t, Bt)
if T-corr > T-corrmax then
T-corrmax ← T-corr
k setmax ← k set
end for
end for
end for
end for
M4(ΔG)v ← matrix product (Av, k setmax)
V-corr ← correlation (M4(ΔG)v,Bv)
T-corrcum ← Add current T-corrmax to the cumulative list T-corrcum
V-corrcum ← Add current V-corr to the cumulative list V-corrcum
k setcum ← Add current (k setmax)T to the cumulative list k setcum
end for
optimal k set ← subset of k setcum such that both T-corrmax and V-corr > 0.6
#0.7 was used as the threshold in some models as described in the result.
output
T-corrcum
V-corrcum
optimal k set
Analysis of T-corrcum and V-corrcum were shown in .
Optimal k set was shown in Fig. 4.
4.7. Model validation using an independent test data set
In order to obtain an unbiased validation from an independent test data set, WT (A-type) (n = 7) and I-type (n = 8) miRNA test samples were discussed separately. Firstly, a repeated sampling process was adopted to evaluate each constructed Tm or ΔG model, performed in R Studio. In each sampling cycle, test data (n = 4) was randomly sampled, and luc correlation for each Tm or ΔG model was calculated (35 possible combinations for A-type miRNAs; 56 possible combinations for I-type miRNAs). The random sampling process was repeated for 20 times and bar plots were generated. Luc correlations for all miRNA samples of each type (A-type: n = 7; I-type: n = 8) were also calculated.
Supplemental Material
Download Zip (567.3 KB)Acknowledgments
We thank Dr. Shun Sakuraba, Dr. Junichi Iwakiri for their contribution to I:C parameters in this study before their publication. S.T. and K.U.-T. designed the study at first, and S.T., Y.K., and K.U.-T. discussed the experimental plans and the results. S.T. performed the experiments and machine learning analysis. G.T. and K.A. calculated refined miScores for all human miRNAs registered in miRBase. Y.K. and H.A. performed Tm measurement experiments of RNAs with I-C pairs, the data of which are essential for the calculation of miRNA thermodynamics. The manuscript was drafted by S.T., and S.T. and K.U.-T. completed the manuscript. All authors read and approved the final manuscript.
Disclosure statement
No potential conflict of interest was reported by the authors.
Supplementary material
Supplementary Data for this article can be accessed here.
Additional information
Funding
Related Research Data
References
- Filipowicz W. RNAi: the nuts and bolts of the RISC machine. Cell. 2005;122:17–20.
- Ha M, Kim VN. Regulation of microRNA biogenesis. Nat Rev Mol Cell Biol. 2014;15:509–524.
- Lee Y, Ahn C, Han J, et al. The nuclear RNase III Drosha initiates microRNA processing. Nature. 2003;425:415–419.
- Chendrimada TP, Gregory RI, Kumaraswamy E, et al. TRBP recruits the Dicer complex to Ago2 for microRNA processing and gene silencing. Nature. 2005;436:740–744.
- Schwarz DS, Hutvágner G, Du T, et al. Asymmetry in the assembly of the RNAi enzyme complex. Cell. 2003;115:199–208.
- Meijer HA, Smith EM, Bushell M. Regulation of miRNA strand selection: follow the leader? Biochem Soc Trans. 2014;42:1135–1140.
- Khvorova A. Reynolds A and Jayasena SD. Functional siRNAs and miRNAs exhibit strand bias. Cell. 2003;115:209–216.
- Lim LP, Lau NC, Garrett-Engele P, et al. Microarray analysis shows that some microRNAs downregulate large numbers of target mRNAs. Nature. 2005;433:769–773.
- Lewis BP. Burge CB and Bartel DP. Conserved seed pairing, often flanked by adenosines, indicates that thousands of human genes are microRNA targets. Cell. 2005;120:15–20.
- Bartel DP. MicroRNAs: target recognition and regulatory functions. Cell. 2009;136:215–233.
- Carthew RW, Sontheimer EJ. Origins and mechanisms of miRNAs and siRNAs. Cell. 2009;136:642–655.
- Burnett JC. Rossi JJ and Tiemann K. Current progress of siRNA/shRNA therapeutics in clinical trials. Biotechnol J. 2011;6:1130–1146.
- Matranga C, Tomari Y, Shin C, et al. Passenger-strand cleavage facilitates assembly of siRNA into Ago2-containing RNAi enzyme complexes. Cell. 2005;123:607–620.
- Betancur JG. Yoda M and Tomari Y. miRNA-like duplexes as RNAi triggers with improved specificity. Front Genet. 2012;3:127.
- Jackson AL, Burchard J, Schelter J, et al. Widespread siRNA “off-target” transcript silencing mediated by seed region sequence complementarity. RNA. 2006;12:1179–1187.
- Acunzo M, Romano G, Nigita G, et al. Selective targeting of point-mutated KRAS through artificial microRNAs. Proc Nat Acad Sci. 2017;114:E4203–E4212.
- Hibio N, Hino K, Shimizu E, et al. Stability of miRNA 5′ terminal and seed regions is correlated with experimentally observed miRNA-mediated silencing efficacy. Sci Rep. 2012;2:996.
- Ui-Tei K, Naito Y, Nishi K, et al. Thermodynamic stability and Watson–crick base pairing in the seed duplex are major determinants of the efficiency of the siRNA-based off-target effect. Nucleic Acids Res. 2008;36:7100–7109.
- Kawamata T. Seitz H and Tomari Y. Structural determinants of miRNAs for RISC loading and slicer-independent unwinding. Nat Struct Mol Biol. 2009;16:953–960.
- Yoda M, Kawamata T, Paroo Z, et al. ATP-dependent human RISC assembly pathways. Nat Struct Mol Biol. 2010;17:17–23.
- Frank F. Sonenberg N and Nagar B. Structural basis for 5′-nucleotide base-specific recognition of guide RNA by human AGO2. Nature. 2010;465:818–822.
- Nishikura K. A-to-I editing of coding and non-coding RNAs by ADARs. Nat Rev Mol Cell Biol. 2016;17:83–96.
- Hoopengardner B, Bhalla T, Staber C, et al. Nervous system targets of RNA editing identified by comparative genomics. Science. 2003;301:832–836.
- Ohlson J, Pedersen JS, Haussler D, et al. Editing modifies the GABAA receptor subunit α3. RNA. 2007;13:698–703.
- Higuchi M, Single FN, Köhler M, et al. RNA editing of AMPA receptor subunit GluR-B: a base-paired intron-exon structure determines position and efficiency. Cell. 1993;75:1361–1370.
- Li JB, Levanon EY, Yoon J-K, et al. Genome-wide identification of human RNA editing sites by parallel DNA capturing and sequencing. Science. 2009;324:1210–1213.
- Bahn JH, Lee J-H, Li G, et al. Accurate identification of A-to-I RNA editing in human by transcriptome sequencing. Genome Res. 2012;22:142–150.
- Peng Z, Cheng Y, Tan BC-M, et al. Comprehensive analysis of RNA-Seq data reveals extensive RNA editing in a human transcriptome. Nat Biotechnol. 2012;30:253–260.
- Ramaswami G, Lin W, Piskol R, et al. Accurate identification of human Alu and non-Alu RNA editing sites. Nat Methods. 2012;9:579–581.
- Nigita G. Veneziano D and Ferro A. A-to-I RNA editing: current knowledge sources and computational approaches with special emphasis on non-coding RNA molecules. Front Bioeng Biotechnol. 2015;3:37.
- Paul D, Sinha AN, Ray A, et al. A-to-I editing in human miRNAs is enriched in seed sequence, influenced by sequence contexts and significantly hypoedited in glioblastoma multiforme. Sci Rep. 2017;7:2466.
- Ishiguro S, Galipon J, Ishii R, et al. Base-pairing probability in the microRNA stem region affects the binding and editing specificity of human A-to-I editing enzymes ADAR1-p110 and ADAR2. RNA Biol. 2018;15:976–989.
- Kume H, Hino K, Galipon J, et al. A-to-I editing in the miRNA seed region regulates target mRNA selection and silencing efficiency. Nucleic Acids Res. 2014;42:10050–10060.
- Kawahara Y, Zinshteyn B, Sethupathy P, et al. Redirection of silencing targets by adenosine-to-inosine editing of miRNAs. Science. 2007;315:1137–1140.
- Sakuraba S, Iwakiri J, Hamada M, et al. Nearest-neighbor parameter for inosine-cytosine pairs through a combined experimental and computational approach. bioRxiv. 2018;454124.
- Turner DH, Mathews DH. NNDB: the nearest neighbor parameter database for predicting stability of nucleic acid secondary structure. Nucleic Acids Res. 2009;38:D280–D282.
- Davis AR, Znosko BM. Thermodynamic characterization of naturally occurring RNA single mismatches with GU nearest neighbors. Biochemistry. 2008;47:10178–10187.
- Christiansen ME, Znosko BM. Thermodynamic characterization of tandem mismatches found in naturally occurring RNA. Nucleic Acids Res. 2009;37:4696–4706.
- Badhwar J, Karri S, Cass CK, et al. Thermodynamic characterization of RNA duplexes containing naturally occurring 1 × 2 nucleotide internal loops. Biochemistry. 2007;46:14715–14724.
- Chen JL, Dishler AL, Kennedy SD, et al. Testing the nearest neighbor model for canonical RNA base pairs: revision of GU parameters. Biochemistry. 2012;51:3508–3522.
- Wright DJ. Force CR and Znosko BM. Stability of RNA duplexes containing inosine·cytosine pairs. Nucleic Acids Res. 2018;46:12099–12108.
- Wright DJ, Rice JL, Yanker DM, et al. Nearest neighbor parameters for inosine uridine pairs in RNA duplexes. Biochemistry. 2007;46:4625–4634.
- Ma J-B, Yuan Y-R, Meister G, et al. Structural basis for 5′-end-specific recognition of guide RNA by the A. fulgidus Piwi protein. Nature. 2005;434:666–670.
- Parker JS. Roe SM and Barford D. Structural insights into mRNA recognition from a PIWI domain–siRNA guide complex. Nature. 2005;434:663–666.
- Hu HY, Yan Z, Xu Y, et al. Sequence features associated with microRNA strand selection in humans and flies. BMC Genomics. 2009;10:413.
- Ghildiyal M, Seitz H, Horwich MD, et al. Endogenous siRNAs derived from transposons and mRNAs in Drosophila somatic cells. Science. 2008;320:1077–1081.
- Ramaswami G, Li JB. RADAR: a rigorously annotated database of A-to-I RNA editing. Nucleic Acids Res. 2013;42:D109–D113.
- Ui‐Tei K, Naito Y, Takahashi F, et al. Guidelines for the selection of highly effective siRNA sequences for mammalian and chick RNA interference. Nucleic Acids Res. 2004;32:936–948.
- Iwasaki S, Kobayashi M, Yoda M, et al. Hsc70/Hsp90 chaperone machinery mediates ATP-dependent RISC loading of small RNA duplexes. Mol Cell. 2010;39:292–299.
- Iki T, Yoshikawa M, Nishikiori M, et al. In vitro assembly of plant RNA-induced silencing complexes facilitated by molecular chaperone HSP90. Mol Cell. 2010;39:282–291.
- Miyoshi T, Takeuchi A, Siomi H, et al. A direct role for Hsp90 in pre-RISC formation in Drosophila. Nat Struct Mol Biol. 2010;17:1024–1026.
- M Witkos T, Koscianska E, J Krzyzosiak W. Practical aspects of microRNA target prediction. Curr Mol Med. 2011;11:93–109.
- Xia T, SantaLucia J Jr, Burkard ME, et al. Thermodynamic parameters for an expanded nearest-neighbor model for formation of RNA duplexes with Watson− Crick base pairs. Biochemistry. 1998;37:14719–14735.
- Mathews DH, Sabina J, Zuker M, et al. Expanded sequence dependence of thermodynamic parameters improves prediction of RNA secondary structure. J Mol Biol. 1999;288:911–940.
- Chou F-C, Kladwang W, Kappel K, et al. Blind tests of RNA nearest-neighbor energy prediction. PNAS. 2016;113:8430–8435.