
ABSTRACT
RNA interference (RNAi) refers to a conserved posttranscriptional mechanism for the degradation of RNA by short dsRNAs. A genome-wide analysis of mRNAs that are complementary to RNAs of variable length that are transcribed from the full transcriptome and susceptible to being loaded onto Argonaute type 2 was performed through computational searches in the Drosophila model. We report the segments of RNAs that are complementary to mRNAs originating from introns, the exons of mRNAs and lncRNAs as a potential source of siRNAs. A full catalogue of the mRNAs that fulfill these criteria is presented, along with the quantification of multiple annealing. The catalogue was assessed for biological validation using three published lists: two for Ago2-associated RNAs and one for dsRNAs isolated from a crude extract. A broad spectrum of mRNAs were found to theoretically form intermolecular segmental dsRNAs, which should qualify them as Dicer/Ago2 substrates if they exist in vivo. These results suggest a genome-wide scale of mRNA homoeostasis via RNAi metabolism and could extend the known roles of canonical miRNAs and hairpin RNAs. The distribution of the genes for which transcripts are engaged in intermolecular segmental pairing is largely lacking in the gene collections defined as showing no expression in each individual developmental stage from early embryos to adulthood. This trend was also observed for the genes showing very low expression from the 8-12-hour embryonic to larval stage 2. This situation was also suggested by the 3 lists generated with minimal 20-, 25- and 30-base pairing lengths.
Introduction
Enzymes belonging to the RNase III family cleave dsRNAs of diverse origins, including lncRNAs whose secondary structures form hairpin dsRNAs, linear dsRNAs originating from mRNAs, invading viral dsRNAs and hairpin miRNA precursors [Citation1]. These dsRNAs are found predominantly in the cytoplasm of all eukaryotic cells. In Drosophila, two isoforms, Dicer-1 and Dicer-2, cleave dsRNAs for RNAi. Dicer-1 is known to act specifically during the maturation of microRNAs, whereas Dicer-2 acts on endogenous genes and exogenous RNAs produced by pathogens [Citation2,Citation3]. Dicer-2, which is the focus of our studies, fixes the 3ʹ extremities of the helical ends of dsRNAs, exhibiting a preference for a two-base 3ʹ overhang, and triggers cleavage at a distance of 21 to 23 nucleotides, thus generating 3ʹOH short interfering RNAs (siRNAs) [Citation4–Citation6]. Dicer-2 proteins possess a conserved catalytic domain similar to that of RNase III, an N-terminal ATPase/helicase domain, and a dsRNA-binding PAZ domain that binds the dsRNA 3ʹ overhang [Citation5,Citation6]. However, dsRNAs with a two-base overhang at the 3ʹ or 5ʹ end as well as those with blunt 3ʹ or 5ʹ ends seem to yield indistinct cleavage products, likely with different kinetics [Citation5,Citation6]. As expected, Dicer-2 fails to cleave ligated circular dsRNA substrates. Furthermore, a mixture of product sizes is usually obtained from unique substrates, indicating the presence of alternative cleavage sites [Citation7]. These observations suggest that there is elasticity and plasticity in the cleavage process of Dicer-2, which has been verified for some heterologs, such as Dicer of G. intestinalis [Citation5,Citation6]. Remarkably, this enzyme is also capable of cleaving within the single-stranded RNA adjacent and contiguous to the double-stranded region [Citation8]. Cleavage within the 3ʹ single-stranded RNA overhang by a closely related RNase in E. coli has been shown to occur at 3, 5 and 7 nucleotides from the extremity of the dsRNA segment [Citation8,Citation9]. These biochemical characteristics show that Dicer-2 is an enzyme capable of generating endo-siRNAs from a complex mixture of RNA duplexes, including long mRNAs that anneal discontinuously with short pieces of complementary RNA. Finally, as Dicer-1 is loaded onto Ago1, Dicer-2 participates in loading the final siRNAs into multiprotein RNA-induced silencing complexes referred to as RISC-Ago2 complexes. These findings highlight specialized pathways for the cleavage of transcripts by Ago1 and Ago2 guided by microRNAs and endo-siRNAs, respectively [Citation10]. However, Ago1 and Ago2 do not operate exclusively in one category or the other, as clear-cut selection is not observed [Citation3,Citation10]. The high diversity of single-stranded RNases and the ability of Dicer-2 to cleave paired sequences at multiple sites support the presence of an extensive catalogue of endo-siRNAs in living organisms. We attempted to document the evidence for the hypothesis that Dicer-2-dependent endo-siRNA loading on RISC-Ago2 might be fuelled by an extremely diverse source of RNA duplexes, thus ultimately participating in the fine regulation of a broad spectrum of mRNAs. In support of this hypothesis, a few reports have shown that some mRNAs act as substrates for the Dicer-2/Ago2 machinery after annealing with complementary RNAs [Citation2,Citation10–Citation12]. More than 70% of the coding genes present in lower eukaryotic organisms overlap with antisense genes, potentially constituting a large source of dsRNAs, despite the discrepancy in their levels of expression [Citation13]. Antisense RNAs can be transcribed from cis or trans position in genome. In cis, antisense RNAs are located at the same locus as the target gene but on the opposite strand. The gene sequences may partially overlap with matches in the 3ʹ or 5ʹ segments [Citation11–Citation16]. In trans, the genomic units that provide antisense RNAs are located at a distant position on the same chromosome or even on other chromosomes [Citation14–Citation16]. All of these topological elements converge to produce dsRNAs that consist of combinations of different RNAs. In flies in comparison with mammals, many more genetic loci contain overlapping genes on both strands, and the very large potential of this source of endo-siRNAs is understudied [Citation5]. In plants, the production of endo-siRNAs may be associated with a sophisticated regulatory process, such as the production of cis sense/antisense RNAs from overlapping gene sequences in which one strand is constitutively expressed and the other strand is inducible by developmental cues or stress [Citation17]. The silencing mechanism orchestrated by Dicer-2/Ago2, which relies on the production of endo-siRNAs, is unlikely to be exclusively used to silence genes via transcript degradation. For instance, if some dsRNA hybridization occurs across an exon-intron border inside the nucleus, splicing to generate mature RNA could be compromised [Citation18]. Similarly, dsRNAs that form in the middle of large introns should alter the recursive and nested splicing that occurs via a few steps in invertebrates and prokaryotes [Citation19,Citation20]. Therefore, Dicer, which has been shown to be present in the nucleus (although to a lesser degree than in the cytoplasm), could potentially produce endo-siRNAs within the nucleus that act as local players in the epigenetic regulation of heterochromatin and genes [Citation21]. The potential roles of large-scale dsRNA populations in development, RNA homoeostasis, RNA metabolism and responses to stress have been little explored. The purpose of this study was to conduct a genome-wide analysis of mRNAs that hybridize to segmental complementary RNAs of variable length derived from the full transcriptome (excluding intramolecular hybridization, which was found at very low levels). Segmental pieces of RNAs that originate from introns, exons and lncRNAs were computationally searched as a potential source of one strand of a collection of theoretical siRNAs, the complementary strand being any segment of mRNA. We therefore considered perfect complementarity of mRNAs with any piece of RNA of variable length generated by the transcriptome metabolism, assuming that the formed duplexes are potential Dicer-2 substrates. Our analysis, along with other published works, confirms that the catalogue of substrates for Dicer-2/Ago2 activity is far more complex and extensive than previously thought and that it encompasses a larger-than-expected proportion of mRNAs. The observation that more than 40% of endo-siRNAs map to mRNAs in S2 cells derived from Drosophila [Citation22,Citation23] strongly suggests that mRNAs are an as yet largely underdocumented source supplying the RISC-Ago2 machinery. In the past, authors have reported that small RNAs bound to Ago2 are significantly enriched in the overlapping regions of cis-natural antisense RNAs, in coding sequences and in transposable elements [Citation22]. Moreover, the sequencing of RNAs obtained from Ago2 immunoprecipitates of Drosophila S2 cells and ovaries has shown the unexpected importance of intronic sequences [Citation23]. More recently, a study showed the extensive presence of dsRNAs in the Drosophila transcriptome [Citation24]. In this resource study, high-throughput sequencing of pieces of double-stranded RNA and single-stranded RNA retrieved from Drosophila m. and Caenorhabditis e. transcriptomes was performed in parallel [Citation24]. Briefly, total RNA was extracted and then treated with a single-strand-specific ribonuclease (RNase I) for the dsRNA library and a double-strand-specific ribonuclease (RNase V1) for the ssRNA library. Amazingly, the dsRNA and ssRNA procedures allowed the authors to retrieve a similar number of reads (approximately 20 million), which highlights the existence of an unexpectedly large quantity of RNA duplexes in living organisms. These datasets reveal that dsRNAs are abundantly present in extracts in which the miRNA and lncRNA populations appear as a minority component. dsRNAs were found to encompass a significant mRNA component (up to 15% of the total dsRNAs) that the authors presented as secondary structures generated by intra-RNA folding. This study does not interrogate the possibility of hybrid pairing such as mRNA/lncRNA, mRNA/miRNA or rRNA/mRNA pairing or interpairing between two distinct mRNAs. However, this study highlights the extensive existence of dsRNAs that extend far beyond the expected boundaries of miRNA and lncRNA folding into segmental intra-secondary structures. This study revealed the reality of an important component of segmental dsRNAs, although the origin of each strand of the duplex was not investigated.
In this report, we present data showing that a large number of computationally identified dsRNA, consisting of introns/exons, lncRNAs/exons and exons/exons, a portion of which were found to be physically associated with Ago2, are valid substrates for Dicer-2 and, consequently, may represent an extension of already known endogenous siRNAs. The proposed computational analysis produces an extensive list of mRNAs forming segmental intermolecular duplexes, followed by an analysis of the statistical significance of their presence in messenger collections corresponding to different developmental stages from early embryos to adulthood. Three categories of mRNAs: the ‘not expressed’, the ‘very low expression’ and in some extent the
‘very high expressed’ in each stage from the early embryo stage to adulthood, were greatly underrepresented in our lists. The p-values highlight a strong discriminative distribution of these sub populations of genes. In contrast, the lists of moderately to highly expressed genes retrieved from different developmental stages were abundant in our lists, indicating that the presence of these concerned genes have a uniform distribution between the two list terms.
Results
General scheme of the study
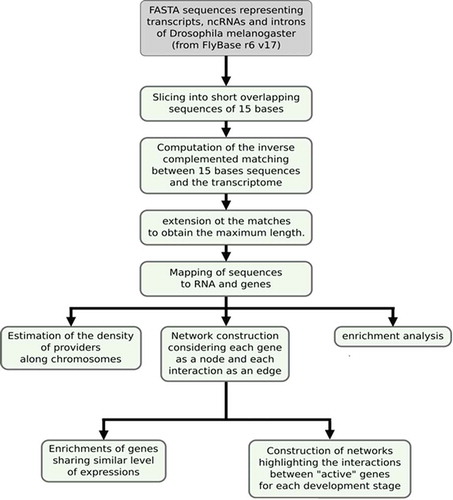
The successive steps of the analysis are presented in to highlight the order of computational searching. Briefly, starting from FASTA sequences available from the FlyBase public resource, we performed enrichment analysis and network construction according to theoretical RNA annealing at the transcriptome-wide scale. The list of genes potentially engaged in base pairing over a 20 nt length is reported in Supplemental S1, along with the number of different matches in other genes for each candidate. Two other lists with minimal 25 nt and 30 nt lengths of pairing were comparatively analysed.
Figure 1. Workflow of the pipeline used to process the data. This workflow was used for the analysis of theoretical 20-, 25- and 30-base pairing lengths between mRNAs and transcriptomes (restrictively limited to exons, introns and lncRNAs).
Computational genome-wide analysis of dsRNA lists
Considering perfect base pairing over a length of at least 20 bases, we computationally localized 4,260 distinct sequences between lncRNAs and mRNAs (Supplemental dataset S2), 21,215 between different mRNAs (Supplemental dataset S3) and 98,057 between introns and mRNAs (Supplemental dataset S4). Intra-base pairing within the same molecule was excluded because we observed that this situation accounted for only a marginal amount of total pairing. Overall, among 17,737 total genes identified by FlyBase, we identified 9,426 genes whose transcripts were theoretically complementary to a segmental strand originating from another RNA. Enumeration of the RNAs in each category indicated that 898 lncRNAs, 5355 mRNAs and 4062 introns were the sources of one strand of the endo-siRNAs, with the other strand coming from mRNAs. Conversely, lncRNAs were targeted by 1236 different mRNAs and introns by 7316 mRNAs. We further investigated our computationally established lists by analysing the length of exact base pairing between RNA species sequences. The distribution of match lengths is shown in . For the mRNA/mRNA matches, the predominant range of annealing was between 20 and 250 bases. The predominant range for intron/mRNA and ncRNA/mRNA annealing was between 20 and 500 bases (). The distribution of the number of targets (mRNAs) by provider (introns, mRNAs and ncRNAs) is shown in , along with, conversely, the number of providers of each RNA category by mRNA target. We noted that the intron category provided the greatest number of molecules matching different mRNAs (). In summary, few molecules matched multiple or very large numbers of RNAs independent of the configuration of the paired provider/target. Conversely, most of the RNA candidates that provided one strand in the endo-siRNA collection matched only one or two other RNA molecules, arguing in favour of strict restriction of interacting genes in cases where biological relevance exists (). These theoretical possibilities give rise to the possibility of a putative extended base pairing process depending on the synchronization of transcription and the respective quantities of the two duplexing/annealing RNA molecules, although the mutual expression of many theoretical copairing RNAs will not occur in specialized cells. Indeed, it is biologically probable that in such a large list, many random transcripts will fail to encounter a complementary sequence due to dilution, embedding and protection in RNA/protein complex structures. Moreover, the potentially generated dsRNAs have to accumulate to a critical concentration that is in phase with their binding affinity to Ago proteins, which again likely excludes many theoretical possibilities. Our list contains approximately 53% of the Drosophila genes considering a minimal pairing length of 20 bases. We decided to re-analyse the transcriptome with the criteria of 25- and 30-base pairing due to conflicting reports regarding the minimal length of dsRNA for Dicer activity (for details, see materials and method section: Identification of potential double-stranded RNA fragments). For the 25 base length, we computationally localized 2,812 distinct sequences presenting base pairing between lncRNAs and mRNAs, 8,837 between different mRNAs and 35,702 between introns and mRNAs. For the 30 base length, these numbers decreased to 2,627 matches for lncRNAs/mRNAs, 8,052 matches between mRNAs and finally 25,486 matches for introns/mRNAs. The distribution of the number of targets by provider regarding pairing with 25 and 30 base lengths is shown in Overall, the number of genes whose transcripts were theoretically complementary to a segmental strand from another RNA decreased to 4,495 considering perfect matches of at least 25 bases (28% of the Drosophila genes) and 4,373 considering a minimum of 30-base pairing (25% of the Drosophila genes).
Figure 2. Distribution of match lengths in RNA provider/target pairs for mRNAs, introns and lncRNA providers. Each individual mRNA in the NCBI full transcriptome list was searched for a match over 20 bases in length with any other RNA species (excluding self-pairing). MicroRNAs were excluded from the analysis. Three categories of RNA (full-length mRNAs (A), introns (B) and lncRNAs (C)) were analysed as possible providers of one segmental strand in relation to their matching lengths.
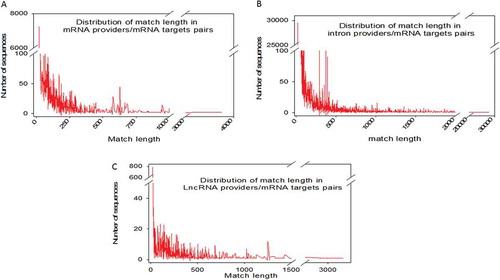
Figure 3. Distribution of computationally identified dsRNAs The duplex RNAs were analysed as the number of targets (mRNAs) by provider and as the number of providers (lncRNA, mRNA and introns) by target (mRNA). For each of our computationally generated lists, we counted the number of individual target mRNAs that matched 1 to x different providers; the figure shows the series from 1 to x for lncRNAs (A), mRNAs (B) and introns (C). Conversely, we counted how many unique providers of lncRNAs (D), mRNAs (E) and introns (F) matched a series of 1 to x different mRNA targets. A higher magnification of the distribution of the lowest values is presented in a box for the intron/mRNA graph.
Figure 4. Distribution of computationally identified dsRNAs considering minimum perfect base pairing lengths of 25 and 30 bases. The duplex RNAs were analysed as the number of targets (mRNAs) by provider and the number of providers (LncRNA, mRNA and introns) by target (mRNA). For each of our computationally generated lists, we counted the number of individual target mRNAs that matched 1 to x different providers; the figure shows the series for lncRNAs (left), mRNAs (centre) and introns (right). Counts corresponding to exact matches of at least 25 and 30 bases are presented at the top and bottom, respectively. A high-magnification zoom showing the details of the distribution of the lowest values is presented for the intron/mRNA analysis.
Chromosomal mapping of RNA providers engaged in theoretical dsRNA
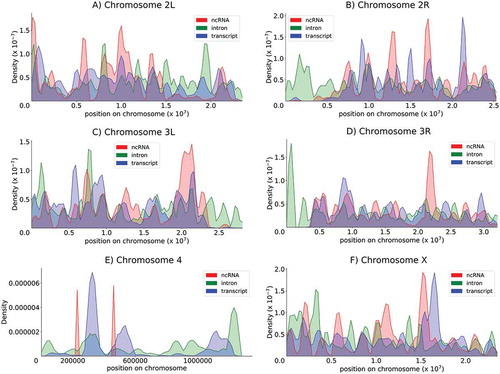
To better characterize the topology of the RNA providers (introns, mRNAs and lncRNAs), we performed full chromosomal mapping of these sequences according to the 20 base length. Globally, the distribution was not found to be uniform for any category of RNA providers and presented a clearly alternating succession of hot and weak spots. Although the three categories of RNA providers presented distinct density zones (this was striking for chromosome 4), the profiles overlapped, mainly on chromosomes X, 2 and 3 (). The full collection of identified genes in the Drosophila genome (16,422) was equally and uniformly distributed along the chromosomes at the macroscopic scale, whereas higher and lower densities appeared only at high magnification based on a unit length of one million bases. These characteristics were not observed for the three RNA provider lists mapped to discriminatory zones, in contrast with the uniform distribution of genes. Ten to 15 peaks for each arm of chromosomes 2 and 3 and chromosome X were counted for the mRNA and intron provider lists. As expected based on the limited number of lnc genes, the lncRNA provider list matched a very limited area (). Overall, these findings might hint that endo-siRNAs are generated from large clusters of genes that are geographically coregulated.
Figure 5. Chromosomal distribution of provider genes The density of RNA providers (lncRNAs, introns and mRNAs) within the genome was estimated through kernel density estimation (KDE). Chromosomes 2L, 2R, 3L, 3R, 4 and X are represented. Red, green and blue indicate lncRNAs, introns and mRNAs, respectively.
Gene ontology enrichment analysis of mRNA targets engaged in theoretical dsRNAs
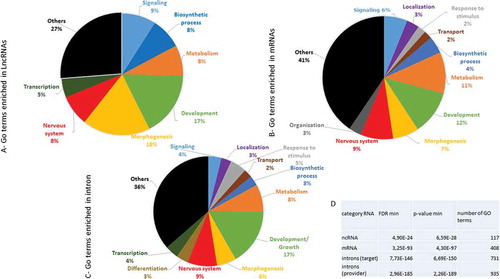
We then performed a Gene Ontology enrichment analysis with a minimal pairing length of 20 bases. The computational lists of lncRNAs, mRNAs and introns that target mRNAs showed quantitative differences in biological terms ((A–C)). An overrepresentation of numerous GO terms with very significant p-values was observed regardless of the category of RNA provider ((D)). An additional analysis showed that the intron category exhibited a more significant p-value as provider than target ()). A deeper level of GO analysis showed that genes involved in developmental processes, morphogenesis, neurogenesis and metabolism were significantly represented in the three provider lists.
Figure 6. Distribution of enriched GO terms in RNA categories that anneal with targeted mRNAs GO enrichment analysis of each category (lncRNAs (A), mRNAs (B) and introns (C)) was performed, yielding a list of overrepresented terms. The corresponding genes identified as relevant to the category terms were counted, and the assembled main terms were represented as the percentages of the total genes in circular diagrams. For each list, information on the minimal FRD and p-values found through GO enrichment analysis as well as the number of GO terms found for each class is shown in (D). The main class of RNAs, introns, was also analysed as the target.
Clustering of dsRNA-forming genes
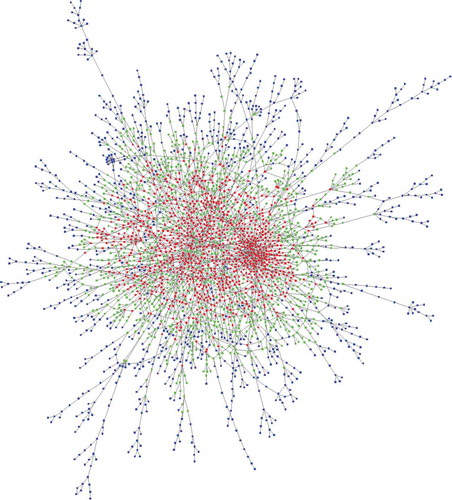
The possibility of identifying clusters of interacting genes was investigated by merging the mRNA providers and targets. Each parent gene of these mRNAs found in our theoretical list could be computationally analysed against the entire list to obtain a network model similar to the genetic and physical interaction networks depicted in several public databases. As a result, a network of 2997 interacting genes was obtained ( and Supplemental dataset S5). A Gene Ontology enrichment analysis of the genes belonging to the network and a more restrictive analysis of the red/green cloud yielded the same selected processes of development, morphogenesis and neurogenesis (Supplemental dataset S5). Interestingly, we noted that the relevance of these annotations in relation to development, morphogenesis and neurogenesis was stronger when the genes were located centrally in the graph (red cloud). Thus, for genes located in the centre of the graph (identified by red nodes in ), we counted 180 GO annotations enriched, with a false discovery rate (FDR) between 5 × 10⁻³⁴ and 10−5. For genes with slightly fewer connections, which were located at the periphery of the central genes (identified by green nodes in ), there were only 80 enriched GO annotations, with an FDR between 3 × 10⁻¹⁵ and 10−5. For the genes located in the outer layer of the graph (identified by blue nodes in ), there were simply no enriched annotations with an FDR higher than 10−5. In addition, pathway enrichment analysis (see Materials and Methods) of the same set of genes belonging to the network revealed significant enrichment of the Hippo signalling pathway with a low q-value of 9 × 10⁻⁷. Central genes in the graph were significantly related to the TGF-beta, Wnt and Jak-STAT signalling pathways, with q-values of 3 x 10⁻⁵, 2 × 10⁻⁴ and 9 x 10⁻⁴, respectively. For the 25- and 30-base-pairing lengths, the number of genes belonging to the resulting networks decreased significantly (581 and 464, respectively, for the 25- and 30-base lengths). Functional enrichment of these lists provided few significant annotations for the 25-base length and no significant annotations for the 30-base length (Supplemental dataset S6). In any case, our genome-wide analyses were static and only took into account the theoretical matches between RNA sequences.
Figure 7. Interactions among the genes in our computationally generated lists Genes retrieved from RNA datasets were considered as both targets and providers, and their interactions were represented as a network. Each of the 2997 vertices of the graph represents a gene, and each edge represents an interaction. Genes are divided into 3 categories of equal size depending on their centrality in the graph. Red vertices represent central genes, blue vertices represent genes located at the periphery of the graph, and green vertices identify the remaining genes.
dsRNA-forming genes present within the network are significantly lacking among the genes showing no/very low expression in all developmental stages
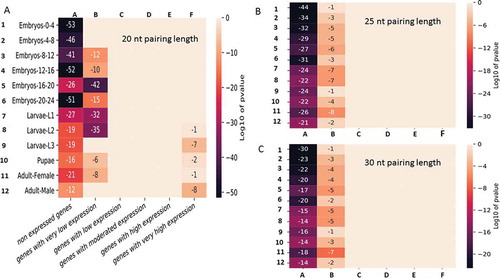
Thus, the interaction network presented above constitutes an illustration of potentialities. To obtain statistical insights, the activity levels of genes during 12 different developmental stages encompassing embryonic, larval, pupal and adult stages were analysed to highlight how the network is distributed within these genes. The expressed genes were divided into different groups according to their expression levels (see Materials and Methods). The list for a pairing length of 20 bases was first considered. The enrichment of genes sharing a similar levels of moderate to high expression showed a uniform distribution within the graph network ( and Supplemental dataset S7). In contrast, genes that were not expressed or were expressed at very low levels (and few that were highly expressed) presented completely different profiles (). These genes were located significantly outside the network, regardless of the stage of development considered. The p-value indicating the chance of randomly finding so few genes of this category within the network was extremely low (less than 10−12). The same trend was observed for weakly expressed genes, although it was less pronounced. The lists for pairing lengths of 25 and 30 bases were equally tested for comparison, and the general pattern of the heatmaps was highly similar. The pattern of p-values calculated for the 3 pairing modes confirmed the exclusion of the non-expressed and the very low expression gene categories from the network. The only exception was that the 20-base length list restrictively excluded the most highly expressed genes in the later stages of development (larvae-L3, pupae and adult males) (). In conclusion, genes showing no/very low expression in early developmental stages and, to a lesser extent, in larvae and adulthood appeared to be significantly lacking and/or underrepresented within the duplexing RNA network with impressive p-values.
Figure 8. Enrichment of dsRNA-encoding genes among the genes expressed in 12 developmental stages of Drosophila melanogaster. For each development stage, the genes were grouped into 6 different categories according to their expression levels (see Materials and Methods). The p-values displayed in the figure represent the random statistical chance of finding genes that are present in the graph network illustrated in within each sub category. A, B and C represent the interaction networks obtained by considering pairing lengths of 20, 25 and 30 bases, respectively.
We also performed the same analysis in parallel with the filtered lists restrained to only the coexpressed genes for each developmental stage. The purpose was to narrow down the interacting genes and eliminate theoretical hybridization that will never occur due to cell specialization. However, in some cases the absence of expression may be the consequence of the action of Dicer/Ago, which are known to be present in the nucleus and contribute to the epigenetic regulation of gene silencing. Therefore, we can argue that the non-expressed genes could be partly a consequence of dsRNAs that are locally generated in the nucleus via the action of Dicer/Ago. Considering these arguments, to complement our findings with the full list corresponding to a pairing length of 20 bases in the genome, filtered networks of genes with complementary RNAs were built with only the coexpressed genes at each developmental stage. The results are summarized in the supplemental information, where the genes in each network as well as their GO annotations are listed (Supplemental datasets S8). For each developmental stage, the networks of interactions (by RNA pairing) showed fragmented nodes as expected and presented diffuse GO annotations encompassing a large range of functions, variable p-values dependent on the developmental stage and p-values that were always weaker than those obtained for the full genome (Supplemental Figure S1 and Supplemental dataset S8). We noticed that many GO terms were present in all the developmental stages, and when their p-values varied from one stage to another, the order from stronger to weaker p-values in each stage was apparently well conserved.
Theoretical dsRNA topologies within the transcriptome are conserved in other Drosophila species
To check the universality of our findings from Drosophila melanogaster, several other species were analysed via the same protocol, as defined in . The results are shown in . Briefly, we observed the convergence of numbers between species, which was predicted due to the very large proportion of conserved genes. The constructed networks similar to that in for Drosophila melanogaster are shown in Supplemental Figure S1. The divergence of many genes between these species, driven by a long process of separate evolution resulting of separate genetic process like recombination, insertion of elements, deletions and mutations, might cause substantial differences between these dsRNA topologies and lists. However, a restrictive analysis of the divergent families of genes, such as chemoreception genes (Gr (gustatory receptors) and Or (olfactory receptors)) and P450 genes, showed that they maintained an unchanged rate of theoretical pairing with the other conserved RNAs. This might hint that these genes have maintained their potential RNA pairing intact across Drosophila species.
Table 1. Comparison of the results obtained for several Drosophila species.
Validation of computational lists with sequenced endo-siRNAs isolated by 2ʹO methyl tagging
As a biological validation of our computations, we sought to quantify the similarities between the potential target mRNAs that we identified by calculation and the list of genes corresponding to sequenced endo-siRNAs isolated by pull-down, published in two different reports. We first compared our lists (20-base pairing) with those provided by Ghildiyal et al. [Citation22]. Of the 646 mRNAs identified in the head, including isoforms of the same genes generated from alternative start sites and precursor splicing, 527 were found in our list, corresponding to 81.58% of the head RNAs. This proportion increased to 83.55% for the mRNAs identified in S2 cells (518 out of 620). The high proportion of genes common to the two lists (computational gene lists and gene lists corresponding to endo-siRNA isolated/sequenced lists) proved that our method successfully predicted the sequences potentially associated with Ago2. As expected, the computational lists were longer than the biological datasets and were overextended. shows the distribution of the genes that were common to the two lists. However, 26% and 41% of the genes in the head and S2 cells, respectively, could not be classified as mRNA, intron or lncRNA producers according to the base pairing terms defined in our computational search, which is consistent with the known leaky specificity of Ago2. A substantial number of these genes represented non-expected precursors of microRNAs (known to be associated with Ago1) and highly abundant transposable elements that generate piwi RNAs. A few of the others were uncharacterized genes that provided intrapairing RNA sequences that were not considered in our analysis. Surprisingly, some genes failed to show any sequence complementarity, suggesting either that the 3ʹ methyl tag used for isolation in the pull-down assay was not strictly exclusive, or that some RNAs were artifactually captured by the procedure. A detailed description of the number of reads per sequence found in published high-throughput sequencing lists as well as in our computational lists is shown in . The profiles show that a few of these sequences are overextended and provide many reads, which indicates that the threshold sensitivity of the technique restrains the biological validation of the full spectrum of our computational datasets. The technical challenges that may cause weakly represented species to fall below the threshold of detection constitutes a hurdle to be overcome in order to experimentally validate our bioinformatic predictions.
Figure 9. Validation of our computationally generated lists by comparison with a published sequence dataset of isolated endo-siRNAs A comparison of the list of sequences corresponding to the isolated endo-siRNAs reported by Ghildiyal et al. and our computationally derived list of endo-siRNAs was performed. The circular diagrams show the isolated and sequenced species and those that were also found in our computational lists. The percentages of the terms associated with the genes from which the endo-siRNAs are derived are presented. (A) The distribution of genes in the sequenced species list retrieved from Drosophila S2 cells that were found in our mRNA target/provider lists; (B) the distribution of genes related to the list of RNAs retrieved from Drosophila head tissue and found in our lists. The segments marked ‘not found’ were isolated and sequenced fragments that did not conform to the terms of our computationally established lists. ‘Only’ means that the isolated sequences were found in only one computational list; ‘common’ means that the relevant isolated sequences were found in at least two computational lists.
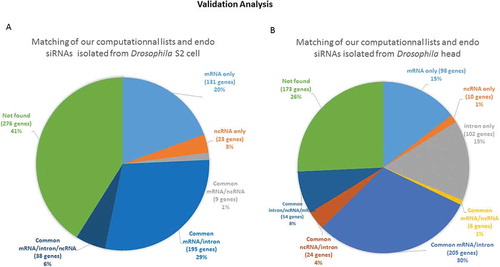
Figure 10. Distribution of the number of reads from published isolated sequences that are common to our computationally generated lists. The published sequences of 2ʹO methyl tagged RNAs were used for comparison, as in . The numbers of reads representing individual sequences in the Drosophila S2 cell list that were found in our mRNA target/provider list (A), our lncRNA provider list (B) and our intron provider list (C) were calculated. A similar analysis was performed using the sequences/reads from the Drosophila head list found in our mRNA target/provider list (D), our lncRNA list (E) and our intron provider list (F).
Validation of computational lists with sequenced endo-siRNAs isolated by immunoprecipitation
We also compared our results with the sequences of small RNAs isolated from Ago2 immunoprecipitates by Czech et al. [Citation23]. The authors collected Ago2-associated small RNAs from S2 cells and ovaries. Ago2 pull-down is assumed to select the guide RNA along with the trapped mRNA before its cleavage. To ensure that only the small RNAs were significantly represented and rule out the possibility of artifactual findings in the reported sequences a priori, we only retained the sequences found at least 50 times in both lists. Although this cut-off considerably limited the total number of different reads, we achieved a gain in accuracy. When this filter was applied, the S2 sample contained 441 sequences, and the ovarian sample contained 1637 sequences. Detailed analysis of these sequences revealed that a significant number of them corresponded to miRNAs, rRNAs or transposons that were not included in our analyses. Surprisingly, some sequences isolated from Ago2 immunoprecipitates were located in the intron or exon sequences of coding genes but presented no complementary sequences. This might suggest non-compliance with the accepted definition/properties of Ago2 or nonexclusive selection during the Ago2 loading process and, finally, some artifactual captures. These sequences included 37 of the 441 sequences (8.4%) of S2 cells and 814 of the 1637 sequences (49.7%) of ovaries (). For ovaries, the existence of RNA guides with a length shorter than 20 bases or mismatches in pairing, which were circumstances that were excluded from our calculation, might explain these discrepancies. Interestingly, all the sequences present in these lists that were found to be capable of forming dsRNAs with mRNAs were predicted by our computational searches. The data of Czech et al. also validate what we have highlighted in our datasets, namely, that dsRNAs are formed by pairing/annealing of a segment of an intron with another intron of a different gene as well as by pairing/annealing of a segment of an intron with an exon of a different gene. We note that a few sequences (more than 10 in each list) are not found in the NCBI or FlyBase transcriptomes but correspond to different intergenic localizations within the genome; this might hint that there are still a few unreported RNA species. The number of different RNA categories capable of engaging in base pairing is summarized in . Conversely, confirming the above study, some sequenced fragments whose counts were elevated are related to limited numbers of genes. Among the 185 sequences found only in mRNAs, many were located in FBgn0036509/CG7739, FBgn0036510/SCCRO, FBgn0087035/AGO2 or FBgn0001316/klarsicht. Among the 516 sequences located only in introns, a unique intron in FBgn0001316/klarsicht, which plays pivotal roles in a variety of developmental processes, was overrepresented [Citation25]. In the same way as in the above validation, the pull-down protocol likely amplifies the predominant species and conceals underrepresented species that are present at levels below the threshold of detection. However, the results of a thorough comparison argued in favour of robust interference in a broad range of coding genes that fuel Ago2-based RNA metabolism. Furthermore, our computational analysis, in parallel with the published Ago2 RNA list, implied that a small number of genes whose partial transcripts are enriched in Ago2 complexes might target a multitude of genes through endo-siRNA duplex formation.
Table 2. Distribution of the number of reads from the isolated sequences that were common to our computationally generated lists.
Sensitivity/specificity values between prediction and experimental datasets
Assuming that the vast majority of RNAs retrieved from the pull-down assays are present in our computational lists, but not vice versa, and that the pull-down sequencing retrieved the most abundant components and missed underrepresented ones, we chose to use a short computational list with a cut-off based on multiple pairings per molecule for sensitivity/specificity analysis. To improve the relevance of the comparison, we therefore only retained entries that exhibited at least 5 potential interactions with other molecules from the calculated list. After applying this filter, we obtained a list of the 4318 genes (Supplemental dataset S1). Using this filtered list, the sensitivity (number of genes computationally predicted that are found in the 2ʹO methyl pull-down list) decreased to approximately 50% (). This relatively small proportion is explained by the fact that a certain number of the reads identified by Ghildiyal et al. represent monostrands without a reverse complement in the transcriptome and, predominantly, piwi RNAs excluded from our lists. The other explanation is that the computational search led to theoretical datasets at the genome-wide scale, whereas the transcriptome of the head or S2 cells has limited dimensions. More importantly, copairing RNAs have to coexist, have to be naked to eventually hybridize and, finally, have to occur at a concentration compatible with Ago affinity to be in accordance with the biochemical principles of RNAi. The calculated specificity (number of genes not predicted to form a dsRNAs that were not found in the pull-down assays) was 72% for the two libraries (S2 cells and head). The p-value representing the probability of obtaining these results by chance was approximately 2.10−11 (). If some retrieved reads do not exhibit any direct reverse complement within the large-scale transcriptome, the zone of pairing should be adjacent or somewhere nearby on the same RNA molecule. For the isolated RNA collection using 2ʹO methyl at the 3ʹ end as a tag, the monostrand guide RNA bound to Ago2 and Ago3 should be found along with the free forms dissociated from the complex. Although the possibility that Hen1 methylates other RNA species bound to the RISC/Ago complex cannot be excluded, one assumes that any tagged RNA that is isolated and identified should come from the RISC complex. In Drosophila, Hen1 does not add a methyl group to the RNA duplex generated by Dicer and functions only as a cofactor of RISC in modifying the ssRNA bound to RISC/Ago [Citation26]. Whatever the scenario, the sequenced reads should belong to an RNA species that forms a segmental duplex. The same analysis of sensitivity/specificity was carried out for the second pull-down lists obtained by immunoprecipitation [Citation23]. The comparisons between the potentially targeted mRNAs that we identified by calculation and the list of genes corresponding to sequences identified by Czech et al. are summarized in . The sensitivity values were above 0.5, and the specificity values were approximately 0.7. The p-values are 2. 2 × 10⁻¹⁰ and 9.1 × 10⁻¹⁰ for S2 cells and ovaries, respectively. The results were in the same range as those obtained with the data of Ghildiyal et al.
Table 3. Comparisons between ds mRNAs identified by calculation and the genes corresponding to endo-siRNAs associated with Ago2 published from two different studies.
Discussion
Sense and antisense RNAs participate in epigenetic regulation
Several mechanisms for the generation of dsRNAs have been abundantly documented in a variety of biological organisms. dsRNAs produced through sense and antisense transcription are coordinately and simultaneously synthesized to potentially operate as Dicer-2 substrates. In keeping with this principle, the deletion of antisense transcripts appears to affect the functionality of sense genes and is very often associated with strong phenotypes [Citation10,Citation11]. On the other hand, the participation of antisense RNAs in the epigenetic regulation of monoallelic expression in X chromosome inactivation [Citation27,Citation28], genomic imprinting [Citation29] and allelic exclusion in lymphocytes has also been described [Citation30]. A source of dsRNA substrates for Dicer is provided by an RNA-dependent RNA polymerase in the nematode C. elegans, in which endo-siRNAs play a major role in the germline and in development [Citation3,Citation10]. The fact that inverted-repeat pseudogenes can lead to antisense transcripts that cause sense gene inhibition has been well documented in mouse oocytes [Citation31,Citation32]. When Ago, Dicer, and RNA-dependent RNA polymerase are deleted in the fission yeast Schizosaccharomyces pombe, aberrant numbers of complementary transcripts are expressed from genomic loci near the centromeric region, and an altered pattern of histone H3-K9 methylation is observed [Citation25,Citation33]. These findings support the idea that RNAi plays a role in the maintenance of heterochromatin organization [Citation33–Citation35]. In addition to their role in protein synthesis, mRNAs appear to be directly involved in the regulation of many other cell processes, such as epigenetic control, gene transcription regulation, RNA turnover and homoeostasis, chromosomal 3D organization and chromatin structuring. Endogenous RNAs (both coding and noncoding) and degradation fragments might exhibit a second function in sequestering other fragments via hybrid duplexing, thus contributing to large-scale hidden and unsuspected regulatory homoeostasis of mRNAs. This highlights the necessity of accurately identifying the segments within each RNA duplex at multiple locations with other RNAs, which might create a large-scale transcriptome interaction network. Interestingly, convergent and complementary sequences of two transcribed genes have been successfully used as a tool to silence genes of interest, leading to spatial and temporal developmental disorders in zebrafish [Citation36].
A broad spectrum of mRNAs potentially guide Dicer-2/Ago2 activity
The endo-siRNA pathway in Drosophila inhibits the expression of transposable elements; this is supported by the observation that Ago2 and Dicer-2 mutants show increased levels of TE (transposable element) expression that are associated with behavioural and developmental defects [Citation37,Citation38]. In addition, mutation of Ago2 alone has been reported to lead to the accumulation of many endo-siRNAs, including TE-siRNAs, cis-NAT(natural)-siRNAs and hairpin RNA-siRNAs [Citation39]. However, the discovery that small monostrand RNA species from precursors that lack intra-double-stranded RNA complementary sequences can be loaded onto Ago suggested that the prerequisites for loading are likely more flexible and broader than initially thought [Citation40]. However, after loading, regardless of the mode of accessibility, Ago activity is strictly dependent on the base pairing over a minimum length (approximately 20 bases) between the guide fragment and the mRNA substrate. With respect to the scope of our work, we voluntarily excluded from our analysis the miRNA category, which is already well documented in Drosophila. Similarly, piRNAs that induce the degradation of transposable element transcripts through Piwi/Aug and Ago3 according to a proposed ping-pong mechanism were not considered in this work [Citation10]. PiwiRNAs coming from transposons were found to potentially engage in hybrid duplexes with mRNAs or introns at a very limited scale. In this report, we focused on exons, introns of lncRNAs and mRNAs as the main providers of one strand of the RNA duplex and on mRNAs as the targets of the other strand. We assumed that these asymmetric base-pairing assemblages are substrates for Dicer-2 because the published biochemical characteristics of its catalytic activity confirm this scenario. lncRNAs are hairpin structures with secondary double-stranded regions within the same molecule, which permits the formation of intermolecular double-stranded structures with any other RNA molecule with which complementary pairing is possible in competition with internal pairing. On the other hand, the cleavage of lncRNAs by diverse RNases likely releases small dsRNAs that can dissociate and reassociate with their complementary RNA partners in thermodynamic equilibrium. The importance of the computationally obtained lists of exon/exon and intron/exon matches leads to the conclusion that sense/antisense RNAs of diverse origins might feed the Dicer-2/Ago2 pathway, resulting in a more complex integrated regulatory pattern of RNA metabolism. However, the dynamics and kinetics of dsRNA formation are very difficult to address in the context of a dense molecular environment. Our analysis suggests that the cellular repertoire of dsRNAs composed of fragments of different and complementary mRNAs has to date been largely underestimated. Moreover, the number of Ago proteins varies among species and does not correlate with evolution or complexity. Humans have 8 Ago proteins, C. elegans has 27, and Arabidopsis has 10 [Citation41,Citation42]. Furthermore, Ago2 has been shown to be transferred to the nucleus from the cytoplasm by an import system that involves an importin isoform [Citation43,Citation44]. This observation led to the concept that Ago proteins are able to fulfill numerous non-canonical functions, such as interactions with chromatin sites and hypothetical local roles in the cleavage of RNA precursors [Citation43,Citation44]. Finally, phosphorylated Dicer-2 has been described as an active molecule in the nucleus, which suggests that some dsRNA cleavage likely occurs within the nucleus prior to mRNA export [Citation21].
2ʹ-O-methyl modification of endo-siRNAs
Interestingly and fortunately, Drosophila endo-siRNAs are labelled by a 2ʹ-O-methyl modification at their 3ʹ ribose ends that is catalysed by the methylase Hen1, a characteristic also shared with piRNAs [Citation3,Citation22,Citation45]. This provides a very advantageous tag for their isolation. The Hen1 RNA methyltransferase from Arabidopsis thaliana catalyzes the 2ʹ-O-methylation of small double-stranded RNAs at each 3ʹ end from an S-adenosyl-L-methionine (AdoMet) precursor [Citation45]. In contrast, in Drosophila, DmHen1 is recruited to RISC complexes containing Ago2 and Ago3 to modify only the single-stranded small silencing RNAs known as the guide RNAs after the cleavage of the passenger RNA [Citation26]. The biochemistry of this molecule needs to be more deeply understood, as monostrand modification might not be strictly restricted to the RNA guide and could affect the attached mRNA in the course of and/or after cleavage. Moreover, miRNAs in Drosophila are not 2ʹO methylated at the 3ʹ ends, contrary to siRNAs and piRNAs, which proves that Hen1 is not associated with RISC/Ago1 but is exclusively associated with the RISC/Ago2 and Aubergine/Ago3 systems [Citation22,Citation26,Citation46]. A substantial proportion of the experimentally identified tagged transcripts were found in the mRNA category, in contrast to the long-standing dogma attributing guide tagged RNAs solely to piwiRNAs, lncRNAs or foreign DNA.
Confronting the siRNA pathway and our dsRNA computational lists
Regarding the sensitivity/specificity analysis for validating our computational lists, we reasoned that the identified transcripts in the experimental lists should be found in our computational list. Conversely, it is highly conceivable that many RNAs in the computational list might not be found in biological pull-down assays. Other than the level of the sensitivity of the technical procedures for sequencing rare transcripts, the main limitation resides in the total RNA extracted from organs/tissues or cells (ovaries, head and S2 cell), which express only a fraction of the genes compared to the computationally generated general list of RNA duplexes based on a genome-wide scale. The other aspect resides in the fact that many pairings identified in theory might never occur in a cell or tissue, as copairing RNAs might never come into contact because of compartmentation and insulation or might never be expressed at an appropriate concentration to bind Ago proteins. Despite these limits that distort sensitivity/specificity values, the obtained p-values were highly significant, demonstrating that the distribution is very different from the one that could result from a random outline. In support of these conclusions, the levels of mRNA targeted by the endo-siRNA pathway were shown to be elevated after the depletion of Dcr-2 or Ago2 in Drosophila [Citation37,Citation38]. We found that the theoretical duplex RNAs from the full transcriptome mostly take the form of inter-molecule pairs. Intramolecular dsRNA segments generated via folding or hairpin secondary structures were rare in our lists (less than 5% of the total consisted of intrapairing in introns or mRNA collections). Intra-molecule dsRNAs were equally rare in the experimental lists of Ago2-associated RNA collections. After reanalysis, we found that intrapairing constitutes a minor component of the published dsRNA dataset from the Drosophila total RNA extract [Citation24]. Our study reveals a strong discrepancy between lists regarding their sizes: a significant decrease between the 20 nt length list and the 25 and 30nt length lists exists whereas the sizes between 25 and 30 nt length lists are stable. This might hint to functional differences as the shorter lengths and the longer ones could possibly operate distinctly in regulatory process. Overall, this study supports the idea that a large collection of dsRNAs from multiple combinations and sources of RNA enters into the Dicer-2/Ago2-guided endo-siRNA pathway. On the other side, the absence of synchronization in the expression of transcripts that theoretically anneal with each other also obviates the possibility of generating dsRNA. Despite these restrictions, in this report, we confirm that potential short dsRNA sequences originating from mRNAs supply the RNAi biogenesis machinery.
Computational lists of dsRNAs present a strongly discriminatory distribution within categories of genes based on their level of expression
In support of the accuracy of our analytical datasets, we emphasize that an abundant literature supports the complex influence of RNA on the adaptation of organisms to environmental constraints [Citation47–Citation51]. However, the most remarkable observation resulting from our genome-wide-scale analysis was the statistically significant absence of theoretically duplexing mRNAs in the categories of genes showing no/very low expression in fly developmental stages from early embryos to adulthood. This was observed with the 3 lists corresponding to pairing lengths of 20, 25 and 30 nt. A speculative hypothesis could be that the genes showing no/very low expression exhibit a powerful silencing mechanism that makes Dicer/Ago activation useless. In contrast, the mRNAs within the dsRNA graph network were uniformly distributed in different collections of ubiquitous and moderately expressed genes regardless of the developmental stage and/or tissue. The presence of mRNAs in our graph network appears to reveal annealing criteria that exclude them from the gene populations that are characterized as showing no expression in developmental stages. A large combinatorial dsRNA matrix seems to be involved in the regulation of genes that are clustered and/or tightly integrated in networks and simultaneously controlled by multiple interacting mechanisms. Intriguingly, the GO enrichment analysis of our dsRNA lists yielded results similar to those found in another study of a population of RNAs that are capable of forming RNA-DNA triplex structures [Citation52]. The present genome-wide study of computationally inferred small dsRNA sequences in which one strand is formed by mRNA and the other is a complementary strand potentially originating from mRNAs/lncRNA/introns in cis or from separate loci in trans allowed us to build a broad-scale transcriptomic interactome.
In summary, the various possibilities for extended dialogue between the different categories of RNA (e.g., lncRNAs, smRNAs, tRNAs, introns and mRNAs) via the formation of segmental hybrid duplexes were elucidated. The aim of our report was to further explore these phenomena and to propose a comprehensive, whole-genome analysis of RNA duplex datasets presenting the potential to load and feed the Ago2 machinery. The full catalogue of RNA duplexes with a minimal length of 20 bases that was computationally searched at the whole-transcriptome scale was highly significantly correlated with the lists of RNA species that were identified in association with Ago2. This approach was validated by the finding that an equal number of reads between ssRNAs and dsRNAs were found in the total RNA extract of Drosophila, which suggests the extensive occurrence and roles of RNA duplexing in living organisms [Citation24].
Materials and methods
Identification of potential double-stranded RNA fragments
FASTA sequences representing the transcripts, ncRNAs and introns of Drosophila melanogaster were downloaded from the FlyBase FTP directory, release 6, version 17. For each FASTA entry, short overlapping sequences of 15 bases were extracted at intervals of 6 bases. This ensured that any sequence of at least 20 bases belonging to the FASTA input included at least one of the 15-base sequences. The sets of 15-base sequences corresponding to ncRNAs, introns and mRNAs represent the components of the interactions that we wish to highlight: the providers. The second component of the interaction is composed of all the mRNA sequences (the targets). We computed the matches between the set of 15-base sequences and the transcriptome with the STAR RNA-seq aligner [Citation53] by retaining only perfect matches for which the short sequence was reverse complemented. Taking into consideration the origin of the aligned sequences, we extended the matches to obtain the maximum length. We subsequently applied a second postprocessing step to eliminate duplicate alignments and to remove sequences that aligned over less than the minimum number of bases. In our experiments, we used three different cut-off values of 20, 25 and 30 bases.
The reason why the cut off of 20 bases was considered lies in the following biochemistry data: the canonical siRNA, consisting of two 19 (nt) paired strands with a 3ʹ-end overhang of 2 nt, binds Dicer and is secondarily transferred to Ago, resulting in efficient silencing of genes of interest. Authors have shown that RNAi with paired 19-mers plus a 2 nt overhang at the 3ʹ end shows a better RISC efficiency in gene silencing than homologs of paired 21-mers [Citation54,Citation55]. On the other hand, authors have demonstrated that chemically modified dimers (paired RNAs of 16 nt in length plus dTdT in the 3ʹ overhang) bind Dicer without subsequent cleavage before being transferred to Ago within the RISC complex. Some of these chemically modified RNAi sequences used for therapeutic purposes have shown a high efficiency of gene silencing [Citation54,Citation55]. These results suggest that the processed RNAi substrates of Ago require Dicer for loading, but not necessary the Dicer cleavage of a precursor. On the other hand, asymmetric RNAi with one short strand and one longer strand with extended 3ʹ and 5ʹ overhangs appears to trigger strong functional silencing, which demonstrates that Dicer might cleave the adjacent monostrand overhang [Citation55]. For example, an asymmetric interfering RNA (aiRNA) of 15 nt on one strand with 3ʹ and 5ʹ overhangs on the other strand was shown to be incorporated into the RISC complex and to mediate sequence-specific cleavage of the target mRNA [Citation56]. Therefore, we established a list in which 20 nt was the minimal pairing length, along with lists with 25- and 30-base cut-offs, of dsRNAs susceptible to binding Dicer and/or being modified by Dicer cleavage.
Estimation of the density of providers along chromosomes
For each chromosome and for each type of provider (lncRNA, intron and mRNA), we collected all the positions occupied by each provider. The density of the provider RNAs along the chromosomes was estimated through kernel density estimation (KDE), which is a nonparametric way to estimate the probability density function of a random variable. We used the Epanechnikov kernel, which is optimal in a mean square error sense [Citation57]. The data processing procedure was developed in the Python language using the Statsmodel library for KDE and the Seaborn library for figure generation.
Gene ontology enrichment analysis
GO enrichment analysis is the statistical analysis of GO term frequency differences between two sets of genes. Blast2GO was used to compute the enrichment of different lists of targets and providers [Citation58]. Fisher’s exact test was performed on all of the genes found in the different groups. For the references, we chose GO data (validation date: 01/31/2017) from GO Consortium. Blast2GO uses the FatiGO package in combination with a robust false discovery rate (FDR) correction for multiple testing (the Benjamini-Hochberg correction). This program was used to reject the incorrect sequences based on null hypotheses. For the statistical analysis, FDR and p-value filters were applied with a cut-off value of 1.10−5.
Biological pathway enrichment analysis
The biological pathways associated with the gene sets were computed using the R package PathView [Citation59]. For a given set of n genes and a specific pathway, PathView calculates the statistical significance of finding k genes belonging to that pathway among the n genes using a hypergeometric test. The result is a p-value that estimates whether a gene set is over- or underrepresented in a pathway. To take into account multiple testing, PathView computes a q-value that corresponds to the p-value adjusted for the false discovery rate (FDR). In our analysis, pathways are considered significantly enriched when their associated corrected p-value (q-value) is less than 10−3.
Network construction
Based on the potential interactions calculated between providers and targets, we mapped each mRNA to its parent gene. The obtained dataset was represented as a graph in which each vertex corresponds to a gene, and each edge represents a predicted interaction between two genes. On the basis of a perfect match of at least 20 bases, the resulting graph was composed of several connected subgraphs: a large graph containing 2997 nodes (genes) and a few dozen small graphs connecting between 2 and 5 nodes. We only retained the large graph (shown in ) for the subsequent analyses. The estimation of the centrality of a node was performed by calculating the average shortest path length connecting that node to all other nodes in the graph. This result was used to group the nodes (genes) into 3 categories of equal size, which are displayed in different colours in . For the alternative scenarios (minimum matching of 25 bases or 30 bases), we no longer obtained a large dsRNA interaction graph but generated numerous disconnected double strands interaction networks. We chose to retain all networks except those involving only two participants. Finally, we obtained networks containing 580 or 463 genes considering minimum pairing of 25 bases or 30 bases, respectively (Supplemental dataset S6 lists the genes belonging to these two networks).
Links between dsRNA pairing and transcript abundance
Data from 12 RNA-seq experiments quantifying RNA abundance in several development stages were downloaded from modENCODE [Citation60] in the SAM format. These data are identified by the following modENCODE accession numbers: 2010, 2019, 2020, 2021, 2022, 2023, 2024, 2025, 2026, 2027, 2029 and 2030. The aligned reads in SAM format were converted to FASTQ format, and their abundance was quantified with Salmon [Citation61]. For each developmental stage, genes whose measured expression levels were equal to zero were withdrawn to form a category grouping non-expressed genes. The remaining genes were divided into quintiles of equal size according to their expression values. The enrichment of the genes belonging to the interaction graph network, as illustrated in , was calculated for each group of genes and each developmental stage with the hypergeometric law and the null hypothesis of an equiprobable distribution of the genes ( and Supplemental Figure S2). The results of the same calculation performed for the dsRNA networks obtained by considering perfect matches of 25 and 30 bases are presented in Supplemental Figure S1.
We considered the lists of only coexpressed genes in each developmental stage in parallel, arguing that theoretical copairing genes might never come into contact due to the specialization of cells. In this case, for each stage of the development network, genes with low expression were independently discarded from the network (modENCODE expression RPKM1 values ranging from 0 to 10). In this case, we also retained networks involving at least 10 genes for each stage of development. The results are shown in Supplemental Figure S1 (there is no network of interacting genes containing 10 genes for the « Adult-male » development stage). The lists of genes contained in each network as well as the GO enrichment of biological processes are provided in Supplemental dataset S8.
Comparison of computational lists with sequenced endo-siRNAs isolated by pull-down
To assess the relevance of potentially targeted mRNAs that we identified by calculation, we compared them with the list of genes corresponding to sequenced endo-siRNAs isolated by pull-down by Czech et al. [Citation23] and Ghildiyal et al. [Citation22]. We calculated the following three statistical measures: sensitivity (also known as the true-positive rate), which measures the proportion of computationally predicted genes that were found in the pull-down assays; specificity (also known as the true-negative rate), which measures the proportion of genes that are not expected to form a dsRNA and were actually absent from the pull-down assays; and the p-value calculated using the hypergeometric test, which measures the statistical significance of the proportion of computationally predicted genes that were present in the pull-down assays. To improve the relevance of the comparison, we only retained from the complete list of potentially targeted mRNAs those that exhibited at least 5 potential interactions with other molecules. After applying this filter, the list contained the 4318 genes reaching this threshold of potential interactions.
Application of the analysis to other Drosophila species
The steps of our analysis pipeline (Supplemental Figure S1) leading to the construction and annotation of the dsRNA interaction network were applied to other Drosophila species. The comparisons between the species are summarized in Supplemental . Supplemental Figure S2 illustrates the topology of the resulting networks displayed next to the phylogenetic tree of Drosophila species.
Supplemental Material
Download Zip (878.6 KB)Acknowledgments
We thank our colleagues at the bioinformatic platforms, Corinne Rancuel and Martine da Rocha, for helpful discussions and expertise. We also thank Jean Jacques Rémy for sharing ideas and insights about the topic of RNA regulation. This work was supported by the ANR grant “Methylclonome” ANR-12-BSV6-006-01 to Alain Robichon and Claude Pasquier. This work was also supported by the French National Research Agency (ANR) through the LABEX SIGNALIFE program (reference # ANR-11-LABX-0028-01).
Disclosure statement
No potential conflict of interest was reported by the authors.
Supplementary Material
Supplemental data for this article can be accessed here.
Additional information
Funding
References
- Tafer H, Ameres SL, Obernosterer G, et al. The impact of target site accessibility on the design of effective siRNAs. Nat Biotechnol. 2008;26:578–583.
- Verena Hartig J, Esslinger S, Böttcher R, et al. Endo-siRNAs depend on a new isoform of loquacious and target artificially introduced, high-copy sequences. Embo J. 2009;28:2932–2944.
- Claycomb JM. Ancient endo-siRNA pathways reveal new tricks. Curr Biol. 2014;24:R703–R715.
- Hammond SM, Caudy AA, Hannon GJ. Post-transcriptional gene silencing by double-stranded RNA. Nat Rev Genet. 2001;2:110–119.
- MacRae IJ, Zhou K, Doudna JA. Structural determinants of RNA recognition and cleavage by Dicer. Nat Struct Mol Biol. 2007;14:934–940.
- MacRae IJ, Zhou K, Li F, et al. Structural basis for double-stranded RNA processing by Dicer. Science. 2006;311:195–198.
- Vermeulen A, Behlen L, Reynolds A, et al. The contributions of dsRNA structure to Dicer specificity and efficiency. RNA. 2005;11:674–682.
- Lima WF, Murray H, Nichols JG, et al. Human dicer binds short single-strand and double-strand RNA with high affinity and interacts with different regions of the nucleic acids. J Biol Chem. 2009;284:2535–2548.
- Lima WF, Crooke ST. Cleavage of single strand RNA adjacent to RNA-DNA duplex regions by Escherichia coli RNase H1. J Biol Chem. 1997;272:27513–27516.
- Okamura K, Lai EC. Endogenous small interfering RNAs in animals. Nat Rev Mol Cell Biol. 2008;9:673–678.
- Okamura K, Balla S, Martin R, et al. Two distinct mechanisms generate endogenous siRNAs from bidirectional transcription in Drosophila melanogaster. Nat Struct Mol Biol. 2008;15:581–589.
- Gullerova M, Proudfoot NJ. Convergent transcription induces transcriptional gene silencing in fission yeast and mammalian cells. Nat Struct Mol Biol. 2012;19:1193–1201.
- Zinad HS, Natasya I, Werner A. Natural antisense transcripts at the interface between host genome and mobile genetic elements. Front Microbiol. 2017;8 ( article 2292). DOI:10.3389/fmicb.2017.02292.
- Guil S, Esteller M. Cis-acting noncoding RNAs: friends and foes. Nat Struct Mol Biol. 2012;19:1068–1075.
- Zhang X, Lii Y, Wu Z, et al. Mechanisms of small RNA generation from cis-NATs in response to environmental and developmental cues. Mol Plant. 2013;6:704–715.
- Jin H, Vacic V, Girke T, et al. Small RNAs and the regulation of cis-natural antisense transcripts in Arabidopsis. BMC Mol Biol. 2008;14(9):6.
- Moldovan D, Spriggs A, Dennis ES, et al. The hunt for hypoxia responsive natural antisense short interfering RNAs. Plant Signal Behav. 2010;5:247–251.
- Wight M, Werner A. The functions of natural antisense transcripts. Essays Biochem. 2013;54:91–101.
- Burnette JM, Miyamoto-Sato E, Schaub MA, et al. Subdivision of large introns in Drosophila by recursive splicing at nonexonic elements. Genetics. 2005;170:661–674.
- Hatton AR, Subramaniam V, Lopez AJ. Generation of alternative Ultrabithorax isoforms and stepwise removal of a large intron by resplicing at exon-exon junctions. Mol Cell. 1998;2:787–796.
- Burger K, Schlackow M, Potts M, et al. Nuclear phosphorylated Dicer processes double-stranded RNA in response to DNA damage. J Cell Biol. 2017;216: 2373–2389. Sample Characteristics.
- Ghildiyal M, Seitz H, Horwich MD, et al. Endogenous siRNAs derived from transposons and mRNAs in Drosophila somatic cells. Science. 2008;320:1077–1081.
- Czech B, Malone CD, Zhou R, et al. An endogenous small interfering RNA pathway in Drosophila. Nature. 2008;453:798–802.
- Li F, Zheng Q, Ryvkin P, et al. Global analysis of RNA secondary structure in two metazoans. Cell Rep. 2012;1:69–82.
- Volpe TA, Kidner C, Hall IM, et al. Regulation of heterochromatic silencing and histone H3 lysine-9 methylation by RNAi. Science. 2002;297:1833–1837.
- Horwich MD, Li C, Matranga C, et al. The Drosophila RNA methyltransferase, DmHen1, modifies germline piRNAs and single-stranded siRNAs in RISC. Curr Biol. 2007;17:1265–1272.
- Shibata S, Lee JT. Characterization and quantitation of differential Tsix transcripts: implications for Tsix function. Hum Mol Genet. 2003;12:125–136.
- Shibata S, Lee JT. Tsix transcription- versus RNA-based mechanisms in Xist repression and epigenetic choice. Curr Biol. 2004;14:1747–1754.
- Jaenisch R, Bird A. Epigenetic regulation of gene expression: how the genome integrates intrinsic and environmental signals. Nat Genet. 2003;33(Suppl):245–254.
- Bergman Y, Cedar H. A stepwise epigenetic process controls immunoglobulin allelic exclusion. Nat Rev Immunol. 2004;4:753–761.
- Watanabe T, Totoki Y, Toyoda A, et al. Endogenous siRNAs from naturally formed dsRNAs regulate transcripts in mouse oocytes. Nature. 2008;453:539–543.
- Tam OH, Aravin AA, Stein P, et al. Pseudogene-derived small interfering RNAs regulate gene expression in mouse oocytes. Nature. 2008;453:534–538.
- Moazed D, Bühler M, Buker SM, et al. Studies on the mechanism of RNAi-dependent heterochromatin assembly. Cold Spring Harb Symp Quant Biol. 2006;71:461–471.
- Moshkovich N, Nisha P, Boyle PJ, et al. RNAi-independent role for Argonaute 2 in CTCF/CP190 chromatin insulator function. Genes Dev. 2011;25:1686–1701.
- Fagegaltier D, Bouge AL, Berry B, et al. The endogenous siRNA pathway is involved in heterochromatin formation in Drosophila. Proc Natl Acad Sci USA. 2009;106:21258–21263.
- Andrews OE, Cha DJ, Wei C, et al. RNAi-mediated gene silencing in zebrafish triggered by convergent transcription. Sci Rep. 2014;4:5222.
- Lee YS, Nakahara K, Pham JW, et al. Distinct roles for Drosophila Dicer-1 and Dicer-2 in the siRNA/miRNA silencing pathways. Cell. 2004;117:69–81.
- Okamura K, Ishizuka A, Siomi H, et al. Distinct roles for Argonaute proteins in small RNA-directed RNA cleavage pathways. Genes Dev. 2004;18:1655–1666.
- Kim K, Lee YS, Harris D, et al. The RNAi pathway initiated by Dicer-2 in Drosophila. Cold Spring Harb Symp Quant Biol. 2006;71:39–44.
- Chak LL, Okamura KA. Argonaute-dependent small RNAs derived from single-stranded, non-structured precursors. Front Genet. 2014;5 ( article172). DOI:10.3389/fgene.2014.00172.
- Hutvagner G, Simard MJ. Argonaute proteins: key players in RNA silencing. Nat Rev Mol Cell Biol. 2008;9:22–32.
- Tolia NH, Joshua-Tor L. Slicer and the argonautes. Nature Chem Biol. 2007;3:36–43.
- Taliaferro JM, Aspden JL, Bradley T, et al. Two new and distinct roles for DrosophilaArgonaute-2 in the nucleus: alternative pre-mRNA splicing and transcriptional repression. Genes Dev. 2013;27:378–389.
- Huang V, Li LC. Demystifying the nuclear function of Argonaute proteins. RNA Biol. 2014;11:18–24.
- Yang Z, Ebright YW, Yu B B, et al. HEN1 recognizes 21–24 nt small RNA duplexes and deposits a methyl group onto the 20 OH of the 30 terminal nucleotide. Nucleic Acids Res. 2006;34:667–675.
- Luteijn MJ, Ketting RF. PIWI-interacting RNAs: from generation to transgenerational epigenetics. Nat Rev Genet. 2013;14:523–534.
- Yuan C, Wang J, Harrison AP, et al. Genome-wide view of natural antisense transcripts in Arabidopsis thaliana. DNA Res. 2015;22:233–243.
- Villegas VE, Zaphiropoulos PG. Neighboring gene regulation by antisense long non-coding RNAs. Int J Mol Sci. 2015;16:3251–3266.
- Werner A, Berdal A. Natural antisense transcripts: sound or silence? Physiol Genomics. 2005;23:125–131.
- Sabin LR, Delas MJ, Hannon GJ. Dogma derailed: the many influences of RNA on the genome. Mol Cell. 2013;49:783–794.
- Xu J, Wang Q, Freeling M, et al. Natural antisense transcripts are significantly involved in regulation of drought stress in maize. Nucleic Acids Res. 2017;45:5126–5141.
- Pasquier C, Agnel S, Robichon A. The mapping of predicted triplex DNA:RNA in the Drosophila genome reveals a prominent location in development- and morphogenesis-related genes. G3 (Bethesda). 2017;7:2295–2304.
- Dobin A, Davis CA, Schlesinger F, et al. STAR: ultrafast universal RNA-seq aligner. Bioinformatics. 2013;29:15–21.
- Snead NM, Wu X, Li A, et al. Molecular basis for improved gene silencing by Dicer substrate interfering RNA compared with other siRNA variants. Nucleic Acids Res. 2013;41:6209–6221.
- Snead NM, John J, Rossi JJ. RNA interference trigger variants: getting the most out of RNA for RNA interference-based therapeutics. Nucleic Acid Ther. 2012;22:139–146.
- Sun X, Rogoff HA, Li CJ. Asymmetric RNA duplexes mediate RNA interference in mammalian cells. Nat Biotechnol. 2008;26:1379–1382.
- Epanechnikov VA. Non-parametric estimation of a multivariate probability density. Theory Probab Appl. 1967;14:153–158.
- Conesa A, Götz S, Garcia-Gomez JM, et al. Blast2GO: a universal tool for annotation, visualization and analysis in functional genomics research. Bioinformatics. 2005;21:3674–3676.
- Luo W, Brouwer C. Pathview: an R/Biocondutor package for pathway-based data integration and visualization. Bioinformatics. 2013;29:1830–1831.
- Celniker SE, Dillon LA, Gerstein MB, et al. Unlocking the secrets of the genome. Nature. 2009;459:927–930.
- Patro R, Duggal G, Love M, et al. Salmon provides fast and bias-aware quantification of transcript expression. Nat Methods. 2017;14:417–419.