
ABSTRACT
Bordetella pertussis, a strictly human re-emerging pathogen and the causative agent of whooping cough, exploits a broad variety of virulence factors to establish efficient infection. Here, we used RNA sequencing to analyse the changes in gene expression profiles of human THP-1 macrophages resulting from B. pertussis infection. In parallel, we attempted to determine the changes in intracellular B. pertussis-specific transcriptomic profiles resulting from interaction with macrophages. Our analysis revealed that global gene expression profiles in THP-1 macrophages are extensively rewired 6 h post-infection. Among the highly expressed genes, we identified those encoding cytokines, chemokines, and transcription regulators involved in the induction of the M1 and M2 macrophage polarization programmes. Notably, several host genes involved in the control of apoptosis and inflammation which are known to be hijacked by intracellular bacterial pathogens were overexpressed upon infection. Furthermore, in silico analyses identified large temporal changes in expression of specific gene subsets involved in signalling and metabolic pathways. Despite limited numbers of the bacterial reads, we observed reduced expression of majority of virulence factors and upregulation of several transcriptional regulators during infection suggesting that intracellular B. pertussis cells switch from virulent to avirulent phase and actively adapt to intracellular environment, respectively.
Introduction
Bordetella pertussis is a Gram-negative strictly human pathogen of the respiratory tract and the aetiological agent of whooping cough [Citation1]. Despite vaccination programmes, pertussis remains one of the 10 most common causes of vaccine-preventable deaths [Citation2]. Furthermore, pertussis incidence is currently on the rise in industrialized countries with highly vaccinated populations [Citation3,Citation4]. The re-emergence of pertussis strongly suggests that we need to widen our understanding of the molecular mechanisms underlying the pathogenicity of B.pertussis [Citation5,Citation6].
Upon infection, B. pertussis cells are challenged by the host innate immune system. While ciliated epithelial cells secrete mucus that mechanically eliminates the bacteria, resident as well as attracted phagocytic cells interact with the pathogen in order to clear the infection [Citation7]. Successful infection, therefore, depends on activities of a great variety of virulence factors produced by B. pertussis cells [Citation8]. In particular, adhesins such as filamentous haemagglutinin and fimbriae and toxins such as pertussis toxin and adenylate cyclase toxin contribute to efficient adhesion and colonization of the epithelium as well as to modulation of the immune system and thereby facilitate the survival of bacteria in the respiratory tract [Citation9]. B. pertussis was historically described as an extracellular pathogen, which, in the presence of specific antibodies, can be internalized and killed by phagocytic cells [Citation10]. Nevertheless, some early reports suggested that in the absence of opsonization this pathogen stimulates its own attachment to immune cells resulting in inefficient killing by phagocytes and increased intracellular survival [Citation11–Citation15]. Importantly, B. pertussis cells were found also within human, rabbit, and mouse alveolar macrophages in vivo [Citation16–Citation18]. Within the last decade, Rodriguez and her team presented data indicating that B. pertussis can survive in primary macrophages [Citation19]. They have shown that the majority of B. pertussis cells are killed within acidic compartments; however, some residual cells evade this killing and survive and replicate inside a non-acidic early endosome-like compartment [Citation20,Citation21]. Indeed, B. pertussis uses several mechanisms to avoid phagocytic killing. For example, immune evasion mediated by both pertussis and adenylate cyclase toxins results in subversion of cellular signalling, repression of phagocytic activity and, eventually, in induction of apoptosis [Citation22–Citation25]. Collectively, these data led to speculations that B. pertussis could use macrophages as an intracellular niche and that the intramacrophage phase of infection could play a significant role in survival and persistence of bacteria within the host [Citation12,Citation17,Citation18]. In support, gene expression profiling and proteomic analysis of infected monocyte-derived THP-1 macrophages revealed that intracellular B. pertussis cells modulate expression of several genes involved in response to the host immune system and reshape production of dozens of proteins implicated in virulence [Citation20,Citation21].
In this study, representing the first attempt to assess the global response of human phagocytes to B. pertussis infection, we aimed at RNA-seq analysis of transcriptomic profiles in monocyte-derived THP-1 macrophages infected with B. pertussis. In addition, we were tempted to decipher whether we can also monitor the pathogen gene expression profiles during the infection to gain insight into its response and adaptation to the intracellular environment.
Results
Global transcriptomic profile of THP-1 macrophages infected with B. pertussis
THP-1 monocyte-derived macrophages were infected with B. pertussis reference strain Tohama I. Samples of uninfected macrophages (C; control) were collected 6 h post-infection (pi) while infected macrophages were collected at three time points (T1-T3) corresponding to 2, 6 and 24 h pi with the objective of a) elucidation of the general macrophage response triggered by B. pertussis (6 h pi) and b) monitoring the time-dependent changes in gene expression profiles resulting from the host–pathogen interaction within the early phase of infection (T2 versus T1) and within the late phase of infection (T3 versus T2). We did not use the uninfected controls for T1 and T3 time points as the changes in gene expression profiles of THP-1 macrophages incubated for 24 h in RPMI medium are not substantial [Citation26] and in particular, expression of several cytokines and chemokines remains unchanged during 24 h incubation in RPMI medium [Citation27,Citation28]. RNA-seq analysis of samples from infected cells and uninfected control yielded on average 16 million reads which were mapped to human and B. pertussis genomes (Fig S1). Principal component analysis (PCA) of RNA-seq data revealed that samples from uninfected macrophages clustered separately from infected cells and that also samples of infected macrophages collected at 2 h, 6 h and 24 h pi clustered apart from each other (). Thus, PCA indicated temporal changes in gene expression profiles resulting from B. pertussis infection. To identify these alterations, differential expression (DE) analysis was performed. First, we compared global gene expression profiles in infected cells and control uninfected cells harvested 6 h pi (T2 versus C). For the host, DE analysis identified 679 macrophage genes as significantly modulated (│log2FC│ ≥ 1; adjusted p-value < 0.05) upon infection (Table S1). Expression of hundreds of genes was strongly upregulated upon infection including those encoding cytokines, chemokines, cell receptors and transcription factors ().
Figure 1. (A) Principal component analysis was applied to transcriptomic profiles of the uninfected THP-1 macrophages (C; red circles) and B. pertussis-infected THP-1 macrophages harvested 2 h (T1, green circles), 6 h (T2, blue circles) and 24 h (T3, cyan circles) pi. Each dot represents an independent biological replicate. (B) Volcano plot showing the global transcriptional changes in the infected THP-1 cells 6 h pi. The red dots represent significantly differentially expressed genes, labelled genes are discussed in this work. The black dots represent nonsignificantly modulated genes.
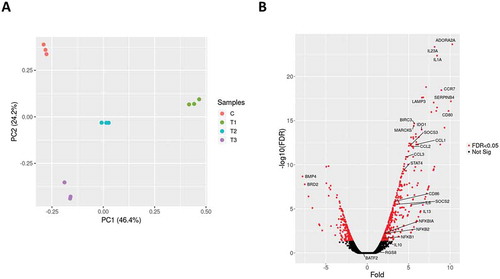
Many of the highly expressed genes encode important factors of the innate immunity such as IL-1A, IL-6, IL-23A, TNF superfamily proteins, CCL and CXCL chemokine families and NFκB and STAT4 regulators and belong to common expression pattern mounted by host cells upon bacterial infection [Citation29]. Of note, among the significantly upregulated genes were also anti–inflammatory cytokines IL-13 and IL-10 and ADORA2A gene encoding the adenosine receptor A2A which senses adenosine levels and triggers the anti–inflammatory signalling [Citation30]. On the other side, among the highly downregulated genes were BMP4 and BRD2. BMP4 belongs to the TGF-β superfamily of proteins and was reported to induce M2 polarization in macrophages [Citation31], while transcriptional regulator BRD2 interacts with chromatin and plays important role in inflammatory response in mice [Citation32]. Collectively, these results suggest that both pro-inflammatory and anti–inflammatory programmes that presumably result from host-pathogen interplay are active in infected cells.
Figure 2. Gene Set Enrichment Analysis (GSEA) of GO terms enriched for differentially expressed genes 6 h pi. GSEA was applied to identify enriched GO terms within either downregulated (log2FC < 0) or upregulated (log2FC > 0) gene sets. The bars depict the percentage of DE genes associated with the specific GO term and shades of blue indicate positive log10 of FDR range. Grey bars indicate that this GO term was not significantly enriched within the corresponding gene set. Top 20 enriched gene sets were selected for visualization.
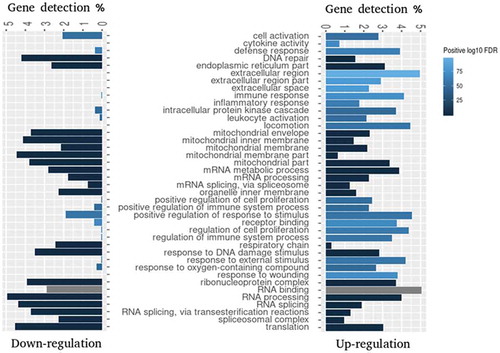
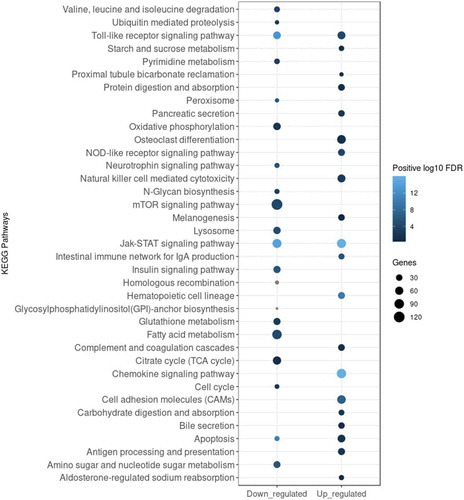
To obtain a deeper insight into the functional clustering of up- and downregulated DE genes, we performed GO term and KEGG pathway enrichment analyses. As shown in , the Gene Set Enrichment Analysis (GSEA) revealed that genes upregulated upon infection were significantly and selectively enriched within GO terms such as ‘Response to external stimulus’, ‘Immune response’, ‘Leukocyte activation’, ‘Locomotion’ and ‘Regulation of immune system process’, while downregulated genes were enriched predominantly within ‘Respiratory chain’ and ‘Mitochondrial membrane part’ terms. KEGG pathway analysis presented in identified several regulatory circuits to be selectively enriched for upregulated genes such as ‘NOD-like receptor signalling pathway’, ‘Chemokine signalling pathway’or ‘Antigen processing and presentation’. On the other side, ‘mTOR signalling pathway’ and several metabolic pathways were enriched for downregulated genes.
Figure 3. Enrichment analysis of KEGG pathways enriched for DE genes 6 h pi. Analysis was applied to identify pathways enriched for either downregulated (log2FC < 0) or upregulated (log2FC > 0) DE genes. Top 20 enriched KEGG pathways for each subset of genes were selected for visualization. The legend shows the positive log10 of FDR range (shades of blue) and the number of DE genes in each KEGG pathway expressed by the size of the dots.
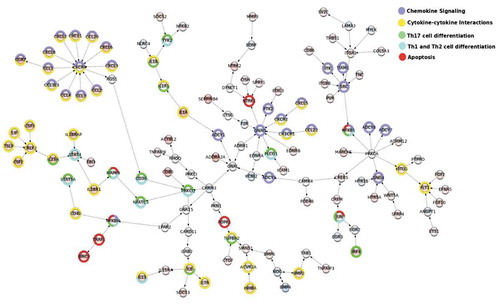
Finally, to identify coherently modulated genes within the global cell signalling network we used the Modulated Sub-graph Finder (MSF) tool. MSF combines the whole cell signalling network with data from DE analysis to identify the modulated networks. The networks identified by MSF help to reveal the flow and cross-talk between different KEGG pathways. As presented in , the selected network shows the signalling between cytokine and chemokines affecting Th1, Th2 and Th17 profiling and apoptosis in immune cells. For example, the graph depicts activation of STAT4 by IL-23 and IL-18R1 or activation of CXCR4 receptor by members of CCL and CXCL chemokine families.
Figure 4. MSF identification of modulated interacting networks. Networks were generated using data from DE analysis. The network file created by MSF was used to visualize the modulated networks in Cytoscape. The nodes represent the genes and the edges show the direction of interaction. The enrichment within different KEGG pathways (see legend) is shown by the colours around the nodes. The colouring inside the node depicts the range of log fold change for upregulated (shades of red) and downregulated genes (shades of blue).
Temporal changes in global transcriptomic profiles of infected THP-1 macrophages
Next, we focused on time-dependent changes in transcriptomic profiles of infected macrophages. We compared the gene expression profiles in cells harvested 6 h and 2 h pi (T2 versus T1) and in cells harvested 24 h and 6 h pi (T3 versus T2). DE analysis identified 561 and 553 of significantly (│log2FC│ ≥ 1; adjusted p-value < 0.05) modulated genes between T2-T1 and T3-T2 time points, respectively (Table S2). Significantly up- and downregulated genes were used for GSEA to identify enriched GO terms between T2-T1 and T3-T2 time points (Fig. S2). Apparently, most of the GO terms were not selectively enriched for either up- or downregulated genes. Nevertheless, as shown in Fig. S3a, when we compared DE genes modulated between T2 and T1 time points, KEGG pathway analysis unravelled several pathways consistently enriched for upregulated (e.g. ‘Phagosome’, ‘Cell adhesion molecules’ and ‘Antigen processing and presentation’) or downregulated (e.g. ‘DNA replication’, ‘Ubiquitin mediated proteolysis’ and ‘Insulin signalling pathway’) genes. Of note, several pathways such as ‘MAPK signalling pathway’, ‘Toll-like receptor pathway’ and ‘Hedgehog signalling pathway’ were highly enriched for genes whose expression was upregulated between 6 h and 24 h pi (Fig. S3b).
Validation of the RNA-seq data by quantitative PCR
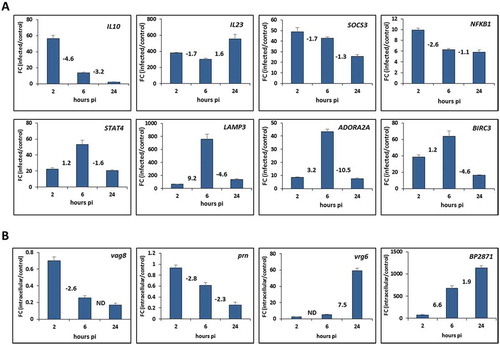
To validate the gene expression profiles obtained from RNA-seq analysis, the expression of selected THP-1 genes was assayed by RT-qPCR method. Comparative RT-qPCR analysis of infected and uninfected cells performed at all three time points allowed us also to confirm temporal changes in gene expression profiles deduced from RNA-seq results. As shown in , results of quantitative PCR analysis of eight selected genes of different functional categories were in very good agreement with RNA-seq data. Moreover, temporal changes in the gene expression deduced from RNA-seq results are also concordant with the outcome of quantitative PCR analysis. We could, for example, verify that expression of IL10 or SOCS3 genes is reduced during the infection or that expression of STAT4, LAMP3, ADORA2A and BIRC3 genes peaks 6 h pi.
Figure 5. Validation of the RNA-seq results with quantitative PCR. (A) RT-qPCR analysis was performed to assay the relative expression profiles of IL10, IL23, SOCS3, NFKB1, STAT4, LAMP3, ADORA2A and BIRC3 genes in infected THP-1 macrophages. Relative gene expression was compared between infected and uninfected macrophages harvested 2, 6 and 24 h post-infection (pi). (B) RT-qPCR analysis was performed to assay the relative expression profiles of vag8, prn, vrg6 and BP2871 genes in intracellular B. pertussis cells. Relative gene expression was compared between intracellular and unexposed bacteria 2, 6 and 24 h post-infection (pi). Fold change (FC) values are means (bars) ± standard deviations (error bars) from three biological replicate experiments. Values depicted between the bars denote the fold changes in expression of the specific gene between corresponding time points deduced from RNA-seq results determined 2, 6 and 24 h pi. ND, not determined in the corresponding analysis.
Changes in gene expression profiles of intracellular B. pertussis cells
Additionally, as an important part of this project, we tested the suitability of our infection protocol for parallel monitoring of the pathogen gene expression responses. Therefore, at this stage we did not fully focus on DE analysis of intracellular B. pertussis cells, nevertheless, we quantified abundant bacterial transcripts in samples of infected macrophages to monitor their expression profiles in the course of infection. Expectedly, more than 99% of the reads could be mapped to the human genome while the number of Bordetella-specific informative reads (those mapping to protein-coding genes) in samples harvested 6 h (≈ 10 000 reads/sample) and 24 h pi (≈ 6 500 reads/sample) decreased when compared to samples harvested 2 h pi (≈ 38 000 reads/sample; Fig. S1) and thereby mirrored reduced numbers of viable intracellular Bordetella cells recovered from macrophages in the course of infection (from 2.1 x 10⁶/well at 2 h pi to 1.0 x 10⁶/well at 6 h pi and 1.5 x 10⁵/well at 24 h pi). In spite of low sequencing yield (see Table S3 for numbers of mapped reads), we asked whether we could compare the gene expression profiles of intracellular bacteria between time points T2 and T1 and between time points T3 and T2. This analysis identified 281 and 55 significantly (│log2FC│ ≥ 1; adjusted p-value < 0.1) differentially expressed B. pertussis genes, respectively (Table S4). Among the genes strongly induced during infection were ferrous iron transporter ftrA, several genes implicated in sulphur metabolism including transcriptional factor iscR, cysteine desulfurase iscS, and cysteine dioxygenase BP2871 and genes involved in vitamin B6 metabolism and homoeostasis (BP1920 and BP1921) (). Of note, large number of genes encoding transcriptional regulators including BP0135, BP0823, BP1319, BP2216, sigma factors rpoE and rpoH and RNA chaperone hfq were overexpressed during the infection.
Table 1. List of selected B. pertussis genes upregulated in the course of infectiona.
On the other side, expression of several virulence genes such as cyaDE, tcfA, prn, vag8, brkA and genes within fim, ptx/ptl and T3SS-specific bsc/btr operons was significantly reduced in the course of infection ().
Table 2. List of selected B. pertussis genes downregulated in the course of infectiona.
In support, the expression of bvgR regulatory gene which is required for expression of virulence genes was also reduced upon infection while the expression of virulence repressed gene vrg6 was increased in the course of infection. Importantly, the outcome of quantitative PCR analysis of vag8, prn, vrg6 and BP2871 genes was fully in agreement with DE analysis of B. pertussis-specific reads determined in samples of infected macrophages (). Indeed, as inferred from RNA-seq data ( and ), the expression of vag8 and prn virulence genes was decreased in the course of infection while the expression of vrg6 and BP2871 genes was increased and these trends were clearly confirmed by RT-qPCR analysis. Notably, when compared to unexposed control, the expression of cysteine dioxygenase gene BP2871 was increased more than 70-fold already 2 hours pi.
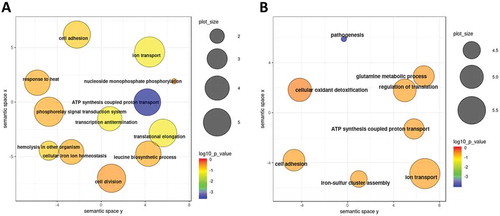
GO term enrichment analysis of genes significantly modulated between time points T2 and T1 revealed several affected cellular processes. As shown in , within the set of genes which were significantly upregulated, processes such as ‘Cell redox homoeostasis’, ‘Transmembrane transport’, ‘Phosphorylation’ and ‘Oxidation-reduction process’ were highly enriched. On the other side, genes belonging to ‘Ribosome biogenesis’, ‘Dephosphorylation’, ‘Oxidation-reduction process’, ‘Pathogenesis’ and ‘ATP synthesis coupled proton transport’ terms were enriched among the transcripts which were significantly downregulated (). Although only very limited number of genes displayed differential expression levels between time points T3 and T2, biological processes such as ‘Phosphorelay signal transduction’ and ‘Regulation of transcription’ were enriched for upregulated genes while ‘Pathogenesis’, ‘Proteolysis’ and‘Cell adhesion’ terms were among the processes enriched for downregulated genes (data not shown).
Figure 6. GO term enrichment analysis of B. pertussis genes modulated during infection. Significantly enriched terms from the domain ‘Biological processes’ were identified within gene sets either upregulated (A) or downregulated (B) between the time points T2 and T1. Results were summarized and visualized by REVIGO as a scatter plot. Circle size encodes number of genes associated with respective category, colours encode the significance level of the enrichment.
Discussion
This study represents the first RNA-seq-based attempt to assess the global transcriptomic response of human phagocytes triggered by infection with B. pertussis cells. So far the transcriptional profiling of B. pertussis interactions with host cells was studied predominantly in mouse model and was focused either on the host [Citation33,Citation34] or the pathogen [Citation35,Citation36]. Nevertheless, mouse is not a natural host of B. pertussis and in our study we were interested in specific interaction with human macrophages rather than with complex mouse immune system. To avoid donor-to-donor variation observed in experiments with primary macrophages, we used the THP-1 monocyte-derived cells, a popular cell model for immune modulations studies [Citation37] which has also been shown to be a good surrogate for primary cells in experiments with B. pertussis [Citation21]. Profiling of human respiratory epithelial cells [Citation38] and THP-1 macrophages [Citation21] following B. pertussis infection was studied using DNA microarrays and quantitative PCR, respectively, however, global RNA-seq analysis of transcriptional responses of human phagocytic cells to B. pertussis cells has not been performed as yet. We have applied the dual RNA-seq approach allowing for analysis of transcriptomic profiles in both host and pathogen [Citation39]; however, the major focus was set on the host side. To minimize the possible bias coming from additional treatment of samples delaying the RNA isolation (enrichment of the sample for bacterial RNA, time-consuming separation of infected and uninfected macrophages by flow cytometry), the macrophages were instantly lysed and used for isolation of the total RNA. This approach, however, brought some possible limitation to our study. First, as expected from previously published data [Citation19] and our preliminary results, the numbers of viable intracellular bacteria dropped during infection and consequently, reduced relative amounts of isolated bacterial RNA combined with only a moderate sequencing depth limited the statistical power to call significantly differentially expressed genes for all but highly expressed bacterial genes. Second, we were analysing rather heterogeneous population of phagocytes composed of infected cells and cells which were either not infected or were infected but already cleared the pathogen. We accepted these limitations in order to develop an easy to control and reproducible model of infection. Indeed, obtained results clearly indicate that macrophages underwent substantial reprogramming of their transcriptome upon infection. Macrophages, like other immune cells, react to bacterial infection with common gene expression programmes [Citation29,Citation40]. One of the important roles of immune cells encountering the pathogen is to attract and activate other immune cells by secretion of cytokines and chemokines. Interestingly, we observed induction of both pro- and anti-inflammatory cytokines which is in line with previous reports demonstrating that TLR4-dependent recognition of B. pertussis-associated products triggers mixed immune response in the host [Citation41,Citation42]. For example, the highly expressed IL-23, IL-1A, IL-6, CCR7, CCL2, CCL3, CXCL8, CD80 and CD86 genes belong to set of genes characteristic for induction of M1 macrophage polarization and promoting pro-inflammatory Th1 and Th17 immune responses [Citation43,Citation44]. On the other side, increased expression of IL-13 and IL-10 cytokine genes inducing M2 programme in macrophages suggests that Th2 response is also mounted in infected macrophages. Notably, such a mixed immune response was also detected in mouse lungs after primary B. pertussis infection [Citation34] and also in primary macrophages infected with several other pathogens [Citation45–Citation47]. Nevertheless, while the expression of IL-23 remained highly increased in infected cells during the infection, expression of IL-10 culminated at 2 h pi and then it gradually dropped. Importantly, these expression profiles of IL23, IL10 and several other genes were clearly confirmed by quantitative PCR analysis. Of note, our results are in line with already documented observation that B. pertussis-infected monocyte-derived dendritic cells promote synthesis of IL-23 but not of IL-12 [Citation48]. IL-23 is an IL-12-like heterodimer sharing the p40 subunit with IL-12 and was shown to play different roles in shaping of the immune response [Citation49]. Besides its role in mounting of Th1 response, it is one of the essential factors required for the expansion of a memory T cell population, which is characterized by the production of IL-17 (Th17) [Citation44]. Importantly, both Th1 and Th17 cells contribute to natural immunity induced by infection with B. pertussis in mice [Citation50]. Also baboons, previously infected with B. pertussis, possess strong specific Th1 and Th17 memory [Citation51]. Interestingly, IL-23/IL-17 axis plays a substantial role also in the development of chronic inflammations causing a variety of allergic and autoimmune diseases such as rheumatoid arthrosis, inflammatory bowel disease and asthma [Citation52]. Based on environmental observations, Rubin and Glazer proposed a hypothesis that subclinical B. pertussis colonization is an important cause of asthma and diseases of allergic sensitization [Citation53]. Therefore, it is tempting to speculate whether the paroxysmal cough, a hallmark of pertussis disease, could also result from strong pro-inflammatory IL-23 production and expansion of Th17 cells.
To prevent phagocytic killing, extracellular B. pertussis cells produce a very potent adenylate cyclase toxin which can disrupt cell signalling in macrophages and eventually induce apoptosis [Citation24,Citation25,Citation54]. Nevertheless, our data suggest that upon internalization of B. pertussis cells, the expression of several genes involved in apoptotic programme is modulated which may result in prevention of cell death and permitting the pathogen to persist within the immune cells. Interestingly, antiapoptotic signalling was observed also in human respiratory epithelial cells infected with B. pertussis and seems to be a molecular signature of B. pertussis infections [Citation38]. Indeed, majority of serpins, a group of serine protease inhibitors which are known to control an array of biological processes including inflammation [Citation55], was significantly upregulated upon infection. Among them, SERPINB3 and SERPINB4 were reported to inhibit apoptosis in THP-1 macrophages infected with T. gondii [Citation56]. Likewise, the expression of BIRC3 (cIAP2) gene was highly increased in infected cells. BIRC3 is a member of the inhibitor of apoptosis family of proteins that inhibit cell death by interfering with the activation of caspases [Citation57] and, of note, its expression was found to be increased upon B. pertussis infection of human bronchial cells [Citation38].
Remarkably, within the genes strongly induced upon infection we also identified set of factors which were reported to be hijacked by several intracellular pathogens to escape from host immunity. For example, suppressors of cytokine signalling (SOCSs) proteins SOCS3 and SOCS2 belonging to important family of inflammatory response regulators [Citation58] were shown to augment the infection with M. tuberculosis and S. enterica [Citation59,Citation60]. Highly induced expression of SOCS3 in infected macrophages is also in line with previous experiments, showing increased expression of SOCS3 gene in B. pertussis-infected THP-1 macrophages [Citation21]. Similarly, increased expression of IDO1, LAMP3 and MARCKS genes in infected cells may correlate with attenuation of innate immune response and increased intracellular survival as it was shown for Mycobacterium leprae infection of monocytes [Citation61], S. typhimurium infection of HeLa cells [Citation62] and Burkholderia thailandensis infection of THP-1 macrophages and epithelial A549 cells [Citation63], respectively.
GO term and KEGG pathway enrichment analyses were applied to identify molecular signatures of macrophage response to B. pertussis infection. Our results showed that several signalling and metabolic pathways were significantly modulated during the infection. Challenge with B. pertussis (6 h pi) led among others to downregulation of mTOR and insulin signalling pathways, fatty acid metabolism, TCA cycle and oxidative phosphorylation while NOD-like receptor and chemokine signalling pathways were induced. Of note, downregulation of insulin signalling pathway may correlate with reported B. pertussis-induced hyperinsulinemia in human and mice [Citation64]. Interestingly, apoptosis, Toll-like receptor and Jak-STAT signalling pathways were concomitantly up- and downregulated. These data suggest that besides modulation of signalling pathways controlling the immune response, B. pertussis has also profound effect on host metabolism [Citation65].
One of the important outcomes of our study was the finding that a significant number of bacterial reads can be obtained from infected macrophage cells without enrichment steps. Yet, we are aware that our data must be interpreted with caution and corroborated in larger study yielding substantially increased number of mapped reads. Nevertheless, in this study, we could identify several Bordetella genes which were differentially expressed between 2 and 6 h pi and/or between 6 and 24 h pi and validate observed effects for selected genes by quantitative PCR. Among those induced during infection were genes involved in iron transport and iron-sulphur cluster assembly indicating that intracellular B. pertussis cells face iron scarcity and oxidative stress. These results are in line with previous reports showing that iron acquisition and transport systems and iron-sulphur cluster sensors contribute to fitness of B. pertussis cells during in vivo infections [Citation35,Citation36,Citation66,Citation67]. Within the genes displaying reduced expression during infection were also those involved in pathogenesis. The expression of bvgR regulator of virulence was reduced during the infection and, consequently, the expression of several virulence factors was also downregulated. This is in contrast with in vivo data obtained previously in mouse model of respiratory tract infection where expression of majority of virulence factors was increased during the infection of lungs [Citation35,Citation36,Citation68]. Our observations indicate that opposed to B. pertussis cells isolated from mouse organs and facing systemic immune response, the intracellular B. pertussis cells switch from Bvg+ to Bvg− phase during the intramacrophage phase. We assume that the Bvg+ phase plays a less significant role in the intracellular survival of B. pertussis and that avirulent Bvg− phase can be beneficial to the pathogen as it was shown for closely related B. bronchiseptica [Citation69,Citation70]. Interestingly, Bvg− mutants have been shown to accumulate among persistent B. pertussis cells within the upper respiratory tract of experimentally infected rhesus monkeys [Citation71]. Furthermore, multiple metabolic pathways are upregulated in the Bvg− phase and potentially help to overcome the environmental and nutritional stress [Citation72]. Recently, we have shown that Bvg-repressed small regulatory RNA RgtA is involved in control of transport of glutamate, a key metabolite in B. pertussis physiology [Citation73]. In line with these observations, the expression of virulence repressed gene vrg6 was induced during the infection. Of note, increased expression of vrg6 gene was observed also in B. pertussis cells recovered from lungs of intranasally infected mice [Citation74]. While this gene was one of the first described virulence repressed genes in B. pertussis [Citation75], its cellular function remained unclear. We suggest that Vrg6 protein belongs to family of PXP(V) proteins forming potassium channels [Citation76,Citation77] as it contains five PXP(V) motifs and two transmembrane domains (Fig. S4). These proteins control the activity of the pores in response to different stimuli such as changes in pH or membrane potential [Citation78]. Considering the possible effects of harsh macrophage environment on bacterial cell wall integrity, the increased expression of the vrg6 gene seems to be biologically relevant.
Collectively, observed changes in the gene expression profiles suggest that intracellular B. pertussis cells actively adapt to intramacrophage environment and respond to bactericidal activities triggered by THP-1 cells. As mentioned above, large number of host genes involved in macrophage polarization, signalling, immunosuppression and apoptosis were overexpressed upon infection. It seems that interplay between macrophages and intracellular B. pertussis cells may result in alternative polarization of macrophages and induction of the processes that augment survival of the bacteria within phagocytic cells. Nevertheless, strongly modulated expression of dozens of cytokines and chemokines suggests that some of the observed effects result from cell-to-cell signalling within the population of infected macrophages. Importantly, this study indicates that in vitro expressions profiles of several genes and pathways in both human host cells and pathogen are in line with in vivo data obtained with mouse model of infection [Citation34–Citation36,Citation66], although our data suggest higher importance of avirulent phase in intramacrophage infection than previously thought. Nevertheless, we are aware of certain limitations of our study and it is evident that we need to perform additional experiments to delineate the B. pertussis-specific activities modulating the host immune response and macrophage-specific responses induced by B. pertussis infection in order to clarify the importance of the intracellular phase for the infectious cycle of B. pertussis.
Materials and methods
Growth and differentiation of THP-1 cells
Monocytic THP-1 cells (obtained from ATCC) were grown in suspension in 75 cm2 flasks in Roswell Park Memorial Institute (RPMI) 1640 medium (Sigma) supplemented with 10% heat-inactivated foetal bovine serum (FBS, Sigma) at 37°C in a humidified incubator (5% CO2). For differentiation into macrophages, the THP-1 cells were seeded in 6-well plates (4 x 10⁶ per well) and stimulated by the addition of 10 nM phorbol 12-myristate 13-acetate (PMA, Sigma) for 72 h followed by resting for 24 h in RPMI medium without PMA.
Cultivation of the B. pertussis cells
Bordetella pertussis reference strain Tohama I was grown on Bordet-Gengou (BG) agar plates (Difco) supplemented with 15% sheep blood for 3 to 4 days at 37°C. For liquid cultures, bacteria were grown in Stainer-Scholte (SS) medium supplemented with 0.1% cyclodextrin (Sigma) and 0.5% casamino acids (Difco) at 37°C. For infection assays, the B. pertussis cells were grown overnight in SS medium to mid-exponential phase of growth (OD600 ≈ 1.0) and diluted in RPMI medium to appropriate cell density.
Infection of THP-1-derived macrophages
Differentiated THP-1 macrophages were infected with B. pertussis cells diluted in RPMI medium at multiplicity of infection of 100 bacteria per macrophage (4 x 10⁸ per well). The plates were then centrifuged for 3 min at 600 g to facilitate the interaction of bacteria with macrophages. After 1 h of incubation (37°C; 5% CO2), nonadherent bacteria were removed by washing and remaining extracellular bacteria were killed by incubation in RPMI medium containing 100 μg/ml of polymyxin B sulphate (Sigma) for 1 h (37°C; 5% CO2). No viable bacteria were detected by direct plating of cell culture supernatants on BG agar. From this time point (T1), corresponding to 2 hours pi (1 h of co-incubation of B. pertussis cells with macrophages and 1 h of polymyxin B treatment), the concentration of the antibiotic was kept at 20 μg/ml which was sufficient to prevent the repopulation of RPMI medium with released intracellular bacteria (data not shown). At indicated times (2, 6 and 24 h pi; time points T1-T3), the infected cells were intensely washed with prewarmed phosphate-buffered saline (PBS) and directly lysed. In parallel, samples of uninfected cells were treated in the same way and served as controls. In addition, at each time point, the infected macrophages from separate well were lysed with sterile water containing 0.01% Triton X-100 and the lysates were plated onto BG agars to assess the numbers of viable intracellular bacteria. At each time point, three biological replicates of infected and uninfected macrophages as well as of unexposed bacteria cultivated in RPMI medium were harvested for transcriptomic and quantitative PCR analyses.
RNA isolation
Macrophages were lysed with 0.5 ml of TRI reagent (Sigma) and total RNA was isolated from lysates according to the manufacturer´s protocol. Removal of DNA was achieved by treatment of samples with TURBO DNA-free kit (Thermo Fisher Scientific). RNA quality and quantity were determined by agarose gel electrophoresis and using the Nanodrop 2000 device (Thermo Fisher Scientific). Furthermore, the RNA quality was assessed at sequencing facility (Vienna Biocenter Core Facility, NGS unit) on an Agilent 2100 Bioanalyzer. All samples displayed RNA integrity numbers higher than 9.
Library preparation, sequencing and read mapping
Ribosomal RNAs of the host and pathogen were simultaneously depleted with the Ribo-Zero Gold rRNA Removal Kit from Illumina. Libraries were prepared using NEBNext® Ultra™ II DNA Library Prep Kit for Illumina and sequenced on an Illumina HiSeq 2500 platform using HiSeqV4 chemistry with single-end 50-base-pair reads. FastQC (https://www.bioinformatics.babraham.ac.uk/projects/fastqc; version 0.11.8) was used to perform quality control checks on raw Illumina reads in FASTQ format. A single transcriptome generated by combining human transcriptome (Ensembl GRCh38) and B. pertussis Tohama I transcriptome was used to map and quantify the reads using Salmon quantifier (version 0.11.3) [Citation79]. B. pertussis transcriptome was produced from NCBI Assembly GCF 000195715.1 using gffread (https://github.com/gpertea/gffread). After quantification with Salmon, human and bacterial read counts per gene were separated for subsequent differential expression analysis. RNA-seq data from the sequencing runs were deposited at the European Nucleotide Archive under project accession number PRJEB33395.
Differential expression (DE) analysis
Prior to DE analysis, unwanted variation caused by batch effects or library preparation was removed from the samples using RUVs correction method from RUVseq (version 1.16.0) [Citation80]. DE was assessed using gene read counts as inputs and analysis was performed by EdgeR package (version 3.24.1) [Citation81]. Human genes with at least five uniquely mapped reads in at least two replicates were considered with default k = 1 using the upper-quartile normalization. Bacterial genes with at least 10 uniquely mapped reads (average of the triplicate) at least at one time point were considered with default k = 1, using a weighted trimmed mean of M-values (TMM) normalization. DE analysis for samples collected at time point T2 versus control was evaluated only for human genes, DE analysis of samples collected at time points T2 versus T1 and T3 versus T2 was determined for both human and B. pertussis genes.
MSF analysis
The DE analysis results generated by edgeR were used to identify modulated sub-graphs using Modulated Sub-graph Finder (MSF). Cell signalling interactions were filtered from Reactome functional interactions version 2016 (https://reactome.org/download-data) for only direct interactions, which was used as a second input for MSF tool [Citation82]. The parameters used for MSF were extension 2 and merging 2. The network file containing the identified interactions produced by MSF was imported and visualized by Cytoscape (version 3.6.1). KEGG pathway enrichment was generated using StringApp (version 1.4.2).
GSEA analysis
The Gene Set Enrichment Analysis was done for GO and KEGG term enrichment using R package ‘GSEABase’ (version 1.44.0). For each comparison, the complete list of significant DE genes (adjusted p-value < 0.05) was separated into two groups, one composed of genes with positive log fold change (log2FC > 0) and the second composed of genes with negative fold change (log2FC < 0). Top 20 enriched ‘Upregulated’ and ‘Downregulated’ gene sets were selected for the visualization.
GO term enrichment for B. pertussis
The gene ontology (GO) terms per gene were deduced using blast2go [Citation83]. Each GO term which was associated with more than one gene in the gene set was tested for enrichment compared to the whole transcriptome by applying the Fisher Exact test. Afterwards, determined p-values were corrected for multiple testing by the method of Benjamini and Hochberg [Citation84]. The GO term lists were condensed, summarized and visualized using the Revigo tool [Citation85].
Quantitative PCR
To validate gene expression profiles of infected THP-1 macrophages and intracellular B. pertussis cells, total RNA isolated for RNA-seq analysis from triplicate samples of infected macrophages 2, 6 and 24 h pi was used. As controls, total RNA was isolated from triplicates of uninfected macrophages and unexposed bacteria cultivated in parallel in RPMI medium. RT-qPCR analysis of both host and pathogen transcript levels was performed as described earlier [Citation86]. Briefly, duplicates of 1 µg of total isolated RNA treated with TURBO DNA-free kit (Thermo Fisher Scientific) were reverse transcribed into cDNA following the manufacturer’s instructions in a 25-μl reaction using the MMLV Reverse Transcriptase (Promega). Quantitative PCR (RT-qPCR) was performed on Bio-Rad CFX384 Touch™ instrument using HOT FIREPol® Eva®Green qPCR Mix Plus™ (Solis Biodyne), 200 nmoles of each primer and 40 ng of reverse transcribed RNA in a 12-μl qPCR reaction with an initial step at 95°C for 12 min, followed by 40 cycles of 95°C for 15 s, 60°C for 25 s, 72°C for 30 s. For THP-1 macrophages, the ACTB gene was used as the reference gene to assess relative gene expression levels in infected and uninfected cells. For B. pertussis, the rbfA gene was used as the reference gene to assay the relative gene expression levels in intracellular and unexposed bacteria. Primers used to quantify THP-1 and B. pertussis genes (Table S5) were analysed for secondary structures and for cross-dimers in primer pairs. Relative expression levels were quantified using amplification efficiency values [Citation87]. To validate RNA-seq data, relative expression levels of selected genes were compared between infected and uninfected THP-1 cells and between intracellular and unexposed bacteria at each time point.
Disclosure of potential conflicts of interest
No potential conflict of interest was reported by the authors.
Supplemental Material
Download Zip (1.1 MB)Supplemental materials
Supplemental data for this article can be accessed here
Additional information
Funding
References
- Mattoo S, Cherry JD. Molecular pathogenesis, epidemiology, and clinical manifestations of respiratory infections due to Bordetella pertussis and other Bordetella subspecies. Clin Microbiol Rev. 2005;18:326–382.
- WHO. Vaccine preventable deaths and the global immunization vision and strategy, 2006–2015. MMWR Morb Mortal Wkly Rep. 2006;55:511–515.
- Cherry JD. The present and future control of pertussis. Clin Infect Dis. 2010;51:663–667.
- Raguckas SE, VandenBussche HL, Jacobs C, et al. Pertussis resurgence: diagnosis, treatment, prevention, and beyond. Pharmacotherapy. 2007;27:41–52.
- Consortium P. PERISCOPE: road towards effective control of pertussis. Lancet Infect Dis. 2018. DOI:10.1016/S1473-3099(18)30646-7
- Melvin JA, Scheller EV, Miller JF, et al. Bordetella pertussis pathogenesis: current and future challenges. Nat Rev Microbiol. 2014;12:274–288.
- Higgs R, Higgins SC, Ross PJ, et al. Immunity to the respiratory pathogen Bordetella pertussis. Mucosal Immunol. 2012;5:485–500.
- Locht C. Molecular aspects of Bordetella pertussis pathogenesis. Int Microbiol. 1999;2:137–144.
- de Gouw D, Diavatopoulos DA, Bootsma HJ, et al. Pertussis: a matter of immune modulation. FEMS Microbiol Rev. 2011;35:441–474.
- Lenz DH, Weingart CL, Weiss AA. Phagocytosed Bordetella pertussis fails to survive in human neutrophils. Infect Immun. 2000;68:956–959.
- Ishibashi Y, Claus S, Relman DA. Bordetella pertussis filamentous hemagglutinin interacts with a leukocyte signal transduction complex and stimulates bacterial adherence to monocyte CR3 (CD11b/CD18). J Exp Med. 1994;180:1225–1233.
- Saukkonen K, Cabellos C, Burroughs M, et al. Integrin-mediated localization of Bordetella pertussis within macrophages: role in pulmonary colonization. J Exp Med. 1991;173:1143–1149.
- Hazenbos WL, van den Berg BM, van Furth R. Very late antigen-5 and complement receptor type 3 cooperatively mediate the interaction between Bordetella pertussis and human monocytes. J Immunol. 1993;151:6274–6282.
- Rodriguez ME, Hellwig SM, Hozbor DF, et al. Fc receptor-mediated immunity against Bordetella pertussis. J Immunol. 2001;167:6545–6551.
- Friedman RL, Nordensson K, Wilson L, et al. Uptake and intracellular survival of Bordetella pertussis in human macrophages. Infect Immun. 1992;60:4578–4585.
- Paddock CD, Sanden GN, Cherry JD, et al. Pathology and pathogenesis of fatal Bordetella pertussis infection in infants. Clin Infect Dis. 2008;47:328–338.
- Hellwig SM, Hazenbos WL, van de Winkel JG, et al. Evidence for an intracellular niche for Bordetella pertussis in broncho-alveolar lavage cells of mice. FEMS Immunol Med Microbiol. 1999;26:203–207.
- Vandebriel RJ, Hellwig SM, Vermeulen JP, et al. Association of Bordetella pertussis with host immune cells in the mouse lung. Microb Pathog. 2003;35:19–29.
- Lamberti YA, Hayes JA, Perez Vidakovics ML, et al. Intracellular trafficking of Bordetella pertussis in human macrophages. Infect Immun. 2010;78:907–913.
- Lamberti Y, Cafiero JH, Surmann K, et al. Proteome analysis of Bordetella pertussis isolated from human macrophages. J Proteomics. 2016;136:55–67.
- Valdez HA, Oviedo JM, Gorgojo JP, et al. Bordetella pertussis modulates human macrophage defense gene expression. Pathog Dis. 2016;74. DOI:10.1093/femspd/ftw073.
- Carbonetti NH, Artamonova GV, Van Rooijen N, et al. Pertussis toxin targets airway macrophages to promote Bordetella pertussis infection of the respiratory tract. Infect Immun. 2007;75:1713–1720.
- Kamanova J, Kofronova O, Masin J, et al. Adenylate cyclase toxin subverts phagocyte function by RhoA inhibition and unproductive ruffling. J Immunol. 2008;181:5587–5597.
- Cerny O, Kamanova J, Masin J, et al. Bordetella pertussis adenylate cyclase toxin blocks induction of bactericidal nitric oxide in macrophages through cAMP-dependent activation of the SHP-1 phosphatase. J Immunol. 2015;194:4901–4913.
- Gueirard P, Druilhe A, Pretolani M, et al. Role of adenylate cyclase-hemolysin in alveolar macrophage apoptosis during Bordetella pertussis infection in vivo. Infect Immun. 1998;66:1718–1725.
- Aulicino A, Dinan AM, Miranda-CasoLuengo AA, et al. High-throughput transcriptomics reveals common and strain-specific responses of human macrophages to infection with mycobacterium abscessus smooth and rough variants. BMC Genomics. 2015;16:1046.
- Mizuno K, Fukami T, Toyoda Y, et al. Terbinafine stimulates the pro-inflammatory responses in human monocytic THP-1 cells through an ERK signaling pathway. Life Sci. 2010;87:537–544.
- Huang H, Fletcher A, Niu Y, et al. Characterization of lipopolysaccharide-stimulated cytokine expression in macrophages and monocytes. Inflamm Res. 2012;61:1329–1338.
- Jenner RG, Young RA. Insights into host responses against pathogens from transcriptional profiling. Nat Rev Microbiol. 2005;3:281–294.
- Idzko M, Ferrari D, Eltzschig HK. Nucleotide signalling during inflammation. Nature. 2014;509:310–317.
- Martinez VG, Rubio C, Martinez-Fernandez M, et al. BMP4 induces M2 macrophage polarization and favors tumor progression in bladder cancer. Clin Cancer Res. 2017;23:7388–7399.
- Belkina AC, Nikolajczyk BS, Denis GV. BET protein function is required for inflammation: brd2 genetic disruption and BET inhibitor JQ1 impair mouse macrophage inflammatory responses. J Immunol. 2013;190:3670–3678.
- Banus S, Pennings J, Vandebriel R, et al. Lung response to Bordetella pertussis infection in mice identified by gene-expression profiling. Immunogenetics. 2007;59:555–564.
- Raeven RH, Brummelman J, Pennings JL, et al. Molecular signatures of the evolving immune response in mice following a Bordetella pertussis infection. PLoS One. 2014;9:e104548.
- van Beek LF, de Gouw D, Eleveld MJ, et al. Adaptation of Bordetella pertussis to the respiratory tract. J Infect Dis. 2018;217:1987–1996.
- Wong TY, Hall JM, Nowak ES, et al. Analysis of the in vivo transcriptome of Bordetella pertussis during infection of mice. mSphere. 2019;4. DOI:10.1128/mSphereDirect.00154-19.
- Chanput W, Mes JJ, Wichers HJ. THP-1 cell line: an in vitro cell model for immune modulation approach. Int Immunopharmacol. 2014;23:37–45.
- Belcher CE, Drenkow J, Kehoe B, et al. The transcriptional responses of respiratory epithelial cells to Bordetella pertussis reveal host defensive and pathogen counter-defensive strategies. Proc Natl Acad Sci U S A. 2000;97:13847–13852.
- Westermann AJ, Forstner KU, Amman F, et al. Dual RNA-seq unveils noncoding RNA functions in host-pathogen interactions. Nature. 2016;529:496–501.
- Boldrick JC, Alizadeh AA, Diehn M, et al. Stereotyped and specific gene expression programs in human innate immune responses to bacteria. Proc Natl Acad Sci U S A. 2002;99:972–977.
- Ross PJ, Lavelle EC, Mills KH, et al. Adenylate cyclase toxin from Bordetella pertussis synergizes with lipopolysaccharide to promote innate interleukin-10 production and enhances the induction of Th2 and regulatory T cells. Infect Immun. 2004;72:1568–1579.
- Higgins SC, Jarnicki AG, Lavelle EC, et al. TLR4 mediates vaccine-induced protective cellular immunity to Bordetella pertussis: role of IL-17-producing T cells. J Immunol. 2006;177:7980–7989.
- Benoit M, Desnues B, Mege JL. Macrophage polarization in bacterial infections. J Immunol. 2008;181:3733–3739.
- Aggarwal S, Ghilardi N, Xie MH, et al. Interleukin-23 promotes a distinct CD4 T cell activation state characterized by the production of interleukin-17. J Biol Chem. 2003;278:1910–1914.
- Li W, Katz BP, Spinola SM. Haemophilus ducreyi-induced interleukin-10 promotes a mixed M1 and M2 activation program in human macrophages. Infect Immun. 2012;80:4426–4434.
- Benoit M, Barbarat B, Bernard A, et al. Coxiella burnetii, the agent of Q fever, stimulates an atypical M2 activation program in human macrophages. Eur J Immunol. 2008;38:1065–1070.
- Smith MW, Schmidt JE, Rehg JE, et al. Induction of pro- and anti-inflammatory molecules in a mouse model of pneumococcal pneumonia after influenza. Comp Med. 2007;57:82–89.
- Fedele G, Stefanelli P, Spensieri F, et al. Bordetella pertussis-infected human monocyte-derived dendritic cells undergo maturation and induce Th1 polarization and interleukin-23 expression. Infect Immun. 2005;73:1590–1597.
- Bastos KR, Marinho CR, Barboza R, et al. What kind of message does IL-12/IL-23 bring to macrophages and dendritic cells?. Microbes Infect. 2004;6:630–636. DOI:10.1016/j.micinf.2004.02.012
- Ross PJ, Sutton CE, Higgins S, et al. Relative contribution of Th1 and Th17 cells in adaptive immunity to Bordetella pertussis: towards the rational design of an improved acellular pertussis vaccine. PLoS Pathog. 2013;9:e1003264.
- Warfel JM, Zimmerman LI, Merkel TJ. Acellular pertussis vaccines protect against disease but fail to prevent infection and transmission in a nonhuman primate model. Proc Natl Acad Sci U S A. 2014;111:787–792.
- Iwakura Y, Ishigame H. The IL-23/IL-17 axis in inflammation. J Clin Invest. 2006;116:1218–1222.
- Rubin K, Glazer S. The pertussis hypothesis: bordetella pertussis colonization in the etiology of asthma and diseases of allergic sensitization. Med Hypotheses. 2018;120:101–115.
- Khelef N, Zychlinsky A, Guiso N. Bordetella pertussis induces apoptosis in macrophages: role of adenylate cyclase-hemolysin. Infect Immun. 1993;61:4064–4071.
- Law RH, Zhang Q, McGowan S, et al. An overview of the serpin superfamily. Genome Biol. 2006;7:216.
- Song KJ, Ahn HJ, Nam HW. Anti-apoptotic effects of SERPIN B3 and B4 via STAT6 activation in macrophages after infection with Toxoplasma gondii. Korean J Parasitol. 2012;50:1–6.
- Roy N, Deveraux QL, Takahashi R, et al. The c-IAP-1 and c-IAP-2 proteins are direct inhibitors of specific caspases. Embo J. 1997;16:6914–6925.
- Delgado-Ortega M, Marc D, Dupont J, et al. SOCS proteins in infectious diseases of mammals. Vet Immunol Immunopathol. 2013;151:1–19.
- Schmok E, Abad Dar M, Behrends J, et al. Suppressor of cytokine signaling 3 in macrophages prevents exacerbated interleukin-6-dependent arginase-1 activity and early permissiveness to experimental tuberculosis. Front Immunol. 2017;8:1537.
- Uchiya K, Nikai T. Salmonella pathogenicity island 2-dependent expression of suppressor of cytokine signaling 3 in macrophages. Infect Immun. 2005;73:5587–5594.
- de Souza Sales J, Lara FA, Amadeu TP, et al. The role of indoleamine 2, 3-dioxygenase in lepromatous leprosy immunosuppression. Clin Exp Immunol. 2011;165:251–263.
- Lee EJ, Park KS, Jeon IS, et al. LAMP-3 (lysosome-associated membrane protein 3) promotes the intracellular proliferation of salmonella typhimurium. Mol Cells. 2016;39:566–572.
- Micheva-Viteva SN, Shou Y, Ganguly K, et al. PKC-eta-MARCKS signaling promotes intracellular survival of unopsonized Burkholderia thailandensis. Front Cell Infect Microbiol. 2017;7:231.
- Furman BL, Sidey FM, Wardlaw AC. Role of insulin in the hypoglycaemic effect of sublethal Bordetella pertussis infection in mice. Br J Exp Pathol. 1986;67:305–312.
- Freyberg Z, Harvill ET. Pathogen manipulation of host metabolism: A common strategy for immune evasion. PLoS Pathog. 2017;13:e1006669.
- Brickman TJ, Vanderpool CK, Armstrong SK. Heme transport contributes to in vivo fitness of Bordetella pertussis during primary infection in mice. Infect Immun. 2006;74:1741–1744.
- Miller HK, Auerbuch V. Bacterial iron-sulfur cluster sensors in mammalian pathogens. Metallomics. 2015;7:943–956.
- Bibova I, Hot D, Keidel K, et al. Transcriptional profiling of Bordetella pertussis reveals requirement of RNA chaperone Hfq for Type III secretion system functionality. RNA Biol. 2015;12:175–185.
- Jungnitz H, West NP, Walker MJ, et al. A second two-component regulatory system of Bordetella bronchiseptica required for bacterial resistance to oxidative stress, production of acid phosphatase, and in vivo persistence. Infect Immun. 1998;66:4640–4650.
- Zimna K, Medina E, Jungnitz H, et al. Role played by the response regulator Ris in Bordetella bronchiseptica resistance to macrophage killing. FEMS Microbiol Lett. 2001;201:177–180.
- Karataev GI, Sinyashina LN, Medkova AY, et al. [Insertional inactivation of virulence operon in population of persistent Bordetella pertussis bacteria]. Genetika. 2016;52:422–430.
- Moon K, Bonocora RP, Kim DD, et al. The BvgAS regulon of Bordetella pertussis. MBio. 2017;8. DOI:10.1128/mBio.01526-17.
- Keidel K, Amman F, Bibova I, et al. Signal transduction-dependent small regulatory RNA is involved in glutamate metabolism of the human pathogen Bordetella pertussis. RNA. 2018;24:1530–1541.
- Hoo R, Lam JH, Huot L, et al. Evidence for a role of the polysaccharide capsule transport proteins in pertussis pathogenesis. PLoS One. 2014;9:e115243.
- Croinin TO, Grippe VK, Merkel TJ. Activation of the vrg6 promoter of Bordetella pertussis by RisA. J Bacteriol. 2005;187:1648–1658.
- Del Camino D, Holmgren M, Liu Y, et al. Blocker protection in the pore of a voltage-gated K+ channel and its structural implications. Nature. 2000;403:321–325.
- Tieleman DP, Shrivastava IH, Ulmschneider MR, et al. Proline-induced hinges in transmembrane helices: possible roles in ion channel gating. Proteins. 2001;44:63–72.
- Labro AJ, Snyders DJ. Being flexible: the voltage-controllable activation gate of kv channels. Front Pharmacol. 2012;3:168.
- Patro R, Duggal G, Love MI, et al. Salmon provides fast and bias-aware quantification of transcript expression. Nat Methods. 2017;14:417–419.
- Risso D, Ngai J, Speed TP, et al. Normalization of RNA-seq data using factor analysis of control genes or samples. Nat Biotechnol. 2014;32:896–902.
- Robinson MD, McCarthy DJ, Smyth GK. edgeR: a Bioconductor package for differential expression analysis of digital gene expression data. Bioinformatics. 2010;26:139–140.
- Farman MR, Hofacker IL, Amman F. MSF: modulated sub-graph finder. F1000Res. 2018;7:1346.
- Conesa A, Gotz S, Garcia-Gomez JM, et al. Blast2GO: a universal tool for annotation, visualization and analysis in functional genomics research. Bioinformatics. 2005;21:3674–3676.
- Benjamini Y, Hochberg Y. Controlling the false discovery rate: a practical and powerful approach to multiple testing. J R Stat Soc B. 1995;57:289–300.
- Supek F, Bosnjak M, Skunca N, et al. REVIGO summarizes and visualizes long lists of gene ontology terms. PLoS One. 2011;6:e21800.
- Bibova I, Skopova K, Masin J, et al. The RNA chaperone Hfq is required for virulence of Bordetella pertussis. Infect Immun. 2013;81:4081–4090.
- Pfaffl MW. A new mathematical model for relative quantification in real-time RT-PCR. Nucleic Acids Res. 2001;29:e45.