
ABSTRACT
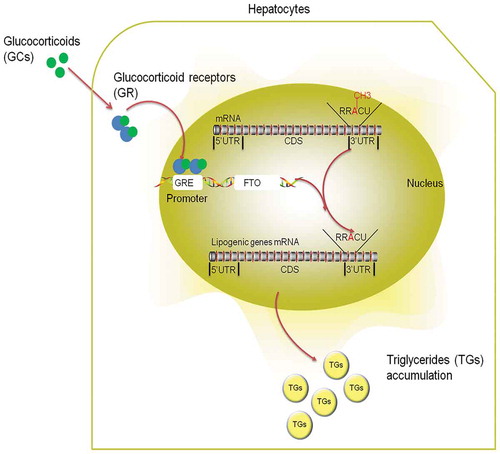
Chronic stress or excessive exposure to glucocorticoids (GC) contributes to the pathogenesis of non-alcoholic fatty liver disease (NAFLD). Glucocorticoid receptor (GR) mediates the action of GC, but its downstream signalling is not fully understood. Fat mass and obesity associated (FTO) protein and its demethylation substrate N6-methyladenosine (m6A) are both reported to participate in the regulation of lipid metabolism, yet it remains unknown whether they are involved in GC-induced hepatic lipid accumulation as new components of GR signalling. In this study, we use both in vivo and in vitro models of GC-induced hepatic lipid accumulation and demonstrate that the activation of lipogenic genes and accumulation of lipid in liver cells are mediated by GR-dependent FTO transactivation and m6A demethylation on mRNA of lipogenic genes. Targeted mutation of m6A methylation sites and FTO knockdown further validated the role of m6A on 3ʹUTR of sterol regulatory element-binding transcription factor 1 and stearoyl-CoA desaturase mRNAs. Finally, FTO knockdown significantly alleviated dexamethasone-induced fatty liver in mice. These results demonstrate a role of GR-mediated FTO transactivation and m6A demethylation in the pathogenesis of NAFLD and provide new insight into GR signalling in the regulation of fat metablism in the liver.
Graphical Abstract
Introduction
Chronic stress or long-term exposure to elevated glucocorticoids (GC) contributes to the development of non-alcoholic fatty liver disease (NAFLD) in human [Citation1,Citation2]. Glucocorticoid receptor (GR) mediates most of the biological actions of GC [Citation3,Citation4]. After binding to GC, GR dissociates from its chaperone protein complex and translocates into the nucleus to regulate gene transcription by binding to the glucocorticoid response elements (GREs) on the control region of its target genes [Citation5]. GR is involved in the transcriptional regulation of lipogenic genes, and is required for GC-induced lipid accumulation [Citation6,Citation7]. However, due to its high complexity, the downstream signalling of GR activation is not fully understood.
Fat mass and obesity associated (FTO) gene is the first GWAS-identified gene [Citation8,Citation9] that links closely to human obesity [Citation10,Citation11]. Also, a potential link between increased FTO expression and hepatic fat deposition is proposed by several studies in high-fat diet-induced rodent NAFLD model [Citation12–Citation14], LPS-induced chicken fatty liver model [Citation15], and non-alcoholic steatohepatitis human patients [Citation16]. Moreover, FTO(-/-) mice show reduced ectopic fat accumulation in the liver [Citation17], whereas FTO overexpression in L02 cells activates lipogenesis [Citation12]. FTO belongs to the AlkB family of non-haem Fe (II)/dioxygenases and acts as a demethylase of N6-methyladenosine (m6A) [Citation18,Citation19], the most prevalent RNA modification in mammalian cells [Citation18,Citation20]. m6A plays an important role in various processes of RNA metabolism, ranging from mRNA splicing and nuclear RNA export to mRNA degradation and translation [Citation21–Citation25]. Most of the m6A functions are executed by m6A reader proteins. For instance, YTHDF2 is shown to regulate mRNA stability [Citation26], while YTHDF1 and YTHDF3 are involved in regulating mRNA splicing or protein translation [Citation27,Citation28]. In a high-fat diet-induced NAFLD mouse model, increased hepatic FTO expression was associated with an overall RNA m6A hypomethylation state [Citation14]. Moreover, FTO regulates lipid accumulation in liver [Citation29] and skeletal muscle cells [Citation30] in association with total RNA m6A demethylation. However, a locus-specific profile of m6A demethylation, especially on mRNA of lipogenic genes, is lacking and it remains unknown whether FTO-dependant m6A demethylation contributes to GC-induced hepatic lipid accumulation as downstream components of GR signalling.
Similar to humans, chickens produce 90% of the lipid in the liver [Citation31,Citation32] and are highly susceptible to GC exposure to develop fatty liver [Citation33,Citation34], thus serve as a good model for studying the pathogenesis of GC-induced NAFLD. Therefore, we use corticosterone (CORT), the main active form of GC in the chicken, or dexamethasone combined with oleic acid (OA/DEX) to establish in vivo and in vitro models of hepatic lipid accumulation, respectively, in the chicken and primary chicken hepatocytes. We first show that augmented GR and FTO expression is associated with activation of lipogenic genes and concurrent demethylation of m6A in total RNA and mRNA of lipogenic genes in CORT-induced chicken NAFLD model. Then we verify these findings in primary chicken hepatocytes and confirm that OA/DEX–induced activation of lipogenic genes is mediated by GR-dependent FTO transactivation and diminished m6A on mRNA of lipogenic genes. Furthermore, targeted mutation of m6A methylation sites and FTO knockdown further validate the role of FTO and m6A on the 3ʹUTR of Srebf1 and Scd mRNA in the regulation of luciferase activities of these genes. Finally, mice injected with vectors expressing shRNAs against FTO before DEX treatment further validate the role of FTO in DEX–induced fatty liver in vivo. The results expand the current knowledge on GR signalling in hepatic lipogenesis and suggest the possibility of controlling liver lipid deposition by targeting FTO or m6A modifications.
Results
Characterization of CORT-induced fatty liver
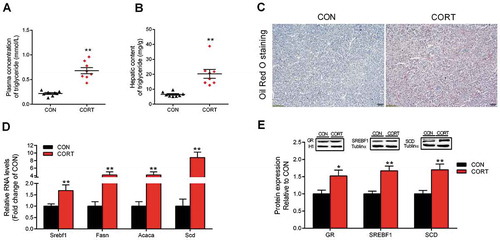
CORT injection significantly increased (P < 0.05) the average daily feed intake (Fig. S1A) but decreased the final body weight (Fig. S1B). CORT-treated chickens had higher liver weight (Fig. S1C) and liver index (Fig. S1D), together with significantly (P < 0.05) elevated plasma () and hepatic () TG concentrations. The same phenomenon was seen in histological sections stained with Oil Red O () showing higher hepatic lipid accumulation in CORT group. Moreover, hepatic mRNA abundance of sterol regulatory element-binding protein-1 (Srebf1), fatty acid synthase (Fasn), acetyl-CoA carboxylase (Acaca) and stearoyl-CoA desaturase (Scd) () was significantly increased (P < 0.05) in response to CORT challenge, so as the protein content of SREBF1 and SCD () in chicken liver. Hepatic protein content of GR was also significantly increased (P < 0.05) after CORT challenge (). These results indicate that CORT-induced hepatic TG deposition is associated with lipogenic genes activation.
Figure 1. Characterization of CORT-induced fatty liver and hepatic expression of lipogenic genes and GR. (A) Plasma content of TG. (B) Hepatic content of TG. (C) Histological sections stained with oil-red, scale bar, 100 um. (D) Hepatic mRNA abundance of genes involved in lipogenesis. (E) Protein expression of GR, SREBF1 and SCD. Values are means ± SEM, *P < 0.05, **P < 0.01 compared with CON (n = 8).
Hepatic protein content of FTO and profile of RNA m6A methylation
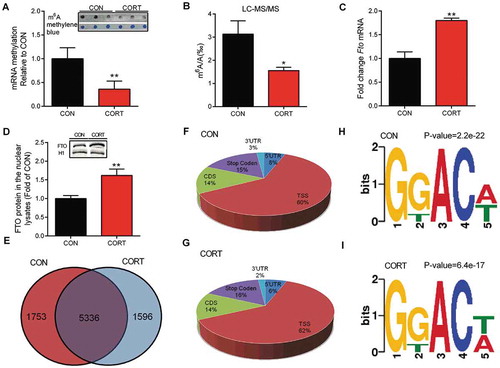
Chronic CORT administration significantly decreased (P < 0.05) mRNA m6A levels () and the m6A/A ratio () in chicken liver. FTO was significantly increased (P < 0.05), at both mRNA () and protein () levels, in the liver in response to CORT challenge. No significant alterations were detected for the RNA methyltransferases METTL3 (Fig. S2A) or WTAP (Fig. S2B) in chicken liver nuclear lysate, yet METTL14 (Fig. S2C) was significantly increased (P < 0.05), in response to CORT challenge. The pattern of m6A distribution was determined with Methylated RNA Immunoprecipitation sequencing (MeRIP-seq) that detected 7089 and 6932 high-confidence m6A peaks, respectively, in the liver of CON and CORT groups, with 5336 peaks detected in both groups (). The differential m6A peaks shown in (1753 in Control and 1596 in CORT) may result from differential expression of the transcripts or from the same transcripts that are differentially methylated. No significant alterations were detected for m6A distribution pattern induced by CORT treatment (). The classic consensus sequence, RRm6ACU (R = A or G), was found in most of the detected narrow peaks (). KEGG pathway enrichment analysis (Fig. S3A, B) reveals that CORT-induced decreases in m6A modification were significantly (P < 0.05) enriched in genes involved in fatty acid metabolism (7 genes), PPAR signalling pathways (9 genes) and fatty acid degradation (11 genes). Gene ontology analysis further suggests that m6A-hypomethylated transcripts were significantly (P < 0.05) enriched in fatty acid metabolic pathways (Fig. S3C). These results indicate that CORT-induced hepatic TG deposition is associated with m6A-hypomethylation on mRNA of lipid metabolic genes.
Figure 2. Hepatic protein content of FTO and profile of RNA m6A methylation in chicken liver. (A-B) Total mRNA methylation in chicken liver were measured by slot blotting and liquid chromatography/tandem triple-quadrupole mass spectrometry, respectively. (C-D) FTO mRNA and protein levels in the liver in response to CORT challenge. H1 were used as a loading control, Values are means ± SEM, *P < 0.05, **P < 0.01, compared with CON (n = 8). (E) Venn diagram showing the overlap of m6A peaks in CON (7089) and CORT (6932) group. There are 5336 common peaks between these two groups. (F-G) Graphical representation of frequency of m6A peaks in five non-overlapping segments in CON and CORT group (TSS: 200 nucleotides downstream of the TSS, stop codon: a 400 nucleotide window centred on the stop codon). m6A peaks were most abundant in CDS and stop codon segments. (H-I) Sequence logo representing the most common consensus motif (RRm6ACU) in the m6A peaks in CON and CORT group. The consensus sequence was detected by DREME (version: 4.10.2), using the 101 nucleotides centred on the summits of called original narrow peaks (n = 3).
Mapping and functional validation of m6A sites in lipogenic genes
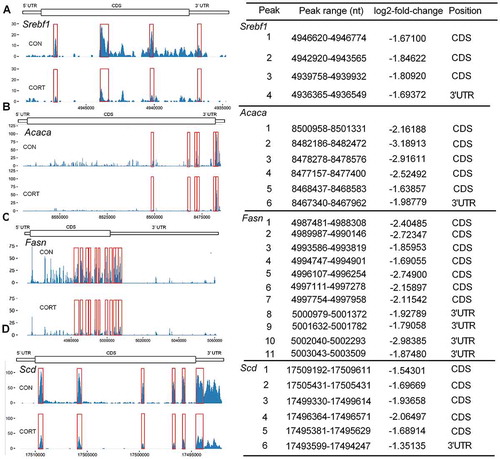
From the m6A-seq dataset (Supplementary Table S2), 4 m6A peaks in Srebf1 mRNA were identified to show significant difference (P < 0.05) between two groups, with one unique peak on 3ʹ UTR (). Six m6A peaks in Acaca mRNA were found to differ significantly (P < 0.05) between groups, with one unique peak on 3ʹ UTR (). For Fasn mRNA, 11 statistically significant (P < 0.05) m6A peaks were found, with 4 peaks on 3ʹ UTR (). Also 6 statistically significant (P < 0.05) m6A peaks were found in Scd mRNA, with one unique peak on 3ʹ UTR ().
Figure 3. Effect of CORT injection on lipogenic genes mRNA m6A levels. Peak calling and differential analysis, peaks were considered if their MACS-assigned FDR value was less than 0.05 with absolute value of log2-fold-change > 1. Schematic diagram showing the mRNA sequences of chicken SREBF1, ACACA, FASN and SCD genes. The y-coordinate represents the absolute number of m6A sites, which was not normalized with the mRNA abundance. The x-coordinate represents the mRNA region of each peaks. The bars under each gene plot represent the location of each peak according to genomic DNA sequence. The value of log2-fold-change, and the position of the peaks on mRNAs are shown on the right side of each panel. The red boxes indicate significantly different m6A peaks on Srebf1, Acaca, Fasn and Scd mRNA. (A-D) Absolute number of m6A sites on Srebf1, Acaca, Fasn and Scd mRNA in CON and CORT groups (n = 3).
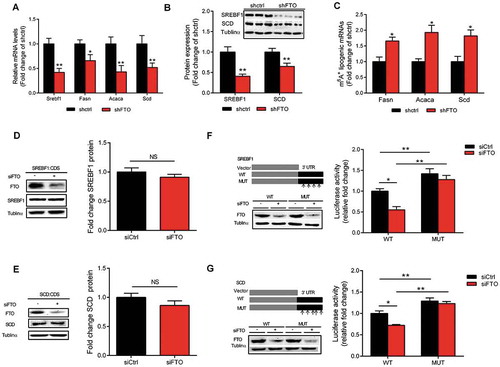
In , we validated the role of m6A in the regulation of lipogenic genes expression, using FTO knockdown approach. Because the transfection efficiency of the primary chicken hepatocytes is very low and there is no chicken hepatocyte cell line available, we used mouse hepatocyte cell line Hepa1-6 and confirmed that FTO knockdown decreased the expression of lipogenic genes at both mRNA () and protein () levels, in association with increased m6A () on the mRNA of these genes. These results not only support our hypothesis that m6A is involved in lipogenic genes regulation based on data obtained from chicken, but also indicate that this phenomenon is not specific or limited to chicken hepatocytes. To further validate the effects of m6A on CDS and 3ʹ UTR of Srebf1 and Scd mRNAs, we used human HEK293 T cell line, a commonly used tool cell line for reporter analysis. This cell line lacks endogenous expression of SREBF1 or SCD, so the results shown are the expression of transfected genes containing CDS or 3ʹ UTR (wild type and mutated) of SREBF1 and SCD linked with eGFP () or luciferase () reporters, respectively, in response to FTO knockdown. GFP-tagged expression constructs containing the entire Srebf1 and Scd coding sequence (CDS) were generated. FTO knockdown did not cause significant alterations in GFP-SREBF1 or GFP-SCD protein content (). Next, Srebf1 and Scd 3ʹ UTR-reporter luciferase assay revealed that FTO knockdown decreased the luciferase activity of the constructs containing the Srebf1 and Scd 3ʹ UTR (). Moreover, mutation constitutively increased luciferase activity of the constructs and rendered resistance to the effect of FTO knockdown (). To validate the effect of m6A modification on the stability of lipogenic gene transcripts, luciferase reporter plasmids containing the wild-type and mutated 3ʹ UTR of Srebf1 and Scd mRNAs were generated and a time-course of mRNA decay was plotted (Fig. S4). Mutation of the m6A sites significantly decreased the m6A levels on Srebf1 (Fig. S4A) and Scd (Fig. S4B) mRNAs, which was associated with increased RNA stability (Fig. S4C, D). These data suggesting that the mutation prevented methylation and thereby increased the stability of the luciferase-Srebf1 and Scd 3ʹ UTR fusion mRNAs.
Figure 4. Mapping and functional validation of m6A sites in lipogenic genes. (A) The mRNA expression of Srebf1, Fans, Acaca and Scd in Hepa1-6 cells treated with scramble control or FTO shRNAs. (B) The protein content of SREBF1 and SCD in Hepa1-6 cells treated with scramble control or FTO shRNAs. (C) The percentage of Fasn, Acaca and Scd mRNA with methylation in Hepa1-6 cells treated with scramble control or FTO shRNAs. (D-E) Western blotting of PEGFP-SREBF1 and PEGFP-SCD in 293 T seeded in 12-well plates and transfected with 50 ng of SREBF1-CDS or SCD-CDS plasmid and treated with siCtrl or FTO siRNAs (n = 3). (F-G) Relative activity of the wild-type or mutant SREBF1 or SCD 3′ UTR firefly luciferase reporter in 293 T cells treated with siCtrl or FTO siRNAs. Values are means ± SEM, *P < 0.05, **P < 0.01, NS, no significant change. (n = 6).
Characterization of TG accumulation in primary chicken hepatocytes
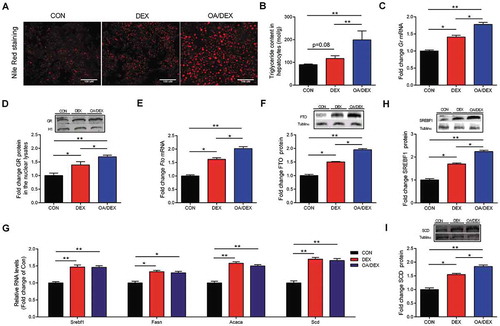
Primary culture of chicken hepatocytes was treated with DEX only or DEX combined with OA (OA/DEX), respectively, in vitro. DEX only tended to increase (P = 0.08) TG accumulation in hepatocytes (), which was associated with significant activation of GR expression at both mRNA () and protein () levels. Meanwhile, FTO was up-regulated at both mRNA () and protein levels (), together with the lipogenic genes including Srebf1, Fasn, Acaca and Scd (). DEX combined with OA (OA/DEX) significantly augmented DEX–induced TG accumulation (), as well as the expression of GR and FTO. Interestingly, lipogenic genes were further up-regulated at the level of protein (, I), but not mRNA (), when OA was added to DEX treatment. These results indicate synergistic effects of GCs and fatty acids on hepatocellular lipid accumulation in vitro. Taking into account the increased plasma TG concentration in CORT-treated chickens, we treated the primary cultured hepatocytes with OA and DEX in combination, and found synergistic effects of GC and fatty acids on hepatocellular lipid accumulation in vitro. Therefore, cells were treated with OA/DEX in further mechanistic studies to better simulate the scenario in vivo.
Figure 5. Characterization of TG accumulation in primary chicken hepatocytes. (A) Primary hepatocytes stained with nile red, scale bar, 100 um. (B) TG content in in CON, DEX or OA/DEX treated hepatocytes. (C) Gr mRNA expression. (D) GR protein content in the nuclear lysates in CON, DEX or OA/DEX treated hepatocytes. (E) FTO mRNA and (F) protein expression in CON, DEX or OA/DEX treated hepatocytes. (G) The mRNA expression of Srebf1, Fasn, Acaca and Scd in CON, DEX or OA/DEX treated hepatocytes. (H-I) Protein content of SREBF1 and SCD in CON, DEX or OA/DEX treated hepatocytes. Tubulinα was used as a loading control. Values are means ± SEM, *P < 0.05, **P < 0.01 (n = 3).
Role of GR in the regulation of FTO expression
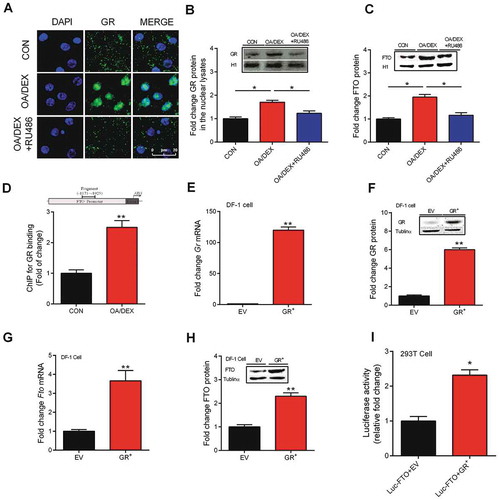
RU486, an antagonist of GR, was able to prevent OA/DEX–induced GR nuclear translocation (), thereby decreasing GR protein in the nuclear lysates (). Concurrently, OA/DEX–induced increase of FTO protein content in whole cell lysates of primary chicken hepatocytes was also restored by RU486 (). A ChIP assay detected a significant increase of GR binding to Fto gene promoter sequence that contains predicted glucocorticoid receptor element (). In , we used chicken DF-1 cell line to validate the role of GR in FTO transactivation. Because we transfected a chicken GR over-expression plasmid to test the endogenous FTO expression, a cell line of the same species, i.e. chicken DF-1 cell line, is better suited for the purpose. While in , we constructed a luciferase reporter system to further confirm the effect of ectopic GR on the expression of luciferase driven by FTO promoter. For this, HEK293 T cells are commonly used as tool cells. GR over-expression in DF-1 cells () significantly activated Fto expression at both mRNA () and protein () levels. Furthermore, 293 T cells co-transfected with pGL3 luciferase plasmid containing chicken FTO promoter and pEGFP-N1 plasmid expressing chicken GR (GR+) demonstrated significantly higher activity of luciferase reporter gene driven by chicken FTO promoter (). These results indicate that GR can induce FTO transactivation via directly binding to GRE on FTO gene promoter.
Figure 6. Role of GR in the regulation of FTO expression. (A) Representative images of hepatocytes labelled with GR (green). Nuclei were counterstained with DAPI (blue), scale bar, 20 um. (B-C) Protein content of GR and FTO in the nuclear lysates in VEH, OA/DEX or OA/DEX+RU486 treated hepatocytes. (D) GR binding to FTO gene promoter regions in CON or OA/DEX treated hepatocytes. (E-F) GR mRNA and protein content in DF-1 cells transfected with the empty plasmid PEGFP-N1 (EV) or the recombinant PEGFP-N1 plasmid expressing GR (GR+). (G-H) FTO mRNA and protein expression in DF-1 cells transfected with the empty plasmid PEGFP-N1 (EV) or the recombinant PEGFP-N1 plasmid expressing GR (GR+). (I) 293 T cells seeded in 12-well plates were transfected with the PGL3 luciferase vector fused with FTO promoter. The FTO promoter reporter were determined 48 hr in the present of empty PEGFP-N1 plasmid (EV) or recombinant PEGFP-N1 plasmid expressing GR (GR+) treatment. The FTO promoter activity was also normalized by co-transfection with the b-actin-Renilla luciferase reporter. Values are means ± SEM, *P < 0.05, **P < 0.01 (n = 3).
Role of FTO in the regulation of lipogenic genes expression
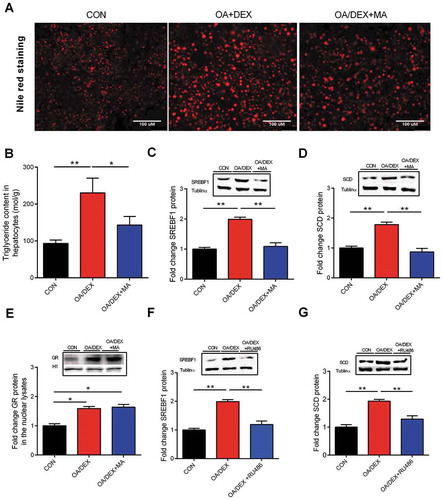
Meclofenamic acid (MA), a FTO inhibitor, was able to prevent OA/DEX–induced increase of total TG content in primary hepatocytes as shown in Nile red staining () and biochemical analysis (). Concurrently, OA/DEX–induced upregulation of SREBF1 () and SCD () protein content was significantly (P < 0.05) prevented by FTO inhibition. However, FTO inhibition did not prevent the OA/DEX–induced upregulation of GR protein content in the nuclear lysate of primary hepatocytes (). Nevertheless, RU486 was able to prevent OA/DEX–induced upregulation of SREBF1 () and SCD () protein content in primary hepatocytes. These data indicate that GR-mediated FTO transactivation induces lipogenic genes activation.
Figure 7. Role of FTO in the regulation of lipogenic gene expression. (A) Primary hepatocytes stained with nile red, scale bar, 100 um. (B) TG content in CON, OA/DEX or OA/DEX+MA treated hepatocytes. (C-E) Protein content of SREBF1, SCD and GR in CON, OA/DEX or OA/DEX+MA treated hepatocytes. (F-G) Protein content of SREBF1 and SCD in CON, OA/DEX or OA/DEX+RU486 treated hepatocytes. Values are means ± SEM, *P < 0.05, **P < 0.01 (n = 3).
Alterations of m6A on mRNA of lipogenic genes
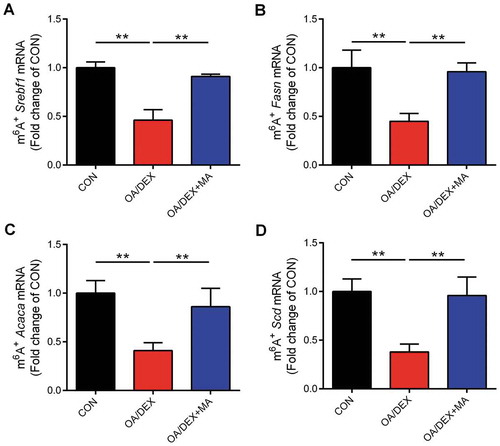
To investigate the mechanism by which FTO regulates lipogenic genes expression, we performed a Methylated RNA Immuniprecipitation (MeRIP) assay to detect OA/DEX–induced alterations in m6A modification on mRNAs of lipogenic genes and the impact of FTO inhibitor MA. Total cellular RNA was immunoprecipitated with an antibody that recognizes m6A, and the immunoprecipitated RNA was subjected to RT-PCR to amplify 3ʹ UTR regions, which contains m6A consensus sequence, 5ʹ-RRACU-3ʹ, of lipogenic genes. OA/DEX treatment significantly decreased (P < 0.05) the level of m6A on the mRNA of Srebf1 (), Fasn (), Acaca () and Scd () genes in primary hepatocytes. MA treatment was able to alleviate OA/DEX–induced m6A hypomethylation on Srebf1, Fasn, Acaca and Scd mRNAs in primary hepatocytes. Alterations of m6A modification on mRNAs of lipogenic genes were inversely linked to the expression of lipogenic genes, which is consistent with the notion that m6A on 3ʹ UTR regions of mRNAs often facilitates their decay and thus inhibits translation. These data indicate that mRNAs of lipogenic genes are subject to FTO-dependent m6A demethylation under OA/DEX treatment.
Figure 8. Alterations of m6A on mRNA of lipogenic genes. (A-D) The percentage of Srebf1, Fasn, Acaca and Scd mRNA with methylation in CON, OA/DEX or OA/DEX+MA treated hepatocytes. Values are means ± SEM, *P < 0.05, **P < 0.01 (n = 3).
Knockdown of FTO alleviates dexamethasone-induced fatty liver in mice
To further validate the role of FTO in the pathogenesis of GC-induced fatty liver in vivo, we injected mice with vectors expressing scrambled shRNA or shRNA targeted against FTO (shFTO) before DEX injection at a concentration of 50 mg/kg everyday for 3 days to induce fatty liver. Oil Red O staining of liver sections showed that DEX–induced lipid accumulation in the liver was significantly alleviated in shFTO group (Fig. S5A). Hepatic TG content (Fig. S5B) and the liver weight (Fig. S5C) followed the same pattern. FTO knockdown in mouse liver was confirmed by significant (P < 0.05) down-regulation of Fto mRNA (Fig. S5D). Concurrently, FTO knockdown prevented DEX–induced up-regulation of hepatic lipogenic genes (Fig. S5E–H). These results provide strong evidence that FTO is also involved in DEX–induced fatty liver in mice.
Discussion
Glucocorticoids have been reported to activate hepatic lipogenesis and stimulate TGs accumulation in rats [Citation35] and chickens [Citation36]. In this study, CORT and DEX injection induced fatty liver in chickens and in mice, respectively, in vivo. In primary cultured chicken hepatocytes, DEX alone was not sufficient to establish a model of lipid accumulation in vitro. This is because CORT treatment in vivo causes hyperlipidaemia, which indicates increased fat mobilization and higher supply of substrates required for enhanced hepatic de novo lipogenesis and NAFLD progression [Citation37]. Therefore, treating primary cultured hepatocytes with OA and DEX in combination would better simulate GC-induced hyperlipidaemia and hepatic lipid deposition in vivo.
The metabolic effects of GC are mediated by intracellular GR, which translocates to the nucleus and binds to the GREs to regulate the transcription of its target genes [Citation38]. Previous studies have reported that DEX stimulates the expression of lipogenic genes via direct GR binding at their promoters in HepG2 cells [Citation39]. Also, long-term GC exposure induces fat accumulation in mouse adipocytes via GR-dependent miR-27b transactivation [Citation40]. Consistent with previous results, we demonstrated that OA/DEX–induced activation of lipogenic genes can be reversed by the GR antagonist RU486, suggesting a role of GR in OA/DEX–induced hepatic lipid accumulation. In addition to the direct transactivation effects of GR on lipogeneic genes, we found that GR is involved in FTO transactivation and post-trancriptional regulation of lipogenic genes through m6A modification of their mRNAs. Four approaches are used to validate the role of GR in FTO transactivation. Firstly, OA/DEX-stimulated FTO expression was rescued by RU486; Secondly, the direct binding of GR to the predicted GRE on chicken FTO promoter was detected to be significantly higher in OA/DEX-treated chicken hepatocytes; Thirdly, cells transfected to over-express GR showed an up-regulation of FTO expression; and fourthly, we used a luciferase reporter gene assay to validate the effect of GR on chicken FTO gene transactivation directly. GR overexpression significantly increased the activity of the luciferase reporter gene driven by chicken FTO promoter.
The dynamics of RNA modification has become an attractive topic in the field of metabolic diseases. Although a number of studies described an association between TGs accumulation and global RNA demethylation [Citation14,Citation30], locus-specific alterations of m6A modification on mRNA of lipogenic genes, in relation with lipid accumulation, have not been reported. In this study, we show that OA/DEX–induced hepatic lipid accumulation is mediated by FTO-dependent m6A demethylation on mRNA of lipogenic genes. Using MeRIP-seq analysis, we first described changes of m6A on the mRNA of lipogenic genes in a chicken model of NAFLD in vivo. Furthermore, we verified the role of m6A on CDS and 3ʹ UTR in lipogenic gene activation, using site mutations combined with FTO knockdown in a Luciferase reporter system. Although both CDS and 3ʹUTR of lipogenic gene mRNAs were detected lower m6A level in fatty liver, only m6A sites located in 3ʹ UTR are critically involved in FTO-mediated activation of Srebf1 and Scd genes. This is in line with previous reports that ALKBH5 demethylates Foxm1 nascent transcripts and enhances Foxm1 expression in glioblastoma [Citation24], and ALKBH5 decreases Nanog mRNA m6A levels and increases Nanog expression in breast cancer stem cells [Citation41]. It is reported that YT521-B homology domain family (YTHDF) proteins, the readers of m6A, can induce deadenylation and degradation of m6A-containing RNAs in mammalian cells [Citation42]. In this study, lipogenic genes mRNA demethylation is associated with lipogenic genes activation at both mRNA and protein levels. Furthermore, we demonstrate that diminished m6A contributes to lipogenic genes activation via improved mRNA stability in chicken models of liver lipid accumulation.
Conclusions
In conclusion, GR-mediated transactivation of FTO and m6A demethylation on the mRNA of lipogenic genes contribute to lipogenic gene activation in CORT-induced chicken fatty liver and OA/DEX–induced lipid accumulation in primary chicken hepatocytes. These findings add FTO and m6A as new components of GR signalling in the regulation of fat metablism in the liver and shed new light on developing effective therapeutic strategies in the treatment of GC-induced NAFLD.
Materials and methods
Ethics approval and consent to participate
The experimental protocol was approved by the Animal Ethics Committee of Nanjing Agricultural University, with the project number 31672512. The sampling procedures complied with the ‘Guidelines on Ethical Treatment of Experimental Animals’ (2006) No. 398 set by the Ministry of Science and Technology, China.
Animals and treatment
Sixteen 49-day-old male Rugao yellow-feathered chickens (582 ± 4.26 g, ranging from 560 g to 610 g) raised in the experimental farm of Poultry Institute of Yangzhou, Jiangsu, China were randomly divided into two groups (8 chickens per group). Chickens were subjected to either vehicle (CON) or corticosterone (CORT) treatment with daily subcutaneous injection of solvent (15% ethanol) or corticosterone (C2505, Sigma-Aldrich, USA) at a dose of 4.0 mg/kg body mass for 7 days (twice per day, 8:00 ~ 9:30 and 16:00 ~ 17:30). The dose was determined according to a previous publication [Citation43]. Growth performance and daily feed intake were recorded. After 7 days of treatment, all of the chickens were weighed and killed by rapid decapitation which is considered to be acceptable for euthanasia of birds according to American Veterinary Medical Association (AVMA) Guidelines for the Euthanasia of Animals: 2013 Edition. Blood samples were taken and plasma was separated and stored at −20°C. Liver (without the gall bladder) samples were rapidly frozen in liquid nitrogen and kept at −80°C for further analysis.
Chicken hepatocyte isolation, cell culture and exposure conditions
Eighteen-day-old chicken embryos were purchased from the Poultry Institute of Yangzhou, Jiangsu, and China. Hepatocytes were isolated as described previously [Citation44]. Chicken embryonic primary hepatocytes were cultured in medium 199 (Sigma-Aldrich) containing 10% FBS, 100 U/mL penicillin/streptomycin, 10 nM insulin for 48 h. The medium was then changed to medium199 containing 10% FBS. Then cells were divided into control (CON), DEX (1 µM) and OA/DEX (DEX, 1 µM; OA, 0.5 mM) groups and cultured in respective media for 24 h. After cultured for 24 h, cells were collected. In further mechanistic studies, cells were divided into CON and OA/DEX groups to simulate the in vivo situation of increased plasma TG concentration in CORT-treated chickens.
Determination of triglyceride content in liver, plasma and hepatocytes
Triglyceride (TG) content in plasma (E1003), liver (E1013) and primary hepatocyte (E1013) were measured by using commercial TG assay kits (Applygen Technologies Inc., China) following the manufacturer’s instructions.
RT-PCR and Western blotting
RT-PCR and Western blotting were performed as previously described [Citation45]. All primers (Table S1) were synthesized by Generay Biotech (Shanghai, China).
Immunofluorescence Staining
Primary hepatocytes were fixed in 4% neutral paraformaldehyde for 30 min, treated with PBS containing 0.5% Triton X-100 at room temperature for 1 h, blocked with 10% goat serum and incubated with primary antibody GR (the chicken GR antibody was raised and verified in Jinsirui, Shen Zhen, China) overnight at 4°C. The Alexa Fluor® 488 conjugated donkey anti-rabbit IgG (ab150073, Abcam, USA) was used as the second antibody. DAPI was used as a marker for cell nuclei.
m6A methylation Assays
To perform mRNA methylation assays, high-quality mRNA was isolated from frozen liver tissues by using commercial mRNA enrichment kits (Selleck, b25602). The total mRNA m6A levels in chicken liver were determined using slot blotting and liquid chromatography/tandem triple-quadrupole mass spectrometry, respectively.
Chromatin immunoprecipitation (ChIP) assay
ChIP analysis was performed according to our previous publication [Citation45]. The putative GREs in FTO promoter were predicted using http://gene-regulation.com/pub/programs.html. Primers covering these sites are listed in Supplementary Table S1.
MeRIP-Sequencing and MeRIP-PCR
MeRIP analysis was performed according to previous publication [Citation46]. NEBNext Ultra Directional RNA Library Prep Kit for Illumina (NEB) was used to construct the libraries from immunoprecipitated RNA. Sequencing was performed on the Illumina Hiseq 2500 platform as previously described [Citation47].
For m6A-PCR, total RNA was isolated from chicken embryo primary hepatocytes. Total RNA samples were chemically fragmented to approximately 100 nt in size, ethanol-precipitated and separated on a 1.5% agarose gel. m6A immunoprecipitation was performed as described before. m6A+ RNA was purified by phenol/chloroform extraction and analysed by RT-PCR. The primers used for detection for lipogenic genes m6A+ mRNA were synthesized by Generay Biotech (Table S1).
Plasmids Transfections and Luciferase Reporter Assay
Three cell lines (Hepa1-6, H293 T and DF-1) were cultured as previously described. All cell lines were maintained at 37°C in a humidified incubator containing 5% CO2. Transfections were conducted following the protocol of Lipofectamine® 2000 Transfection Reagent (11668-019, Invitrogen, US) and Opti-MEM (31985, Gibco, USA) according to the manufacturer’s protocol. Hepa1-6 cells transfected with the scramble control were named as shCtrl, and those transfected with the shRNAs (shRNA set against Mouse FTO) named as shFTO. shRNA targeting FTO sequences are listed below. FTO (mouse): 5ʹ-GCTGAGGCAGTTCTGGTTTCA-3ʹ; Scramble control sequence: 5ʹ-AACAGTCGCGTTTGCGACTGG-3ʹ. The shRNA targeting sequences were cloned into DECIPHER Prsi9-U6-(sh)-UbiC-TagRFP-2A-Puro (Cellecta, CA). DF-1 cells transfected with the empty plasmid PEGFP-N1 were named as EV, and those transfected with the recombinant PEGFP-N1 plasmid expressing GR named as GR+. siRNA against FTO and a negative control (siCtrl) were designed and produced by RiboBio Company (Guangzhou, China). FTO siRNA (human) sequences are listed below. FTO siRNA1: GCAGAATGTCTGTGACGAT; FTO siRNA2: CCTGAACACCAGGCTCTTT. The FTO siRNA was a mixture of FTO siRNA1 and FTO siRNA2. Twenty-four hours before transfection, cells were plated without any antibiotics. Then 100 nM specific siRNA or siCTRL was transfected into 293 T cells using lipofectamine 2000 (Invitrogen, USA).
In luciferase Reporter Assay, 293 T cells seeded in 12-well plates were transfected with the pmirGLO luciferase vector fused with or without the wild-type or mutated SREBP1 and SCD-3ʹ UTR. Mutation of SREBP1 and SCD-3ʹ UTR were generated by AibiMeng Company (Nanjing, China). Transfection efficiency was quantified by co-transfection with an actin promoter-driven Renilla luciferase reporter. The activities of firefly luciferase and Renilla luciferase in each well were calculated by a dual-luciferase reporter assay system (Promega, USA). The ratios between the SREBP1 or SCD-3ʹ UTR reporter and Renilla control were determined 48 h after siRNA (siFTO) treatment. The relative luciferase activity of the SREBF1 or SCD-3ʹ UTR luciferase activities were further normalized to that in cells transfected with the firefly luciferase vector control under the same treating conditions. DF-1 cells were co-transfected with Pgl3 luciferase plasmid containing chicken FTO promoter and PEGFP-N1 plasmid expressing chicken GR (GR+) using lipofectamine 2000 (Invitrogen, USA). The luciferase reporter activity was determined 48 h after transfected.
ShRNA-mediated FTO knockdown in DEX-induced mouse fatty liver
Mouse experiment was conducted in accordance with the guidelines of the National Institutes of Health, USA and approved by the Animal Use and Care Committee of Washington State University (Permit No. 04158-021). To achieve liver FTO conditional knockout, the shRNAs (shRNA set against Mouse FTO) were delivered into C57BL/6 mouse liver using the hydrodynamic tail vein injection method. Briefly, the mice were randomized to three groups (CON, DEX and shFTO+DEX groups, 6 mice in each group) with equal body weight and injected with 100 μg of scramble control (for CON and DEX groups) and FTO shRNA (for shFTO+DEX group), respectively, in 100 µL of FuGene 6 transfection reagent at intervals of 4 days. After 4th injection, 18 male mice in each group were subjected to either vehicle (for CON group) or dexamethasone (for DEX and shFTO+DEX groups) treatment with daily intraperitoneally injection of solvent or DEX in a dose of 50 mg/kg body mass for 3 days. The dose was determined according to a previous publication [Citation48]. At the end of study, body weight was recorded after an overnight fasting and mice were sacrificed by CO2 asphyxiation. Samples of mouse livers (5 mm × 6 mm size) were preserved in 4% paraformaldehyde (PFA) for histological analysis, while remaining samples (100–200 mg) were immediately frozen in liquid nitrogen for further analysis.
Statistical analysis
Descriptive statistics was performed to check the normality and homogeneity of variances before using parametric analyses. Log10 transformation was performed before statistical analysis when the data distribution was not normal. Differences between two groups or multiple groups were analysed by T-Test and ANOVA using SPSS 20.0 software (SPSS Inc., Chicago, IL, USA), respectively. Data are expressed as means ± SEM. The differences were considered statistically significant when P < 0.05. For peak calling and differential analysis, sequence data were analysed according to the procedure previously described [Citation47]. Briefly, the BWA with MEN algorithm was run to align read sequences of IP samples to the Gallus_gallus-5.0 assembly of the chicken genome. Non-unique reads with MAPQ less than 13 were discarded from downstream analysis. The peak-caller MACS was used for peak detection with default settings, and the parameter of effective genome size was adjusted to the calculated transcriptome size. Peaks were considered if their MACS-assigned FDR value was less than 0.05 with absolute value of log2-fold-change > 1. The fold-change cut-offs are > 2 (increase) or < 0.5 (decrease). For motif analysis, the consensus m6A motif sequences were analysed as previously described [Citation49]. The 100 nucleotide sequences centred on all the summits of m6A peaks were used for the analysis.
Availability of Data and Materials
All data that support the findings of this study are included in the manuscript and supplementary information.
Supplemental Material
Download Zip (3.3 MB)Disclosure Statement
No competing interests are declared.
Supplementary Materials
Supplemental data for this article can be accessed here.
Additional information
Funding
References
- Targher G, Bertolini L, Rodella S, et al. Associations between liver histology and cortisol secretion in subjects with nonalcoholic fatty liver disease. Clin Endocrinol (Oxf). 2006;64:337–341.
- Candia R, Riquelme A, Baudrand R, et al. Overexpression of 11beta-hydroxysteroid dehydrogenase type 1 in visceral adipose tissue and portal hypercortisolism in non-alcoholic fatty liver disease. Liver Int. 2012;32:392–399.
- Petta I, Dejager L, Ballegeer M, et al. The interactome of the glucocorticoid receptor and its influence on the actions of glucocorticoids in combatting inflammatory and infectious diseases. Microbiol Mol Biol Rev. 2016;80:495–522.
- Hayashi R, Wada H, Ito K, et al. Effects of glucocorticoids on gene transcription. Eur J Pharmacol. 2004;500:51–62.
- Rogatsky I, Wang JC, Derynck MK, et al. Target-specific utilization of transcriptional regulatory surfaces by the glucocorticoid receptor. Proc Natl Acad Sci U S A. 2003;100:13845–13850.
- Wang JC, Gray NE, Kuo T, et al. Regulation of triglyceride metabolism by glucocorticoid receptor. Cell Biosci. 2012;2:19.
- Marino JS, Stechschulte LA, Stec DE, et al. Glucocorticoid receptor beta induces hepatic steatosis by augmenting inflammation and inhibition of the peroxisome proliferator-activated receptor (PPAR) alpha. J Biol Chem. 2016;291:25776–25788.
- Frayling TM, Timpson NJ, Weedon MN, et al. A common variant in the FTO gene is associated with body mass index and predisposes to childhood and adult obesity. Science. 2007;316:889–894.
- Scuteri A, Sanna S, Chen WM, et al. Genome-wide association scan shows genetic variants in the FTO gene are associated with obesity-related traits. PLoS Genet. 2007;3:e115.
- Loos RJ, Bouchard C. FTO: the first gene contributing to common forms of human obesity. Obes Rev. 2008;9:246–250.
- Liu SJ, Tang HL, He Q, et al. FTO is a transcriptional repressor to auto-regulate its own gene and potentially associated with homeostasis of body weight. J Mol Cell Biol. 2019;11:118–132.
- Guo J, Ren W, Li A, et al. Fat mass and obesity-associated gene enhances oxidative stress and lipogenesis in nonalcoholic fatty liver disease. Dig Dis Sci. 2013;58:1004–1009.
- Zhang J, Li S, Li J, et al. Expression and significance of fat mass and obesity associated gene and forkhead transcription factor O1 in non-alcoholic fatty liver disease. Chin Med J (Engl). 2014;127:3771–3776.
- Chen J, Zhou X, Wu W, et al. FTO-dependent function of N6-methyladenosine is involved in the hepatoprotective effects of betaine on adolescent mice. J Physiol Biochem. 2015;71:405–413.
- Zhang Y, Guo F, Zhao R. Hepatic expression of FTO and fatty acid metabolic genes changes in response to lipopolysaccharide with alterations in m(6)A modification of relevant mRNAs in the chicken. Br Poult Sci. 2016;57:628–635.
- Lim A, Zhou J, Sinha RA, et al. Hepatic FTO expression is increased in NASH and its silencing attenuates palmitic acid-induced lipotoxicity. Biochem Biophys Res Commun. 2016;479:476–481.
- Ikels K, Kuschel S, Fischer J, et al. FTO is a relevant factor for the development of the metabolic syndrome in mice. PloS One. 2014;9:e105349.
- Jia G, Fu Y, Zhao X, et al. N6-methyladenosine in nuclear RNA is a major substrate of the obesity-associated FTO. Nat Chem Biol. 2011;7:885–887.
- Li Y, Wu K, Quan W, et al. The dynamics of FTO binding and demethylation from the m(6)A motifs. RNA Biol. 2019;16:1179–1189.
- Meyer KD. m(6)A-mediated translation regulation. Biochim Biophys Acta Gene Regul Mech. 2019;1862:301–309.
- Roundtree IA, Luo GZ, Zhang Z, et al. YTHDC1 mediates nuclear export of N(6)-methyladenosine methylated mRNAs. Elife. 2017;6:e31311.
- Zhao X, Yang Y, Sun BF, et al. FTO-dependent demethylation of N6-methyladenosine regulates mRNA splicing and is required for adipogenesis. Cell Res. 2014;24:1403–1419.
- Alarcon CR, Lee H, Goodarzi H, et al. N6-methyladenosine marks primary microRNAs for processing. Nature. 2015;519:482–485.
- Zhang S, Zhao BS, Zhou A, et al. m(6)A demethylase ALKBH5 maintains tumorigenicity of glioblastoma stem-like cells by sustaining FOXM1 expression and cell proliferation program. Cancer Cell. 2017;31:591–606.e596.
- Zhou J, Wan J, Gao X, et al. Dynamic m(6)A mRNA methylation directs translational control of heat shock response. Nature. 2015;526:591–594.
- Wang X, Lu Z, Gomez A, et al. N6-methyladenosine-dependent regulation of messenger RNA stability. Nature. 2014;505:117–120.
- Xiao W, Adhikari S, Dahal U, et al. Nuclear m(6)A reader YTHDC1 regulates mRNA splicing. Mol Cell. 2016;61:507–519.
- Zhang Y, Wang X, Zhang X, et al. RNA-binding protein YTHDF3 suppresses interferon-dependent antiviral responses by promoting FOXO3 translation. Proc Natl Acad Sci U S A. 2019;116:976–981.
- Kang H, Zhang Z, Yu L, et al. FTO reduces mitochondria and promotes hepatic fat accumulation through RNA demethylation. J Cell Biochem. 2018;119:5676–5685.
- Wu W, Feng J, Jiang D, et al. AMPK regulates lipid accumulation in skeletal muscle cells through FTO-dependent demethylation of N6-methyladenosine. Sci Rep. 2017;7:41606.
- Leveille GA, Romsos DR, Yeh Y, et al. Lipid biosynthesis in the chick. A consideration of site of synthesis, influence of diet and possible regulatory mechanisms. Poult Sci. 1975;54:1075–1093.
- Yeh YY, Leveille GA. Hepatic fatty acid synthesis and plasma free fatty acid levels in chicks subjected to short periods of food restriction and refeeding. J Nutr. 1970;100:1389–1397.
- Cai Y, Song Z, Zhang X, et al. Increased de novo lipogenesis in liver contributes to the augmented fat deposition in dexamethasone exposed broiler chickens (Gallus gallus domesticus). Comp Biochem Physiol C Toxicol Pharmacol. 2009;150:164–169.
- Kafri I, Rosebrough RW, McMurtry JP, et al. Corticosterone implants and supplemental dietary ascorbic acid effects on lipid metabolism in broiler chicks. Poult Sci. 1988;67:1356–1359.
- Zhao N, Yang S, Jia Y, et al. Maternal betaine supplementation attenuates glucocorticoid-induced hepatic lipid accumulation through epigenetic modification in adult offspring rats. J Nutr Biochem. 2017;54:105–112.
- Hu Y, Sun Q, Liu J, et al. In ovo injection of betaine alleviates corticosterone-induced fatty liver in chickens through epigenetic modifications. Sci Rep. 2017;7:40251.
- Berlanga A, Guiu-Jurado E, Porras JA, et al. Molecular pathways in non-alcoholic fatty liver disease. Clin Exp Gastroenterol. 2014;7:221–239.
- Schmid W, Strahle U, Schutz G, et al. Glucocorticoid receptor binds cooperatively to adjacent recognition sites. Embo J. 1989;8:2257–2263.
- Kim M, Lee HA, Cho HM, et al. Histone deacetylase inhibition attenuates hepatic steatosis in rats with experimental Cushing’s syndrome. Korean J Physiol Pharmacol. 2018;22:23–33.
- Kong X, Yu J, Bi J, et al. Glucocorticoids transcriptionally regulate miR-27b expression promoting body fat accumulation via suppressing the browning of white adipose tissue. Diabetes. 2015;64:393–404.
- Zhang C, Samanta D, Lu H, et al. Hypoxia induces the breast cancer stem cell phenotype by HIF-dependent and ALKBH5-mediated m(6)A-demethylation of NANOG mRNA. Proc Natl Acad Sci U S A. 2016;113:E2047–E2056.
- Du H, Zhao Y, He J, et al. YTHDF2 destabilizes m(6)A-containing RNA through direct recruitment of the CCR4-NOT deadenylase complex. Nat Commun. 2016;7:12626.
- Luo JW, Zhou ZL, Zhang H, et al. Bone response of broiler chickens (Gallus gallus domesticus) induced by corticosterone. Comp Biochem Physiol A Mol Integr Physiol. 2013;164:410–416.
- Su G, Letcher RJ, Farmahin R, et al. Photolysis of highly brominated flame retardants leads to time-dependent dioxin-responsive mRNA expression in chicken embryonic hepatocytes. Chemosphere. 2017;194:352–359.
- Hu Y, Sun Q, Hu Y, et al. Corticosterone-Induced Lipogenesis Activation and Lipophagy Inhibition in Chicken Liver Are Alleviated by Maternal Betaine Supplementation. J Nutr. 2018;148:316–325.
- Dominissini D, Moshitch-Moshkovitz S, Salmon-Divon M, et al. Transcriptome-wide mapping of N(6)-methyladenosine by m(6)A-seq based on immunocapturing and massively parallel sequencing. Nat Protoc. 2013;8:176–189.
- Shen L, Liang Z, Gu X, et al. N(6)-methyladenosine RNA modification regulates shoot stem cell fate in arabidopsis. Dev Cell. 2016;38:186–200.
- Du WW, Liu F, Shan SW, et al. Inhibition of dexamethasone-induced fatty liver development by reducing miR-17-5p levels. Mol Ther. 2015;23:1222–1233.
- Luo GZ, MacQueen A, Zheng G, et al. Unique features of the m6A methylome in Arabidopsis thaliana. Nat Commun. 2014;5:5630.