
 ?Mathematical formulae have been encoded as MathML and are displayed in this HTML version using MathJax in order to improve their display. Uncheck the box to turn MathJax off. This feature requires Javascript. Click on a formula to zoom.
ABSTRACT
Accumulating evidence indicates that lncRNAs can interact with miRNAs to regulate target mRNAs through competitive interactions. However, this mechanism remains largely unexplored in laryngeal squamous cell carcinoma (LSCC). In this study, transcriptome-wide RNA sequencing was performed on 3 pairs of LSCC tissues and adjacent normal tissues to investigate the expression profiles of lncRNAs, miRNAs and mRNAs, with differential expression of 171 lncRNAs, 36 miRNAs and 1709 mRNAs detected. Seven lncRNAs, eight mRNAs and three miRNAs were identified to be dysregulated in patients’ tissues by using qRT-PCR. GO and KEGG pathway enrichment analyses were performed to elucidate the potential functions of these differentially expressed genes in LSCC. Subsequently, a ceRNA (lncRNA-miRNA-mRNA) network including 4631 ceRNA pairs was constructed based on predicted miRNAs shared by lncRNAs and mRNAs. Cis- and transregulatory lncRNAs were analysed by bioinformatics-based methods. Importantly, mRNA-related ceRNA networks (mRCNs) were further obtained based on potential cancer-related coding genes. Coexpression between lncRNAs and downstream mRNAs was used as a criterion for the validation of mRCNs, with the ZNF561-AS1-miR217-WNT5A and SATB1-AS1-miR1299-SAV1/CCNG2/SH3 KBP1/JADE1/HIPK2 ceRNA regulatory interactions determined, followed by experimental validation after siRNA transfection. Moreover, ceRNA activity analysis revealed that different activities of ceRNA modules existing in specific pathological environments may contribute to the tumorigenesis of LSCC. Consistently, both downregulated SATB1-AS1 and ZNF561-AS1 significantly promoted laryngeal cancer cell migration and invasion, indicating their important roles in LSCC via a ceRNA regulatory mechanism. Taken together, the results of this investigation uncovered and systemically characterized a lncRNA-related ceRNA regulatory network that may be valuable for the diagnosis and treatment of LSCC.
Introduction
Laryngeal squamous cell carcinoma (LSCC) is the second most common malignant neoplasm of the head and neck. Current treatments for LSCC include laryngectomy, radiotherapy and chemotherapy [Citation1]. Despite the development of improved strategies and more accurate therapies, the 5-year survival rate of LSCC has unfortunately decreased from 66% to 63% over the past 40 years [Citation1]. In addition, most patients present with advanced stages at diagnosis, which leads to poor prognoses [Citation2]. Although many molecules have been investigated to date [Citation3,Citation4], the mechanism underlying the development and progression of LSCC remains largely unknown. Accordingly, there is a need for further research and deeper insight into the biological mechanisms underlying LSCC carcinogenesis.
Increasing evidence indicates that noncoding RNAs (ncRNAs), including microRNAs (miRNAs), long noncoding RNAs (lncRNAs), and circular RNAs, play crucial roles in tumorigenesis [Citation5–Citation7], and characterization of the epigenetic regulatory roles of ncRNAs in laryngeal cancers has been addressed [Citation8–Citation10]. Among these ncRNAs, lncRNAs and miRNAs have garnered much attention, becoming the focus of research in this field. miRNAs are small ncRNA molecules that function in RNA silencing and post-transcriptional regulation of gene expression by binding to the 3ʹUTRs of target mRNAs [Citation11].
lncRNAs are defined as a type of non-protein-coding RNAs that are longer than 200 nucleotides, and these molecules have variable biological functions in the process of tumorigenesis [Citation12]. Accumulating evidence suggests that ncRNAs perform complex modulatory functions by interacting with each other and creating a dynamic regulatory crosstalk network [Citation13,Citation14]. Intriguingly, an increasing number of studies have revealed that by binding to miRNA response elements (MREs), lncRNAs function as competing endogenous RNAs (ceRNAs), modulating the target mRNAs of miRNAs [Citation15,Citation16]. Overall, lncRNAs perform complicated regulatory functions in pathological processes by acting as sponges of miRNAs [Citation14,Citation17,Citation18].
Recent studies have uncovered the important roles of many genes in ceRNA networks in human disease. For example, PTEN was identified as a potent tumour suppressor that is frequently disrupted in multiple cancers, exerting tumour-suppressive effects via ceRNA-mediated mechanisms in multiple biological processes, including proliferation, apoptosis, and invasion [Citation19]. In gastric cancer, CLDN4 has been identified as a regulatory target of the ncRNA network by ceRNA-mediated invasion [Citation7]. Such findings highlight the importance of ceRNA network construction, whereby a global view of lncRNA-related crosstalk may help researchers gain a comprehensive insight into the pathological process of tumorigenesis. Given the promising role of lncRNA-related ceRNAs in cancer development, global regulatory lncRNA-related ceRNA interaction and crosstalk networks have recently been built using computational, experimental, and bioinformatics methods [Citation20,Citation21]. In addition, many bioinformatics tools, such as starBase, DIANA-LncBase, and RegRNA2.0, have emerged for predicting lncRNA-miRNA interactions [Citation22–Citation24]. Nonetheless, the ceRNA crosstalk network of lncRNAs in laryngeal carcinoma remains largely unknown. In general, comprehensive elucidation of the ceRNA interactions in LSCC may aid the identification of potentially useful molecules for the diagnosis and treatment of LSCC.
In this study, we constructed a global lncRNA-related triple network (lncRNA-miRNA-mRNA) based on transcriptome-wide RNA-seq data, including lncRNA, miRNA and mRNA expression profiles. lncRNAs and mRNAs found to be significantly differentially expressed were verified by reverse transcription-polymerase chain reaction (RT-PCR). Gene Ontology (GO) and Kyoto Encyclopaedia of Genes and Genomes (KEGG) pathway analyses were conducted for putative ceRNA networks to elucidate the potential functions of ceRNAs relevant to LSCC. The regulatory coding pattern near lncRNAs was also established. Furthermore, predicted ceRNA networks were verified based on coexpression correlations detected by RT-PCR, and specific ceRNAs in the triple network in LSCC were characterized. Our study may help researchers gain a comprehensive view of important molecules and identify novel mechanisms underlying laryngeal carcinoma pathogenesis and new targets for the treatment of LSCC.
Materials and methods
Patients and samples
Three pairs of LSCC tissues and adjacent nontumor tissues to be used for RNA sequencing were obtained within 10 minutes after surgical resection, with the consent of the patients and the approval of the Ethics Committee of the First Affiliated Hospital (Ethics Committee approval No. 2019146), Sun Yat-sen University. The samples were immediately transferred to liquid nitrogen and stored at −80°C before use. All specimens were pathologically verified. Postoperative histopathological diagnoses for all specimens were confirmed by the First Affiliated Hospital, Sun Yat-sen University.
RNA extraction
Total RNA was extracted from the LSCC and adjacent nontumor tissue samples using TRIzol reagent (Invitrogen, USA) according to the manufacturer’s instructions. The quality of the RNA was initially evaluated using a NanoDrop spectrophotometer (NanoDrop, USA).
Transcriptome-wide RNA-seq
mRNA and lncRNA library construction
A total of 10 µg of RNA per sample was used for RNA sequencing. First, ribosomal RNA was removed from total RNA to obtain the maximum residual ncRNA. The obtained rRNA-free RNA was randomly broken into short fragments, and the cDNA fragments were used as templates for synthesizing first-strand cDNA with random hexamers. The second strands were synthesized in a reaction with buffer, dNTPs, RNase H and polymerase I. Subsequently, the library fragments were purified with a QIAquick PCR Kit followed by end-repair, A-tailing modification and adaptor ligation. The second strands were then degraded enzymatically using uracil-N-glycosylase (UNG), and cDNA fragments ranging from 150–200 bp in length were selected. PCR was performed using high-fidelity DNA polymerase, universal PCR primers, and an index (X) primer. The PCR products were purified and prepared for RNA sequencing.
miRNA library construction
Total RNA was extracted from the samples with TRIzol reagent, and fragments 18–30 nucleotides in length were isolated by agarose gel electrophoresis. A 3′ linker was added, and ligation fractions 36–44 nt in length were extracted by 15% denaturing PAGE. A 5′ linker was added, followed by RT-PCR. The reverse transcription product was separated by 3.5% agarose gel electrophoresis, and fragments that were 140–160 bp in length were selected. Finally, the quality of the library was evaluated using a StepOnePlus PCR System (Applied Biosystems Inc., CA, USA).
Sequencing
After library construction, RNA sequencing for both lncRNA/mRNA and miRNA was performed using the Illumina HiSeqTM 2500 platform.
Analysis method for lncRNA and mRNA data
Quality control and transcriptome assembly
First, the raw sequencing reads were processed to obtain clean data by base calling transformation. In this step, high-quality clean reads were obtained by removing reads containing adapters, poly-N reads (with an N ratio greater than 10%) and low-quality reads (a proportion of bases with a Phred base quality score>20). The data quality was also evaluated by assessing the base composition and value distribution. Second, the transcriptome data were aligned to the reference genome using TopHat2 after removing the reads mapping to ribosomes [Citation25]. All mapped reads were assembled by Cufflinks using reference annotation-based transcripts (RABTs) [Citation26]. Finally, the assembly data were merged using Cuffmerge, and potential assembly errors were removed for further differential analysis.
lncRNA identification and prediction of lncRNA target genes
lncRNAs were classified according to the following steps: (1) those with transcript length ≥200 and exon number ≥2 were selected; (2) known non-lncRNAs were filtered out; and (3) the selected lncRNAs were classified using the Coding-Non-Coding-Index (CNCI) (v2) with the default parameters and the Coding Potential Calculator (CPC) [Citation27,Citation28]. Transcripts with coding potential were filtered out to select candidate sets of lncRNAs.
To identify new transcripts, all reconstructed transcripts were aligned to the reference genome and divided into twelve categories using Cuffcompare. Transcripts with one of the classcodes u, I, j, x, c, e, or o were defined as novel transcripts. We used the following parameters to identify reliable novel genes: the length of the transcript was longer than 200 bp, and the exon number was more than 2. Novel transcripts were then aligned to the Nr and KEGG databases to obtain protein functional annotations.
To identify cis-acting lncRNAs (lncRNAs that can regulate neighbouring coding genes), coding genes within the regions 10 kb upstream and downstream of the lncRNAs were selected, and their functions were analysed. We then calculated the Pearson correlation coefficients between the differentially expressed lncRNAs and identified coding genes. The lncRNAs were identified as trans-acting lncRNAs when the absolute correlation was greater than 0.95 between the lncRNAs and selected coding genes.
miRNA data analysis
Quality control and miRNA identification
To obtain clean reads, the raw reads obtained from sequencing were further filtered by removing the following: (1) low-quality reads containing more than one low-quality (Q-value≤20) base or containing unknown nucleotides (N); (2) reads without 3ʹ adapters; (3) reads containing 5ʹ adapters; (4) reads containing 3ʹ and 5ʹ adapters and lacking a small RNA fragment between them; (5) reads containing a poly-A sequence in the small RNA fragment; and (6) reads shorter than 18 nt (not include adapters). The clean reads (sRNAs) were then compared against known ncRNAs (i.e., rRNAs, tRNAs, small nuclear RNAs (snRNAs) and small nucleolar RNAs (snoRNAs) in the Rfam (v10.1) and GenBank (Release 209.0) databases to identify and remove other ncRNAs. Clean reads that mapped to exons/introns or repeat sequences when aligned to the human genome were also excluded.
Mapping to the reference genome and target gene prediction
After the tags were annotated and filtered as mentioned above, searches in the miRBase database (Release 21) were performed for the remaining sRNAs to identify known miRNAs (existing miRNAs). Novel miRNAs were predicted using Mireap_Version0.2 software. To identify potential target genes of the miRNAs, we searched for conserved miRNA-binding sites using Rahbar (version 2.1.2) [Citation29] + svm light (version 6.01) [Citation30], Miranda (version 3.3a) [Citation31] and TargetScan (Version 7.0) [Citation32]. Genes selected by both methods were considered predicted miRNA target genes.
Analysis of differentially expressed lncRNAs, mRNAs, and miRNAs
Cuffdiff (v2.1.1) software was employed to calculate fragments per kilobase of exon per million mapped fragments (FPKM) values for the lncRNAs and coding mRNAs (genes) and the transcripts per million (TPM) values for the miRNAs in both libraries [Citation33]. The differentially expressed transcripts of coding RNAs and lncRNAs were analysed. To identify differentially expressed genes (DEGs) across samples or groups, the edgeR package (http://www.r-project.org/) was used, and we identified significant DEG transcripts as those with a fold change ≥ 2 and a false discovery rate (FDR) <0.05. The DEGs were then subjected to GO function and KEGG pathway enrichment analyses.
qRT-PCR assay
To validate the credibility and reproducibility of the RNA sequencing data, quantitative real-time PCR (qRT-PCR) was performed for selected DEGs using LSCC tissues. Briefly, total RNA was extracted from LSCC tissues using TRIzol® reagent (Invitrogen, Carlsbad, CA, USA). Reverse transcription was performed using the Prime ScriptTM RT Master Mix Kit (TAKARA BIO INC, Japan) according to the manufacturer’s protocol. Primer Premier 5.0 and miRprimer2 were used to design specific primers for lncRNAs (mRNAs) and miRNAs, respectively [Citation34,Citation35] (Supplementary Table S1). The lncRNA and mRNA expression levels were normalized to the level of the GAPDH housekeeping gene, and miRNA expression levels were normalized to the U6 snoRNA level. Real-time PCR was performed using the SYBR® Premix Ex Taq™ Kit (TAKARA BIO INC, Japan) with the LightCycler® 480 system (Roche Applied Science, Pennsburg, Germany). Relative gene expression levels were calculated by the 2−ΔΔCt method. Student’s t-tests were performed, and p-value < 0.05 was considered significant. The values are expressed as the means ± SDs.
ceRNA network construction
Differently expressed lncRNAs were scanned to identify conserved MREs using the Mireap, miRanda and TargetScan prediction tools, which were all employed to predict miRNA-mRNA interactions based on target sites. After predicting lncRNA-miRNA and miRNA-mRNA interactions, ceRNA networks were constructed based on shared miRNAs with which both lncRNAs and mRNAs interact. We then used a hypergeometric cumulative distribution function test to determine potential ceRNAs of the predicted ceRNA networks [Citation21]. In this method, the p-values for the potential ceRNA pairs were calculated using the following formula [Citation22]:
where n represents the total number of shared miRNAs; U is the total number of miRNAs in the human reference genome; M represents the total number of miRNAs interacting with lncRNAs; and N represents the total number of miRNAs interacting with mRNAs. The calculated p-value was subjected to FDR correction, with FDR ≤ 0.05 as the threshold. Potential ceRNA pairs were defined at a p-value < 0.05.
Target genes and ceRNA network functional enrichment analysis
GO enrichment analysis data were obtained by mapping DEGs to GO terms in the GO database (http://www.geneontology.org/). KEGG pathway analysis was performed by mapping DEGs to the KEGG database.
In addition, GO and KEGG pathway analyses for the ceRNA networks based on mRNAs were performed by the same method. Significantly enriched GO terms and enriched metabolic pathways or signal transduction pathways associated with the DEGs/ceRNA networks were defined by a hypergeometric test. The formula used to calculate the p-value was as follows:
where N is the number of all genes with a GO annotation/KEGG annotation; n is the number of DEGs in N; M is the number of all genes that are annotated to the specific GO terms/pathway; and m is the number of DEGs in M. The calculated p-value was subjected to FDR correction, with FDR ≤ 0.05 as the threshold. GO terms meeting this condition were defined as significantly enriched GO terms among DEGs. Pathways meeting this condition were defined as significantly enriched pathways involving DEGs.
Validation of ceRNAs based on coexpression patterns and regulatory relationships
Given that the expression levels of ceRNAs that compete for the same miRNAs are positively correlated [Citation16], we further examined the ceRNA efficacy from the networks based on lncRNA-mRNA expression correlation. Each ceRNA pair (lncRNA-miRNA-mRNA) with a correlation coefficient higher than 0.5 was defined as a ceRNA triplet; important ceRNAs were highlighted via this coexpression pattern analysis method. In addition, potential ceRNA patterns were compared between LSCC tissues and nontumor tissues based on correlation coefficients. A ceRNA pair (lncRNA-miRNA-mRNA) with a correlation coefficient ≥ 0.5 determined by qRT-PCR was defined as a final ceRNA triplet. To further verify the putative ceRNAs, siRNAs targeting specific lncRNAs were transfected into LSCC cell lines, including SNU899 and SNU1066. After siRNA transfection, the expression of downstream mRNAs corresponding to lncRNAs was detected by qRT-PCR to explore the regulatory relationships between lncRNAs and mRNAs, with positive correlations defining ceRNAs.
Wound healing assay
A total of 5 × 10⁴ SNU1066 cells/well were seeded in 24-well plates and cultured overnight in a humidified incubator with 5% CO2 at 37°C. Then, cells were transfected with siRNA and starved for 12 h followed by scratching the cell monolayer with a 200 μl pipette tip. Images were then taken under an inverted microscope at 0 h, 24 h, and 48 h after the wounding to measure the migration ability. Migration distance was measured by ImageJ (version 1.46 r) software. The migration rate was calculated by the formula migration rate = migration distance/original wound width x 100%.
Cell invasion and migration assays
For the cell invasion assay, Matrigel (Corning, New York, USA) was diluted 1:8 in RPMI-1640 culture medium. Diluted Matrigel Matrix solution (40 μl) was added onto the upper side of the 8 μm-polycarbonate transwell chamber (Corning, New York, USA). After being dried at 37°C for 4 h, 5 × 10⁴ cells in 200 μl RPMI-1640 containing 0.1% BSA were seeded into the transwell chamber. A total of 600 μl RPMI-1640 culture medium supplemented with 10% FBS was added into the lower chamber. After being incubated in 5% CO2 at 37°C for 48 h, cells on the upper chamber were removed with a cotton swab. The filter was fixed with 4% paraformaldehyde for 20 min followed by staining with 0.05% crystal violet for 30 min. Stained cells were imaged in five independent 200x magnification fields under an inverted microscope and counted with ImageJ (version 1.46 r) software. For the cell migration assay, the procedures were the same as for the invasion assay except that the transwell chamber was not coated with Matrigel before cell seeding into the transwell chamber.
siRNA transfection
The siRNAs were designed and synthesized by Shanghai GenePharma Co., Ltd. (Shanghai, China). The siRNA transfection was performed using the HiPerFect transfection reagent (Qiagen, Hilden, Germany) according to the manufacturer’s instructions.
Results
Differentially expressed lncRNA, mRNA and miRNA profiles validated by RNA sequencing
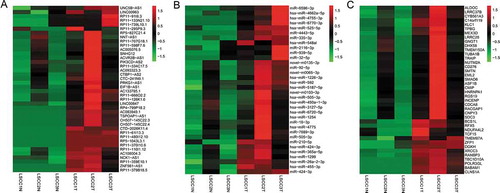
cDNA and sRNA libraries of 3 pairs of LSCC and adjacent tissues were sequenced. In total, we acquired 69.2 GB of 100-bp paired-end reads for lncRNAs and mRNAs and 32.73 GB of 50-bp single-end reads for miRNAs. Ultimately, 64.48 GB and 31.53 GB of high-quality clean reads were obtained after filtering for lncRNAs/mRNAs and miRNAs, respectively. We identified a total of 171 lncRNAs (fold change ≥1.5, P < 0.05 and FDR < 0.05) and 1709 mRNAs in the lncRNA/mRNA libraries (fold change ≥2.0, P < 0.05 and FDR < 0.05) (Supplementary Figure S1 A-B; Supplementary table S5); the most significantly differentially expressed of these are shown in ,. Among these lncRNAs, 70 and 101 lncRNAs were upregulated and downregulated, respectively. We also obtained 36 miRNAs, among which 15 were upregulated and 21 were downregulated (fold change ≥2.0, p < 0.05 and FDR < 0.05) ().
Figure 1. Heat maps of differentially expressed lncRNA (A), mRNA (B) and miRNA (C) profiles. The heat maps describe the most significantly changed lncRNAs (top 40), mRNAs (top 40) and miRNAs (top 40) in 3 pairs of LSCC tissues compared with adjacent nontumor tissues, with fold change ≥1.5 for lncRNAs, fold change ≥2.0 for mRNAs and miRNAs, p < 0.05 and FDR < 0.05. The expression values are depicted in accordance with the colour scale. The intensity increases from green to red. LSCC: laryngeal squamous cell carcinoma; T: tumour tissues. N: adjacent nontumor tissues.
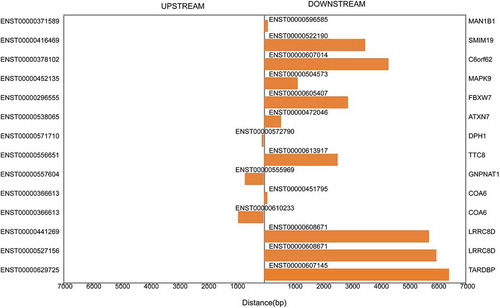
By scanning shared conserved miRNA target sites using Rahbar + svm light, miRanda and TargetScan, 2384 mRNAs were predicted as target genes of the differentially expressed miRNAs. We searched the coding genes within the regions 10 kb upstream and downstream of the differentially expressed lncRNAs and found 14 cis-regulating lncRNAs (). In addition, 592 trans-acting lncRNAs were identified based on the absolute correlation value between the lncRNAs and their putative coding genes (Supplementary Table S2).
Figure 2. Cis-regulation by lncRNAs of nearby coding genes. The distances between lncRNAs and their cis-regulated coding genes within the regions 10 kb upstream and downstream are described. The left vertical axis shows the sequence names of the coding genes, and the right vertical axis exhibits the gene symbols of the sequences. The middle vertical axis presents the cis-regulatory lncRNAs.
GO and KEGG pathway analyses of the differentially expressed mRNAs were performed (Figure S1, Figure S2). The results of pathway enrichment analysis of the DEGs revealed some clusters of GO categories and functional pathways such as pyrimidine metabolism, RNA transport, the T cell receptor signalling pathway and renal cell carcinoma.
Validation of differentially expressed lncRNAs and mRNAs
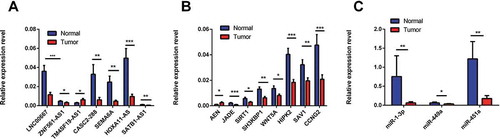
A total of 11 lncRNAs, 11 mRNAs and 5 miRNAs were chosen for qRT-PCR validation of the RNA sequencing results in 36 pairs of LSCC and adjacent tissues. TM4SF19-AS1 was identified as an upregulated lncRNA in LSCC tissue compared to adjacent tissues, whereas LNC00667, HOXA11-AS1, SEMA6A, CASC2-288, SATB1-AS1, and ZNF561-AS1 were downregulated (). Among mRNAs, ANE was upregulated and JADE, SIRT1, SH3KBP1, WNT5A, HIPK2, SAV1, CCNG2 were downregulated in LSCC tissue compared with adjacent tissue (). Three miRNAs, namely, miR-1-3p, miR-449a, and miR-451a, were validated as being downregulated in LSCC tissue compared with adjacent tissue by real-time PCR (). These results were consistent with the sequencing results. Therefore, aberrant expression of these lncRNAs, miRNAs and mRNAs may be involved in the pathogenesis of LSCC.
Figure 3. Validation of differentially expressed lncRNAs (A), mRNAs (B), miRNAs (C) by quantitative RT-PCR. The relative expression levels of seven lncRNAs (A), eight mRNAs (B) and three miRNAs (C) are shown by comparing tumour tissues with normal tissues via qRT-PCR. The data are presented as the mean ±SEM, n = 36. *p < 0.05, **p < 0.01, ***p < 0.001..
Construction of the ceRNA network
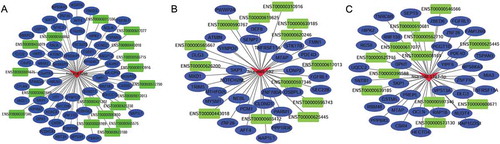
According to the ceRNA hypothesis, ceRNAs compete for a certain proportion of the miRNAs to exert regulatory functions. We constructed global lncRNA-miRNA-mRNA ceRNA regulatory networks by calculating the likelihood of differentially expressed ceRNAs competing for the same MREs based on the hypergeometric test (p-value<0.05), and 4631 regulatory triplets (lncRNA-miRNA-mRNA) were obtained (Figure S4, Supplementary Table S4). Among the global ceRNA networks, subnetworks with hub miRNAs, including miR-1299, miR-592 and miR-5187-5p, are shown in . Of these ceRNAs, upregulated lncRNAs potentially promote mRNA expression by sponging MREs for miRNAs, but downregulated lncRNAs may inhibit mRNA expression by releasing MREs. For instance, TMEM51-AS1 was identified as a ceRNA of ARID4A targeting hsa-miR-1254, and SOCS5-203 may regulate AFF4 by binding to hsa-miR-1299. In this complex ceRNA regulatory network, hsa-miR-1299-, hsa-miR-592- and hsa-miR-6720-5p-related ceRNA triplets, which exhibited the densest connection to surrounding targets, were identified as hub clusters. This finding may provide novel insight into the role in carcinogenesis played by hsa-miR-1299, which has been shown to be widely involved in the pathological processes of cancers such as colon cancer, hepatocellular carcinoma (HCC) and clear cell renal cell cancer.
Figure 4. ceRNA networks in laryngeal squamous cell carcinoma. The ceRNA network was constructed based on the shared MREs of lncRNAs and mRNAs predicted by the Mireap, miRanda and TargetScan software programs, followed by determination using a hypergeometric cumulative distribution function test. This figure shows three networks containing miR-1299 ceRNA networks (A), miR-592 ceRNA networks (B) and miR-5187-5p ceRNA networks (C), which are hub miRNAs in the global ceRNA networks.
To investigate the reliability of the potential ceRNA network, we compared the identified ceRNA networks in Figure S4 with those identified in the starBase database (version 3.0), which decodes RNA-RNA interactions from large-scale CLIP-Seq data [Citation22]. By comparison, a total of 36 ceRNA triplets were identified as being matched with those from the starBase database, with the lncRNA CCDC18-AS1, KCNQ1OT1, hsa-miR-1299, and hsa-miR-592 as the hub genes ().
Table 1. Identified ceRNAs matched with those in the starBase database (version 3.0).
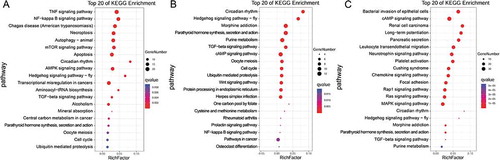
To further investigate ceRNAs in LSCC, we performed functional enrichment analysis based on DEGs in the ceRNA networks. KEGG pathway analyses of the selected miR-1299, miR-592 and miR-5187-5p ceRNA networks revealed clustering of categories such as TNF signalling pathway, NF-kappa B signalling pathway, Hedgehog signalling pathway, cAMP signalling pathway and renal cell carcinoma ().
Figure 5. KEGG pathway analysis of ceRNA networks. The KEGG pathway analysis results corresponding to miR-1299 ceRNA networks (A), miR-592 ceRNA networks (B) and miR-5187-5p ceRNA networks (C), based on coding genes in the networks, are presented.
Validation of mRCNs and characterization of specific ceRNA triplets based on correlation analysis
Regarding the ceRNA mechanism, it is well known that lncRNAs can exert regulatory functions by modifying mRNA expression through competition for a certain proportion of miRNAs [Citation15]. Under these circumstances, lncRNAs perform regulatory functions via mRNAs indirectly, with mRNAs serving as effectors, lncRNAs as regulators, and miRNAs as crosstalk mediators. Hence, investigating the regulatory potential of lncRNA ceRNAs based on mRNA-related functions may help elucidate the carcinogenesis of LSCC.
Several classic cancer-related terms were identified by GO term and KEGG pathway functional analyses of mRNAs in the ceRNA network (Supplemental Table S3). Next, mRNAs occurring in at least two selected pathways were chosen as effectors for functional analysis of potential ceRNAs, and mRNA-related ceRNA networks (mRCNs) for LSCC were further constructed.
Because their existence is indicated by a positive correlation between the expression levels of ceRNA and mRNA pairs [Citation15,Citation36], mRCNs were further validated by calculating Pearson correlation coefficients of coexpression based on the real-time PCR results. In this case, potential mRCNs were validated when the Pearson correlation coefficient between the expression levels of the mRNA and lncRNA was greater than 0.5 (p > 0.5) [Citation36]. Accordingly, two sets of mRCNs were verified, namely, the ZNF561-AS1-miR217-WNT5A triplet and lncRNA SATB1-AS1-related ceRNA clusters, which target SAV1, CCNG2, SH3KBP1, JADE1 and HIPK2 by interacting with miR-1299 (). In addition to the correlation-based verifications, we further investigated the regulatory relationship between lncRNAs and mRNAs. The expression of WNT5A, SAV1/CCNG2 and SH3KBP1/JADE1/HIPK2 was detected by qRT-PCR after siRNA-ZNF561-AS1 and siRNA-SATB1-AS1 were transfected into both the SNU899 and SNU1066 LSCC cell lines. As shown in , HIPK2, SH3KBP1, and CCNG2 were significantly downregulated in both the SNU899 and SNU1066 LSCC cell lines transfected with siRNA-SATB1-AS1, while JADE1 showed a significant decrease in only the SNU899 cell line and SAV1 showed a significant decrease in only the SNU1066 cell line (,). Notably, the WNT5A level decreased dramatically when ZNF561-AS1 was downregulated (,). Together, these experiments demonstrated the potential of the two subsets of ceRNA networks, including ZNF561-AS1-miR217-WNT5A and SATB1-AS1-miR-1299-SAV1-JADE1/HIPK2/SH3KBP1/SAV1/CCNG2.
Figure 6. Experimentally validated mRNA-related ceRNA triplets in LSCC. Two sets of mRNA-related ceRNA networks were experimentally validated by determining the coexpression coefficients of lncRNAs and mRNAs using qRT-PCR, including lncRNA SATB1-AS1-related ceRNA clusters, which target SAV1, CCNG2, SH3KBP1, JADE1 and HIPK2 by interacting with miR-1299 (A) and the ZNF561-AS1-miR217-WNT5A triplet (B).
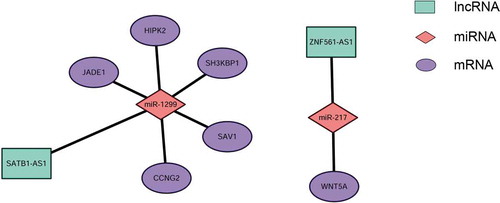
Figure 7. Coexpression validation of ceRNA triplets after siRNA transfection in cell lines. SATB1-AS1-miR-1299-SAV1-JADE1/HIPK2/SH3KBP1/SAV1/CCNG2 was validated by qRT-PCR measurement after siRNA- SATB1-AS1 transfection in the SNU899 and SNU1066 LSCC cell lines (A-B). ZNF561-AS1-miR217-WNT5A was validated by qRT-PCR after siRNA-ZNF561-AS1 transfection in the SNU899 and SNU1066 LSCC cell lines (C-D).
As recent studies have demonstrated that aberrant competitive abilities and activities of ceRNAs may contribute to pathological processes [Citation36,Citation37], we further investigated ceRNA activity in LSCC and matched noncancer tissue samples via coexpression pattern analysis. Interestingly, mRCNs exhibited different expression patterns in LSCC tissues compared with noncancer tissues. For example, the competitive activity of mRCNs, including SATB1-AS1-miR1299-JADE1, SATB1-AS1-miR1299-HIPK2 and ZNF561-AS1-miR217-WNT5A, was observed in LSCC tissues but not in adjacent tissues; in contrast, competitive activity of SATB1-AS1-miR1299-SAV and SATB1-AS1-miR1299-SH3KBP1 was observed in both LSCC tissues and noncancerous tissues. Additionally, the SATB1-AS1-miR1299-CCNG2 triplet showed a lower level of competitive activity in noncancer tissues than in LSCC tissues ().
Figure 8. Characterization of different ceRNA patterns in LSCC tissue and nontumor tissue. Putative mRNA-related ceRNA triplets were further validated by calculating the correlation coefficients of lncRNAs and their target coding genes. SATB1-AS1-miR1299-SAV, SATB1-AS1-miR1299-SH3KBP1, SATB1-AS1-miR1299-JADE1, SATB1-AS1-miR1299-CCNG2, SATB1-AS1-miR1299-HIPK2 and ZNF561-AS1-miR217-WNT5A were observed to be ceRNAs in LSCC tissue (A-F). The SATB1-AS1-miR1299-SAV and SATB1-AS1-miR1299-SH3KBP1 triplets were also observed to have ceRNA abilities in nontumor cancer (G-H). The SATB1-AS1-miR1299-CCNG2 triplet had a relatively low level of competitive activity in noncancer tissues (I); SATB1-AS1-miR1299-JADE1, SATB1-AS1-miR1299-HIPK2 and ZNF561-AS1-miR217-WNT5A had no competitive activity in noncancer tissues (J-L). The ceRNA pair (lncRNA-miRNA-mRNA) with a correlation coefficient ≥ 0.5 determined by qRT-PCR was defined as the final ceRNA triplet.
Downregulated SATB1-AS1 and ZNF561-AS1 contribute to LSCC cell migration and invasion
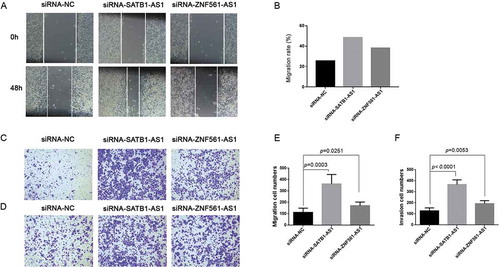
Epithelial-mesenchymal transition (EMT), a fatal pathological process affecting the outcomes of multiple cancers, has been indicated to play important roles in LSCC [Citation38]. To further address the significance of the correlation-based ceRNA regulatory networks, functional experiments were performed. The LSCC cell line SNU1066 transfected with either siRNA-SATB1-AS1 or siRNA-ZNF561-AS1 had increased migration ability compared with the siRNA negative control group (–,). In addition, the transwell invasion assay indicated that laryngeal cancer cells gained more invasive ability when either SATB1-AS1 or ZNF561-AS1 was downregulated (,). These results showed that aberrant expression of SATB1-AS1 and ZNF561-AS1 contributes to the EMT process of LSCC, indicating that the SATB1-AS1 and ZNF561-AS1 regulatory ceRNA networks may play important roles in LSCC.
Figure 9. Downregulated SATB1-AS1 or ZNF561-AS1 contributes to the EMT process in LSCC.Wound healing assay was performed in SNU1066 cells transfected with siRNA-NC (siRNA-negative control), siRNA-SATB1-AS1 or siRNA-ZNF561-AS1 (A). The migration rate in the wound healing assay (B). Transwell migration assay (C) and the corresponding migrated cell numbers (E) after siRNA transfection. Transwell invasion assay (D) and the corresponding invaded cell numbers (F) after SNU1066 cells were transfected with siRNA-NC, siRNA-SATB1-AS1 or siRNA-ZNF561-AS1.
Discussion
LSCC remains a major threat to human health and the second most common malignant neoplasm of the head and neck. Despite the development of diagnostic and treatment strategies, the prognosis of patients with LSCC remains poor, mostly due to local or distant metastasis and recurrence [Citation1]. A large number of studies have recently revealed that lncRNAs are commonly dysregulated in carcinomas, suggesting that these RNAs play critical roles in tumorigenesis and progression [Citation7,Citation12,Citation17]. However, little is known about the role of lncRNAs in LSCC, yet comprehensively identifying the lncRNA profile and investigating the mechanism of action involving lncRNAs might provide new insight into the pathogenesis of LSCC.
In this study, we examined the complexity of the transcriptome, including lncRNAs, miRNAs and mRNAs, of LSCC using high-throughput RNA sequencing. In total, differential expression of 171 lncRNAs, 36 miRNAs and 1709 mRNAs were detected. As shown in Figure S1, unlike mRNAs which showed a different pattern of clusters between the tumours and normal samples, lncRNAs did not show apparent differences of clusters. One reason that can explain this finding is the heterogeneity of the different clinical samples and the sequencing of a small number of samples in our study. To the best of our knowledge, our study is the first to comprehensively investigate the transcriptome lncRNA, miRNA, and mRNA profiles in LSCC. Finally, six differentially expressed lncRNAs, eight differentially expressed mRNAs and three miRNAs were validated by qRT-PCR, and the findings were consistent with the RNA sequencing results. Even though some of the miRNAs computationally identified by RNA sequencing were validated by qRT-PCR, further investigation is still needed to elucidate their roles and mechanism in LSCC. For example, the biological roles of miR-451a, which was identified as a downregulated miRNA in LSCC and has been reported in recent studies, are still unclear in LSCC and further experiment are needed [Citation39,Citation40].
KEGG pathway analysis based on the differentially expressed mRNAs indicated that several pathways may play important roles in LSCC pathogenesis, including tight junctions, the calcium signalling pathway, the Rap 1 signalling pathway and the Hippo signalling pathway; thus, the DEGs identified may play crucial roles in LSCC pathogenesis by regulating these associated pathways. Moreover, according to GO annotation results, the most significant GO terms were cellular process, cell, cell part and binding, indicating that aberrant mRNA expression contributes to the biological process of carcinogenesis in LSCC. This functional annotation provides bioinformatics-based evidence regarding the potential underlying mechanism driving LSCC tumorigenesis. Recent studies have suggested that lncRNAs may affect biological behaviour by regulating neighbouring or distantly located genes in a cis- or trans-regulatory manner [Citation41,Citation42]. In this study, we constructed cis- and trans-regulatory networks of aberrantly expressed lncRNAs, offering new insight into the molecular mechanism of action of lncRNAs in LSCC.
Accumulating evidence suggests that ncRNAs can modify mRNA expression via the RNA-RNA crosstalk-based ceRNA mechanism by competing for the MREs of miRNAs through an indirect posttranscriptional mechanism [Citation15,Citation19,Citation43,Citation44]. Although the existence of this competitive mechanism is controversial [Citation45,Citation46], empirical evidence supports this hypothesis, and an increasing number of reports focus on elucidating the role of a ceRNA-related mechanism involving RNA-RNA interactions in tumorigenesis [Citation18,Citation47–Citation51]. Moreover, reliable methods for identifying lncRNA-miRNA interactions have been developed in recent years. For example, traditional miRNA target prediction methods are designed to identify lncRNA-miRNA interactions based on potential target site characteristics [Citation24,Citation52], in conjunction with the verified experimental method [Citation53]. Additionally, CLIP-Seq or AGO-chip provide reliable data sets for miRNA-lncRNA interactions or precise target prediction of lncRNAs [Citation22]. To obtain more accurate assessments of ceRNAs, an additional analytical strategy, such as coexpression relationship analysis, should be integrated into the ceRNA construction pipeline [Citation36,Citation54]. In the present study, a ceRNA network was constructed based on DEGs RNA-RNA interactions via competition for shared miRNAs and hypergeometric test calibration, and 4631 ceRNA triplets were obtained, including 100 lncRNAs, 111 miRNAs and 599 mRNAs in a complicated regulatory network. In this regulatory network, miRNAs such as hsa-miR-1299, hsa-miR-592, and hsa-miR-140-3p have been demonstrated to be aberrantly expressed in the pathogenesis of cancers and are strongly associated with the correlated modules; conversely, hsa-miR-6720-5p and hsa-miR-5187-5p have not yet been investigated [Citation55–Citation57]. To ensure the credibility of the ceRNA construction method, we compared the identified ceRNA in the starBase database. A total of 36 ceRNA triplets of interest were identified as being matched with those from the starBase database, including lncRNA CCDC18-AS1, KCNQ1OT1, hsa-miR-1299, and hsa-miR-592 as the hub genes (). Notably, the lncRNA TMEM51-AS1, identified as one of the highly connected modules in the network, was found to be connected to chromophobe renal cell carcinoma development [Citation58], though hub lncRNA modules including AC090617.5–201, KCNQ1OT1, JPX-212, and AL513314.2–202 have never been evaluated. Overall, these novel lncRNAs and related ceRNA triplets may contribute to the development of LSCC. Furthermore, the mRNAs in this network, including ANGEL2, ASXL2, CHD9, CLNS1A, CYP26B1, DOK6, EGFR and EIF4E3, have the strongest interactions with lncRNAs via miRNAs, suggesting their potential functions and regulatory roles in LSCC.
lncRNAs can act as miRNA sponges, regulating downstream coding genes. More importantly, the identification of functional regulatory triplets in the ceRNA network could provide useful clinical information [Citation43]. Furthermore, we performed functional enrichment analysis of the ceRNA network based on the mRNAs, and the results revealed that functional annotation subsets, including bladder cancer, the phosphatidylinositol signalling system, the ras signalling pathway and the Hippo signalling pathway, play dominant roles. In addition, the most significant GO terms were protein binding, nucleoplasm, and cytosol. Functional enrichment analysis collectively provides a comprehensive landscape of potential mechanisms involving functional RNA-RNA interactions in LSCC.
Based on our functional enrichment analysis results, mRCNs extracted from the ceRNA network were reconstructed and experimentally validated by assessing correlations between lncRNAs and downstream mRNAs. ZNF561-AS1 was verified to regulate WNT5A by targeting miR217, and SATB1-AS1 was able to regulate SAV1/CCNG2/SH3KBP1/JADE1/HIPK2 by sponging miR1299. Moreover, the siRNA experiment targeting ZNF561-AS1 showed a dramatic expression correlation between ZNF561-AS1 and WNT5A, indicating that ZNF561-AS1 most likely acts as a ceRNA targeting WNT1A. Similarly, the results showed that SATB1-AS1 may regulate SAV1/CCNG2/SH3KBP1/JADE1/HIPK2 to some extent by sponging miR-1299. More importantly, for the first time, both downregulated SATB1-AS1 and ZNF561-AS1 were demonstrated to enhance LSCC cell migration and invasion after knockdown by siRNA. This preliminary experimental evidence indicated the potential roles of ZNF561-AS1- and SATB1-AS1-related ceRNA networks in LSCC; however, additional comprehensive evidence should be obtained to fully elucidate the specific ceRNA mechanism. Furthermore, increasing evidence suggests that ceRNA activities represent another important factor affecting ceRNA function in vivo, in conjunction with specific ceRNA patterns in cancers [Citation37,Citation59]. ceRNA activities may depend on the level of lncRNA expression and the total number of available miRNA-binding sites, which are usually associated with the miRNA expression level, either directly or indirectly [Citation21]. Under these circumstances, the existence of ceRNAs with different activities suggests that lncRNA-miRNA-mRNA interactions may be impaired in certain pathological environments, contributing to tumorigenesis through the loss or gain of ceRNA activities. For example, by sponging miR1299, SATB1-AS1 may gain the ability to modify the coding genes JADE1 and HIPK2; however, these ceRNA activities were not observed in normal tissue. Similarly, the ceRNA activity by which ZNF561-AS1 regulates WNT5A may contribute to LSCC, and the ceRNA activity by which SATB1-AS1 indirectly regulates CCNG2 was found to be more pronounced in cancerous tissue than in normal tissue. These findings indicate that the aberrant activities of STAB1-AS1 may contribute to LSCC pathogenesis. Interestingly, SATB1-AS1 showed similar levels of activity in terms of regulating SAV and SH3KBP1 in both LSCC tissues and noncancerous tissues. This may be attributed to the complex mechanisms of action involving lncRNAs other than ceRNA mechanisms, such as trans- and cis-gene regulation or epigenetic regulation, which can also induce coexpression of lncRNAs and related protein-coding genes [Citation12,Citation19,Citation41,Citation60–Citation62]. Collectively, these results indicated that the ceRNA pattern may serve as a potential prognostic biomarker for LSCC. Nonetheless, further experimental investigation into the ceRNA mechanisms underlying mRCNs is needed.
In summary, a regulatory network containing 4631 ceRNA triplets was constructed based on differentially expressed lncRNAs, miRNAs and mRNAs derived from transcriptome-wide RNA sequencing. A mRNA-related RNA-RNA interaction network was then generated, followed by experimental validation via assessment of the coexpression relationship of lncRNAs and downstream mRNAs, as well as functional experiments. Besides, the ceRNA pattern and activities of the validated mRCNs in LSCC were analysed. However, a limitation of this study is that most of the ceRNA networks identified were largely based on correlation analysis. While some experimental evidence was included, further strong evidence should be obtained to fully elucidate the identified ceRNA regulatory networks in LSCC [Citation7]. Collectively, the results of this investigation uncovered the ceRNA regulatory network in LSCC, with the comprehensive elucidation of the roles of ncRNAs in the pathogenesis of LSCC. Our study offers new insight into the potential for the ceRNA regulatory module to be a valuable biomarker for the diagnosis and treatment of LSCC.
Supplemental Material
Download Zip (1.3 MB)Disclosure statement
The authors declare that there is no conflict of interest associated with this study.
Raw data availability
The raw NGS data (GSE137308) presented in this study can be downloaded from NCBI’s GEO database.
Supplementary material
Supplemental data for this article can be accessed here.
Additional information
Funding
References
- Steuer CE, El-Deiry M, Parks JR, et al. An update on larynx cancer. CA Cancer J Clin. 2017;67(1):31–50.
- Groome P, O’Sullivan B, Irish J, et al. Management and outcome differences in supraglottic cancer between Ontario, Canada, and the surveillance, epidemiology, and end results areas of the United States. J Clin Oncol. 2003;21(3):496–505.
- Gioacchini FM, Alicandri-Ciufelli M, Magliulo G, et al. The clinical relevance of Ki-67 expression in laryngeal squamous cell carcinoma. Eur Arch Oto-rhino-laryngol. 2015;272(7):1569–1576.
- Lionello M, Staffieri A, Marioni G. Potential prognostic and therapeutic role for angiogenesis markers in laryngeal carcinoma. Acta Otolaryngol. 2012;132(6):574–582.
- Lee JT. Epigenetic regulation by long noncoding RNAs. Science. 2012;338(6113):1435–1439.
- Chen LL. The biogenesis and emerging roles of circular RNAs. Nat Rev Mol Cell Biol. 2016;17(4):205–211.
- Song YX, Sun JX, Zhao JH, et al. Non-coding RNAs participate in the regulatory network of CLDN4 via ceRNA mediated miRNA evasion. Nat Commun. 2017;8(1):289.
- Shen Z, Li Q, Deng H, et al. Long non-coding RNA profiling in laryngeal squamous cell carcinoma and its clinical significance: potential biomarkers for LSCC. PloS One. 2014;9(9):e108237.
- Luo J, Wu J, Li Z, et al. miR-375 suppresses IGF1R expression and contributes to inhibition of cell progression in laryngeal squamous cell carcinoma. Biomed Res Int. 2014;2014:374598.
- Xuan L, Qu L, Zhou H, et al. Circular RNA: a novel biomarker for progressive laryngeal cancer. Am J Transl Res. 2016;8(2):932–939.
- Iorio MV, Croce CM. MicroRNAs in cancer: small molecules with a huge impact. J Clin Oncol. 2009;27(34):5848–5856.
- Huarte M. The emerging role of lncRNAs in cancer. Nat Med. 2015;21(11):1253–1261.
- Yang S, Ning Q, Zhang G, Sun H, Wang Z, Li Y. Construction of differential mRNA-lncRNA crosstalk networks based on ceRNA hypothesis uncover key roles of lncRNAs implicated in esophageal squamous cell carcinoma. Oncotarget. 2016;7(52):85728–85740.
- Zhang Y, Xu Y, Feng L, Li F, Sun Z, Wu T, Shi X, Li J, Li X. Comprehensive characterization of lncRNA-mRNA related ceRNA network across 12 major cancers. Oncotarget. 2016;7(39):64148–64167.
- Salmena L, Poliseno L, Tay Y, et al. A ceRNA hypothesis: the Rosetta stone of a hidden RNA language? Cell. 2011;146(3):353–358.
- Qi X, Zhang D-H, Wu N, et al. ceRNA in cancer: possible functions and clinical implications. J Med Genet. 2015;52(10):710–718.
- Tan DSW, Chong FT, Leong HS, et al. Long noncoding RNA EGFR-AS1 mediates epidermal growth factor receptor addiction and modulates treatment response in squamous cell carcinoma. Nat Med. 2017;23(10):1167–1175.
- Song C, Zhang J, Qi H, et al. The global view of mRNA-related ceRNA cross-talks across cardiovascular diseases. Sci Rep. 2017;7(1):10185.
- Tay Y, Kats L, Salmena L, et al. Coding-independent regulation of the tumor suppressor PTEN by competing endogenous mRNAs. Cell. 2011;147(2):344–357.
- Sun J, Yan J, Yuan X, et al. A computationally constructed ceRNA interaction network based on a comparison of the SHEE and SHEEC cell lines. Cell Mol Biol Lett. 2016;21(1):21.
- Sumazin P, Yang X, Chiu HS, et al. An extensive microRNA-mediated network of RNA-RNA interactions regulates established oncogenic pathways in glioblastoma. Cell. 2011;147(2):370–381.
- Li JH, Liu S, Zhou H, et al. starBase v2.0: decoding miRNA-ceRNA, miRNA-ncRNA and protein-RNA interaction networks from large-scale CLIP-Seq data. Nucleic Acids Res. 2014;42(Database issue):D92–97.
- Paraskevopoulou MD, Georgakilas G, Kostoulas N, et al. DIANA-LncBase: experimentally verified and computationally predicted microRNA targets on long non-coding RNAs. Nucleic Acids Res. 2013;41(Database issue):D239–245.
- Huang HY, Chien CH, Jen KH, et al. RegRNA: an integrated web server for identifying regulatory RNA motifs and elements. Nucleic Acids Res. 2006;34(Web Server issue):W429–434.
- Kim D, Pertea G, Trapnell C, et al. TopHat2: accurate alignment of transcriptomes in the presence of insertions, deletions and gene fusions. Genome Biol. 2013;14(4):R36.
- Roberts A, Pimentel H, Trapnell C, et al. Identification of novel transcripts in annotated genomes using RNA-Seq. Bioinformatics. 2011;27(17):2325–2329.
- Kong L, Zhang Y, Ye ZQ, et al. CPC: assess the protein-coding potential of transcripts using sequence features and support vector machine. Nucleic Acids Res. 2007;35(Web Server issue):W345–349.
- Sun L, Luo H, Bu D, et al. Utilizing sequence intrinsic composition to classify protein-coding and long non-coding transcripts. Nucleic Acids Res. 2013;41(17):e166.
- Kruger J, Rehmsmeier M. RNAhybrid: microRNA target prediction easy, fast and flexible. Nucleic Acids Res. 2006;34(Web Server issue):W451–454.
- Rausch C, Weber T, Kohlbacher O, et al. Specificity prediction of adenylation domains in nonribosomal peptide synthetases (NRPS) using transductive support vector machines (TSVMs). Nucleic Acids Res. 2005;33(18):5799–5808.
- Enright AJ, John B, Gaul U, et al. MicroRNA targets in Drosophila. Genome Biol. 2003;5(1):R1.
- Agarwal V, Bell GW, Nam JW, Bartel DP. Predicting effective microRNA target sites in mammalian RNAs. eLife 2015;4. doi:10.7554/eLife.05005
- Trapnell C, Roberts A, Goff L, et al. Differential gene and transcript expression analysis of RNA-seq experiments with TopHat and Cufflinks. Nat Protoc. 2012;7(3):562–578.
- Busk PK. A tool for design of primers for microRNA-specific quantitative RT-qPCR. BMC Bioinformatics. 2014;15:29.
- Zhaohui S, Wenling Z, Bao Z, et al. Microarrays for the detection of HBV and HDV. J Biochem Mol Biol. 2004;37(5):546–551.
- Wang P, Ning S, Zhang Y, et al. Identification of lncRNA-associated competing triplets reveals global patterns and prognostic markers for cancer. Nucleic Acids Res. 2015;43(7):3478–3489.
- Tay Y, Karreth FA, Pandolfi PP. Aberrant ceRNA activity drives lung cancer. Cell Res. 2014;24(3):259–260.
- Zhao J, Lv K, Li ZH, et al. Functional significance of the long non-coding RNA RP11-169D4.1 as a metastasis suppressor in laryngeal squamous cell carcinoma by regulating CDH1. Oncol Rep. 2017;38(1):211–220.
- Xu K, Han B, Bai Y, et al. MiR-451a suppressing BAP31 can inhibit proliferation and increase apoptosis through inducing ER stress in colorectal cancer. Cell Death Dis. 2019;10(3):152.
- Riquelme I, Tapia O, Leal P, et al. miR-101-2, miR-125b-2 and miR-451a act as potential tumor suppressors in gastric cancer through regulation of the PI3K/AKT/mTOR pathway. Cell Oncol (Dordr). 2016;39(1):23–33.
- Joung J, Engreitz JM, Konermann S, et al. Genome-scale activation screen identifies a lncRNA locus regulating a gene neighbourhood. Nature. 2017;548(7667):343–346..
- Marchese FP, Huarte M. Long non-coding RNAs and chromatin modifiers: their place in the epigenetic code. Epigenetics. 2014;9(1):21–26.
- Xu J, Li Y, Lu J, et al. The mRNA related ceRNA-ceRNA landscape and significance across 20 major cancer types. Nucleic Acids Res. 2015;43(17):8169–8182.
- Qi X, Zhang DH, Wu N, et al. ceRNA in cancer: possible functions and clinical implications. J Med Genet. 2015;52(10):710–718.
- Thomson DW, Dinger ME. Endogenous microRNA sponges: evidence and controversy. Nat Rev Genet. 2016;17(5):272–283.
- Broderick JA, Zamore PD. Competitive endogenous RNAs cannot alter microRNA function in vivo. Mol Cell. 2014;54(5):711–713.
- Liang R, Han B, Li Q, et al. Using RNA sequencing to identify putative competing endogenous RNAs (ceRNAs) potentially regulating fat metabolism in bovine liver. Sci Rep. 2017;7(1):6396.
- Xu X-W, Zhou X-H, Wang -R-R, et al. Functional analysis of long intergenic non-coding RNAs in phosphate-starved rice using competing endogenous RNA network. Sci Rep. 2016;6:1.
- Guo LL, Song CH, Wang P, et al. Competing endogenous RNA networks and gastric cancer. World J Gastroenterol. 2015;21(41):11680–11687.
- Yao K, Wang Q, Jia J, et al. A competing endogenous RNA network identifies novel mRNA, miRNA and lncRNA markers for the prognosis of diabetic pancreatic cancer. Tumour Biol. 2017;39(6):1010428317707882.
- Wan M, Zhang FM, Li ZL, et al. Identifying survival-associated ceRNA clusters in cholangiocarcinoma. Oncol Rep. 2016;36(3):1542–1550.
- Liu K, Yan Z, Li Y, et al. Linc2GO: a human LincRNA function annotation resource based on ceRNA hypothesis. Bioinformatics. 2013;29(17):2221–2222.
- Quek XC, Thomson DW, Maag JL, et al. lncRNAdb v2.0: expanding the reference database for functional long noncoding RNAs. Nucleic Acids Res. 2015;43(Database issue):D168–173.
- Liu H, Liu Y, Bian Z, et al. Circular RNA YAP1 inhibits the proliferation and invasion of gastric cancer cells by regulating the miR-367-5p/p27 Kip1 axis. Mol Cancer. 2018;17:1.
- Salem O, Erdem N, Jung J, et al. The highly expressed 5ʹisomiR of hsa-miR-140-3p contributes to the tumor-suppressive effects of miR-140 by reducing breast cancer proliferation and migration. BMC Genomics. 2016;17:566.
- Wang Y, Lu Z, Wang N, et al. MicroRNA-1299 is a negative regulator of STAT3 in colon cancer. Oncol Rep. 2017;37(6):3227–3234.
- Peng T, Zhou L, Qi H, et al. MiR-592 functions as a tumor suppressor in glioma by targeting IGFBP2. Tumour Biol. 2017;39(7):1010428317719273.
- He HT, Xu M, Kuang Y, et al. Biomarker and competing endogenous RNA potential of tumor-specific long noncoding RNA in chromophobe renal cell carcinoma. Onco Targets Ther. 2016;9:6399–6406.
- Karreth FA, Pandolfi PP. ceRNA cross-talk in cancer: when ce-bling rivalries go awry. Cancer Discov. 2013;3(10):1113–1121.
- Neumann P, Jae N, Knau A, et al. The lncRNA GATA6-AS epigenetically regulates endothelial gene expression via interaction with LOXL2. Nat Commun. 2018;9(1):237.
- Cheng D, Deng J, Zhang B, et al. LncRNA HOTAIR epigenetically suppresses miR-122 expression in hepatocellular carcinoma via DNA methylation. EBioMedicine. 2018;36:159–170.
- Joung J, Engreitz JM, Konermann S, et al. Erratum: genome-scale activation screen identifies a lncRNA locus regulating a gene neighbourhood. Nature. 2017;549(7672):418.