
 ?Mathematical formulae have been encoded as MathML and are displayed in this HTML version using MathJax in order to improve their display. Uncheck the box to turn MathJax off. This feature requires Javascript. Click on a formula to zoom.
ABSTRACT
The understanding of miRNA target interactions is still limited due to conflicting data and the fact that high-quality validation of targets is a time-consuming process. Faster methods like high-throughput screens and bioinformatics predictions are employed but suffer from several problems. One of these, namely the potential occurrence of downstream (i.e. secondary) effects in high-throughput screens has been only little discussed so far. However, such effects limit usage for both the identification of interactions and for the training of bioinformatics tools. In order to analyse this problem more closely, we performed time-dependent microarray screening experiments overexpressing human miR-517a-3p, and, together with published time-dependent datasets of human miR-17-5p, miR-135b and miR-124 overexpression, we analysed the dynamics of deregulated genes. We show that the number of deregulated targets increases over time, whereas seed sequence content and performance of several miRNA target prediction algorithms actually decrease over time. Bioinformatics recognition success of validated miR-17 targets was comparable to that of data gained only 12 h post-transfection. We therefore argue that the timing of microarray experiments is of critical importance for detecting direct targets with high confidence and for the usability of these data for the training of bioinformatics prediction tools.
Introduction
MicroRNAs (miRNAs) are a class of small ~22 nt non-coding RNAs, which participate in the post-transcriptional regulation of gene expression. Currently, nearly 2700 mature human miRNAs are annotated in the miRBase [Citation1,Citation2], suggested to regulate the majority of human genes in a tissue- and context-dependent manner [Citation3–Citation5]. Identifying miRNA target genes is crucial for understanding their regulatory functions in health and disease. Therefore, numerous techniques were developed in the last years. Targets are usually validated using luciferase dual reporter assay, qPCR or western blotting, that are considered as strong experimental evidences. However, these methods are applicable for low- to medium-throughput, which makes the investigation labour-intensive and time-consuming. Large-scale detection of miRNA targets can be done by new generation sequencing (NGS) [Citation6], microarrays [Citation7] or crosslinking, ligation, and sequencing of hybrid (CLASH) methods [Citation8]. Currently, around 95% of the experimentally reported miRNA target interactions, listed in miRTarBase, a database dealing with experimentally detected targets [Citation9,Citation10], come from high-throughput approaches. Despite being effective in data generation, these techniques are costly and produce data that need further experimental validation due to the substantial fraction of false positives. Therefore, bioinformatics target prediction algorithms are necessary for speeding up miRNA-mediated regulatory network analysis and reducing the associated costs.
A number of algorithms were introduced in the last 15 years, and all of them primarily rely on rules representing the formation of perfectly matched miRNA-mRNA duplexes. Some of them extend the seed sequence (2–8 nt) and consider neighbouring positions 1, 9 and 10 as the relevant recognition determinants [Citation11]. Furthermore, the conservation of seed sequences throughout a number of species, accessibility of the binding site within the mRNA, the change in free energy (ΔGbinding) of the putative miRNA-mRNA duplex, the secondary and tertiary structure of the miRNA-mRNA duplex within the RISC complex can be considered [Citation12–Citation17]. Some of the methods (e.g., TargetScan [Citation18], DIANA microT-CDS and miRmap) are ‘classical’ algorithms, which are based on a scoring function. This function is derived by weighing the impact of the above listed miRNA-mRNA binding determinants on the overall binding probability via the usage of multiple linear regressions. Recently, a number of machine learning-based tools, such as MirTarget3 (support vector machine, SVM-based [Citation19]), miRNATip (self-organizing map, SOM-based [Citation20]) and TarPmiR (random-forest-based [Citation21]) were developed.
However, all of the above approaches only result in a moderate efficiency in target prediction. For instance, a target prediction accuracy of only 10-50% for five selected tools was reported some time ago [Citation22]. Several major reasons have been identified so far: firstly, the rules of miRNA–mRNA interaction are not completely understood, especially in a context-dependent manner. For example, CLASH experiments revealed that a seed matching may be not necessary for some miRNA interactions with their targets [Citation8]. Secondly, large-scale data are usually used for training the algorithms as a lot of true positives and negatives are needed in order to ensure reliable scoring. Thus, gene expression microarrays following miRNA overexpression are the most frequently utilized. However, numerous false positives may be introduced as deregulation of miRNA and their targets are prone to cause downstream secondary effects [Citation23,Citation24]; meaning that direct physical targets, i.e. deregulated mRNAs will in turn influence the expression of other genes. Furthermore, it was recently shown, that in large-scale experiments some genes may be deregulated to an extent which is much smaller than the inter-sample (or inter-replicate) variability [Citation25], resulting in false-positives. On the other hand, the only modest deregulation of hundreds of transcripts as well as proteins following miRNA overexpression [Citation26–Citation29] may be overlooked during the hit calling and generate numerous false negatives.
Target prediction efficiency according to the features present in the algorithms has been analysed regularly [Citation11,Citation14,Citation16,Citation20,Citation30]. This in turn helped to steadily improve the performance of the tools. Recently, it was demonstrated that considering and weighing conserved miRNA binding sites causes target over-prediction because these sequences are short and also occur in other contexts or simply by chance when placed in regions protected from unwanted miRNA binding [Citation25]. In general, side-to-side comparison of algorithms is non-trivial due to their different rules for target scoring and overall organization. Furthermore, the comparison is frequently done on very large datasets [Citation31], which in return would require extensive efforts to individually validate those interactions. In addition, a comparative analysis may be biased in some cases when datasets, optimal only for one algorithm, are used (e.g. [Citation20,Citation21]).
In this study, we took an effort to analyse target prediction efficiency by seven freely accessible and recently updated algorithms: TargetScan, microT-CDS, miMap, miRTar, MirTarget3, miRNATip and TarPmiR. In order to achieve as objective as possible comparison, we used microarray data after overexpression of miR-17 [Citation32], miR-517a, miR-135b [Citation33] and miR-124 [Citation27] along with the set of 42 validated targets of miR-17. We compared these tools conferring a straightforward criterion of a presence of the perfectly matching canonical 7-mer seed sequences among the downregulated targets. In our study, we show the surprisingly varying performance of the selected algorithms in target prediction regardless the type of analysed data. For the first time, target recognition efficiency was systematically analysed as a function of time after miRNA overexpression. We could unambiguously demonstrate that the timing of gene expression data is of key importance for accurate prediction of miRNA targets and should be considered carefully when choosing such type of data for training of target prediction algorithms.
Materials and methods
Transfection of miRNA
miR-517a-3p (PM12660) and the negative control (AM17120) were purchased from Thermo Fisher Scientific. miRNAs were transfected into HeLa cells at a final concentration of 50 nM using Lipofectamine 2000 transfection reagent (Thermo Fisher Scientific) according to the manufacturer’s recommendations.
qRT-PCR of miR-17-5p expression level
For qRT-PCR of miR-17-5p total RNA from HeLa cells was isolated 24 h, 48 h and 72 h after the transfection. Reverse transcription of miR-17-5p and the housekeeping control RNU6B RNA was carried out using the TaqMan MicroRNA Reverse Transcription kit with 15 ng of total RNA and 50 nM RNA-specific stem-loop Reverse Transcription primers. qRT-PCR reactions were carried out in 96-well ABgene PCR Plates (Thermo Fisher Scientific) in the Real-Time PCR 7500 system using miRNA TaqMan Assay (all reagents and the equipment were from Thermo Fisher Scientific). The ΔΔCT method for quantification of miR-17-5p expression level was applied as described elsewhere (Livak and Schmittgen, 2001), using an expression level of RNU6B RNA as a reference for normalization.
mRNA expression microarrays
Total RNA of two biological replicates of each experimental condition was extracted 12 h, 24 h and 48 h after miRNA transfection and submitted for mRNA expression profiling with human Sentrix-8 BeadChip arrays (Illumina). The arrays were scanned on Beadstation array scanner (Illumina). Data analysis of mRNA microarrays was accomplished by normalization of the averaged signals of all specific probe replicates using the quantile normalization algorithm without background subtraction. The analysis was performed by means of the Chipster analysis platform v1.4.7 [Citation34]. Expression level fold change (log2) of the respective transcripts was defined as a difference between the normalized mean intensity of the respective probes from the samples transfected with miR-517a-3p and negative control samples. The statistical significance of the expression level fold changes was estimated by calculating a p-value using the empirical Bayes method and Benjamini-Hochberg multiple testing correction. Next, the log2 expression fold changes were transformed to linear expression fold changes and cut-off values of ±1.5 corresponding to an adjusted p-value ≤0.01 were applied to identify significantly deregulated transcripts. To account for the gene expression changes equally for all the datasets, a cut-off value of 1.5 was applied for the previously published gene expression datasets used in this study as well.
Computational analysis of time-resolved mRNA expression data
We implemented the pipeline, in which mySQL databases for RefSeq identifiers, miRNA target predictions and BLAST databases for RefSeq RNA (release 87 [Citation35]) mRNA sequences and CDS locations were created locally from publicly available tab-delimited output files. For the search of miRNA binding sites in mRNA sequences, BLAST+ [Citation36] was used with the following parameters: at least 5 nt-long perfect match of sequence, complementary to 2–8 nt of miRNA, with a threshold of E-value set to E = 50. In the computational analysis, we defined that a gene is supposed to contain a certain seed sequence if there is at least one transcript variant that contains this seed sequence. Ensembl 91 [Citation37] for mapping of identifiers was accessed by remote SQL calls. For the analysis of seed sequence conservation in validated miR-17 targets, BLAST+ search against species-constrained RefSeq RNA database was used. Detected highly homologous transcripts in Mus musculus, Gallus gallus, Drosophila melanogaster and Caenorhabditis elegans were aligned using MAFFT [Citation38] and checked for seed sequence identity. False discovery rates (FDR) were calculated as follows: , where true positives (TPs) are defined as all the unique experimentally downregulated genes. As TarPMiR is available as a software tool only, FDR calculations were performed using the output of a scan against full human transcriptome, provided in RefSeq. For querying transcription factor-mediated gene interactions, RegNetwork [Citation39] and Human Protein Reference Database [Citation40] were used.
Results
Overexpression of miRNAs increases the number of deregulated mRNAs over time
In order to analyse the dynamics of miRNA induced expression changes in more detail, we used three previously published data sets [Citation27,Citation32,Citation33], which were obtained at several time points, spanning 12–48 h after miRNA overexpression. Despite being publically available, none of them was analysed as a function of time in detail to the date. De novo overexpression of miR-124 in HeLa cells [Citation27] induced the deregulation of hundreds of transcripts: 294 were down- and 114 genes upregulated at 12 h post transfection, while 721 were down- and 606 genes upregulated after 24 h using a threshold of fold difference of 1.5 (). In contrast, the overexpression of miR-135b was done in its natural environment, prostate adenocarcinoma cells LNCaP [Citation33]. Some targets may be missed due to their repression via the natural presence of miR-135b in these cells. Therefore, it is not surprising that the number of deregulated transcripts was lower compared to the de novo overexpression of miR-124; however, the raise in deregulated mRNAs over time was also sizable (). Considerably smaller numbers of significantly deregulated transcripts were scored upon the overexpression of both miR-17 (HeLa cells [Citation32]) and miR-135b in their natural environment. In the first case, observing only modest numbers of deregulated transcripts, we ensured that there is still a significant elevation of miR-17 levels after pre-miR-17 transfection via qRT-PCR (Supplementary Fig. 1).
Table 1. Overexpression of miRNAs induces the increase of deregulated transcripts over time. The cut-off value of was applied to identify significantly deregulated mRNAs. Fold change in transcript numbers shows the difference between two sequential time points.
In addition to the above described three published datasets, we performed our own gene expression studies after the overexpression of miR-517a, functions of which are little known to date. The data were collected at 12 h, 24 h and 48 h following transfection, and the negative control pre-miR oligonucleotide was included as a reference for each time point. Similarly, to miR-124, de novo expression of miR-517a in HeLa cells induced a large time-dependent increase in downregulated transcripts (more than sevenfold) when comparing data between 12 h and 48 h (). An even higher increase in upregulated transcripts was observed: from 109 mRNAs at 12 h time point to 1103 mRNAs at 48 h (, Supplementary Table 1). Even though there are only a few validated targets of miR-517a known, one of them, namely the transcription activator Forkhead box J3 (FOXJ3, [Citation41]), was identified as a downregulated transcript in our experiments at all three time points measured.
We then analysed whether the observed increase in deregulated mRNAs is rather linear with time or nonlinear. Therefore, we analysed the differences between sequential time points. Remarkably, for three out of four tested miRNAs a fold-change of the downregulated transcripts between two time points for two sequential periods remained in a range of 2–2.9. Also, a similar fold-change for the upregulated transcripts between early and late time points was registered for miR-17 and miR-517a. In contrast, 5- to 10-fold increases in the upregulated transcripts were observed upon overexpression of miR-135b and miR-124 between 12 h and 24 h, suggesting different dynamics of miRNA target interactions. Interestingly, the fold increase in the deregulated mRNAs between sequential time points is similar for de novo and endogenously expressed miRNAs, in contrast to the strongly varying absolute numbers of the altered transcripts ().
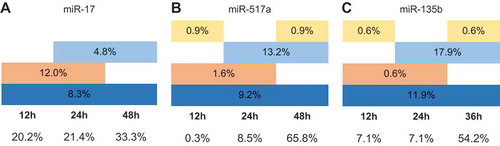
Eventually, the fractions of transcripts that are deregulated by 1.5-fold at single time points compared to all time points were calculated. miR-124 was excluded from the analysis as data of only two time points were available. For miR-17, miR-517a and miR-135b, around 70% of the downregulated transcripts were scored at a single time point (). The majority of these may be indirect targets as the largest fraction of them were deregulated at 48 h post-transfection. Around 10% of mRNAs was downregulated in all three time points and possibly indicate direct and long-lived targets. Only few transcripts were downregulated at 12 h and 36/48 h but not at the intermediate 24 h time point and we speculate that these could also be assigned to the group of potential direct and long-lived targets and that the failure to confidently detect their expression changes at 24 h time point might be due to experimental details. Surprisingly constant is also the fraction of mRNAs (16-18%), whose expression is reduced between two subsequent time points. The majority of such transcripts are detected at 24 h and 48 h for miR-517a and miR135b, but at 12 h and 24 h in the case of miR-17 (). Curiously, the change among the upregulated transcripts was similar in some aspects (Supplementary Fig. 2). For instance, the largest fraction of such mRNAs appeared at a single late time point of 36/48 h. In contrast to the downregulated transcripts, the upregulated ones at all time points constitute a smaller fraction of 3-6% with miR-17 having none of that sort (Fig. S2a). All in all, the changes of the deregulated mRNAs over time share a number of similarities upon overexpression of different miRNAs in different experimental setups.
Figure 1. Downregulation of transcripts over multiple time points upon miRNA overexpression. Total number of the downregulated transcripts after the overexpression of miR-17 (a), miR-517a (b) and miR-315b (c) was considered as 100% and their occurrence at the individual time points is shown as the respective percentages. Dark blue colour indicates the transcripts whose expression is reduced at 12 h, 24 h and 36/48 h, light blue colour – at 24 h and 36/48 h, orange colour – at 12 h and 24 h and yellow colour – at 12 h and 36/48 h. The fractions of downregulated transcripts at single time points are indicated below the respective time point.
Occurrence of the seed sequence in the deregulated transcripts decreases over time
As the next step in investigating the commonalities and differences for chosen miRNA cases, we analysed the occurrence of perfectly matching seed sequences over the whole length of the deregulated transcripts (Supplementary Table 1). In our own experiments, the overexpression of synthetic pre-miRs elevated levels of miR-17-5p [Citation32] and miR-517a-3p. The situation is less clear after the expression of miR-124 and miR-135b, as either −5p or −3p forms of these miRNAs may have been generated. Thus, we considered the seed sequences of those miRNA isoforms that are shown to be higher expressed in cells according to miRBase: namely, miR-135b-5p and miR-124-3p. In agreement with previous observations [Citation42], the vast majority of potential miR-124 targets was lost when using perfect seed matching; therefore, we excluded this miRNA from the following analysis. Canonical 7mer seed sequences at 2ʹ-8ʹ position of the selected miRNAs were used to identify the presence of respective complementary sequences.
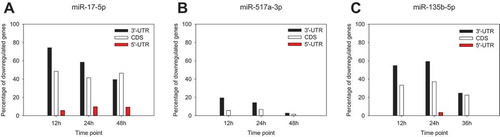
The presence of the seed sequence among the deregulated transcripts induced by miRNA overexpression was distinct for the miRNAs analysed. 77 and 69% of the mRNAs with reduced expression levels contained the relevant seed sequences following the overexpression of miR-17 and miR-135b at 12 h, respectively (). In contrast, less than 25% of such transcripts were found in case of miR-517a at the same time point. Despite this difference, the fraction of downregulated transcripts containing the relevant seed sequences was decreasing from 12 h to 36/48 h for all miRNAs. The change was miRNA-specific. For instance, overexpression of miR-135b and miR-17 induced a moderate decrease (1.8- and 1.2-fold, respectively) for down-regulated transcripts containing seed sequences. In contrast, a 3.2-fold drop of seed sequence present in the respective subset of transcripts was observed after miR-517a overexpression over time. As expected, the majority of seed sequences were found in the 3ʹUTR of all mRNAs (). Some were nevertheless located in the coding part (CDS) and only few transcripts contained the seed sequences in their 5ʹUTRs. For all miRNAs, we observed a common trend of a notable decrease in downregulated transcripts with the seed sequences in 3ʹUTR over time while a fraction of those with seed sequence in the CDS remained relatively unchanged.
Table 2. Changes in localization and appearance of multiple seed sequence positions over time. Position-wise distribution is reported as a fraction of all the experimentally determined downregulated genes. Three main combinations of seed sequence localization (3ʹ-UTR only, 3ʹ-UTR and CDS, CDS only) are provided explicitly, while the ‘others’ graph contains the cases that are rarer: 5ʹ-UTR-only, 5ʹ-UTR and CDS, 3ʹ-UTR and 5ʹ-UTR and 3ʹ-UTR, CDS and 5ʹ-UTR.
Table 3. Target recognition by ‘classical’ (a) and machine learning-based (b) detection algorithms on the downregulated transcripts in time-resolved microarray experiments and on the validated miR-17 targets (c).
Figure 2. Time-dependent occurrence of the seed sequences following the overexpression of miR-17-5p (a), miR-517a-3p (b) and miR-135b-5p (c). Seed sequence presence and localization within the transcript were determined as described in Materials and Methods. Data are provided as a percentage of all the experimentally determined downregulated genes, transcripts of which possess respective seed sequence complements for miR-17-5p (‘GCACUUU’), miR-517a-3p (‘UGCACGA’) and miR-135b-5p (‘AAGCCAU’).
Surprisingly, the seed sequences were also found in upregulated transcripts, which are usually not considered as potential targets upon miRNA overexpression. The prevalence of the respective seed sequences was fairly high, except for miR-517a (Supplementary Fig. 3) and correlated well to that observed for the downregulated transcripts. The numbers of upregulated transcripts containing seed sequences followed the general trend of getting diminished over time. In contrast to the downregulated mRNAs (), the seed sequences in upregulated transcripts were distributed quite equally between 3ʹUTR and CDS (Fig. S3).
A considerable fraction of downregulated mRNAs bore multiple miRNA binding sites (). Among these, we observed varying frequencies of seed sequence occurrence among the tested miRNAs. Downregulated transcripts following miR-17 and miR-135b overexpression carried two to five seed positions, whereas, a maximum of three seed positions per transcript were found in the case of miR-517a. Multiple seed sequences were harboured either exclusively at 3ʹ-UTR of the transcript or at least one of them was located in the 3ʹ-UTR (). In agreement with the previously described data (, and ), the occurrence of downregulated transcripts containing several seed positions was declining over time. Multiple seed sequences in upregulated transcripts were found even more frequently (Supplementary Table 2) but were also predominantly located at the 3ʹ-UTR or CDS. mRNAs upregulated by miR-17 overexpression possessed a greater number of seed sequence binding sites (more than five), whereas the maximum number of binding sites in mRNAs upregulated after miR-135b overexpression was two. Upregulated potential targets of miR-517a were nearly completely devoid of transcripts with multiple seed positions.
Performance of miRNA target prediction algorithms on time-resolved gene expression data
After having analysed the changes in deregulated transcripts over time, we then tested how efficiently target prediction algorithms work on this type of data. For this, we focused on a set of publically accessible algorithms, which were reported to be updated in the last 5 years: DIANA microT-CDS, MirTarget3, TargetScan, miRmap, miRNATip, miRTar and TarPMiR. We have created a computational pipeline to automate the mapping of various identifiers for the transcripts, handling of datasets and matching of true positives between experimentally downregulated mRNAs and computational predictions (see Materials and Methods for a more detailed description).
At first, we compared the performance of so-called ‘classical’ target prediction algorithms ((a)). Notably, the fractions of the predicted targets varied significantly among the algorithms applied for the same miRNA. For instance, 88% of the downregulated mRNAs after the overexpression of miR-17 at 12 h were recognized as targets by miRmap, but only 34% by miRTar. Prediction efficiency by TargetScan and microT-CDS was comparable to each other’s, reaching over 50% of target calling for miR-17 overexpression at 12 h. Machine learning-based tools performed more uniformly than the ‘classical’ ones ((b)). The highest target prediction rate of 88% at 12 h time point after miR-17 overexpression was similar to that obtained with miRmap and the one generated by miRNATip. The lowest target prediction rate of 54% was achieved by MirTarget3 at the same time point ((b)). Uniformly, nearly all software tools recognized less targets at later time points. This drop for all miRNAs and algorithms between two sequential time points was in the range of 1.2- to 3-fold (). Only TarPMiR showed some deviations from these observations. Firstly, it predicted an increasing fraction of the potential targets over time for miR-135b. Secondly, nearly the same fraction of targets was predicted for miR-17 at 24 h and 48 h ((b)) in agreement with the small change (68% to 65%) in the downregulated transcripts containing the seed sequence at these two time points.
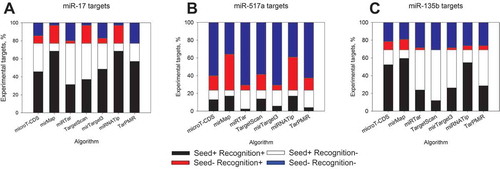
In general and not surprisingly, we observed a positive relationship between target prediction efficiency and the fraction of downregulated transcripts containing the relevant seed sequences when analysing the gene expression profiles at 12 h after miRNA overexpression (). However, this relation varied strongly among different miRNAs and algorithms. miRmap and miRNATip recognized the highest fraction of the potential targets not only for miR-17 but also for miR-517a and miR-135b (). However, the data show they clearly over-predicted due to calling hits with mRNAs without a perfect seed sequence. This effect is especially pronounced for the target pool of miR-517a ()), which is deprived of seed sequences, compared to miR-17 and miR-135b. On the other hand, miRTar, which recognized the least targets at 12 h time point, failed to call a substantial fraction of the mRNAs with the seed sequences as hits. Nearly 50% of such downregulated targets after overexpression of miR-17 and miR-135b were missed ()). microT-CDS, TargetScan and mirTarget3 performed fairly uniformly on the potential targets of miR-17 with lower target recognition percentage (51-57%) than the presence of the perfect seed sequence (77%) (). Recognition efficiency for other miRNAs was varying and may be seed sequence-dependent. For instance, lower prediction rate of miR-135b targets by TargetScan and MirTarget3 compared to that of miR-17 () can be explained by a higher fraction of false negatives ()). Interestingly, in terms of perfect seed sequence presence, TarPmiR generated no false positives with the data on miR-17 ()). Finally, to quantify the overall performance of the algorithms, we also calculated the false discovery rates (FDR), using the experimental hits, pooled from different time points, as true positives. Strikingly, for most of the algorithms, the FDR reached >90% for any given miRNA, with a notable exception to miRTar (Supplementary Table 4). This also does not change significantly, if only earlier time-points are considered. The ‘overpredictors’ miRmap and miRNATip showed the highest FDRs, approaching the seed sequence-based FDR reference values (Table S4, rightmost panel).
Figure 3. Bioinformatics target detection by different algorithms with respect to the presence of seed sequences. Downregulated transcripts at 12 h post-transfection of miR-17-5p (a), miR-517a-3p (b) and miR-135b-5p (c) were analysed. Black colour represents a fraction of targets possessing at least a single seed sequence and detected as true positives by a respective algorithm, white colour corresponds to not recognized mRNAs with seed sequences. Red colour shows transcripts without seed sequences but predicted as targets and blue colour – not recognized targets without seed sequence.
Next, we analysed how many algorithms recognized the same transcript downregulated at 12 h (Figure (4)). Surprisingly, the patterns of recognition frequency varied a lot among the analysed miRNAs. mRNAs deregulated after miR-17 overexpression were recognized by one to six algorithms ()). None of the potential targets, however, was predicted by all seven algorithms. Four to five algorithms recognized nearly 53% of the downregulated mRNAs after miR-135b overexpression ()). One target of miR-135b, namely, steroid hormone receptor ESRRA was recognized by all algorithms. The most interesting case presents mRNA downregulated after miR-517a. We observed a decrease in the number of transcripts along with increasing true positive rate. Nearly 25% of the downregulated transcripts were not recognized as targets, around 10% of them were recognized by three and four algorithms, and only 1.8% of them were recognized by six algorithms. Collectively taken, a large fraction of 24 out of 31 non-recognized downregulated transcripts lacked the respective seed sequences.
Figure 4. Fraction of experimental miR-17 (a), miR-517a (b), miR-135b (c) and low-throughput-validated miR-17 (d) targets recognized by varying number of target prediction algorithms.
Performance of miRNA target prediction algorithms on the validated targets of miR-17
To further elaborate our observations, we tested the algorithms' performance on the list of validated targets of miR-17. This molecule has been intensively investigated due to its role in apoptosis, cell survival, growth, viral infection and, lately, in membrane trafficking [Citation43]. Deregulation of these processes was shown to lead to various diseases and play an important role in ageing [Citation4,Citation44]. As a result, the list of the known targets is one of the longest known for individual human miRNA and comprises more than 50 target proteins validated by low-throughput methods. Here, we collected the information about the targets that were validated at least by two independent methods and arrived at a manually curated list of 42 proteins which are known to be affected by miR-17 (Supplementary Table 3). Some of these targets were validated based on the changes of mRNA expression levels (‘mRNA only’), protein expression levels (‘protein only’) or both (‘mRNA and protein’). Despite being a popular experimental approach to support miRNA-based effects, it should be noted that perturbations at the protein level do not necessarily arise from the direct miRNA-mRNA binding. For instance, in some cases, miR-17 targeting was tested only on a protein level and the issue of changes in the mRNA level is not yet resolved. Those entries are indicated as ‘protein’ in Table S3. In the end, the data we compiled suggest that a larger part, namely, 43% of the known miR-17 targets (18 out of 42 targets), is regulated at the protein level and 29% of these were validated as being perturbed at mRNA level (12 out of 42 targets). The pattern of regulation for the remaining 28% of the targets is not yet clarified to the end. It is important to mention that we have considered targets of both miR-17-5p and miR-17-3p. Over 80% of the proteins in this list are validated as targets of miR-17-5p. As expected, the vast majority of miR-17-mRNA interactions were reported to be located at 3ʹ-UTR. On one hand, it may reflect the most frequent position of the targeting; however, it introduces a certain bias as the targeting sites were searched for and tested only considering the 3ʹ-UTR part of the mRNAs in most of the studies. A similar situation may occur with the assignment of the targets to miR-17-5p over miR-17-3p. Finally, miR-17-mediated targeting was predominantly validated considering a perfect matching of the respective seed sequences.
Surprisingly, all target prediction algorithms showed similar prediction rates on the validated targets to those observed on gene expression data following 12 h after miR-17-5p overexpression ((c)). The most targets (around 85%) were predicted by miRmap and mirRNATip. Interestingly, the non-recognized targets by both algorithms were barely overlapping: IRS1, KMT5B, RND3, SERPINE1 and TXNRD2 were not recognized by miRmap and ADCY5, BLID, GPX2, KMT5B, PDCD4 and HBP1 – by miRNATip. In accordance with the time-resolved data, the worst prediction rates were obtained with miRTar (26%). Less efficient target recognition on validated targets than from gene expression data was observed with four of the algorithms assessed. For instance, mirTarget3 could predict 45% of the validated targets, but 54% – among the downregulated mRNAs of the microarray experiments. In contrast, two algorithms (microT-CDS and TarPmiR) predicted slightly more targets among the validated ones than on microarray gene expression data. Efficiency of target recognition by miRmap remained the same with both data sets (). All in all, we have observed high non-uniformity among the target prediction tools in dealing also with the validated targets of miR-17.
The majority of the validated targets (69%) are recognized by three to five algorithms (), Supplementary Table 3). All seven tested algorithms recognized only 7% (3 out of 42) of the validated targets at the same time: RBL2, STAT3 and SQSTM1. These three are targeted by miR-17-5p at their 3ʹ-UTR and validated as targets rather on protein expression level [Citation23,Citation45,Citation46]. Six algorithms recognized nearly 12% of the validated targets that essentially carry the same characteristics as mentioned before and collectively could be called ‘frequent hits’. Only TBC1D2 was validated at mRNA and protein level [Citation32]. In agreement with the overall lowest efficiency of target prediction (), miRTar recognized targets the least frequently also in this group. Collectively, five targets (BLID, GPX2, KMT5B, GBP3 and TXNRD2) were recognized by one and two algorithms only, building a group of ‘rare hits’. Curiously, two of them are targets of miR-17-3p and only KMT5B is validated explicitly on a protein level, but not on a transcript level. The remaining four targets are either validated on mRNA level or the changes of mRNA expression level were not investigated yet [Citation47–Citation50]. As expected, two of the most efficiently performing algorithms (miRmap and miRNATip) recognized four out of five ‘rare hits’. Finally, we could not find a single validated target, which is not recognized at least by one target prediction algorithm.
Among 42 validated targets and 35 potential targets downregulated after miR-17 overexpression at 12 h (), four overlapping mRNAs were found. That includes TGF-beta receptor type-2 (TGFBR2 [Citation51]), p62 (SQSTM1 [Citation46]), TBC1 domain family member 2A (TBC1D2 [Citation32]) and low density lipoprotein receptor (LDLR [Citation32]). Curiously, p62 and TGFBR2 were validated on protein level so far only [Citation46,Citation52]. These four overlapping targets derived by various methods share several commonalities: firstly, they all are targeted by miR-17-5p. Secondly, they are recognized by no less than five target recognition algorithms.
Discussion
In this study, we analysed the dynamics of miRNA-mediated changes of gene expression over time on previously published and newly generated microarray data and recognition efficiency of deregulated mRNAs by miRNA-target prediction algorithms. Firstly, we compared the behaviour of downregulated transcripts at 12 h, 24 h and 36/48 h post miRNA de novo overexpression in the case of miR-124 and miR-517a as well as in the presence of endogenous miRNA in the case of miR-135b and miR-17. De novo expressed miRNAs deregulated considerably more transcripts than the ones overexpressed in their natural environment (). However, elevated levels of all miRNAs uniformly induced a time-dependent accumulation of downregulated transcripts (, Supplementary Table 1, ). Regardless of the miRNA considered, the numbers of significantly downregulated mRNAs increased by 2 to 3 times when comparing two sequential time points. Secondly, the earlier time point taken, the higher fraction of downregulated mRNAs contained respective perfectly matching 7-mer seed sequences ((a)). When analysing the transcripts with seed sequences in their 3ʹ-UTR and CDS separately, we observed that only the ones with seed sequences at 3ʹ-UTR efficiently decreased over time (). In contrast, the frequency of seed sites in the CDS was changing only little over time. It was hypothesized that miRNA–mRNA interaction sites at 3ʹUTR are more prone to lead towards the degradation of transcripts [Citation53], whereas, CDS localized sequences might act primarily via translation inhibition [Citation54]. In our datasets, the transcripts with multiple copies of seed sequences indeed contained those either at 3ʹ-UTR or both at 3ʹUTR and CDS (, ).
In contrast to the previous studies (e.g. [Citation42]), we analysed not only downregulated but also upregulated mRNAs upon miRNA overexpression. Normally, such transcripts are not considered as direct targets of the overexpressed miRNA, but rather as secondary or even tertiary effects [Citation23]. Interestingly, the time-dependent appearance of upregulated mRNAs was quite similar to that of the downregulated ones (, Supplementary Tables 1 and 2, Supplementary Figures 2 and 3). Curiously, the prevalence of seed sequences was at the same level compared to the downregulated transcripts or even higher. These observations could point to the presence of regulatory mechanisms that could help in neutralizing the elevated levels of miRNAs [Citation55–Citation57]. Simultaneous increase of the transcripts that could sequester miRNA surplus may act as a buffer against exaggerated repression of target mRNAs and induction of potentially detrimental outcomes.
Following the initial statistical analysis, time-resolved miRNA-mediated gene expression data were used to analyse the efficiency of target recognition by seven publically accessible algorithms. Four of the algorithms are ‘classical’ (microT-CDS, miRmap, miRTar and TargetScan), i.e. primarily sequence recognition based and three – ‘machine learning’ based (MirTarget3, miRNATip and TarPmiR); all of them updated in the last 5 years at the time of preparation of this manuscript. In general, target prediction rates for the tested algorithms in this study were higher than for the tools available in 2006 that recognized no more than some 50% of experimentally supported targets [Citation22]. All the algorithms we tested recognized less targets for all miRNAs with increasing post-overexpression time ((a,b)). This observation illustrates a fairly reasonable performance as a reduction of their prediction efficiency was accompanied by the uniform decrease in the fraction of downregulated mRNAs containing seed sequences. Even cautiously, this latter fact can be interpreted in such a way that later time points after miRNA overexpression tends to comprise a high number of secondary or higher order effects as was also suggested in [Citation24,Citation42]. Just to illustrate this further, we examined the data sets newly measured for this study for straightforward potential examples of this scenario: One exemplary candidate is the transcription factor NFIC, which we found to be downregulated upon miR-517a overexpression at 12 h. The downregulation of a transcription factor of course will cause further changes in gene expression. Looking for known targets of NFIC in the list of changed mRNA levels, we found 27 mRNAs at time point 48 h. Interestingly, also only one of these targets (Supplementary Table 5), namely, CDK2AP1 possesses a seed sequence for miR-517a.
Besides the data on time-resolved gene expression, we tested the performance of the algorithms on 42 validated targets of miR-17 carrying perfectly matching seed sequence (Supplementary Table 3). These were molecules for which physiological importance was demonstrated in many cases [Citation3]. Notably, the fraction of recognized targets of this list ((c)) was essentially the same as the ones truthfully predicted and found at 12 h after miR-17 overexpression for all algorithms.
Taken together our results stress the importance of measuring expression changes early in time after miRNA overexpression in order to gain a more accurate target identification. This is turn is of crucial importance for the training of prediction algorithms and for judging the performance of the algorithms. Our data support a previous observation where a three times larger fraction of targets was recognized 8 h compared to 24 h after overexpression of miR-124 [Citation42]. Regardless of this knowledge, most groups presenting miRNA-target prediction algorithms report using microarray data, obtained at a time point no sooner than 24 h post-transfection or even pool the data generated at different time points [Citation58,Citation59]. Such data may already possess a large fraction of indirectly deregulated targets and impair scoring functions. Indeed, all algorithms, except miRTar, showed a surprisingly high FDRs when dealing with the combined targets from all three time points (Table S4). Even though some algorithms (e.g., miRNATip or microT-CDS) are trained on diverse types of data, including proteomics or immunopurification [Citation14,Citation17], transcriptomics experiments remain a central part of the data base, therefore, the timing of the data collection need to be carefully considered.
Failure to select high-quality experimental data, representing direct miRNA–mRNA interactions, in order to train the prediction algorithms could arguably be a key point behind the highly varying performance of both ‘classical’ and machine learning-based algorithms on the same time-resolved datasets. For instance, over 88% of the downregulated transcripts at 12 h after miR-17 overexpression were recognized by miRmap and miRNATip, whereas only 34% of the transcripts were recognized by miRTar (). In our work, the observed differences can be primarily routed back to the generation of false positives and false negatives with respect to the presence of the seed sequences (). miRmap and miRNATip called more targets than the actual presence of downregulated transcripts with the seed sequences would have allowed. Furthermore, these two algorithms the targets in a seed sequence-independent manner. The opposite situation was observed for miRTar generating a fairly high number of false negatives across all data sets. However, this very restrictive selection also leads to the best FDR of all algorithms. Finally, TargetScan, microT-CDS, MirTarget3 were ‘under-predictors’, but the extent of false negatives was rather varying among miRNAs and may be seed sequence-dependent (). Similar performance was observed for TarPmiR, which training was based on CLASH, PAR- and HITS-CLIP data exclusively [Citation21].
Surprisingly, varying target recognition by the algorithms was achieved among 42 validated targets of miR-17, all of them containing a perfectly matching seed sequence mainly at 3ʹ-UTRs. Regrettably, analysis of the list of validated targets could not reveal any straightforward reasons why the algorithms failed to capture them uniformly and why miRmap and miRNATip generated certain false negatives. Yet, going back to the microarray data of gene expression profiling at 12 h, we observed that the transcripts with multiple seed sequences were recognized by four and more algorithms more frequently than the ones with single seed positions. For example, 3.2 seed sequences on average were found among the downregulated targets of miR-135b, recognized by more than four algorithms, whereas, only 1.3 seed sequences were present among the ones recognized by one to three algorithms. Also, as observed for the time-resolved data, frequently recognized targets (by ≥4 tools out of 7) preferentially bore the seed sequences at their 3ʹ-UTRs, which can obviously be attributed to the fact that the majority of the algorithms consider only this part of the transcript.
One way or another, our data demonstrate striking differences in target recognition efficiency by various bioinformatics tools. Since only checking for the presence of the seed sequence results in too many false-positives (see above), it is of utmost importance to be able to distinguish experimentally discovered targets as direct or secondary targets and using the first to train the algorithms or extract the important sequence information. A combination of early time-points or time-courses for measurements and using data analysis on the measured deregulated mRNA lists that explicitly searches for networks of secondary effects might be a potential remedy in the future which might lead to better FDRs and/or less false negatives.
Data availability
Processed data of miR-517a overexpression experiments are provided as Supplementary Table 1.
Supplemental Material
Download Zip (1.2 MB)Acknowledgments
We thank the Genomics and Proteomics Core Facility, DKFZ Heidelberg, for the support in generating mRNA expression data. We also would like to thank Lars Kaderali, Bettina Knapp and Alexander Nicke for discussions.
Disclosure statement
No potential conflict of interest was reported by the author.
Supplementary material
The supplementary data for this article can be accessed here.
Additional information
Funding
References
- Kozomara A, Griffiths-Jones S. MiRBase: annotating high confidence microRNAs using deep sequencing data. Nucleic Acids Res. 2014;42:68–73.
- Griffiths-Jones S. The microRNA registry. Nucleic Acids Research. 2004;32(90001):109D-111.
- Bobbili MR, Mader RM, Grillari J, et al. OncomiR-17-5p: alarm signal in cancer? Oncotarget. 2017;8(41):71206–71222.
- Dellago H, Bobbili MR, Grillari J. MicroRNA-17-5p: at the Crossroads of cancer and aging - a mini-review. Gerontology. 2016;63:20–28.
- Tan L, Yu JT, Tan L. Causes and consequences of microRNA dysregulation in neurodegenerative diseases. Mol. Neurobiol. 2015;51(3):1249–1262.
- Hu Z, Du J, Ying Y, et al. Single-molecule analysis of colorectal cancer-associated microRNAs via a biological nanopore. Acta Chim. Sin. 2017;75:1087.
- Liu HH, Tian X, Li YJ, et al. Microarray-based analysis of stress-regulated microRNAs in Arabidopsis thaliana. RNA. 2008. DOI:10.1261/rna.895308
- Helwak A, Kudla G, Dudnakova T, et al. Mapping the human miRNA interactome by CLASH reveals frequent noncanonical binding. Cell. 2013;153(3):654–665.
- Chou CH, Shrestha S, Yang CD, et al. MiRTarBase update 2018: A resource for experimentally validated microRNA-target interactions. Nucleic Acids Res. 2018. DOI:10.1093/nar/gkx1067.
- Da Hsu S, Lin FM, Wu WY, et al. MiRTarBase: A database curates experimentally validated microRNA-target interactions. Nucleic Acids Res. 2011. DOI:10.1093/nar/gkq1107.
- Peterson SM, Thompson JA, Ufkin ML, et al. Common features of microRNA target prediction tools. Front Genet. 2014;5:1–10.
- Leoni G, Tramontano A. A structural view of microRNA-target recognition. Nucleic Acids Res. 2016;44:1–8.
- Gan HH, Gunsalus KC. Tertiary structure-based analysis of microRNA-target interactions. RNA. 2013;19:539–551.
- Reczko M, Maragkakis M, Alexiou P, et al. Functional microRNA targets in protein coding sequences. Bioinformatics. 2012;28:771–776.
- Paraskevopoulou MD, Georgakilas G, Kostoulas N, et al. DIANA-microT web server v5.0: service integration into miRNA functional analysis workflows. Nucleic Acids Res. 2013;41:169–173.
- Hsu JB, Chiu CM, Da HS, et al. MiRTar: an integrated system for identifying miRNA-target interactions in human. BMC Bioinformatics. 2011;12. DOI:10.1186/1471-2105-12-300
- Vejnar CE, Zdobnov EM. MiRmap: comprehensive prediction of microRNA target repression strength. Nucleic Acids Res. 2012;40:11673–11683.
- Agarwal V, Bell GW, Nam JW, et al. Predicting effective microRNA target sites in mammalian mRNAs. Elife. 2015;4:1–38.
- Wang XW. Improving microRNA target prediction by modeling with unambiguously identified microRNA-target pairs from CLIP-ligation studies. Bioinformatics. 2016. DOI:10.1093/bioinformatics/btw002
- Fiannaca A, La Rosa M, La Paglia L, et al. MiRNATIP: a SOM-based miRNA-target interactions predictor. BMC Bioinformatics. 2016;17:321.
- Ding J, Li X, Hu H. TarPmiR: A new approach for microRNA target site prediction. Bioinformatics. 2016;32:2768–2775.
- Sethupathy P, Megraw M, Hatzigeorgiou AG. A guide through present computational approaches for the identification of mammalian microRNA targets. Nat Methods. 2006;3(11):881–886.
- Cloonan N, Brown MK, Steptoe AL, et al. The miR-17-5p microRNA is a key regulator of the G1/S phase cell cycle transition. Genome Biol. 2008. DOI:10.1186/gb-2008-9-8-r127
- Parker BJ, Wen J. Predicting microRNA targets in time-series microarray experiments via functional data analysis. BMC Bioinformatics. 2009;10(S1):1–10.
- Pinzón N, Li B, Martinez L, et al. MicroRNA target prediction programs predict many false positives. Genome Res. 2017;27:234–245.
- Baek D, Villén J, Shin C, et al. The impact of microRNAs on protein output. Nature. 2008;455(7209):64–71.
- Lim LP, Lau NC, Garrett-Engele P, et al. Microarray analysis shows that some microRNAs downregulate large numbers of target mRNAs. Nature. 2005;433:769–773.
- Selbach M, Schwanhäusser B, Thierfelder N, et al. Widespread changes in protein synthesis induced by microRNAs. Nature. 2008;455(7209):58–63.
- Seitz H. Issues in current microRNA target identification methods. RNA Biol. 2017;14:831–834.
- Tabas-Madrid D, Muniategui A, Sánchez-Caballero I, et al. Improving miRNA-mRNA interaction predictions. BMC Genomics. 2014;15(Suppl 10):S2.
- Wong N, Wang X. miRDB: an online resource for microRNA target prediction and functional annotations. Nucleic Acids Res. 2015;43:D146–D152.
- Serva A, Knapp B, Tsai Y-T, et al. miR-17-5p regulates endocytic trafficking through targeting TBC1D2/armus. PLoS One. 2012;7(12):e52555.
- Aakula A, Leivonen S, Hintsanen P, et al. MicroRNA-135b regulates ERα, AR and HIF1AN and affects breast and prostate cancer cell growth. Mol Oncol. 2015;9:1287–1300.
- Kallio MA, Tuimala JT, Hupponen T, et al. Chipster: user-friendly analysis software for microarray and other high-throughput data. BMC Genomics. 2011;12(1). DOI:10.1186/1471-2164-12-507
- Haft DH, DiCuccio M, Badretdin A, et al. RefSeq: an update on prokaryotic genome annotation and curation. Nucleic Acids Res. 2018;46(D1):D851-D860.
- Camacho C, Coulouris G, Avagyan V, et al. BLAST+: architecture and applications. BMC Bioinformatics. 2009;10(1):421.
- Zerbino DR, Achuthan P, Akanni W, et al. Ensembl 2018. Nucleic Acids Res. 2018;46(D1):D754-D761.
- Katoh K, Standley DM. MAFFT multiple sequence alignment software version 7: improvements in performance and usability. Mol Biol Evol. 2013;30(4):772–780.
- Liu ZP, Wu C, Miao H, et al. RegNetwork: an integrated database of transcriptional and post-transcriptional regulatory networks in human and mouse. Database. 2015;2015:bav095.
- Keshava Prasad TS, Goel R, Kandasamy K, et al. Human protein reference database - 2009 update. Nucleic Acids Res. 2009;37:D767-D772.
- Jin J, Zhou S, Li C, et al. MiR-517a-3p accelerates lung cancer cell proliferation and invasion through inhibiting FOXJ3 expression. Life Sciences. 2014;108:48–53.
- Wang X, Wang X. Systematic identification of microRNA functions by combining target prediction and expression profiling. Nucleic Acids Res. 2006;34:1646–1652.
- Fang -L-L, Wang X-H, Sun B-F, et al. Expression, regulation and mechanism of action of the miR-17-92 cluster in tumor cells (Review). International Journal of Molecular Medicine. 2017;40(6):1624–1630.
- Du WW, Yang W, Fang L, et al. MiR-17 extends mouse lifespan by inhibiting senescence signaling mediated by MKP7. Cell Death Dis. 2014. DOI:10.1038/cddis.2014.305
- Lu Y, Thomson JM, Wong HYF, et al. Transgenic over-expression of the microRNA miR-17-92 cluster promotes proliferation and inhibits differentiation of lung epithelial progenitor cells. Dev Biol. 2007. DOI:10.1016/j.ydbio.2007.08.007
- Li H, Miao D, Zhu Q, et al. MicroRNA-17-5p contributes to osteoarthritisprogression by binding p62/SQSTM1. Exp Ther Med. 2018. DOI:10.3892/etm.2017.5622
- Wang W, Zhang L, Zheng K, et al. MiR-17-5p promotes the growth of osteosarcoma in a BRCC2-dependent mechanism. Oncol Rep. 2016. DOI:10.3892/or.2016.4542
- Schwentner R, Herrero-Martin D, Kauer MO, et al. The role of miR-17-92 in the miRegulatory landscape of Ewing sarcoma. Oncotarget. 2017;8(7). DOI:10.18632/oncotarget.14091
- Xu Y, Fang F, Zhang J, et al. Mir-17* suppresses tumorigenicity of prostate cancer by inhibiting mitochondrial antioxidant enzymes. PLoS One. 2010;5(12):e14356.
- Li Y, Choi PS, Casey SC, et al. MYC through miR-17-92 suppresses specific target genes to maintain survival, autonomous proliferation, and a Neoplastic state. Cancer Cell. 2014;26(2):262–272.
- Li L, Shi JY, Zhu GQ, et al. MiR-17-92 cluster regulates cell proliferation and collagen synthesis by targeting TGFB pathway in mouse palatal mesenchymal cells. J Cell Biochem. 2012. DOI:10.1002/jcb.23457
- Volinia S, Calin GA, Liu C-G, et al. A microRNA expression signature of human solid tumors defines cancer gene targets. Proc. Natl. Acad. Sci. 2006;103(7):2257–2261.
- Hausser J, Syed AP, Bilen B, et al. Analysis of CDS-located miRNA target sites suggests that they can effectively inhibit translation. Genome Research. 2013;23(4):604–615.
- Brümmer A, Hausser J. MicroRNA binding sites in the coding region of mRNAs: extending the repertoire of post-transcriptional gene regulation. BioEssays. 2014;36(6):617–626.
- Poliseno L, Salmena L, Zhang J, et al. A coding-independent function of gene and pseudogene mRNAs regulates tumour biology. Nature. 2010;465(7301):1033–1038.
- Bosson AD, Zamudio JR, Sharp PA. Endogenous miRNA and target concentrations determine susceptibility to potential ceRNA competition. Mol Cell. 2014;56:347–359.
- Tian W, Du Y, Ma Y, et al. MALAT1–miR663a negative feedback loop in colon cancer cell functions through direct miRNA–lncRNA binding. Cell Death Dis. 2018;9. DOI:10.1038/s41419-018-0925-y.
- Eichhorn SW, Guo H, McGeary SE, et al. mRNA destabilization is the dominant effect of mammalian microRNAs by the time substantial repression ensues. Mol Cell. 2014;56:104–115.
- Gennarino VA, Sardiello M, Avellino R, et al. MicroRNA target prediction by expression analysis of host genes. Genome Res. 2009. DOI:10.1101/gr.084129.108