
ABSTRACT
Modifications of short RNAs at specific sites can be achieved commercially by solid-phase chemical synthesis method. However, labelling long RNAs is still challenging for the routine methods. Position-selective Labelling of RNA (PLOR) is a hybrid phase transcription method that allows to label RNAs at desired sites with great flexibility and decent efficiency. In principle, PLOR is a promising method for synthesis of long modified RNAs that are unable to be generated by solid-phase chemical synthesis and other methods. However, as a recently developed method, PLOR has been only applied to label a 71nt and a 104nt RNA, and the limited sequence applications of PLOR may hinder its potential usages. To extend PLOR to more RNAs, we tested the PLOR performances for various RNA sequences. Considering that the controlled transcriptional pauses at the initiation stage in PLOR may lead to different preferences on RNA sequences from in vitro transcription method, we here focused on identifying the effects of the 5ʹ-end and initiated lengths of RNA on PLOR. In addition, our work demonstrated that PLOR efficiencies also varied with linker sizes of DNA templates. This work can facilitate PLOR to be the choice of synthesizing long modified RNAs for more users in the near future.
Introduction
Elucidating the structures and dynamics of RNAs is fundamentally important to comprehend their functions [Citation1–Citation3]. At present, the most widely used methods to study RNA structures or dynamics at atomic resolution include Nuclear Magnetic Resonance (NMR), X-ray crystallography, and Förster Resonance Energy Transfer (FRET) methods. Specific-labelling favours these methods, for example, alleviation of NMR spectral superposition and withdrawal of phase information for X-ray crystallography by using isotope and heavy-atom labelled RNAs, respectively [Citation4–Citation10]. And fluorophore-labelled RNAs are necessary for fluorescent studies since natural RNAs are non-fluorescent [Citation11–Citation13]. In addition, site-specific modifications can improve the stability and affect intra- and inter- molecular interactions of RNAs, and hence has affected RNA applications in multiple fields, including molecular probes, disease diagnose, drug design, and so on [Citation14,Citation15].
Currently, the most widely used methods for synthesizing labelled RNAs are solid-phase chemical synthesis and liquid-phase in vitro transcription (IVT). The solid-phase chemical synthesis allows labelling RNAs at chosen positions with great flexibility and commercial convenience. However, it is challenging to label long RNAs by this method due to efficiency [Citation16,Citation17]. IVT has been used to generate RNAs as long as thousands of nucleotides and label RNAs by nucleotide types frequently, but unable to introduce modifications to specific sites of RNAs as desired [Citation18,Citation19]. PLOR is a hybrid solid-liquid phase method developed upon IVT, and the significant advantage of PLOR is its capability of site-specifically labelling long RNAs [Citation20,Citation21]. Instead of uninterrupted synthesis in the traditional IVT, PLOR reaction is separated into three stages: initiation, elongation and termination stage by NTP shortage (Supplementary Material, Fig. S1). Three or less types of NTPs are added in the initiation stage or individual cycle at elongation stage, the transcription processes of PLOR are paused consequentially because of omitting the needed NTPs, and continue later after removal of the residual NTPs and addition of fresh NTPs containing the requisite ones. Such segmented processes in PLOR allow labelling RNAs co-transcriptionally following the designed synthesis schemes(Supplementary Material, Fig. S1) [Citation8,Citation20,Citation21].
The experimental conditions crucial for PLOR, including concentrations of DNA template, RNAP (RNA polymerase), NTPs, reaction time and temperatures have been optimized for the 71nt adenine riboswitch RNA (riboA) previously, and the optimized conditions also work well for synthesizing a 104nt virus RNA [Citation20,Citation21]. However, as a new method derived from IVT method, PLOR has only been applied to label the 104nt virus RNA besides riboA [Citation20]. In IVT, behaviours of T7 RNAP differentiate among RNA sequences, especially 5ʹ-sequences, possibly because the initiation complex formed between T7 RNAP, DNA and newly transcribed RNA at the initiation stage is less stable than elongation complex [Citation22,Citation23]. Very likely, T7 RNAP’s preferences for RNA sequences, especially for 5ʹ-end sequences in IVT are different from those in PLOR, since the transcription initiation of PLOR are delicately separated from the following stages for missing a certain type of NTP. What’s more, the transcript length synthesized at the initiation stage is related directly with the stability of initiation complex, and could also be crucial for PLOR. In others’ and our studies, the uninterrupted transcription of at least 8 nucleotides (nt) is pre-requisite for efficient initiation in both IVT and PLOR [Citation20,Citation22–Citation25]. This is understandable because overly short transcripts may inhibit the formation of a stable initiation complex, aborting transcription and leading to detachment of T7 RNAP from the solid phase. However, no information about the optimal initiated length has been reported. The optimal initiation length may not be important in IVT as in PLOR, since full-length products are transcribed uninterrupted in IVT, however, the initiation stage in PLOR is separated from other stages as designed by NTP missing. Therefore, besides longer than 8nt, initiation lengths in PLOR may have more requirements to meet. In brief, the performances of PLOR on diverse RNA sequences, especially at 5ʹ-end, and various initiation lengths are very possibly different from traditional IVT. The sequences tested on PLOR here were derived from riboA and an 88nt TPP riboswitch RNA (riboTPP) (the secondary structures of riboA and riboTPP are shown in ,). RiboA and riboTPP are riboswitch RNAs, they can differentiate their specific ligands among hundreds of small molecules in cells with structural changes, leading to regulate the expression of downstream genes [Citation26,Citation27]. The specific ligands for riboA and riboTPP are adenine and thiaminpyrophosphate (TPP), shown in . 5 sequences from riboA and 3 sequences from riboTPP with minimal mutations at 5ʹ-end plus alternative NTP combinations to acquire initiation lengths ranged from 7 to 37nt in PLOR reactions (all RNA sequences are listed in Supplementary Material, Table S1 and S2). 9 different sequences derived from riboTPP with the same initiation length were used to observe 5ʹ-sequence effects on PLOR. DNAs only different at linkers can generate the same RNA, and 7 such DNA sequences were used to identify the effects of linkers on PLOR.
Figure 1. The secondary structures of RNAs generated by PLOR. (A) The secondary structure of riboA. (B) The secondary structure of riboTPP. (C) The chemical structures of adenine (the specific ligand for riboA) and TPP (the specific ligand for riboTPP).
Overall PLOR is a promising method to provide modified long RNAs that are unavailable for chemical synthesis and other methods. The initiation of PLOR is unique from IVT, hence here we focused on testing crucial initiation factors for PLOR, including transcribed sequences, lengths, and DNA linkers. According to our results, the first 6 nucleotides at the 5ʹ-end of transcripts affect the PLOR yields more significantly than the following nucleotides, and 5ʹ-GGG is optimal among various sequences we tested. For the initiated lengths from 7nt to 37nt, 11nt~19nt is favourable for PLOR reactions. And the DNA linkers do not show obvious impacts on PLOR as long as they are longer than 18bp. The performances of PLOR on sequences are important to popularize the PLOR method in RNA field. The sequence screening done here is primitive to rationalize PLOR, however, the fundamental preferences of PLOR in RNA and DNA sequences will provide guidance for the researchers to generate labelled RNAs.
Results
The effects of the initiated lengths on PLOR
In our hands, the abortive products at the initiation stage are indeed much more than other stages of PLOR (the diagrams of PLOR generation of riboA are shown in , and the abortive products are circled in the red rectangle at ). To rationalize the initiation lengths for PLOR, we altered the sequences of riboA and riboTPP with minimal mutations or different NTP combinations at the initiation stage to achieve initial transcripts diverse from 7 to 37nt on length. 5 sequences including i7- (or i9-), i11-, i13-, i24-, i37-riboA and 3 sequences i9- (or i13-), i19-, i24-riboTPP were used here to identify the optimal initial lengths for PLOR. The sequences are named beginning with ‘i’, abbreviated for initiation, and the numbers following ‘i’ indicates the initiated nucleotide number. For example, i7 stands for the RNA in which the first 7 nucleotides were synthesized at the initiation stage. And 9, 11, 13, 19, 24 and 37 nucleotides were transcribed at the initiation stage in producing i9-, i11-, i13-, i19-, i24- and i37-RNA by PLOR, respectively. The schematic transcripts generated at 2-step PLOR are shown in . Initiation was shortened to 9nt by mutating a U at the wild-type (i13-riboA) to a C at i9-riboA (the different nucleotides between i9- and i13-riboA are highlighted in blue at Supplementary Material, Table S1). And the initiation length of 11nt was reached by switching an A at i13-riboA to a C at i11-riboA (the involved nucleotides are highlighted in green at Supplementary Material, Table S1). The extension of initiation length to 37nt was achieved by replacing the first two Cs at the 5ʹ-end of i13-riboA with Us in i37-riboA, and extra mutation of a G at i13-riboA to a C change the initiation length to 24nt for i24-riboA (the mutations at i24- and i37-riboA are highlighted in yellow at Supplementary Material, Table S1). With the addition of ATP/GTP/UTP, the initiations of PLOR were paused after transcribing the 9th, 11th, 13th, 24th and 37th nucleotides for i9-, i11-, i13-, i24- and i37-riboA, respectively (the paused positions are shown by blue double slash at Supplementary Material, Table S1). The initiated lengths can also be changed by altering NTP additions besides sequence mutations. For example, the sequences of i7- and i9-riboA are the same, the initiation lengths of 7nt and 9nt were reached by ATP/GTP for i7-riboA and ATP/GTP/UTP for i9-riboA, respectively at the 2-step PLOR. Comparing the average yield for 4 rounds, 2-step PLOR reactions for riboA (), we observed significant differences, and the highest yield was 36.2%, from i11-riboA, and the lowest yield was less than 5.0%, from i7-riboA. The low yield for i7-riboA is agreed with the aforementioned statement that initiation of 8nt or longer is required for both IVT and PLOR. The average yield for i9-riboA was 8.3%, higher than i7-riboA. This is convincing to support that the initiation lengths do affect PLOR efficiencies since the two sequences are the same. Both the yields for i7- and i9-riboA were significantly lower than the average yields for i11-(36.2%) or i13-riboA(30.5%) at the 2-step PLOR reactions (, left). Surprisingly, i24- and i37-riboA were produced with lower yields than i11- or i13-riboA, and the yield for i37-riboA was too low to be detected (, left).
Figure 2. The schematic procedures of 2-step, 3-step and 4-step PLORs for riboA synthesis. In the initiation, the DNA-beads incubate with T7 RNAP, ATP/GTP/UTP to generate a 13nt-transcript. T7 RNAP pauses at the initiation stage due to lack of CTP. The elongation stages are performed differently in PLORs. For 3-step PLOR: only 1 cycle is included in elongation stage, and the addition of ATP/CTP/UTP generates a 19nt-transcript, paused due to lack of GTP. For 4-step PLOR: 2 cycles of elongation are performed, and the additions of ATP/CTP/UTP at cycle 1, ATP/GTP/UTP at cycle 2 generate a 37nt-transcript. The termination stages for 3-step and 4-step PLORs are the same as 2-step PLOR: the addition of ATP/CTP/GTP/UTP completes the transcription of full-length riboA.
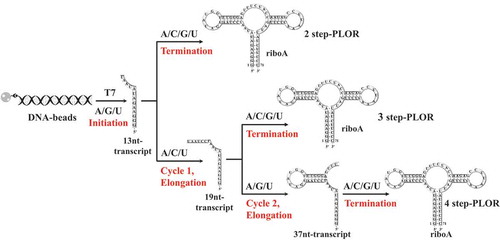
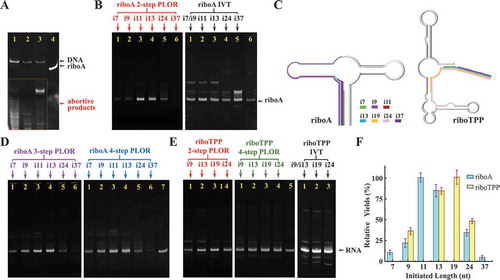
Figure 3. Comparison of PLOR efficiency on riboA and riboTPP with diverse initiation lengths. (A) Eluents of the 4-step PLOR for riboA at the initiation stage (Lane 1), cycle 1 of elongation (Lane 2), cycle 2 of elongation (Lane 3), and termination stage (Lane 4). The eluent collected at step 4 (termination) is the full-length riboA. Abundant transcripts are observable at the initiation stage. (B) Gel images of crude products at 2-step PLOR for riboA (left, red marks): i7 (Lane 1), i9 (Lane 2), i11 (Lane 3), i13 (Lane 4), i24 (Lane 5), i37 (Lane 6) and IVT (right, black marks): i7 or i9 (Lane 1), i11 (Lane 2), i13 (Lane 3), i24 (Lane 4), i37 (Lane 5), control (1.25pmoles purified riboA, Lane 6). (C) The schematic synthesis processes of 2-step PLOR for riboA (left) and riboTPP (right). The initiated sequences for riboA: i7 (green), i9 (magenta), i11 (red), i13 (blue), i24 (pink), and i37 (purple). The initiated sequences for riboTPP: i9 (magenta), i13 (blue), i19 (orange), and i24 (pink). (D) Gel images of crude products at 3-step PLOR (left, purple marks) and 4-step PLOR (right, blue marks) for riboA: i7 (Lane 1), i9 (Lane 2), i11 (Lane 3), i13 (Lane 4), i24 (Lane 5), i37 (Lane 6) and control (1.25pmoles purified riboA, Lane 7). (E) Gel images of crude products at 2-step PLOR (left, red marks) and 4-step PLOR (middle, green marks) for riboTPP: i9 (Lane 1), i13 (Lane 2), i19 (Lane 3), i24 (Lane 4), and control (1.25pmoles purified riboTPP, Lane 5). Gel image of crude products at IVT for riboTPP (right, black marks): i9 or i13 (Lane 1), i19 (Lane 2) and i24 (Lane 3). (F) Relative yields of 2-step PLOR for riboA (blue) and riboTPP (yellow) varying with initiated lengths. The yields of i11-riboA and i19-riboTPP were set to 100% in the individual RNA system. Mean values ± s.d. of three or four replicates are shown.
In short, 11nt and 13nt are the optimal initiation lengths for riboA system, and the PLOR yields for riboA system decreases with the initiation lengths by the order: 11nt>13nt>24nt>9nt>7nt>37nt. The low yields for 7nt- and 9nt-initiation may be because that the transcription complexes require long enough transcripts to be stabilized, which allows following transcription to elongate effectively. However, 37nt-initiation was the least productive for PLOR. The possible reason to cause this is that T7 RNAP may transit from initiation to elongation conformation during generation of new transcript as long as 37nt, and the experimental conditions suitable for initiation do not fit the highly processive elongation [Citation21]. The optimal sequences in IVT are i11- and i13-riboA, consistent with those in PLOR. However, the efficient differences of IVT among sequences are less significant than those of PLOR (). It is worth to point it out that i7- (or i9-), i24 and i37-riboA were generated decently in IVT, although their counterparts were synthesized inefficiently in PLOR (). Similar yield tendency from i7- to i37-riboA was observed at the 3-step and 4-step PLOR (). The schematic procedures of 2-step, 3-step and 4-step PLOR reactions for riboA system are shown in , and the reagent information used in PLOR is listed in Supplementary Material, Table S1, S3, S5-S8.
The effects of initiation lengths on PLOR were also tested in another RNA system, riboTPP. The initiation lengths for i9-, i13-, i19- and i24-riboTPP vary from 9 to 24nt, which were also achieved by both sequence mutations and alterable NTP addition. For example, extension of the initiation from 13nt to 19nt in PLOR was achieved by changing the first U at i13-riboTPP to a C at i19-riboTPP (the involved nucleotides are highlighted in yellow at Supplementary Material, Table S2). And the initiation was lengthened to 24nt by switching a U at i19-riboTPP to a C at i24-riboTPP (the involved nucleotides are highlighted in green at Supplementary Material, Table S2). Besides i9-riboTPP, the initiation was generated with the addition of ATP/CTP/GTP in PLOR. The sequence of i9-riboTPP is the same as i13-riboTPP, and only ATP/GTP was added at the initiation stage of PLOR for i9-riboTPP to differentiate the initiation from i13-riboTPP. The yields for 3 rounds of 2-step PLOR reactions for riboTPP RNAs were averaged. The optimal yield, 33.1% was calculated for i19-riboTPP, slightly higher than 28.5% for i13-riboTPP. The average yields of i9- and i24-riboTPP were 12.5% and 17.0%, both lower than the yields of i13- or i19-riboTPP at the 2-step PLOR (, left). In 4-step PLOR, the optimal yields were obtained for i13- and i19-riboTPP, too. And the yields for i9- and i24-riboTPP are slightly lower than the optimal yields (, middle). No significant differences were observed on the yields of i13-, i19- and i24-riboTPP in IVT (, right). In riboTPP system, the optimal initiation lengths are 19nt and 13nt for both 2-step and 4-step PLOR. The reagent information used in PLOR is listed in Supplementary Material, Table S2, S4, S5 and S9-S10.
For the two RNA systems, riboA and riboTPP, the sharing initiation lengths are 9nt, 13nt and 24nt. Similar yields of PLOR are observed for same initiation lengths of two RNA systems, and also, both yields decrease as 13nt>24nt>9nt (). And for both systems, the initiation lengths lower than 10nt or longer than 24nt have lower PLOR yields than those between 11 ~ 19nt ().
The effects of the initiated sequences on PLOR
The RNA sequences, especially those at 5ʹ-end affected the traditional IVT method significantly [Citation18,Citation28]. Since PLOR is the derived ‘pause-restart’ transcription, the 5ʹ-end sequences may affect PLOR differently from the traditional transcription method. We transcribed 9 sequences from riboTPP differentiated at 5ʹ-end by the 2-step, 4-step and 6-step PLOR reactions. The schematic procedures for 2-step, 4-step and 6-step PLOR are shown in . The sequences used in this section are listed at Supplementary Material, Table S2. 8 sequences, named M1-M7 and M9 were mutated at the 5ʹ-end of the wild-type, M8-riboTPP (the mutated sequences are underlined at Table S2). To avoid possible bias on yields brought by initiation lengths, the mutations in the 8 sequences were made without introducing U to maintain the initiation length to be 13nt with the addition of ATP/CTP/GTP (the pause positions at the 2-step PLOR are marked by blue double slash in Table S2). The reagent information used in PLOR is listed in Supplementary Material, Table S2, S4, S5 and S9-S11. To observe the sequence impacts on PLOR more delicately, we divided the riboTPP sequences into two groups: group 1 includes M1-M6, and group 2 includes M2, M7-M9. Different nucleotides in group 1 and 2 are distributed at the first 6 nucleotides (+1 to +6), and the following 5 nucleotides (+7 to +11), respectively (nucleotides different from M2-riboTPP are shown in red at Fig. 5 and Supplementary Material, Table S2). For 2-step PLOR, the yields of group 1 varied greatly, and the RNA starting with GGGAGA (M4-riboTPP) was transcribed with the highest efficiency, 29.0% (). The average yield for M2-riboTPP (5ʹ-GGGAAG) was 24.1%, higher than 5ʹ-GGCAAC (M5) or 5ʹ-GGGGAC (M6) (). And the average yields for M5 and M6 were 7.1% and 10.0%, respectively. And the PLOR initiated with GGCACC (M1) or GCGCCG (M3) were barely detected (). Considering that the three optimal yields at 2-step PLOR are M2 (5ʹ-GGGAAG), M4 (5ʹ-GGGAGA) and M6 (5ʹ-GGGGAC), all with 5ʹ-GGG, we speculated that the effect of the first 3 nucleotides at the 5ʹ-end may have greater effect on the PLOR yields than next nucleotides. It is worth to point out that four consecutive G at the 5ʹ-end, M6 (5ʹ-GGGGAC) didn’t actually improve efficiency (). From the limited sequences we tested, it seemed that the less C in the first six nucleotides of the RNA products, the higher efficiency of PLOR. To further test the sequence preferences in PLOR, we re-generated the sequences, M2, M4 and M5 by 6-step PLOR. And similar behaviours for the 3 sequences were observed in 6-step PLOR as 2-step PLOR although the overall efficiency of 6-step PLOR was lower than 2-step PLOR as expected ().
Figure 4. The schematic procedures for 2-step, 4-step and 6-step PLORs for riboTPP. The flow paths for 2-step, 4-step and 6-step follow black, green and blue arrows, respectively. In the initiation, the DNA-beads incubate with T7 RNAP, ATP/CTP/GTP to generate a 13nt-transcript. T7 RNAP pauses at the initiation stage due to lack of UTP. The elongation stages are performed differently in PLORs, and 2-step PLOR skips the elongation stage. For 2-step PLOR (black flow path): the addition of ATP/CTP/GTP/UTP at the termination stage completes the transcription of full-length riboTPP; For 4-step PLOR (green flow path): 2 elongation cycles are included, the addition of CTP/GTP/UTP at cycle 1 generates a 33nt-transcript, pausing the transcription due to lack of ATP. And later ATP/CTP/GTP addition elongates the transcript to 38nt. For 6-step PLOR (blue flow path): 4 cycles of elongation are performed, and the additions of CTP/GTP/UTP at cycle 1, ATP/CTP/GTP at cycle 2, ATP/GTP/UTP at cycle 3 and CTP/GTP/UTP at cycle 4 generate a 52nt-transcript. The termination stage for 4-step and 6-step PLORs are transcribed as described for 2-step PLOR.
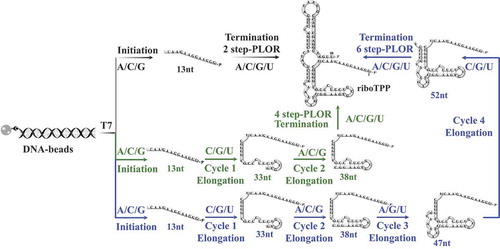
Figure 5. Comparison of PLOR efficiency for riboTPP with different 5ʹ-end. (A) Gel image of the crude products generated by 2-step PLOR (red marks): M1 (Lane 1), M2 (Lane 2), M3 (Lane 3), M4 (Lane 4), M5 (Lane 5), and M6 (Lane 6). The sequences from M1 to M6 are different at the first 6 nucleotides of 5ʹ-end (shown in (B)). (B) Gel images of the crude products of 6-step PLOR (left, blue marks): M2 (Lane 1), M4 (Lane 2), M5 (Lane 3); IVT (middle, black marks): M2 (Lane 1), M4 (Lane 2), M5 (Lane 3); IVT (right, black marks): M1 (Lane 1), M3 (Lane 2), M6 (Lane 3). The beginning sequences of M1~ M6 are listed in group 1, with different nucleotides shown in red. (C) Gel image of the crude products generated by IVT (black marks): M2 (Lane 1), M7 (Lane 2), M8 (Lane 3), M9 (Lane 4) and 4-step PLOR (green marks): M2 (Lane 5), M7 (Lane 6), M8 (Lane 7), M9 (Lane 8). The beginning sequences of M7~ M9 are listed in group 2 at (B), with different nucleotides shown in red. (D) Relative yields of 2-step PLOR (yellow) and IVT (green) varying with initiated sequences. The yields of M4 and M2 were set to 100% in PLOR and IVT, respectively. Mean values ± s.d. of three replicates are shown.
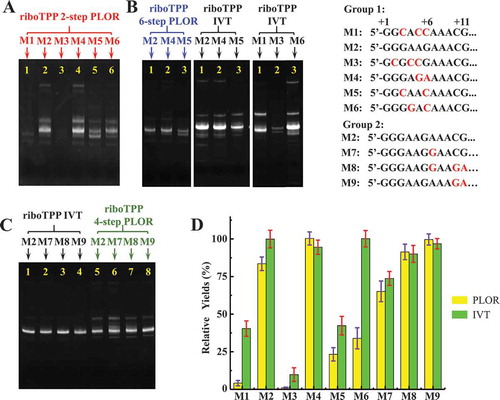
Based on our tests for group 1, most sequence preferences for PLOR are consistent with IVT, for example, the yields for 5ʹ-GGGAAG (M2) and GGGAGA (M4) were higher than 5ʹ-GGCAAC (M5) in both PLOR and IVT methods, although the PLOR, one-round transcription reaction, was less efficient than IVT as expected (). However, for 5ʹ-GGGGAC (M6), its performances for IVT and PLOR are significantly different. In a short summary, for the sequences of group 1, the average yields for 3 rounds, 2-step PLOR from high to low is ordered as 5ʹ-GGGAGA (M4), GGGAAG (M2), GGGGAC (M6), GGCAAC (M5), GGCACC (M1)and GCGCCG (M3) (). For IVT, the yields from high to low are 5ʹ-GGGAAG (M2) or GGGGAC (M6), GGGAGA (M4), GGCAAC (M5), GGCACC (M1) and GCGCCG (M3)(). To further identify if the sequences besides the first six nucleotides at the 5ʹ have impacts on PLOR yields, we tested the sequences in group 2. The sequences M2 and M7-M9 in group 2, have the same 5ʹ-GGGAAG, and their differences are located at position from +7 to +11 (the different nucleotides among group 2 are shown in red, ). No significant differences were observed for both IVT and PLOR (). In our hands, the impact of the sequences from 7 to 11 sites on PLOR is not as significant as those from 1 to 6 sites at 5ʹ-end (). All RNA sequences tested in this section are listed in Supplementary Materials, Table S2.
The effect of the linkers of DNA templates on PLOR
The linker region (, orange) is to connect the biotin group and the promoter sequence on the DNA templates. The linker region is specific for PLOR system, and the main purpose of the linker is for steric alleviation between DNA-beads and T7 RNAP. Although the linker change won’t affect the sequences of the products, it may affect the efficiencies. To identify the relationship between the linker length and PLOR efficiency, we constructed 7 DNAs different at linkers solely, named 0 L, 5 L, 15 L, 18 L, 20 L, 30 L and 15 S, respectively. 0 L represents the DNA template without linker, and 5 L represents the DNA template with a 5-bp linker, and so on. All linkers in the templates are double-stranded base pairs (bp). Except 15 S, the linker sequences are shortened from the 30 L. The linker sequence in 15 S is different from 15 L, and such design is to identify whether the linker sequences matter or not in PLOR synthesis. The sequences of the linkers are listed in Supplementary Material, Table S3.
Figure 6. Comparison of PLOR efficiency on different linkers. (A) Solid-phase DNA-beads. Biotin labelled double-stranded DNA templates are attached to neutravidin-coated agarose beads (grey sphere). A linker (orange) is inserted between the T7 promoter (purple duplex) and the biotin group (light blue sphere) to alleviate the steric interferences between T7 RNAP and beads. (B) Gel image of the crude products from 2-step PLOR for riboA synthesis with different linkers: 0 L (Lane 1), 5 L (Lane 2), 15 L (Lane 3), 18 L (Lane 4), 20 L (Lane 5), 30 L (Lane 6), and 15 S (Lane 7). (C) Relative yields of 2-step PLOR varying with linkers. The yield of 18 L was set to 100% of the individual system. Mean values ± s.d. of three replicates are shown.
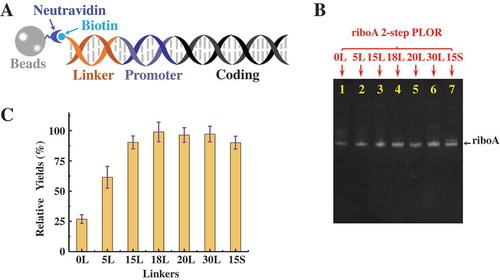
The yields for the shorter linkers including 0 L and 5 L were relatively lower than others (). The average yields of 3 rounds, 2-step PLOR by using 0 L and 5 L are less than 20%, lower than the average yield by using 18 L, 30.5%. The lower yields for the shorter linkers may be because of steric disturbances between T7 RNAP and the solid-phase DNA-beads. For example, for the 0 L template, the T7 RNAP binding sequence (the promoter) is separated from the solid phase beads only by a biotin. Consequentially, T7 RNAP has to squeeze along the beads in order to interact with the promoter of 0 L-DNA. The steric hindrance between the agarose beads and T7 RNAP alleviated as the linkers lengthen. Therefore, the optimal yields were reached for 18bp or longer linkers. No significant improvementsfrom 18 L to 30 L were detected. Furthermore, no observable differences on yields between 15 L and 15 S were obtained (). It indicates that the lengths instead of the sequences of the linkers affect PLOR, and the suggested linker length is at least 18bp.
Discussion
To facilitate wider applications of PLOR, we tested 16 RNAs and 7 linkers to observe the effects of the initiated lengths, 5ʹ-end of RNAs and DNA linkers on PLOR. Firstly, efficiency change with initiation lengths on the same sequences (i7/i9-riboA, or i9/i13-riboTPP), convincingly support that initiation length do affect PLOR. And our results indicate that initiation lengths shorter than 9nt or longer than 24nt are not beneficial for PLOR and should be avoided possibly by mutations. We suggest users to initiate PLOR reactions with 11 to 19 nucleotides at first attempts for a new system. However, since we have only tested limited RNAs, wider screening of initiation length for PLOR reactions is recommended when first trials failed. Secondly, our tests identify that the yields of PLOR alter substantially with the first six nucleotides at the 5ʹ-end of RNAs, 5ʹ-GGG is a good choice for PLOR, and low yields may be attributed to too many Cs at the 5ʹ-end. In addition, sequence preference in PLOR is not following IVT, and 5ʹ-GGGGAC (M6) is one such example. This may be related with the fact that T7 RNAP in PLOR is forced to discontinue transcription due to NTP shortage. The nucleotides located at the position +7 to +11 of RNA brought much less impact on PLOR or IVT than the beginning 6 nucleotides. Therefore, we suggest users to mutate the beginning 6 nucleotides at initial tests to get their optimal sequences for PLOR synthesis. Thirdly, among the linker length from 0 to 30bp, 15 ~ 30bp is sufficient for alleviating steric hindrance between T7 RNAP and DNA-beads. In brief, adding a 15 ~ 30bp linker, creating a strong initiation sequence and adjusting to the appropriate initiation length are essential to obtain a decent yield in a PLOR system. Nevertheless, RNA sequences could not be mutated randomly, it is important to note that the sequence characteristics and secondary structures of RNAs need to be considered in advance. The sequence with desired length synthesized at initiation stage should contain only at most three nucleotides, one of which has to be G in order to take advantage of strong initiation sequences. Furthermore, the sites of mutation cannot include the pivotal nucleotides for secondary structure formation to avoid affecting the natural folding of RNA. Although the sequences we tested are limited and the actual relationship between yields and sequences may be much more complicated than exposed in this work, our findings can potentially motivate further applications for PLOR in preparing modified various RNAs.
Materials and methods
Reagents
The whole-gene pUC57 plasmid vectors inserted with DNA template sequences and the primers for PCR reactions were ordered from Sangon Biotech (Shanghai, China); Plasmid extraction kits (Axygen, Union City, USA); Centrifugal filter (Merck Millipore ltd, Darmstadt, Germany); Neutravidin-coated agarose beads and 0.8 mL Pierce centrifuge column (Thermo Fisher Scientific, Waltham, USA); Ultra Gelred Nucleic Acid Stain (VAZYME Biotech, Nanjing, China); MgCl2, MgSO4 and NaAC (Sangon Biotech, Shanghai, China); KCl, K2SO4, EDTA and Tris-HCl (Sangon Biotech, Shanghai, China). Buffers used in this study, such as 10x PCR buffer, gel soaking buffer, 5x initiation buffer, 1x elongation buffer, washing buffer and incubation buffer, were prepared as described earlier [Citation20].
DNA-beads preparation
Plasmid extraction kit was used to extract plasmids containing the target DNA sequence from E. coli. The extraction procedure was following the manufacturer’s instruction. Using the plasmid as the template, PCR was performed with the forward primer with biotin-modified at the 5ʹ end and the reverse primer to obtain the target DNA with biotin at 5ʹ-end. PCR reaction mixtures (100 μL) contained 50 mM KCl, 2.5 mM MgCl2, 0.5 ~ 1.0 mM dNTPs, 0.0005 ~ 0.002 μM plasmid DNA template, 1 ~ 5 μM biotin-forward primer and reverse primer and 0.16 ~ 0.64 μM Taq DNA polymerase. The PCR product was condensed using Amicon-Ultra filter unit (cut-off molecular weight 10 K) and purified by 12% denaturing-polyacrylamide gel electrophoresis. All DNA templates and primers used in this paper were listed in Supplementary Material, Table S3-S5 (the linker and promoter sequences in Table S3 and S4 are in italic and underlined, respectively). 1 nmoles DNA templates mixed with about 10 μL bead slurry for 3 h at room temperature to immobilize DNAs to the solid-phase beads. The unbounded DNAs were removed by filter using Pierce centrifuge column. DNA-beads were stored at 4°C for further use.
PLOR reactions
The schematic procedures for 2-step, 3-step and 4-step PLOR reactions for riboA system were shown in . And the procedures for 2-step, 4-step and 6-step PLOR for riboTPP were shown in . The first step is also called initiation stage. Except where noted, the concentrations of DNA and T7 RNA polymerase were 5 μM, the reaction volume was 100 μL. The initiation stage reacted at 37°C for 15 min and other steps in elongation or termination stages were at 25°C for 10 min (Supplementary Material, Fig. S1). Reagent exchanges between steps were achieved by solid-liquid phase extraction using Pierce centrifuge column. DNA-bead rinsing was repeated 3 to 5 times to remove the residual NTPs at previous steps and avoid cross contamination. Beads were rinsed by using 100 μL washing buffer (6 mM MgSO4 and 40 mM Tris-HCl), at least 3 times. The PLOR were following the procedures described earlier [Citation20]. The NTP addition of 2-step, 3-step and 4-step PLORs for riboA system are listed in Table S6, S7 and S8 of Supplementary Material, respectively. The NTP addition of 2-step, 4-step and 6-step PLORs for riboTPP system are listed in Table S9, S10 and S11 of Supplementary Material, respectively.
In vitro transcription (IVT)
Reaction mixtures, containing 0.1 μM DNA template, 6.8 μM T7 RNA polymerase, 5 mM NTPs were incubated at 37ºC for 3 h in the transcription buffer (200 mM HEPES, 20 mM DTT, 25 mM MgCl2, pH 7.5).
Quantification of PLOR yields
The experimental yields of PLOR were detected by quantifying gel band intensities. PLOR reaction (1 ~ 3 µL) and purified standard RNAs (1 ~ 2 pmoles) were loaded to 12% denaturing-polyacrylamide (PAGE) analysis gel. The gel was stained by Ultra Gel Red Nucleic Acid Stain for ~2 min after running the gel for 30 ~ 60 min at ~100 volts, then visualized under 260 nm-UV by Tanon 2500 R Gel imaging analyser. The stained gel band intensities were quantified based on the loaded standard purified RNAs using Gel imaging software of Tanon 2500 R, then divided by the amount of DNA templates used in generating the products, and shown as a percentage relative to the amount of template.
Supplemental Material
Download MS Word (429.7 KB)Disclosure statement
The authors have no conflict of interest.
Supplementary data
The supplementary data for this article can be accessed here.
Additional information
Funding
References
- Montange RK, Batey RT. Riboswitches: emerging themes in RNA structure and function. Annu Rev Biophys. 2008;37:117–133.
- Watters KE, Abbott TR, Lucks JB. Simultaneous characterization of cellular RNA structure and function with in-cell SHAPE-Seq. Nucleic Acids Res. 2016;44:e12.
- Piao M, Sun L, Zhang QC. RNA regulations and functions decoded by transcriptome-wide RNA structure probing. Genomics Proteomics Bioinformatics. 2017;15:267–278.
- Asadi-Atoi P, Barraud P, Tisne C, et al. Benefits of stable isotope labeling in RNA analysis. Biol Chem. 2019;400:847–865.
- Marchanka A, Kreutz C, Carlomagno T. Isotope labeling for studying RNA by solid-state NMR spectroscopy. J Biomol NMR. 2018;71:151–164.
- Scott LG, Hennig M. 19F-site-specific-labeled nucleotides for nucleic acid structural analysis by NMR. Methods Enzymol. 2016;566:59–87.
- LeBlanc RM, Longhini AP, Le Grice SFJ, et al. Combining asymmetric 13C-labeling and isotopic filter/edit NOESY: a novel strategy for rapid and logical RNA resonance assignment. Nucleic Acids Res. 2017;45:e146.
- Stagno JR, Yu P, Dyba MA, et al. Heavy-atom labeling of RNA by PLOR for de novo crystallographic phasing. PLoS One. 2019;14:e0215555.
- Sheng J, Huang Z. Selenium derivatization of nucleic acids for X-ray crystal-structure and function studies. Chem Biodivers. 2010;7:753–785.
- Golden BL, Gooding AR, Podell ER, et al. X-ray crystallography of large RNAs: heavy-atom derivatives by RNA engineering. RNA. 1996;2:1295–1305.
- van der Feltz C, Hoskins AA. Methodologies for studying the spliceosome’s RNA dynamics with single-molecule FRET. Methods. 2017;125:45–54.
- Boerneke MA, Hermann T. Conformational flexibility of viral RNA switches studied by FRET. Methods. 2015;91:35–39.
- Walter NG. Probing RNA structural dynamics and function by fluorescence resonance energy transfer (FRET). Curr Protoc Nucleic Acid Chem. 2003. Chapter 11:Unit11.10:1–23.
- Selvam C, Mutisya D, Prakash S, et al. Therapeutic potential of chemically modified siRNA: recent trends. Chem Biol Drug Des. 2017;90:665–678.
- Ku SH, Jo SD, Lee YK, et al. Chemical and structural modifications of RNAi therapeutics. Adv Drug Deliv Rev. 2016;104:16–28.
- Becette O, Olenginski LT, Dayie TK. Solid-phase chemical synthesis of stable isotope-labeled RNA to aid structure and dynamics studies by NMR spectroscopy. Molecules. 2019;24:e3476.
- Paredes E, Evans M, Das SR. RNA labeling, conjugation and ligation. Methods. 2011;54:251–259.
- Milligan JF, Groebe DR, Witherell GW, et al. Oligoribonucleotide synthesis using T7 RNA polymerase and synthetic DNA templates. Nucleic Acids Res. 1987;15:8783–8798.
- Milligan JF, Uhlenbeck OC. Synthesis of small RNAs using T7 RNA polymerase. Methods Enzymol. 1989;180:51–62.
- Liu Y, Holmstrom E, Yu P, et al. Incorporation of isotopic, fluorescent, and heavy-atom-modified nucleotides into RNAs by position-selective labeling of RNA. Nat Protoc. 2018;13:987–1005.
- Liu Y, Holmstrom E, Zhang J, et al. Synthesis and applications of RNAs with position-selective labelling and mosaic composition. Nature. 2015;522:368–372.
- Tang GQ, Roy R, Bandwar RP, et al. Real-time observation of the transition from transcription initiation to elongation of the RNA polymerase. Proc Natl Acad Sci USA. 2009;106:22175–22180.
- Steitz TA. The structural changes of T7 RNA polymerase from transcription initiation to elongation. Curr Opin Struct Biol. 2009;19:683–690.
- Cheetham GM, Steitz TA. Structure of a transcribing T7 RNA polymerase initiation complex. Science. 1999;286:2305–2309.
- Brieba LG, Sousa R. T7 promoter release mediated by DNA scrunching. Embo J. 2001;20:6826–6835.
- Mandal M, Breaker RR. Gene regulation by riboswitches. Nat Rev Mol Cell Biol. 2004;5:451–463.
- McCown PJ, Corbino KA, Stav S, et al. Riboswitch diversity and distribution. RNA. 2017;23:995–1011.
- Zhu B, Hernandez A, Tan M, et al. Synthesis of 2ʹ-Fluoro RNA by Syn5 RNA polymerase. Nucleic Acids Res. 2015;43:e94.