
ABSTRACT
The parasite Trypanosoma brucei cycles between insect and mammalian hosts, and is the causative agent of sleeping sickness. Here, we performed genome-wide mapping of 2ʹ-O-methylations (Nms) on trypanosome rRNA using three high-throughput sequencing methods; RibOxi-seq, RiboMeth-seq and 2ʹ-OMe-seq. This is the first study using three genome-wide mapping approaches on rRNA from the same species showing the discrepancy among the methods. RibOxi-seq detects all the sites, but RiboMeth-seq is the only method to evaluate the level of a single Nm site. The sequencing revealed at least ninety-nine Nms guided by eighty-five snoRNAs among these thirty-eight Nms are trypanosome specific sites. We present the sequence and target of the C/D snoRNAs guiding on rRNA. This is the highest number of Nms detected to date on rRNA of a single cell parasite. Based on RiboMeth-seq, several Nm sites were found to be differentially regulated at the two stages of the parasite life cycle, the insect procyclic form (PCF) versus the bloodstream form (BSF) in the mammalian host.
Introduction
One of the most widespread modifications in the cell is the methylation of the ribose 2ʹ-OH moiety which is found not only on stable RNAs such as tRNAs, rRNAs, and snRNAs, but also on mRNAs [Citation1,Citation2]. It was initially suggested that this modification confers stability to RNA by reducing the reactivity of the oxygen thereby preventing a nucleophilic attack and subsequent cleavage of the adjacent phosphodiester bond [Citation3].
Most of the 2ʹ-O-methylations (Nms) in eukaryotes are guided by a group of small nucleolar RNAs (snoRNAs), known as C/D snoRNAs, and are mediated by the RNA associated methyltransferase, NOP1/Fibrillarin. C/D snoRNAs are named after short sequence motifs, the C box (5ʹ-RUGAUGA-3ʹ) and the D box (5ʹ-CUGA-3ʹ). Many snoRNAs have an additional box (C’ and D’ boxes). Most box C/D snoRNAs have regions of complementarity to 10–22 nt-long sequences in mature rRNA. Recent studies suggest that snoRNAs with even 8 nt complementary to rRNA are able to properly guide the modification [Citation4]. According to the +5 rule, the methylated nt on the rRNA is the complement to the fifth nucleotide upstream of box D or D’. Each C/D snoRNP consists of the snoRNA and a set of four binding proteins, NOP56, NOP58, SNU13 and NOP1/Fibrillarin [Citation5,Citation6]. It was shown that trypanosome snoRNAs are no exception and bind all four proteins [Citation7]. The snoRNA repertoire and the number of Nm sites vary among eukaryotes ranging from 55 Nms in yeast to 112 Nms in humans [Citation8]. A second group of snoRNAs guides pseudouridine (Ψ) on rRNA, and these are known as H/ACA snoRNAs [Citation5]. Most of the Nm and Ψ sites were shown to be located in functional domains of the rRNA such as the peptidyl transferase centre (PTC), helix 69 (H69) and the A-site finger domain of the large subunit, as well as the decoding centre of the small subunit [Citation9].
Trypanosoma brucei (T. brucei) is an infamous parasite that cycles between two hosts. The form propagating in the insect host is known as the procylic form (PCF), whereas the parasite that multiplies in mammals is the bloodstream form (BSF). Cycling between two hosts requires adaptation, especially to growth temperature but also to nutrient levels [Citation10]. Trypanosomes are known for having unique molecular pathways, such as trans-splicing of nuclear pre-mRNA [Citation11] and RNA editing of mitochondrial pre-mRNA [Citation12].
Previous insights into the rich repertoire of trypanosome snoRNAs were obtained mainly through in silico analyses. The first described set of snoRNAs consisted of 91 members which comprised 57 C/D snoRNAs and 34 H/ACA RNAs with the potential to direct 84 Nms and 32 Ψ, respectively [Citation13]. The first RNA-seq of T. brucei small RNAs identified 20 novel snoRNA candidates (14 H/ACA and 6 C/D snoRNAs) [Citation14]. In trypanosomatids, most of the snoRNA genes exist in clusters, as was shown in T. brucei [Citation13] and Leishmania major (L. major) [Citation15,Citation16]. Whereas C/D snoRNA genes occur exclusively in such clusters, which typically harbour interspersed genes of C/D and H/ACA snoRNAs, H/ACA snoRNAs also exist as solitary genes. All snoRNA genes are transcribed by RNA polymerase II, and individual RNAs are then processed from the primary transcript by an as yet unknown mechanism [Citation17]. Pre-snoRNA transcripts are trans-spliced and polyadenylated [Citation18]. We recently demonstrated that polyadenylation of pre-snoRNA transcripts is mediated by two poly (A) polymerases, PAP2 and PAP1 [Citation19].
Mapping of Ψ on T. brucei rRNA in PCF and BSF trypanosomes identified 68 Ψs on rRNA, 21 of which were shown to be hypermodified in BSF as a result of increased levels of the guiding snoRNAs [Citation20]. Overexpression of snoRNAs, which guide Ψ in the H69 domain of rRNA, accelerated the growth of PCF parasites at 30°C. Interestingly, these modifications are predicted to significantly alter the secondary structure of the LSU rRNA, suggesting that hypermodified positions may contribute to the required changes in ribosome function during cycling between the two hosts [Citation20].
Recent Cryo-EM studies were able to visualize the Nm modification in ribosomes of these parasites. 105 Nms were visualized in the trypanosomatid Leishmania donovani (L. donovani) rRNA [Citation21] and 112 Nms were reported for T. cruzi rRNA [Citation22]. Genome-wide mapping of Nm sites was recently performed in yeast and mammals using three different approaches [Citation23–Citation30]. Nm mapping traditionally relied on the property of reverse transcriptase to pause one nt before the modified Nm in the presence of low dNTP concentrations [Citation31]. The high throughput application of this method, 2ʹ-OMe-seq, was recently utilized for Nm mapping [Citation23] and found to be less reliable in Nm quantification compared to other high-throughput methods such as RiboMeth-seq and mass spectrometry-based methods [Citation8,Citation28]. We recently developed a new method, termed RibOxi-seq, that is independent of reverse transcription and is based on the resistance of 3ʹ terminal, methylated ribose moieties to periodate (IO4-) treatment, leaving only fragments containing the 2ʹ-O-methylated residue suitable for ligation to adaptors and sequencing [Citation29]. A third high throughput method used for mapping and quantifying Nm is RiboMeth-seq, which is based on alkaline RNA fragmentation. Nm induces protection at the 3ʹ-adjacent phosphodiester RNA bond from cleavage at alkaline conditions [Citation30]. Under such conditions, RNA fragments starting or ending at the +1-nucleotide relative to the modified residue, were shown to be excluded from libraries prepared from fragmented RNA [Citation24].
In this study, we mapped sites of Nm modification at single base resolution in the two life stages of T. brucei grown in culture using RibOxi-seq, RiboMeth-seq and 2ʹ-OMe-seq. We detected 99 Nms guided by 85 snoRNAs in the two life stages similar to the number found in humans [Citation29].
Materials and methods
Cell growth and transfection
Procyclic T. brucei 427 wild-type strain and the genetically modified 29–13 strains, which carries integrated genes for T7 polymerase and the tetracycline repressor, were grown in SDM-79 medium supplemented with 10% fetal calf serum. Medium for 29–13 cells contained 50 μg/ml hygromycin and 15 μg/ml G418. T. brucei 427 BSF wild-type cells and the 131–514 cell line were aerobically cultivated at 37°C under 5% CO2 in HMI-9 medium supplemented with 10% fetal calf serum. Cell line 131–514 was grown in the presence of 2 μg/ml G418, and 2.4 μg/ml phleomycin, as previously described [Citation7,Citation13,Citation20,Citation32].
Primer extension and Northern analyses
Primer extension was performed as previously described [Citation13]. The extension products were analysed on 12% acrylamide denaturing gels. For northern analysis, total RNA was extracted, separated on either 10% acrylamide denaturing gel or agarose-formaldehyde gel, and analysed using RNA probes. RNA probes were prepared by in-vitro transcription using α-32P-UTP. Oligonucleotides used in this study are listed in Supplementary Table T1.
Preparation of the small RNome
Whole cell extracts were prepared from 109 cells; after extraction with 0.3 M KCl, 10 mM MgCl2, the ribosomes were sedimented by centrifugation for 3 hr at 35,000 rpm in a Beckman 70.1Ti rotor (150,000 x g). RNA extracted from the post-ribosomal supernatant (PRS) was used for library preparation, essentially as described [Citation20]. Briefly, 800ng of PRS RNA was dephosphorylated with FastAP Thermosensitive Alkaline Phosphatase (Thermo Scientific), cleaned by Agencourt RNA clean XP beads (Beckman Coulter) and ligated to 3ʹ linker using high concentration T4 RNA Ligase 1 (NEB) in a buffer containing DMSO, ATP, PEG 8000 and RNase inhibitor (NEB). The ligated RNA was cleaned from excess linker using Dynabeads® MyOne™ SILANE beads (Thermo Scientific), and first strand cDNA was prepared using the AffinityScript Reverse Transcriptase enzyme (Agilent). The RNA was subsequently degraded using 2 μl of 1 M NaOH and the cDNA was cleaned using Dynabeads® MyOne™ SILANE beads (Thermo Scientific). The cDNA was further ligated to 3ʹ adapter using high concentration T4 RNA Ligase 1 (NEB) and cleaned of excess adapter by using Dynabeads® MyOne™ SILANE beads (Thermo Scientific). The adapter ligated cDNA was PCR enriched using NEBNext® High-Fidelity (NEB) polymerase (9 PCR cycles), separated on an E-Gel EX agarose gel (Invitrogen) and size selected in the range of 150–300 bp (containing ~30-180nt corresponding to RNA). The amplicons were gel purified using NucleoSpin Gel and PCR Clean-up kit (Macherey-Nagel) and sequenced in a Nextseq system (Illumina) in paired end mode (20–40 million reads for each sample).
RibOxi-seq
T. brucei PCF and BSF were grown to mid-log phase (8 and 2 × 10⁶ cells/ml, respectively), and total RNA was prepared from 108 cells using the Trizol reagent (Thermo Scientific) according to the manufacturer’s specifications. The RNA was further purified by transferring the aqueous phase of the chloroform extraction to a PureLink RNA mini kit column (Thermo Scientific) and by applying a genomic DNA removal step using the PureLink on-column DNase set. The subsequent steps of the procedure have been published in detail [Citation29]. Briefly, 8 µg of purified RNA was denatured for 3 min at 90°C and fragmented by Benzonase (final RNA concentration: 100ng/µL, enzyme 0.5 units/100 µL reaction) on ice for 90 min. The digestion products for each reaction were divided into a control sample (Ctrl: 1 µg) and an oxidation sample (Ox: 7 µg), and both samples underwent the same treatments except for oxidation and β-elimination steps of the Ox sample. The Ox sample was oxidized with sodium periodate (NaIO4) at a final concentration of 50 mM in oxidation buffer (3.28 mM sodium borate, 37.5 mM boric acid, pH = 8.6) for 45 minutes at room temperature, protected from light. The reaction mixture was precipitated and incubated with elimination buffer (33.75 mM sodium borate, 50 mM boric acid, pH = 9.5) for 90 minutes at 45°C to remove the 3ʹ-terminal nucleotides. To remove 3ʹ phosphates, RNA was purified using NucAway spin columns (ThermoFisher Scientific) and treated with 2 µl of T4 PNK (New England Biolabs [NEB]) for 4 hours in PNK buffer, with the pH adjusted to 6.0. A final round of NaIO4 treatment was carried out to oxidize all ends without Nms.
All subsequent steps were identical for both Ox and Ctrl samples: 50 pmol of NEB miRNA universal linker was ligated to RNA 3ʹ-ends using T4 RNA Ligase 1 (NEB) for overnight at 16°C according to the manufacturer’ instructions, omitting the addition of ATP. Next, 50 pmol of RT primer, containing unique molecular identifiers for bioinformatic PCR duplicate removal, were added and annealed in a thermal cycler at 95°C for 2 minutes, 65°C for 10 minutes, and 4°C for 1 min. After ligation of 100 pmol of 5ʹ-RNA linker with NEB T4 RNA ligase 1, reverse transcription was carried out using NEB Protoscript II, both steps following the manufacturer’s protocols. Subsequently, Ampure XP beads (Beckman Coulter) were used to remove empty adapters (<100 bp), and cDNA libraries were amplified by PCR using Illumina-compatible adapters that contained barcodes for demultiplexing sequence reads. Libraries were sequenced using the Illumina NextSeq500 platform with 150 cycle Mid Output Kits.
RiboMeth-seq
Total RNA from T. brucei PCF and BSF was denatured at 90°C for 2 min in a thermocycler. Then, an equal volume of buffer (NaHCO3/Na2CO3, pH 9.9) was added, and RNA samples were incubated at 90°C for 10, 15 or 20 minutes [Citation30]. The hydrolysed RNA was then used for library preparation. Briefly, 800ng of the RNA was dephosphorylated with FastAP Thermosensitive Alkaline Phosphatase (Thermo Scientific) and cleaned by Agencourt RNA clean XP beads (Beckman Coulter). The RNA was then ligated to 3ʹ linker using high concentration T4 RNA Ligase 1 (NEB) in a buffer containing DMSO, ATP, PEG 8000 and RNase inhibitor (NEB) for 1.5 hr at 22°C. The ligated RNA was purified from excess linker using Dynabeads® MyOne™ SILANE beads (Thermo Scientific), and first strand cDNA was prepared using the AffinityScript Reverse Transcriptase enzyme (Agilent) at 55°C for 45 min. Next, the RNA was degraded using 2 μl of 1 M NaOH, and the cDNA was cleaned using Dynabeads® MyOne™ SILANE beads (Thermo Scientific). The cDNA was further ligated to 3ʹ adapter using a high concentration T4 RNA Ligase 1 (NEB) overnight at 22°C and cleaned of excess adapter by using Dynabeads® MyOne™ SILANE beads (Thermo Scientific). The adapter ligated cDNA was PCR enriched using NEBNext® High-Fidelity (NEB) polymerase (9 PCR cycles), separated on an E-Gel EX agarose gel (Invitrogen) and size selected for the range of 150–300 bp (containing ~30-180nt corresponding to RNA). The amplicons were gel purified using NucleoSpin Gel and PCR Clean-up kit (Macherey-Nagel), and sequenced in a Nextseq system (Illumina) in paired end mode (20–40 million reads for each sample).
2ʹ-OMe-seq
To perform 2ʹ-OMe-seq, an adaptor was ligated to the 3ʹ end of the total RNA (upon fragmentation) and cDNA was prepared using AffinityScript reverse transcriptase (Agilent) under low dNTP (0.004 mM) and high dNTP (1 mM) concentration [Citation23]. The cDNA was then ligated to an adaptor, PCR amplified and cleaned by Ampure SPRI beads (Beckman Coulter); the samples were sequenced in an Illumina NextSeq machine in paired-end mode (20–40 million reads for each sample).
Bioinformatic analysis
RibOxi-seq reads were aligned to the T. brucei rRNA using SMALT v_0.7.5 (http://www.sanger.ac.uk/resources/software/SMALT/) with default parameters. For each sample, the resulting BAM file was sorted using samtools v1.9 and converted to a BED file using bamtobed from the BEDtools v2.26.0 Suite [Citation33]. For each position in the rRNA, we counted the number of reads whose 3ʹ-end alignment terminated at that base. A table containing all samples with the per base counts for each position on the rRNA was imported into DESeq2 [Citation34]. Oxidized samples versus control (non-oxidized) samples were compared for differential expression at each position on the rRNA. Positions with a log2 fold-change of 6 and a corrected p-value of less than 10e−11 were considered as methylated.
For stringent RibOxi-seq analysis, the forward reads were trimmed by cutadapt 1.18 to remove 3ʹ read-through adapters, and un-trimmed reads were discarded. Alignment to T. brucei rRNA was done using STAR 2.7.0a (ver 2.0.6) (https://github.com/alexdobin/STAR/releases)[35]. Aligned BAM files were then converted to BED files using BEDtools v2.26.033 [Citation33]. Aligned 3ʹ-ends were counted to generate count tables that were subsequently fed through DESeq2 [Citation34] for differential analysis. The resulting list was filtered using the following criteria: baseMean>100, log2fc >7, 0<(corrected P-value)<0.0005. A master shell script for read processing and alignment, a python script for end counting, and a R script for DESeq2 analysis were used in this study, and are provided in the Supplementary materials.
To analyse the RiboMeth-seq libraries, the reads were initially trimmed of adapter sequences using Trim Galore version 0.4.4 (https://github.com/FelixKrueger/TrimGalore) with the following parameters:–stringency 4 – length 30 – paired – retain_unpaired. The alignment to the reference rRNA sequence was done by STAR (ver 2.0.6) (https://github.com/alexdobin/STAR/releases)[35], mapped, and properly paired reads were converted to *.bed using BEDtools v2.26.0 Suite [Citation33]. 5′- and 3′-ends counting was done directly on *.bed file using a dedicated Unix script (attached in the Supplement). Analysis was performed by calculation of MAX score for detection of Nm residues, and RMS score (score C) for their quantification. To calculate MAX score, the relative change of end coverage position by position was calculated in 5′→3′ and reverse direction. The relative change was normalized to average values spanning −6 and +6 nucleotides. The normalized relative change for 5′→3′ and reverse direction were averaged, and the maximal value between the average and normalized relative change was retained (score MAX). RMS score was calculated essentially as described previously for score C using the same relative impact of neighbouring nucleotides [Citation30]. The scripts used in this study are provided in the Supplementary materials.
For 2ʹ-OMe-seq analysis, we counted for each position in the rRNA the number of reads whose 5ʹ-end alignment initiated at that location. We also calculated the total coverage of each base using genomecov from the BEDtools v2.26.0 Suite [Citation33]. For each position, we calculated the 2ʹOMe score as described [Citation23], comparing the ratio of the total coverage with the number of reads initiating at that position. Each predicted site was manually inspected for an increase compared to its neighbouring nucleotides.
Results
Mapping the Nms on T. brucei rRNA
The most recent analyses of the T. brucei small RNA repertoire identified 83 C/D snoRNAs which have the potential to guide 87 Nms on rRNA [Citation14,Citation15]. To validate the predicted sites and comprehensively determine Nm deposition on trypanosome rRNA, we applied three high-throughput approaches for Nm site identification and quantification, namely RibOxi-seq, a method which we recently developed and which is based on ribose oxidation [Citation29], RiboMeth-seq, which relies on resistance of Nm sites to alkaline hydrolysis [Citation30] and 2ʹ-OMe-seq, which depends on the enzymatic properties of reverse transcriptase [Citation23]. In RibOxi-seq, the RNA is randomly fragmented by Benzonase, and sodium periodate is used to induce oxidation of ribose moieties of all RNA ends. Since Benzonase cannot cleave RNA immediately downstream of an Nm site, it is necessary to remove the 3ʹ-terminal nucleotides after this first oxidation step by β-elimination to expose Nms at 3ʹ-ends. Further removal of terminal phosphate groups by T4 PNK generates two kinds of phosphate-less RNA 3ʹ-ends: unmethylated and 2ʹ-O-methylated nucleotides. A second sodium periodate treatment then oxidizes unmethylated nucleotides into dialdehydes, preventing 3ʹ ligation of linker molecules to these RNA fragments. Conversely, 2ʹ-O-methylated ribose renders RNA 3ʹ-ends resistant to oxidation and capable of 3ʹ linker ligation. This strategy enriches sequences with 3ʹ-terminal Nm sites, leading to highly Nm-specific, low complexity cDNA libraries that are analysed by next-generation sequencing. Note, as a result of Benzonase treatment, the terminal 2ʹ-O-methylated bases possess 3ʹ-phosphates, and the non-methylated bases have a mixture of cyclic-phosphates, 3ʹ-phosphates and 2ʹ-phosphates and like 2ʹ-O-methylated bases, the 2ʹ-phosphates and cyclic-phosphates are also resistant to oxidation. To avoid ligation of the linkers to these mixtures in the subsequent steps, the RNA was further treated with T4 Polynucleotide Kinase (PNK) that removes all the three types of phosphates and thus avoiding their detection in our sequencing. Thus, despite the fact that 2ʹ,3ʹ-cyclic phosphate are present in rRNA [Citation36] the RibOxi-seq protocol described above eliminated these false-positives and this method therefore is proved to be highly specific, sensitive and accurate in mapping Nm sites of human rRNA [Citation29].
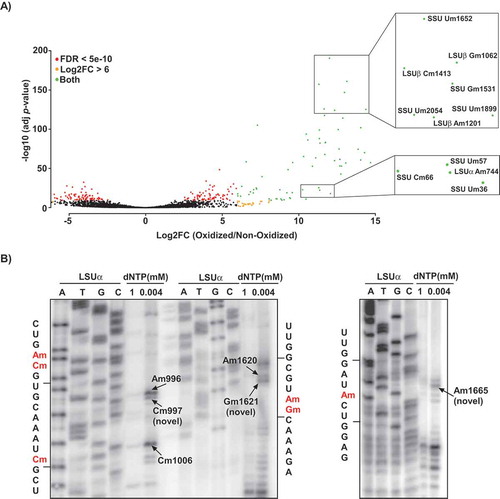
We performed RibOxi-seq on samples from both T. brucei life cycle stages (PCF and BSF), aligned the reads to the genome sequence using the SMALT program, and counted only the 3ʹ-ends of the aligned sequences for the identification of Nm sites. As controls, we analysed RNA fragments that were not subjected to sodium periodate treatment, and calculated the log2 fold change (log2fc) of treated over control samples for each rRNA position. The data are based on three independent biological replicates for each life cycle stage, which were each sequenced twice. By applying a cut-off value of log2fc of >6 and adjusted P-value of <10−11, we identified 96 Nm sites in trypanosome rRNAs () (Supplementary Table T2). Although our analysis accurately detected all predicted Nm sites, the method also yielded numerous inconclusive sites. Some of these sites are the two m62A (A2260 and A2261 in SSU) and m4 C (C2135 in SSU) that were also detected in L. donovani Cryo-EM [Citation21] (Supplementary Table T2). In coherence with our detection, a recent pseudo-MS3 analysis also assigned this m4 C site as an Nm in L. donovani rRNA [Citation37]. Using a stringent bioinformatics analysis (baseMean>100, log2fc >7, 0<(P-value)<0.0005), 83 Nms were detected in either PCF and BSF, 76 Nms were detected in both PCF and BSF, 22 inconclusive sites were detected in either PCF or BSF, and 9 inconclusive sites were detected in both PCF or BSF (Supplementary Table T2). These 22 inconclusive sites are mostly sites located one or two nt from a known Nm site. Interestingly, such sites were not found in human rRNA using the same method [Citation29]. Since we did not identify snoRNAs to guide these 22 adjacent positions, these are likely guided by the snoRNAs guiding the adjacent known Nm site, suggesting that trypanosome snoRNAs are ‘slippery’. As an example, in SSU, a site was detected 2nt from Am125, Gm1676, and Um2154; in LSUα, a site was detected 2nt from Am927, one nt from Gm925. Indeed, primer extension using low dNTP verified the detection of three novel sites, Am997 (adjacent to Am996), Gm1621 (adjacent to Am1620) and Am1665 in LSUα (). Interestingly, similar phenomenon was described in yeast for snR13, snR48 and U18 showing that the same snoRNA can guide adjacent Nms [Citation38]. These snoRNAs have atypical C’/D’ boxes and hence bind differently the protein components of the snoRNAs, and can catalyse additional modifications that do not conform to the classical +5 rule. In trypanosomes, many the snoRNAs also have atypical boxes [Citation13,Citation15,Citation16].
Figure 1. Detection of Nm positions in T. brucei rRNA using RibOxi-seq. A) Volcano plot illustrating the detection of Nm positions in T. brucei rRNA. Total RNA from T. brucei PCF was treated (oxidized) with NaIO4, adapters or left un-treated (non-oxidized) and ligated and sequenced as described in ‘Material and Methods’. The reads were mapped to the rRNA, and the positions having a cut-off value of log2FC >6 and adjusted P-value of <10−11 are presented. The X-axis represents the log2FC (oxidized/non-oxidized) and the Y-axis represents the -log10 (P-value) across each site detected in the rRNA. Positions meeting the criteria of log2FC>6 are indicated as orange dots, those meeting FDR < 5e-10 are indicated by red dots, and positions qualifying both log2FC and FDR are shown in green. The zoomed-in views indicate examples of the detected methylation sites. B) Validation of novel Nm sites detected by RibOxi-seq. Total RNA (10 μg) was subjected to primer extension using an oligonucleotide complementary to an indicated rRNA region at low and high-dNTP concentrations (0.004 and 1 mM, respectively). Extension products were separated on 10% polyacrylamide–7 M urea gels along with a dideoxynucleotide sequence ladder of the rRNA produced using the same primer. Partial RNA sequences are depicted, and the methylated nucleotide is highlighted in red. Locations of the Nms on rRNA are indicated.
The stringent criteria used in the analysis also did not detect thirteen predicted Nm sites [Citation14,Citation15]. Six of these sites are adjacent to known sites (one nt apart). All these sites can be detected with less stringent criteria, suggesting that these sites really exist.
Since the suitability of RibOxi-seq data for quantitative analyses has not been demonstrated and we were interested in assessing the level of Nm modifications in both life stages, we examined Nm modification of rRNA in PCF and BSF by RiboMeth-seq [Citation30]. RNA that was subjected to alkaline hydrolysis was ligated with 3ʹ end linker, and libraries were prepared. Size selected amplicons of 60–140 bp were sequenced. Profiles of fragments obtained around the Nm sites that show a characteristic drop at the Nm residue are presented (Supplementary Fig. S1). The RMS (relative methylation score: score C) was calculated for each Nm site detected by RibOxi-seq, as previously described [Citation30] (Supplementary Table T3). For instance, Um1630 had an RMS value of 0.65 in BSF and 0.04 in PCF, similarly Um1674 had an RMS value of 0.22 in BSF and 0.73 in PCF. The RiboMeth-seq data prepared from RNA extracted from separate replicates of both life stages were almost identical (Pearson’s correlation of 0.99) (Supplementary Fig. S2A). Four replicates of BSF and three replicates of PCF were used for quantification of Nm levels. The results indicate that not all of the Nm sites are equally modified along the rRNA ().
Figure 2. RiboMeth-seq reveals the stoichiometry of methylation at Nm sites in T. brucei rRNA. RMS score for individual Nms on rRNA is plotted as the mean ± SE. Four biological replicates were used to quantify BSF Nms, and three replicates were used to quantify PCF Nms. The RMS score of BSF Nm is presented as blue dots and PCF as red dots. Sites adjacent to other Nms exhibiting low RMS scores are not shown.
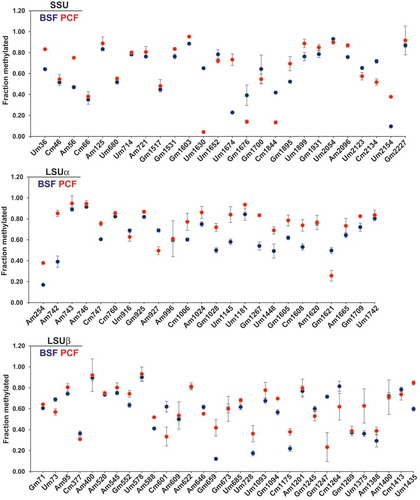
Three Nm sites were hypermodified in BSF: SSU Um1630 (BSF RMS = 0.65, PCF RMS = 0.04), SSU Cm1844 (BSF RMS = 0.42, PCF RMS = 0.13), and LSUβ Gm1247 (BSF RMS = 0.72, PCF RMS = 0.23). Five Nm sites were hypomodified in the BSF: LSUα Am1180 (BSF RMS = 0.01, PCF RMS = 0.77), SSU Um2154 (BSF RMS = 0.10, PCF RMS = 0.38), LSUβ Am544 (BSF RMS = 0.07, PCF RMS = 0.26), LSUβ Gm659 (BSF RMS = 0.12, PCF RMS = 0.42), and SSU Um1674 (BSF RMS = 0.23,PCF RMS = 0.73). The differential RMS along the SSU and LSU rRNA is schematically presented (), indicating that several Nm sites were differentially and reproducibly modified in T. brucei parasites during its life cycle (). However, the magnitude of fold-change in the Nm modifications, apart from the eight sites mentioned above, was marginal. In RiboMeth-seq, Nm sites present adjacent to another Nm were difficult to quantify. For example, SSU Um57 had no RMS value, whereas Am56 had an RMS value of 0.47 (Supplementary Table T3).
Table 1. The complete stoichiometry of Nm sites in T. brucei rRNA. The identity and position of individual Nm sites in T. brucei rRNA. The RMS score of each individual Nm and its fold change are presented for both life stages. Data are shown as mean ± s.e.m. The fold change of 2ʹ-OMe score, identity and expression values of snoRNA guiding individual Nms are also presented.
To validate RiboMeth-seq in our hands, we applied the method to cells in which NOP1 was silenced. The results indicate that, as anticipated, most of the sites were reduced upon silencing. However, several sites were not changed: Cm46, Um680 and Um1630 in SSU; Gm925 and Gm1605 in LSUα; Cm601, Am609, Gm1245, Gm1247, Cm1264, Gm1269, Am1400, and Cm1413 in LSUβ (Supplementary Fig. S3). Several of these sites are guided by snoRNAs with special functions. For instance, Gm925 is guided by snoRNA Tb9Cs2C3 which functions in srRNA1 processing [Citation39]. It is not currently known why these sites were not reduced upon NOP1 silencing. However, studies in mammalian cells showed that the most essential methylation sites on rRNA were less affected in cells depleted of NOP1 [Citation26,Citation27]. However, we cannot rule out the possibility that other methyltransferases guide such modifications and hence are insensitive to NOP1 depletion. For example, in yeast, Gm2922 on LSU rRNA is mediated by the methyltransferase, Sbp1 [Citation40], and trypanosomes possess a homologue to this enzyme, encoded by Tb927.2.4550.
The third method that we used for Nm mapping is 2ʹ-OMe-seq. RNA from both PCF and BSF was subjected to reverse transcriptase under 1 mM or 0.004 mM dNTPs and RNA libraries were prepared upon ligation of 3ʹ linker, as previously described [Citation20,Citation23]. Under limiting dNTP concentrations, the reverse transcriptase stops one nucleotide downstream of the methylated site. We performed the same experiment using RNA prepared from cells carrying the silencing construct of NOP1. We then examined the results by defining the fraction of reads terminating at a given position in the low dNTP sample as measured by 2ʹOMe score (, Supplementary Table T3, Supplementary Fig. S4) [Citation23]. Although this method was reported to be less quantitative, we inspected the relative stops on the different sites and compared them to the methylation fraction by RMS in RiboMeth-seq. Indeed, both methods indicated that the level of modification varies along the rRNA molecules. However, a Pearson’s correlation of only ~0.45 was obtained between the two methods (Supplementary Fig. S2B).
RiboMeth-seq data, which is considered to be the most quantitative method, was used to mark the Nm positions that were elevated (>10%) in the BSF parasite on the secondary structure of the rRNA (–).
Overall, we were able to identify at least 99 Nm sites using all three methods. Of these, 97 sites were detected by RibOxi-seq and 2ʹ-OMe-seq, and an additional two sites were supported by RiboMeth-seq (Supplementary Fig. S5). The results of the three-mapping methods indicating the level of modification, the identity of guiding snoRNA(s) and the expression level of the snoRNAs are presented ( and Supplementary Table T3). The study also identified 22 novel Nm sites (, Supplementary Table T2-3). Based on RNA-seq of small RNA libraries, we further identified snoRNA candidates that guide these newly identified modifications (Supplementary Fig. S6). Note that two of these snoRNAs interact imperfectly with their target (one mismatch). Similar predictions were recently suggested for several mammalian snoRNAs [Citation41]. Moreover, 10 predicted Nm sites could not be confirmed experimentally, suggesting that, despite that these snoRNAs can perfectly base-pair with the rRNA target, these snoRNAs do not guide modifications in cultured exponentially growing trypanosomes. Indeed, this phenomenon was reported previously in other systems [Citation42–Citation44].
The combination of our mapping approaches accurately identified each modification site, and corrected several positions of previously predicted sites, which were based on the complementary D or D’ sites in snoRNAs. This inconsistency arises from atypical D or D’ boxes. The accurate mapping data presented in this study corrects these mistakes, which are offset by one nucleotide either downstream or upstream of the published predictions. The updated and corrected Nm sites in T. brucei rRNA are listed in and depicted in an updated map of the rRNA secondary structure (–). The sequences of snoRNAs guiding these Nm sites are presented in .
Table 2. The complete sequence of C/D snoRNA guiding T. brucei rRNA Nm sites. The predicted C/C’ and D/D’ boxes are highlighted in bold. The corresponding L. major homologs of T. brucei snoRNA are indicated[Citation15]. The domain of complementarity to the rRNA target is underlined.
In total, we mapped at least 31 Nms in SSU rRNA, 34 Nms in LSUα and 38 Nms in LSUβ. In comparison, Nm site distribution among trypanosomatid rRNAs is surprisingly variable. Up to 23 of the T. brucei sites seem to be specific to this species, and were not found in either T. cruzi [Citation22] or Leishmania [Citation21]. Similarly, 38 sites that were methylated in both T. brucei and T. cruzi, were not identified in Leishmania, and 52 Nm sites shared between T. brucei and L. donovani.
Each of our mapping methods has its shortcomings: RibOxi-seq and RiboMeth-seq cannot detect Nms close to the 5ʹ end of an RNA, and 2ʹ-OMe-seq is prone to effects originating from RNA secondary structure. Receiver Operating Characteristic (ROC) curves and Matthews Correlation Coefficient (MCC) plotted for RiboMeth-seq RMS score (supplementary Fig. S2B) suggest that this method detects large number of false positives in T. brucei rRNA (81 false positives) (Sensitivity = 0.99, Specificity = 0.24, AUC ~0.79, MCC = 0.365). However, the substantial overlap of identified sites among the three mapping approaches strongly indicates that, with the potential exception of adjacent modified sites, we have comprehensively determined the extent of Nm sites in T. brucei. Accordingly, the complete repertoire described here is supported by bioinformatics predictions.
Comparing Nms in the two life stages shows differential levels of modification
The results ( and ) indicate the presence of at least 18 Nms that are increased in the BSF life stage and 36 Nms that are decreased in BSF, though only 8 of these were significantly altered (by >3-fold change) (Supplementary Table T5). To determine whether the abundance of the guiding snoRNAs for these differentially regulated sites were also elevated in the BSF, we performed northern analysis on two snoRNAs. The blots revealed the overexpression of snoRNAs in BSF compared to PCF (). The elevation of the snoRNA levels was also examined using small RNA-library sequencing (, Supplementary Table T3), and was noted in previously published transcriptomes of PCF and BSF [Citation45] (). The overexpression of snoRNA seems to be a specific rather than a general phenomenon, since not all the C/D snoRNAs were overexpressed in BSF (Supplementary Table T3). snoRNA levels were examined experimentally (), and indeed, a similar degree of enhancement was found in our experiments and in the RNA-seq data. The increase of snoRNA abundances was not restricted to a specific snoRNA within a cluster, but rather, the regulation of expression encompassed entire clusters (), which is expected since most of the C/D snoRNAs are encoded in clusters and are processed from polycistronic transcripts that undergo trans-splicing and polyadenylation [Citation18].
Figure 3. snoRNA expression analysis. (A) Total RNA (10 μg) from PCF or BSF was separated on a 12% denaturing polyacrylamide gel and detected by northern blotting with complementary probes to the specified snoRNAs. Data are presented as mean ± S.E.M. Experiments were done in triplicate (n = 3). TB9Cs2C7 was used as loading control. (B) Coverage of selected snoRNA coding regions in T. brucei small RNome. The read distribution profile of the selected snoRNA coding sequence based on the PCF (blue) and BSF (red) small RNA libraries described in this study. (C) Coverage of selected snoRNA precursors. The read distribution profile of the snoRNA precursor sequence based on the PCF (blue) and BSF (red) libraries, as described in [Citation45]. D) Correlation between Nm level and snoRNA expression. (I) Pairwise comparison of RMS score fold-change and snoRNA expression fold-change (log2) in both life stages from at least three independent libraries. Spearman’s correlation coefficient (R) and p-value are indicated. (ii) Pairwise comparison of RMS score fold change and snoRNA expression fold-change (log2) using a cut-off of baseMean >6000, in both life stages.
![Figure 3. snoRNA expression analysis. (A) Total RNA (10 μg) from PCF or BSF was separated on a 12% denaturing polyacrylamide gel and detected by northern blotting with complementary probes to the specified snoRNAs. Data are presented as mean ± S.E.M. Experiments were done in triplicate (n = 3). TB9Cs2C7 was used as loading control. (B) Coverage of selected snoRNA coding regions in T. brucei small RNome. The read distribution profile of the selected snoRNA coding sequence based on the PCF (blue) and BSF (red) small RNA libraries described in this study. (C) Coverage of selected snoRNA precursors. The read distribution profile of the snoRNA precursor sequence based on the PCF (blue) and BSF (red) libraries, as described in [Citation45]. D) Correlation between Nm level and snoRNA expression. (I) Pairwise comparison of RMS score fold-change and snoRNA expression fold-change (log2) in both life stages from at least three independent libraries. Spearman’s correlation coefficient (R) and p-value are indicated. (ii) Pairwise comparison of RMS score fold change and snoRNA expression fold-change (log2) using a cut-off of baseMean >6000, in both life stages.](/cms/asset/bdc1f770-fa3b-46f2-bdbd-3a4a2ef26998/krnb_a_1750842_f0003_c.jpg)
Interestingly, not all Nm sites that were guided by elevated snoRNAs were elevated in BSF parasites (), suggesting that a higher snoRNA level alone is not sufficient to increase the cognate modification (see Discussion). A low correlation (r = 0.34, p = 0.0013) was observed between the fold change of RMS value and log2FC of snoRNA levels in the two life stages (Fig 3Di). A better correlation (r = 0.554, p = 0.0041) was observed when a subset of abundant snoRNAs having baseMean score >6000 (calculated by DESeq2 [Citation34]) (Supplementary Table T3) was used (Fig 3Dii).
To evaluate the functional significance of the positions that were found to be differentially modified in BSF parasites, their positions were depicted on the secondary structure (–) of the rRNA, and on the tertiary model (). The hypermodified (FC>3 in BSF) and hypomodified Nm (FC>3 in PCF) sites are boxed and illustrated in the 3D structure. The data clearly indicate that these differentially modified positions are not randomly distributed, but are clustered mostly around the functional domains such as the A, P sites and PTC. Most of the variable Nm sites in BSF and PCF parasites are adjacent to each other, except for a small number of distinct sites such as Cm1777 or Cm1844 (in T. brucei) located next to the expansion segment ES9 S (Supplementary Fig. 4–6). Um1576 or Um1630 (in T. brucei) guided by Tb10Cs2”C3 is the most hypermodified Nm site in BSF parasites, and is trypanosome-specific. Interestingly, among the variable sites elevated in BSF, LSU Um916 and Am927 are guided by the same snoRNA (TB11Cs4C2).
Figure 4. Localization of the Nms and ψs in the secondary structure of T. brucei SSU rRNA. Boxes highlighted in blue show the Nm sites whose level is increased in BSF (>10% compared to PCF) and those in yellow are the hypermodified pseudouridines (ψ) [Citation20]. T. brucei specific Nm (not detected in T. cruzi or L. donovani Cryo-EM studies) are indicated by an asterisk (*).
![Figure 4. Localization of the Nms and ψs in the secondary structure of T. brucei SSU rRNA. Boxes highlighted in blue show the Nm sites whose level is increased in BSF (>10% compared to PCF) and those in yellow are the hypermodified pseudouridines (ψ) [Citation20]. T. brucei specific Nm (not detected in T. cruzi or L. donovani Cryo-EM studies) are indicated by an asterisk (*).](/cms/asset/13b12478-2fd7-43f6-acd1-dc5e78352ade/krnb_a_1750842_f0004_c.jpg)
Figure 5. Localization of Nms and ψs in the secondary structure of T. brucei LSUα rRNA. Boxes highlighted in blue show the Nm sites whose level is increased in BSF (>10% compared to PCF) and those in yellow show the hypermodified pseudouridines (ψ) [Citation20]. T. brucei specific Nm (not detected in T. cruzi or L. donovani Cryo-EM studies) are indicated by an asterisk (*).
![Figure 5. Localization of Nms and ψs in the secondary structure of T. brucei LSUα rRNA. Boxes highlighted in blue show the Nm sites whose level is increased in BSF (>10% compared to PCF) and those in yellow show the hypermodified pseudouridines (ψ) [Citation20]. T. brucei specific Nm (not detected in T. cruzi or L. donovani Cryo-EM studies) are indicated by an asterisk (*).](/cms/asset/f6888671-6d76-48b5-8038-c61862cfde18/krnb_a_1750842_f0005_c.jpg)
Figure 6. Localization of Nms and ψs on the secondary structure of T. brucei LSUβ rRNA. Boxes highlighted in blue show the Nm sites whose level is increased in BSF (>10% compared to PCF) and those in yellow show the hypermodified pseudouridines (ψ) [Citation20]. T. brucei specific Nm (not detected in T. cruzi or L. donovani Cryo-EM studies) are indicated by an asterisk (*).
![Figure 6. Localization of Nms and ψs on the secondary structure of T. brucei LSUβ rRNA. Boxes highlighted in blue show the Nm sites whose level is increased in BSF (>10% compared to PCF) and those in yellow show the hypermodified pseudouridines (ψ) [Citation20]. T. brucei specific Nm (not detected in T. cruzi or L. donovani Cryo-EM studies) are indicated by an asterisk (*).](/cms/asset/5328f0f3-6b96-4865-ae4d-762f729396bc/krnb_a_1750842_f0006_c.jpg)
Figure 7. Variable Nm modifications in T. brucei are located around functional domains of the ribosome. Nm sites whose levels are reproducibly regulated (>10%) in T. brucei BSF are indicated. Nm sites whose level is increased in BSF (compared to PCF) are coloured in red and those whose level is decreased in BSF are coloured in blue, respectively. Hypermodified and hypomodified sites (FC>3) are indicated by a green box. A- P- and E- site tRNAs are represented as a gold surface. The peptidyl transferase centre (PTC) and protein exit tunnel (marked with a purple dotted line) are indicated. The 3D representation is based on the published L. donovani cryo-EM coordinates deposited as 6AZ3 and 6AZ1 for the large and small subunits, respectively [Citation21]. L.donovani Nm sites corresponding to T. brucei SSU and LSU rRNA are shown.
![Figure 7. Variable Nm modifications in T. brucei are located around functional domains of the ribosome. Nm sites whose levels are reproducibly regulated (>10%) in T. brucei BSF are indicated. Nm sites whose level is increased in BSF (compared to PCF) are coloured in red and those whose level is decreased in BSF are coloured in blue, respectively. Hypermodified and hypomodified sites (FC>3) are indicated by a green box. A- P- and E- site tRNAs are represented as a gold surface. The peptidyl transferase centre (PTC) and protein exit tunnel (marked with a purple dotted line) are indicated. The 3D representation is based on the published L. donovani cryo-EM coordinates deposited as 6AZ3 and 6AZ1 for the large and small subunits, respectively [Citation21]. L.donovani Nm sites corresponding to T. brucei SSU and LSU rRNA are shown.](/cms/asset/95273a76-2121-4263-82fd-4bea6a651e8f/krnb_a_1750842_f0007_c.jpg)
Why three methods were necessary to determine the Nm landscape of T. brucei rRNA
The two critical issues regarding Nm mapping is the location of the modification and its level. The RibOxi-seq tuned out to faithfully detect 97 out of the 99Nms that most likely exist. However, in order to find the additional missing 2 Nms another detection method was necessary and these two missing Nms were verified by RiboMeth-seq and 2ʹ-OMe-seq. Note that RiboMeth-seq is the only method used in this study to quantitate the level of the Nm, failed to detect all the Nm site ab- initio using the stringent defined criteria [Citation24,Citation25,Citation30]. Indeed, only 35 bona-fide sites were detected and 81 false-positives were observed using RiboMeth-seq. This result could reflect the relatively low level of modification on individual sites compared to what is reported for yeast and humans [Citation24,Citation25,Citation27,Citation30]. We therefore manually inspected all the sites detected by RibOxi-seq for their fragmentation profile in RiboMeth-seq data and we obtained evidence for their resistance to alkaline hydrolysis that was observed for all the Nm sites. The quality of 2ʹ-OMe-seq did not afford detection of all the Nms ab- initio and many false-positives also detected (AUC = 0.5). Note, that in this study we used this method only to verify the bone-fide sites detected by the other two methods. The failure to detect all the sites by this method may also stem from the low level of the modification on the individual sites that might be compensated in trypanosomes by having many adjacent sites that is interferes with the detection. Based on the experience of this study, RibOxi-seq detects most of the sites and should be the basis for de novo mapping. However, the two other methods and especially RiboMeth-seq is necessary for verification and quantitation. Our mapping and assignment of the Nms is not only based on the three methods but are also supported by the presence of the cognate C/D snoRNAs to guide the specific modification that we assigned for each of the Nm. In many cases, we also obtained support from the Cryo-EM data [Citation21,Citation22]
Discussion and conclusion
In this study, we mapped the Nms on rRNA of both life stages of T. brucei. The study identified at least 99 Nm sites with high confidence. Using RiboMeth-seq, we identified several Nm sites in T. brucei rRNA that are located near functional domains of the ribosome, and are differentially modified between the BSF and PCF stages.
Recent studies demonstrated that Nm levels are not homogeneous across rRNA in other systems. Variation in some Nm modifications was found in exponentially growing cultured cells and developing tissues of the mouse Citation[23–Citation27,Citation46]. This implies the presence of sub-populations of ribosomes that might assume specific functions. It was also demonstrated in yeast that certain Nms in rRNA are only partially methylated [Citation24,Citation30,Citation47].
It is well accepted that in humans, no direct correlation exists between the level of the modification and the abundance of the guiding snoRNAs, although there is a tendency for sites targeted by multiple snoRNAs to have higher levels of modification [Citation25]. These generalizations seem to be partially true in trypanosomes. Only ~0.55 correlation (Spearman’s correlation) was found for abundant snoRNAs and the Nm modifications that they guide. We have previously described a machine learning algorithm (SVM) that was able to predict the abundance of snoRNAs at an 85% rate of success [Citation48].
In this study we compared our data with the data derived by Cryo-EM of both T. cruzi and Leishmania ribosomes [Citation21,Citation22]. Not all sites observed by Cryo-EM were observed by our mapping and the vice-versa. Indeed, also in the human system, several new Nms were revealed in the Cryo-EM of human ribosomes that were not detected by RiboMeth-seq and the vice-versa. It was argued that these sites might not be accessible in the rRNA, or perhaps their methylation rate was too low to be detected by the mapping method [Citation23,Citation25,Citation26,Citation49].
Our study revealed 22 novel Nm sites in T. brucei. Among these newly identified sites, 8 were detected near previously predicted sites. Importantly, these sites were also seen in the Cryo-EM studies. Although many of the trypanosome modifications are located in positions which are already rich in modifications and are near functional domains. We also observed 23 unique positions that were not mapped by Cryo-EM studies [Citation21,Citation22]. Indeed, 14 of these unique sites were also predicted to exist in L. major rRNA. However, five of these sites are conserved across different domains of life but were not mapped in the Cryo-EM of T.cruzi or L. donovani.
Our analysis also revealed 2 Nms (LSUa-Cm747 and LSUb-Am544) that are specific for T. brucei, yeast and E. gracilis, and 3 Nms (LSUa-Am743, LSUa-Am1180, SSU-Am2153 and SSU-Um2154) that exist only in T. brucei. Of note, RibOxi-seq revealed 14 additional sites that are located adjacent to known Nm sites, suggesting the presence of ~113 Nms in T.brucei, similar to the number suggested by cryo-EM of L. donovani and T. cruzi [Citation21,Citation22] and that of Crithidia fasciculata [Citation50]. These neighbouring sites are likely to be guided by the same snoRNA, suggesting that more flexible rules for guiding Nms exist in these organisms, as in yeast [Citation38].
The most striking observation from the RiboMeth-seq analysis in is that most RMS scores are low, suggesting that not all rRNA molecules are modified in these positions. Such a low score could result from an experimental flaw related to the construction of RiboMeth-seq libraries as the over amplification of cDNA may diminish the differential signal between the modified and neighbouring positions, as previously observed [Citation27]. However, our protocol uses a low number of amplification cycles in the library preparation (9 cycles compared to 12 cycles) [Citation27]. We suggest that the low level of modification is due to the large number of sites available for Nm modification and insufficient core proteins to assemble a large number of each snoRNP, thereby limiting the modification at each position. Alternatively, the proximity of the Nm sites results in competition between snoRNAs for access to the relevant domain for guiding the modification. At the present time, we cannot determine whether a single rRNA can carry adjacent modifications, and this awaits the development of mapping technology at single molecule resolution. It will be interesting to examine if depletion of snoRNAs especially guiding hypermodified positions in BSF, can affect the ability of the parasites to transform from one stage to another and to establish infection.
In sum, this study highlights the need for more than one mapping approach to confidently determine the landscape of Nm modification. The methodology presented here suggests to first use RibOxi-seq for detection of the Nms that needs to be verified by additional mapping approaches together with data on snoRNAs guiding these modifications. Data analysis is also assisted by using RNA from cells depleted for the methyltransferase, NOP1. The need to have multiple approaches for mapping in trypanosomes may stem from the rich repertoire of Nms that also resulted in low level of modification on most of the individual sites.
Data Accessibility
The RNA sequencing data related to this study have been deposited in the NCBI database under the accession number GSE102516 (https://www.ncbi.nlm.nih.gov/bioproject/?term=GSE102516) and PRJNA526606 (https://www.ncbi.nlm.nih.gov/bioproject/PRJNA526606) (https://trace.ncbi.nlm.nih.gov/Traces/sra/?study=SRP188173). The bioinformatics scripts used in this study is provided in the ‘Supplementary Files’.
Supplemental Material
Download (9.9 KB)Supplemental Material
Download Zip (6.1 MB)Acknowledgments
This work was supported by a grant from the Israel-US Binational Science Foundation (BSF), by the I-core programme of the Planning and budgeting committee and the Israel Science Foundation grant 1796/12, NIH grants R01 AI028798 and AI110325 to C.T., R21 AI142149 to A.G. and R21 MH110955 to G.C. S.M. holds the David and Inez Myers Chair in RNA silencing of diseases.
Disclosure statement
The authors declare no competing financial interests.
Supplementary material
Supplemental data for this article can be accessed here.
Additional information
Funding
References
- Ayadi L, Galvanin A, Pichot F, et al. RNA ribose methylation (2ʹ-O-methylation): occurrence, biosynthesis and biological functions. Biochim Biophys Acta Gene Regul Mech [Internet]. 2018. Available from: http://www.ncbi.nlm.nih.gov/pubmed/30572123
- Motorin Y, Helm M. RNA nucleotide methylation. Wiley Interdiscip Rev RNA [Internet]. 2011;2(5):611–631. Available from: http://www.ncbi.nlm.nih.gov/pubmed/21823225
- Motorin Y, Helm M. tRNA stabilization by modified nucleotides. Biochemistry [Internet]. 2010;49:4934–4944. Available from: http://www.ncbi.nlm.nih.gov/pubmed/20459084
- Yang Z, Lin J, Ye K. Box C/D guide RNAs recognize a maximum of 10 nt of substrates. Proc Natl Acad Sci USA [Internet]. 2016;113:10878–10883. Available from: http://www.ncbi.nlm.nih.gov/pubmed/27625427
- Tollervey D, Kiss T. Function and synthesis of small nucleolar RNAs. Curr Opin Cell Biol [Internet]. 1997;9:337–342. Available from: http://www.ncbi.nlm.nih.gov/pubmed/9159079
- Henras AK, Plisson-Chastang C, Humbert O, et al. Synthesis, function, and heterogeneity of snoRNA-guided posttranscriptional nucleoside modifications in eukaryotic ribosomal RNAs. Enzym [Internet]. 2017;41:169–213. Available from: http://www.ncbi.nlm.nih.gov/pubmed/28601222
- Barth S, Shalem B, Hury A, et al. Elucidating the role of C/D snoRNA in rRNA processing and modification in Trypanosoma brucei. Eukaryot Cell [Internet]. 2008;7:86–101. Available from: http://www.ncbi.nlm.nih.gov/pubmed/17981991
- Krogh N, Nielsen H. Sequencing-based methods for detection and quantitation of ribose methylations in RNA. Methods [Internet]. 2019;156:5–15. Available from: http://www.ncbi.nlm.nih.gov/pubmed/30503826
- Sloan KE, Warda AS, Sharma S, et al. Tuning the ribosome: the influence of rRNA modification on eukaryotic ribosome biogenesis and function. RNA Biol [Internet]. 2017;14:1138–1152. Available from: http://www.ncbi.nlm.nih.gov/pubmed/27911188
- Sharma R, Gluenz E, Peacock L, et al. The heart of darkness: growth and form of Trypanosoma brucei in the tsetse fly. Trends Parasitol [Internet]. 2009;25:517–524. Available from: http://www.ncbi.nlm.nih.gov/pubmed/19747880
- Michaeli S. Trans-splicing in trypanosomes: machinery and its impact on the parasite transcriptome. Future Microbiol [Internet]. 2011;6:459–474. Available from: http://www.ncbi.nlm.nih.gov/pubmed/27142987
- Read LK, Lukeš J, Hashimi H. Trypanosome RNA editing: the complexity of getting U in and taking U out. Wiley Interdiscip Rev RNA [Internet]. 2016;7:33–51. Available from: http://doi.wiley.com/10.1002/wrna.1313
- Liang X-H, Uliel S, Hury A, et al. A genome-wide analysis of C/D and H/ACA-like small nucleolar RNAs in Trypanosoma brucei reveals a trypanosome-specific pattern of rRNA modification. RNA [Internet]. 2005;11:619–645. Available from: http://www.ncbi.nlm.nih.gov/pubmed/15840815
- Michaeli S, Doniger T, Gupta SK, et al. RNA-seq analysis of small RNPs in Trypanosoma brucei reveals a rich repertoire of non-coding RNAs. Nucleic Acids Res [Internet]. 2012;40(3):1282–1298. Available from: http://www.ncbi.nlm.nih.gov/pubmed/21976736
- Eliaz D, Doniger T, Tkacz ID, et al. Genome-wide analysis of small nucleolar RNAs of Leishmania major reveals a rich repertoire of RNAs involved in modification and processing of rRNA. RNA Biol [Internet]. 2015;12:1222–1255. Available from: http://www.ncbi.nlm.nih.gov/pubmed/25970223
- Liang X, Hury A, Hoze E, et al. Genome-wide analysis of C/D and H/ACA-like small nucleolar RNAs in Leishmania major indicates conservation among trypanosomatids in the repertoire and in their rRNA targets. Eukaryot Cell [Internet]. 2007;6:361–377. Available from: http://www.ncbi.nlm.nih.gov/pubmed/17189491
- Liang X, Ochaion A, Xu Y, et al. Small nucleolar RNA clusters in trypanosomatid Leptomonas collosoma. Genome organization, expression studies, and the potential role of sequences present upstream from the first repeated cluster. J Biol Chem [Internet]. 2004;279:5100–5109. Available from: http://www.ncbi.nlm.nih.gov/pubmed/14645367
- Kolev NG, Franklin JB, Carmi S, et al. The transcriptome of the human pathogen Trypanosoma brucei at single-nucleotide resolution. PLoS Pathog [Internet]. 2010;6:e1001090. Available from: http://www.ncbi.nlm.nih.gov/pubmed/20838601
- Chikne V, Gupta SK, Doniger T, et al. The canonical poly (A) polymerase PAP1 polyadenylates non-coding RNAs and is essential for snoRNA biogenesis in Trypanosoma brucei. J Mol Biol [Internet]. 2017;429:3301–3318. Available from: http://www.ncbi.nlm.nih.gov/pubmed/28456523
- Chikne V, Doniger T, Rajan KS, et al. A pseudouridylation switch in rRNA is implicated in ribosome function during the life cycle of Trypanosoma brucei. Sci Rep [Internet]. 2016;6:25296. Available from: http://www.ncbi.nlm.nih.gov/pubmed/27142987
- Shalev-Benami M, Zhang Y, Rozenberg H, et al. Atomic resolution snapshot of Leishmania ribosome inhibition by the aminoglycoside paromomycin. Nat Commun [Internet]. 2017;8:1589. Available from: http://www.ncbi.nlm.nih.gov/pubmed/29150609
- Liu Z, Gutierrez-Vargas C, Wei J, et al. Structure and assembly model for the Trypanosoma cruzi 60S ribosomal subunit. Proc Natl Acad Sci USA [Internet]. 2016;113:12174–12179. Available from: http://www.ncbi.nlm.nih.gov/pubmed/27791004
- Incarnato D, Anselmi F, Morandi E, et al. High-throughput single-base resolution mapping of RNA 2΄-O-methylated residues. Nucleic Acids Res [Internet]. 2017;45:1433–1441. Available from: http://www.ncbi.nlm.nih.gov/pubmed/28180324
- Marchand V, Blanloeil-Oillo F, Helm M, et al. Illumina-based RiboMethSeq approach for mapping of 2ʹ-O-Me residues in RNA. Nucleic Acids Res [Internet]. 2016;44:e135. Available from: http://www.ncbi.nlm.nih.gov/pubmed/27302133
- Krogh N, Jansson MD, Häfner SJ, et al. Profiling of 2ʹ-O-Me in human rRNA reveals a subset of fractionally modified positions and provides evidence for ribosome heterogeneity. Nucleic Acids Res [Internet]. 2016;44:7884–7895. Available from: http://www.ncbi.nlm.nih.gov/pubmed/27257078
- Erales J, Marchand V, Panthu B, et al. Evidence for rRNA 2ʹ-O-methylation plasticity: control of intrinsic translational capabilities of human ribosomes. Proc Natl Acad Sci USA [Internet]. 2017;114:12934–12939. Available from: http://www.ncbi.nlm.nih.gov/pubmed/29158377
- Sharma S, Marchand V, Motorin Y, et al. Identification of sites of 2ʹ-O-methylation vulnerability in human ribosomal RNAs by systematic mapping. Sci Rep [Internet]. 2017;7:11490. Available from: http://www.ncbi.nlm.nih.gov/pubmed/28904332
- Motorin Y, Marchand V. Detection and analysis of RNA ribose 2ʹ-O-methylations: challenges and solutions. Genes (Basel) [Internet]. 2018;9. Available from: http://www.ncbi.nlm.nih.gov/pubmed/30567409
- Zhu Y, Pirnie SP, Carmichael GG. High-throughput and site-specific identification of 2ʹ-O-methylation sites using ribose oxidation sequencing (RibOxi-seq). RNA [Internet]. 2017;23:1303–1314. Available from: http://www.ncbi.nlm.nih.gov/pubmed/28495677
- Birkedal U, Christensen-Dalsgaard M, Krogh N, et al. Profiling of ribose methylations in RNA by high-throughput sequencing. Angew Chem Int Ed Engl [Internet]. 2015;54:451–455. Available from: http://www.ncbi.nlm.nih.gov/pubmed/25417815
- Maden BE. Mapping 2ʹ-O-methyl groups in ribosomal RNA. Methods [Internet]. 2001;25:374–382. Available from: http://www.ncbi.nlm.nih.gov/pubmed/11860292
- Gupta SK, Hury A, Ziporen Y, et al. Small nucleolar RNA interference in Trypanosoma brucei: mechanism and utilization for elucidating the function of snoRNAs. Nucleic Acids Res [Internet]. 2010;38:7236–7247. Available from: http://www.ncbi.nlm.nih.gov/pubmed/20601683
- Quinlan AR, Hall IM. BEDTools: a flexible suite of utilities for comparing genomic features. Bioinformatics [Internet]. 2010;26:841–842. Available from: http://www.ncbi.nlm.nih.gov/pubmed/20110278
- Love MI, Huber W, Anders S. Moderated estimation of fold change and dispersion for RNA-seq data with DESeq2. Genome Biol [Internet]. 2014;15:550. Available from: http://www.ncbi.nlm.nih.gov/pubmed/25516281
- Dobin A, Davis CA, Schlesinger F, et al. STAR: ultrafast universal RNA-seq aligner. Bioinformatics [Internet]. 2013;29:15–21. Available from: http://www.ncbi.nlm.nih.gov/pubmed/23104886
- Shigematsu M, Morichika K, Kawamura T, et al. Genome-wide identification of short 2ʹ,3ʹ-cyclic phosphate-containing RNAs and their regulation in aging. PLoS Genet [Internet]. 2019;15:e1008469. Available from: http://www.ncbi.nlm.nih.gov/pubmed/31721758
- Nakayama H, Yamauchi Y, Nobe Y, et al. Method for direct mass-spectrometry-based identification of monomethylated RNA nucleoside positional isomers and its application to the analysis of leishmania rRNA. Anal Chem [Internet]. 2019;91:15634–15643. Available from: http://www.ncbi.nlm.nih.gov/pubmed/31725277
- van Nues RW, Watkins NJ. Unusual C΄/D΄ motifs enable box C/D snoRNPs to modify multiple sites in the same rRNA target region. Nucleic Acids Res [Internet]. 2017;45:2016–2028. Available from: http://www.ncbi.nlm.nih.gov/pubmed/28204564
- Chikne V, Shanmugha Rajan K, Shalev-Benami M, et al. Small nucleolar RNAs controlling rRNA processing in Trypanosoma brucei. Nucleic Acids Res [Internet]. 2019;47:2609–2629. Available from: http://www.ncbi.nlm.nih.gov/pubmed/30605535
- Lapeyre B, Purushothaman SK. Spb1p-directed formation of Gm2922 in the ribosome catalytic center occurs at a late processing stage. Mol Cell [Internet]. 2004;16:663–669. Available from: http://www.ncbi.nlm.nih.gov/pubmed/15546625
- Taoka M, Nobe Y, Yamaki Y, et al. Landscape of the complete RNA chemical modifications in the human 80S ribosome. Nucleic Acids Res [Internet]. 2018;46:9289–9298. Available from: http://www.ncbi.nlm.nih.gov/pubmed/30202881
- Tollervey D, Lehtonen H, Carmo-Fonseca M, et al. The small nucleolar RNP protein NOP1 (fibrillarin) is required for pre-rRNA processing in yeast. Embo J [Internet]. 1991;10:573–583. Available from: http://www.ncbi.nlm.nih.gov/pubmed/1825809
- Lafontaine DLJ. Noncoding RNAs in eukaryotic ribosome biogenesis and function. Nat Struct Mol Biol [Internet]. 2015;22:11–19. Available from: http://www.ncbi.nlm.nih.gov/pubmed/25565028
- Cavaillé J, Bachellerie JP. SnoRNA-guided ribose methylation of rRNA: structural features of the guide RNA duplex influencing the extent of the reaction. Nucleic Acids Res. 1998;26:1576–1587.
- Vasquez -J-J, Hon -C-C, Vanselow JT, et al. Comparative ribosome profiling reveals extensive translational complexity in different Trypanosoma brucei life cycle stages. Nucleic Acids Res [Internet]. 2014;42:3623–3637. Available from: http://www.ncbi.nlm.nih.gov/pubmed/24442674
- Hebras J, Krogh N, Marty V, et al. Developmental changes of rRNA ribose methylations in the mouse. RNA Biol [Internet]. 2020;17:150–164. Available from: http://www.ncbi.nlm.nih.gov/pubmed/31566069
- Buchhaupt M, Sharma S, Kellner S, et al. Partial methylation at Am100 in 18S rRNA of Baker’s yeast reveals ribosome heterogeneity on the level of eukaryotic rRNA modification. PLoS One [Internet]. 2014;9:e89640. Available from: https://dx.plos.org/10.1371/journal.pone.0089640
- Myslyuk I, Doniger T, Horesh Y, et al. Psiscan: a computational approach to identify H/ACA-like and AGA-like non-coding RNA in trypanosomatid genomes. BMC Bioinformatics [Internet]. 2008;9:471. Available from: http://www.ncbi.nlm.nih.gov/pubmed/18986541
- Natchiar SK, Myasnikov AG, Hazemann I, et al. Visualizing the role of 2ʹ-OH rRNA methylations in the human ribosome structure. Biomolecules [Internet]. 2018;8 . Available from: http://www.ncbi.nlm.nih.gov/pubmed/30366442
- Gray MW. The ribosomal RNA of the trypanosomatid protozoan Crithidia fasciculata: physical characteristics and methylated sequences. Can J Biochem [Internet]. 1979;57:914–926. Available from: http://www.ncbi.nlm.nih.gov/pubmed/476525