
ABSTRACT
The p53 protein is one of the transcription factors responsible for cell cycle regulation and prevention of cancer development. Its expression is regulated at the transcriptional, translational and post-translational levels. Recent years of research have shown that the 5ʹ terminus of p53 mRNA plays an important role in this regulation. This region seems to be a docking platform for proteins involved in p53 expression, particularly under stress conditions. Here, we applied RNA-centric affinity chromatography to search for proteins that bind to the 5ʹ terminus of p53 mRNA and thus may be able to regulate the p53 expression profile. We found heterogeneous nuclear ribonucleoprotein K, hnRNP K, to be one of the top candidates. Binding of hnRNP K to the 5ʹ-terminal region of p53 mRNA was confirmed in vitro. We demonstrated that changes in the hnRNP K level in the cell strongly affected the p53 expression profile under various stress conditions. Downregulation or overexpression of hnRNP K caused a decrease or an increase in the p53 mRNA amount, respectively, pointing to the transcriptional mode of expression regulation. However, when hnRNP K was overexpressed under endoplasmic reticulum stress and the p53 amount has elevated no changes in the p53 mRNA level were detected suggesting translational regulation of p53 expression. Our findings have shown that hnRNP K is not only a mutual partner of p53 in the transcriptional activation of target genes under stress conditions but it also acts as a regulator of p53 expression at the transcriptional and potentially translational levels.
Introduction
The p53 protein is one of the key players in maintaining cell homoeostasis [Citation1]. As a transcriptional factor, p53 activates downstream target genes in response to various stress agents which eventually leads to cell arrest or apoptosis [Citation2]. It has been shown that more than 50% of human tumours are connected with mutations in the TP53 gene which result in p53 dysfunction and disruption of the p53-network interactions. Recent years of extensive research have shown that the p53 expression pattern is controlled at many levels. Two major variants of p53 transcript, synthesized from P0 and P1 promoter regions, have been observed [Citation3]. Moreover, post-transcriptional processing of p53 mRNA and the presence of alternative translation initiation codons lead to at least 12 isoforms of p53 protein [Citation4]. It seems that each of the p53 isoforms plays distinct functions. Moreover, they are able to interact with the full-length p53 to affect its role in the activation of downstream genes [Citation5,Citation6].
Recently, we have shown that the 5ʹ-terminal regions of p53 mRNA variants influence the p53 expression pattern at the translational level [Citation7,Citation8]. It appears that structural features of these non-coding regions are pivotal in the modulation of the p53 translation efficiency [Citation9,Citation10]. The 5ʹ-terminal region of p53 transcript is also a docking platform for protein factors which are able to adjust p53 expression to changes in the cell environment. However, only few proteins interacting with this region of p53 mRNA have been found so far to act as p53 regulators at the translational level [Citation11,Citation12]. Most of those proteins have earlier been identified as factors influencing translation of other mRNAs. Among them are polypyrimidine tract binding protein 1 (PTB1) and heterogeneous nuclear ribonucleoprotein C1/C2 (hnRNP C1/C2), which elevate the p53 level under stress conditions however, they bind to different parts of the 5ʹ terminus of p53 mRNA [Citation13–Citation15]. On the other hand, nucleolin impairs p53 translation [Citation16]. It has also been demonstrated that Hdm2 protein, which is a major regulator of p53 expression via the ubiquitination system, is able to bind the hairpin motif of the 5ʹ terminus of p53 mRNA to enhance p53 translation [Citation17]. Thus, protein factors seem to be crucial partners for the translational machinery to modulate p53 expression.
Here, we applied RNA-centric affinity chromatography combined with a mass spectrometry analysis to search for proteins that bind to the 5ʹ-terminal region of p53 mRNA and thus have the potential to regulate the p53 expression profile. We used two RNA oligomers, P1-Δ40p53 and P0-Δ40p53 RNAs, which correspond to two variants of this region of p53 mRNA, being a consequence of the existing P1 and P0 transcription promoters of TP53 gene. It has been observed that p53 transcripts start from P1 promoter mostly in carcinoma cells while P0-initiated transcripts prevail in healthy cells [Citation3]. Recently, we have shown that the secondary structure of the P0-P1 region in p53 mRNA is responsible for the differences in the p53 translation efficiency [Citation7,Citation8]. Thus, the P0-P1 region seems to play an important role in the control of p53 expression at both transcriptional and translational levels.
The most abundant group of proteins identified in our analysis comprises heterogeneous nuclear ribonucleoproteins (hnRNPs), RNA helicases, transcriptional and splicing factors. One of the top MS score proteins was heterogeneous nuclear ribonucleoprotein K (hnRNP K). We confirmed the binding of purified hnRNP K to the 5ʹ-terminal region of p53 mRNA in vitro. The protein has been shown to exhibit high-affinity and sequence-specific interaction with poly(C) tract of DNA and RNA [Citation18]. In addition to its ability to bind nucleic acid due to the presence of three conserved KH domains (nucleic acid-binding domains), hnRNP K also interacts with itself and many other proteins which results in its involvement in diverse cellular processes [Citation19]. It has been shown that hnRNP K is linked to chromatin remodelling, transcriptional control, translation, RNA processing and stabilization [Citation18]. It has been proposed that hnRNP K plays a role of the p53 cofactor in gene activation in response to DNA damage [Citation20]. In line with these findings, our goal was to verify whether hnRNP K might act as a regulator of the p53 expression pattern.
Our studies revealed that downregulation or overexpression of hnRNP K leads to changes in the p53 protein level, under normal and stress conditions. It turned out that these changes mostly resulted from a decrease or increase in the p53 mRNA amount upon alterations of the hnRNP K level in the presence of specific stress agents. However, only the p53 protein level was elevated with no changes in the p53 mRNA level when hnRNP K was overexpressed in the cell under endoplasmic reticulum stress. These results provide, to our knowledge, first evidence that hnRNP K can act as a transcriptional and potentially translational cofactor regulating the p53 expression profile.
Results
RNA-centric affinity chromatography combined with mass spectrometry analysis reveals proteins which are able to bind to P0-Δ40p53 and P1-Δ40p53 RNAs
In order to search for proteins that bind to the 5ʹ terminus of p53 mRNA, we applied cell extracts and RNA-centric affinity chromatography combined with mass spectrometry analysis [Citation21,Citation22]. As RNA baits we used two oligomers, P0-Δ40p53 and P1-Δ40p53 RNAs (see the Materials and Methods section: In vitro transcription), which correspond to variants of the 5ʹ-terminal region of p53 mRNA transcribed from the P0 and P1 transcription initiation sites [Citation3]. Since it has been shown that stress agents influence the interactions of the 5ʹ-terminal region of p53 mRNA with protein factors we also used cells treated with doxorubicin to generate genotoxic stress [Citation13,Citation23]. Cytoplasmic fractions were prepared from untreated cells and cells treated with doxorubicin for 24 h and RNA-affinity chromatography was conducted for three cell lines: MCF-7, HepG2 and HT-29. All the applied cell lines are derived from carcinoma cells; however, they differ in the p53 status [Citation9]. MCF-7 and HepG2 cells express the wild-type TP53 gene whereas in HT-29 cells the TP53gene is mutated in codon 273 which results in the arginine to histidine substitution and in p53 overproduction [Citation24].
Following RNA-affinity chromatography, the proteins were identified by MS/MS analysis [Citation22]. To identify and eliminate proteins that were bound non-specifically we used samples eluted from agarose beads which were not covered by RNA baits as controls (Figure S1). All the identified proteins were divided into five groups for each cell line and the applied conditions ( and S2). Approximately 20–25% of the proteins from each cell line were linked to the translation machinery. In this group, we classified ribosomal proteins, translation initiation and elongation factors, tRNA ligases and aminoacyl-tRNA synthetases. The next group, approximately 1–3%, was represented by proteins which have already been experimentally proven to interact with the 5ʹ-terminal region of p53 mRNA (Table S1). One of those proteins is nucleolin, a negative regulator of p53 translation [Citation16] which in our analyses is characterized by the highest number of peptides among all the identified proteins. We also observed the polypyrimidine tract binding protein 1 (PTB1) which has been proposed to modulate translation efficiency of p53 under various conditions [Citation13,Citation15]. Additionally, PTB2 and PTB3 were also found; however, they were represented by a lower number of peptides. We also identified heterogeneous nuclear ribonucleoprotein C1/C2 (hnRNP C1/C2) [Citation14] but the protein was represented by only one or two peptides, depending on the cell type. Interestingly, in our analysis, the p53 protein was detected in HT-29 cells exclusively which might be explained by overexpression of p53 protein in this cell line (Table S1). Indeed, earlier work has shown that p53 is able to bind to the 5ʹ terminus of its own mRNA [Citation25].
Figure 1. Distribution of proteins that bind to the P1-initiated 5ʹ-terminal region of p53 mRNA identified for untreated and doxorubicin-treated MCF-7, HepG2 and HT-29 cells.
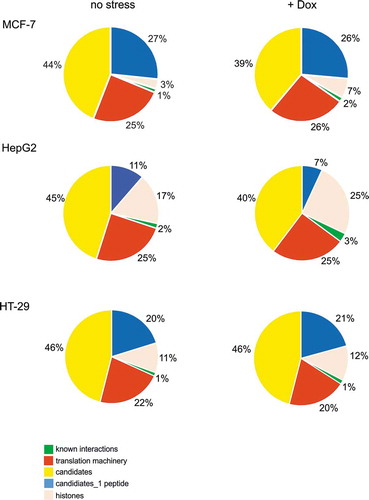
The most abundant group, around 35–48% of the total identified proteins, was considered as the candidate group. In this group, we included proteins with a high potential for binding to nucleic acids, RNA or both RNA and DNA, such as heterogeneous nuclear ribonucleoproteins (hnRNPs), ATP-dependent RNA helicases, splicing and transcriptional factors. The 20 top list of candidate proteins with the highest scores is given in Table S2. In general, we observed a similar set of proteins both in different cell types and in variants of the 5ʹ terminus of p53 mRNA for the applied conditions. Since our MS analyses allowed only semi-quantitate comparison we cannot exclude a scenario that upon stress conditions the level of some proteins is changed. Among the 20 top candidates, there are proteins which have been shown to modulate translation via interactions with different mRNAs, such as hnRNP A [Citation26], Lupus La protein [Citation27] and poly(C)-binding protein (PCBP) [Citation28]. Interestingly, heterogeneous nuclear ribonucleoprotein K (hnRNP K) was one of the highest score candidates, in three cell types for both variants of the 5ʹ-terminal region of p53 mRNA (Table S2). It has been demonstrated that hnRNP K is able to regulate gene expression not only at the transcriptional and posttranscriptional level but at the translational level as well [Citation29,Citation30].
Additionally, we extracted as a separate group the proteins which were identified based on only one distinct sequence peptide since hnRNP C1/C2, which has been shown to interact with the 5ʹ terminus of p53 mRNA [Citation14], was represented by one/two peptides in our analyses ( and S2). This group is more heterogeneous than the candidates’ group in terms of proteins’ functionalities. Although most of these proteins are related to the translation machinery, such as ribosomal proteins or translation factors, we also found splicing factors and proteins linked to metabolic processes and cellular transport. Finally, we noticed that histones are abundantly represented among the identified proteins, presumably due to their high affinity to nucleic acids. However, their distribution varied between different cell lines which might reflect different demands for histones in terms of a different rate of cell division ( and S2).
We were curious to know whether protein binding sites for at least some of the identified top candidate proteins could exist within the 5ʹ terminus of p53 mRNA. Based on literature information [Citation29,Citation31] and data collected in the ATtRACT database (A datTabase of RNA binding proteins and AssoCiated motifs, https://attract.cnic.es/index) we created a P1-Δ40p53–protein interaction map (). We found the potential protein binding sites fora few heterogeneous nuclear ribonucleoproteins, including hnRNP K, hnRNP A1, hnRNP A3, hnRNP C and hnRNP Q. It has been shown that hnRNP Q modulates translation of mouse p53 mRNA via interaction with its 5ʹ UTR [Citation32]. The region recognized by hnRNP Q in mouse mRNA was located in the apical loop of a small hairpin which is rich in adenosine residues [Citation32,Citation33]. The corresponding region within human 5ʹ terminus of p53 mRNA is involved in the formation of a double-stranded structure, and additionally, the nucleotide composition of this region is slightly different [Citation7,Citation33]. However, it may be suggested that despite the differences in the region recognized by hnRNP Q in the mouse and human 5ʹ terminus of p53 mRNA, this protein plays a similar role in both organisms.
Figure 2. The predicted binding sites for the highest score candidate proteins displayed on the secondary structure model of the 5ʹ-terminal region of p53 mRNA. The 20 top candidate proteins list for MCF-7 cells for normal conditions was chosen as a representative list (Table S2). Binding sites were defined based on the ATtRACT database and literature information [Citation29,Citation31]. Binding sites for selected proteins are underlined and numbered as follows: 1 – hnRNP K (CACGC, UCCCAU, UCCCAA), additionally marked in red in the figure; 2 – hnRNP C (AUUUU); 3 – La (GNRA, ex. GAAA, GGGA), (UUUU, UGCUG, AUUU); 4 – ILF2 (GGGAG, GGGGA); 5 – PCBP1, PCBP2 (GCCCC, UCCCC, UUCCC, CCCCC, AGCCC, GUCCC, CCCCU, CCCUCCC, CCUCCCA); 6 – hnRNP A1 (CUGAG, CAGGGA, GAGGAG, UCGGGC); 7 – hnRNP Q (poly (U), poly (A), (UUUU, UUU, AAAA)); 8 – PABPC1 (GAAAAC); 9 – hnRNP A3 (GCCAAGGAGCC), (GCCA – AGGAGCC); 10 – DHX9 (GCGC). The mRNA region which spans the transcription initiation sites P0 and P1 is shown in the inset. The P1-Δ40p53 RNA oligomer shown in the figure and P0-Δ40p53 RNA with an additional nucleotide stretch P0-P1 (depicted in the inset) were used as baits in RNA-affinity chromatography experiments.
![Figure 2. The predicted binding sites for the highest score candidate proteins displayed on the secondary structure model of the 5ʹ-terminal region of p53 mRNA. The 20 top candidate proteins list for MCF-7 cells for normal conditions was chosen as a representative list (Table S2). Binding sites were defined based on the ATtRACT database and literature information [Citation29,Citation31]. Binding sites for selected proteins are underlined and numbered as follows: 1 – hnRNP K (CACGC, UCCCAU, UCCCAA), additionally marked in red in the figure; 2 – hnRNP C (AUUUU); 3 – La (GNRA, ex. GAAA, GGGA), (UUUU, UGCUG, AUUU); 4 – ILF2 (GGGAG, GGGGA); 5 – PCBP1, PCBP2 (GCCCC, UCCCC, UUCCC, CCCCC, AGCCC, GUCCC, CCCCU, CCCUCCC, CCUCCCA); 6 – hnRNP A1 (CUGAG, CAGGGA, GAGGAG, UCGGGC); 7 – hnRNP Q (poly (U), poly (A), (UUUU, UUU, AAAA)); 8 – PABPC1 (GAAAAC); 9 – hnRNP A3 (GCCAAGGAGCC), (GCCA – AGGAGCC); 10 – DHX9 (GCGC). The mRNA region which spans the transcription initiation sites P0 and P1 is shown in the inset. The P1-Δ40p53 RNA oligomer shown in the figure and P0-Δ40p53 RNA with an additional nucleotide stretch P0-P1 (depicted in the inset) were used as baits in RNA-affinity chromatography experiments.](/cms/asset/2aa07fda-0e35-4be5-8f63-be7242fab441/krnb_a_1771944_f0002_oc.jpg)
Potential binding sites for Lupus La protein, PCBP1, PCBP2, interleukin enhancer-binding factor 2 (ILF2), polyadenylate-binding protein 1 (PABPC1) and ATP-dependent RNA helicase A (DHX9) were also present within 5ʹ terminus of p53 mRNA (). For some proteins mentioned above, more than one binding site were observed. This was the case for hnRNP K, PCBP1 and PCBP2, which are members of the poly (rC) binding protein family and are able to recognize similar sequence motifs [Citation18]. Two binding sites were also predicted in the case of hnRNP A1 and hnRNP Q. The presence of region spanning P0 and P1 transcription initiation sites within P0-Δ40p53 RNA increased the number of the binding sites for the poly(C) binding protein family, Lupus La protein, hnRNP Q and DHX5 (, the inset).
Taken together, the RNA-centric affinity chromatography approach combined with MS analysis revealed several proteins which were able to bind to the 5ʹ-terminal region of p53 mRNA and thus potentially might regulate the p53 expression profile. Subsequently, we attempted to determine whether one of the highest score-identified proteins, hnRNP K, is able to influence the p53 expression profile. Firstly, it was important to confirm that hnRNP K binds directly to the 5ʹ-terminal region of p53 mRNA. Therefore, the hnRNP K protein was overexpressed in E. coli and then purified using Ni-affinity chromatography. Subsequently, the electrophoresis mobility shift assay (EMSA) was performed [Citation14]. Radiolabeled P1-Δ40p53 and P0-Δ40p53 RNAs were incubated with purified hnRNP K under three different conditions and the samples were electrophoresed on a non-denaturing polyacrylamide gel (). We observed shifted bands, which confirmed the formation of RNA–protein complexes, and additionally, with a higher concentration of hnRNP K, the bands migrated at a slower rate. Since the shifted bands were smeared it is likely that more than one protein molecule binds to the RNA targets. This is in line with our observation of more than one potential hnRNP K binding site present within P1-Δ40p53 and P0-Δ40p53 RNAs ().
Figure 3. hnRNP K forms a complex with (A) P1-Δ40p53 RNA and (B) P0-Δ40p53 RNA in vitro. The EMSA assays were performed by incubation of [32P]-labelled RNA constructs with increasing concentrations of purified hnRNP K: 1400 nM and 2400 nM under three different conditions: at 4°C for 25 min; at 25°C for 15 min and at 37°C for 10 min. The samples were separated on a native 4% polyacrylamide gel. The first lane in each EMSA panel represents the RNA oligomer incubated without protein. Unbound RNAs and RNP complexes are indicated.
![Figure 3. hnRNP K forms a complex with (A) P1-Δ40p53 RNA and (B) P0-Δ40p53 RNA in vitro. The EMSA assays were performed by incubation of [32P]-labelled RNA constructs with increasing concentrations of purified hnRNP K: 1400 nM and 2400 nM under three different conditions: at 4°C for 25 min; at 25°C for 15 min and at 37°C for 10 min. The samples were separated on a native 4% polyacrylamide gel. The first lane in each EMSA panel represents the RNA oligomer incubated without protein. Unbound RNAs and RNP complexes are indicated.](/cms/asset/eb98b583-f6c6-406a-a7de-a8c2303446d9/krnb_a_1771944_f0003_b.gif)
Changes in hnRNP K expression are positively correlated with alterations of the p53 protein level under normal and stress conditions
The RNA-centric affinity chromatography with the use of cytoplasmic cell extracts showed that hnRNP K was one of the top protein candidates which were able to bind to both variants of the 5ʹ terminus of p53 mRNA, P1-Δ40p53 and P0-Δ40p53 RNAs (Table S2). It has earlier been demonstrated that hnRNP K interacts with 5ʹ ends of several mRNAs to regulate gene expression [Citation28–Citation30]. Since p53 expression is controlled at many levels and recent data have shown particular importance of regulation via interactions of the 5ʹ-terminal region of p53 mRNA with protein factors we wanted to elucidate whether hnRNP Kcan act as a p53 regulator.
In order to test the involvement of hnRNP K in the regulation of p53 expression we first downregulated hnRNP K applying the RNA interference approach. The cells were transfected with specific or control siRNAs and then treated with doxorubicin for 24 h to induce genotoxic stress. Forty-eight hours after siRNA transfection a decrease of approximately 50–70% in hnRNP K protein amount was observed in all three cell lines: MCF-7, HepG2 and HT-29 (). Downregulation of hnRNP K caused reduction of p53 expression at the protein level in the tested cell lines, particularly under doxorubicin treatment. A decrease in p53 protein level by approximately 70% was observed in MCF-7 cells upon doxorubicin treatment. In the case of HT-29 and HepG2 cells, the inhibitory effect of hnRNP K depletion on the p53 protein level was less pronounced. We noticed a decline in the p53 protein amount by approximately 40% as compared to the initial value in the presence of doxorubicin ().
Since we observed that hnRNP K depletion caused a decrease in the p53 amount in the presence of doxorubicin, we attempted to find out whether a similar effect would be observed under other stress conditions. We applied tunicamycin and thapsigargin to generate endoplasmic reticulum (ER) stress and actinomycin D to trigger nucleolar stress. We observed a significant reduction of the p53 level in MCF-7 cells upon ER stress ( and ), which is in line with the previously reported observations [Citation34]. Particularly, the addition of thapsigargin resulted in the reduction of p53 expression up to approximately 75%. On the other hand, actinomycin D caused an almost twofold increase in the p53 protein amount compared to the initial value ().
Figure 4. The decrease in the p53 expression level results from the downregulation of hnRNP K in MCF-7 cells under various stress conditions. (A) The cells were treated with specific hnRNP K (HK) or control (C) siRNAs at the final concentration of 25 nM. Twenty-four hours after transfection the cells were exposed for 24 h to doxorubicin (Dox, 0.5 µg/mL), tunicamycin (TU, 1.2 μM), thapsigargin (TA, 0.1 μM) and actinomycin D (Act D, 5 nM), respectively, and then harvested. The levels of p53, hnRNP K and GAPDH were determined by western blots. (B) The bar chart shows the p53 expression level upon normal (-) and stress conditions in the presence of normal level of hnRNP K. (C) The bar charts show the p53 expression level in the cells exposed to various stress agents upon hnRNP K depletion. The p53 expression in the cells treated with control siRNA in each of applied stress conditions was defined as 100%. All values are averages of at least three independent experiments. P-values were calculated using Student’s t-test.
The hnRNP K downregulation () resulted in reduction of the p53 expression levels compared to the initial values ( and ). A decrease in p53 amount, by approximately 30%, was detected under both genotoxic and nucleolar stress in the hnRNP K depleted cells (, panels: Dox, Act D). Interestingly, a very strong inhibitory effect was observed upon ER stress (, panels: TA, TU and ). In the case of thapsigargin, an approximately 50% decrease in p53 amount was observed while the presence of tunicamycin resulted in a decline of the p53 amount to 40% of the initial value (, panels: TA, TU). We also observed that under no stress conditions hnRNP K downregulation affected p53 expression to some extent and approximately 30% reduction of p53 amount was observed ().
Figure 5. Overexpression of hnRNP K leads to an increase in the p53 protein level in the presence of different stress agents. (A) The cells were transfected with plasmid encoding hnRNP K-Flag (HK-F) or control plasmid encoding GFP (C). Twenty-four hours after transfection the cells were exposed to doxorubicin (0.5 µg/mL) for 24 h. The levels of p53, endogenous hnRNP K, hnRNP K-Flag and GAPDH were determined by western blots. The experiment was repeated twice. (B) Following plasmid transfection (plasmids: C or HK-F) HepG2 cells were treated with tunicamycin (TU, 1.2 μM) or thapsigargin (TA, 0.1 μM) for 24 h, then the cells were harvested. The bar chart displays the p53 expression level upon normal and ER stress conditions in the presence of normal level of hnRNP K in HepG2 cells. (C) The bar charts show the p53 expression level in the cells exposed to ER stress in hnRNP K overexpressed-cells. The p53 expression in the cells treated with control vector in each of the applied conditions was defined as 100%. All values are averages of at least three independent experiments. P-values were calculated using Student’s t-test. (D) Following plasmid transfection (plasmids: C or HK-Flag) HepG2 cells were treated with tunicamycin (TU, 1.2 μM) or thapsigargin (TA, 0.1 μM) for 24 h. Expression of TP53 gene at the RNA level under each of the tested conditions was quantified as described in the Materials and Methods section. P-values were calculated using Student’s t-test.
To further investigate the involvement of hnRNP K in the regulation of p53 expression we overexpressed hnRNP K in HepG2 and MCF-7 cells under normal and genotoxic stress conditions. The cells were transfected with HK-Flag plasmid to overexpress hnRNP K or transfected with control plasmid encoding GFP (Figure S6). Subsequently, doxorubicin was added 24 h after transfection. We noticed that in the presence of doxorubicin overexpression of hnRNP K was accompanied by higher levels of p53 in HepG2 and MCF-7 cell lines (). Since downregulation of hnRNP K particularly affected the p53 expression level upon ER stress ( and ) we wondered whether such a strong influence would be observed in the case of hnRNP K overexpression upon these stress conditions. Both thapsigargin and tunicamycin caused a decrease in the p53 protein amount in HepG2 cells very similar to that observed in MCF-7 cells ( and ). However, overexpression of hnRNP K resulted in augmentation of the p53 protein amounts in the presence of both ER stress agents by approximately 50–60% compared to the values which reflected the p53 expression with the normal level of hnRNP K in HepG2 cells ( and ). A similar effect of hnRNP K on p53 protein level upon ER stress was observed in MCF-7 cells (Figure S7).
Figure 6. The p53 expression profile is regulated by hnRNP K at the transcriptional level in MCF-7 cells. (A) The cells were treated with specific hnRNP K (HK) or control (C) siRNAs at the final concentration of 25 nM (left panel) or were transfected with plasmid encoding hnRNP K-Flag (HK-F) or with control plasmid encoding GFP (C) (right panel). Twenty-four hours after transfection the cells were exposed to doxorubicin (0.5 µg/mL) for 24 h. (B) Following transfection with hnRNP K or control siRNAs at the final concentration of 25 nM the cells were exposed to ER stress agents as described in the legend to Figure 4. (C) Following plasmid transfection (plasmids: C or HK-F) the cells were treated with tunicamycin (TU, 1.2 μM) or thapsigargin (TA, 0.1 μM) for 24 h. Expression of TP53 gene at the RNA level under each of the tested conditions was quantified as described in the Materials and Methods section. P-values were calculated using Student’s t-test.
The data revealed that the p53 protein level was strongly correlated with the hnRNP K expression pattern. Downregulation or overexpression of hnRNP K caused a decrease or increase in p53 expression at the protein level, respectively. The hnRNP K regulatory effect seemed to be particularly striking under stress conditions.
hnRNP K influences p53 mRNA level differently depending on stress conditions in the cell
Since we observed that changes in the expression of hnRNP K resulted in a decrease or increase in the p53 protein level, we first addressed the question whether hnRNP K influences the p53 transcription process. Since hnRNP K recognizes poly(C) track in RNA and DNA we could not exclude that binding of hnRNP K to the 5ʹ terminus of p53 mRNA might reflect its interactions with the corresponding nucleotide sequence in p53 DNA. In fact, it has been shown that hnRNP K acts as a transcriptional cofactor regulating the expression of several genes [Citation30,Citation35].
Firstly, we tested whether changes in hnRNP K expression might affect the p53 mRNA level in the presence of doxorubicin. Twenty-four hours after hnRNP K depletion or overexpression in MCF-7 cells the cells were treated with doxorubicin, and subsequently, the p53 mRNA level was assayed by quantitative PCR. The qPCR analyses revealed that both downregulation and overexpression of hnRNP K influenced the p53 mRNA level in MCF-7 cells (). An approximately twofold lower level of p53 mRNA in hnRNP K depleted cells was observed compared to the initial value (, left panel). In the case of hnRNP K overexpression, the p53 mRNA level increased approx. twofold (, right panel). The results nicely correlated with the earlier observed changes in the p53 protein level in hnRNP K depleted- and overexpressed-cells upon genotoxic stress conditions ( and ). This implies that hnRNP K might act at the transcriptional level regulating the p53 expression pattern under genotoxic stress.
Next, we analysed the level of p53 mRNA in MCF-7 cells with downregulated hnRNP K upon ER stress. Upon downregulation of hnRNP K, a decrease in the p53 mRNA level occurred under both tunicamycin and thapsigargin treatment (). This correlated to the reduction of p53 amount under these conditions ( and ). In the absence of a stress factor, we also observed a decline in p53 mRNA abundance ().
Finally, we analysed the p53 mRNA level upon ER stress in the presence of overexpressed hnRNP K in HepG2 and MCF-7 cell lines ( and ). Unexpectedly, no statistically significant changes in the p53 mRNA level occurred in HepG2 cells (). Thus, overexpression of hnRNP K caused augmentation of the p53 protein amount ( and ) but it did not affect the p53 mRNA level (). Similarly, to the results obtained for HepG2 cells, there were no statistically significant changes in the p53 mRNA level upon thapsigargin treatment in the presence of overexpressed hnRNP K in MCF-7 cells (, panel TA). However, upon addition of tunicamycin, the p53 mRNA level was 2.5-fold higher compared to the control (, panel TU). This is in line with an earlier observation concerning p53 stimulation at the mRNA level by the NF-kB transcriptional factor upon prolonged tunicamycin treatment in MCF-7 cells [Citation36].
Our data show that downregulation of hnRNP K has an impact on the p53 mRNA level under both no stress and stress conditions in MCF-7 cells (, left panel and ). It indicates that hnRNP K is involved in p53 regulation as a constitutive transcriptional cofactor. The analysis of the sequence of the TP53 promoter region revealed that the putative hnRNP K binding sites are present in proximity to the P0 and P1 transcription initiation sites (Figure S8). Interestingly, this region is recognized by other cofactors which specifically regulate the p53 transcription process. It is worthy of note that the sequence recognized by hnRNP K is also located in the coding region between two AUG translation initiation codons. This suggests that hnRNP K binds downstream the transcription start site to influence the initiation of the p53 mRNA synthesis [Citation37]. On the other hand, the hnRNP K recognition sequence motifs are also present in P1-Δ40p53 and P0-Δ40p53 RNAs. This might explain why the protein was identified by our RNA-affinity chromatography approach. Moreover, overexpressed hnRNP K in cells subjected to ER stress resulted in an increase in the p53 protein amount with no effect on the p53 mRNA level. This observation and binding of purified hnRNP K to P1-Δ40p53 RNA and P0-Δ40p53 RNA in vitro strongly support the involvement of hnRNP K in the regulation of p53 translation.
Discussion
P53 transcription is modulated by hnRNP K
In the present study, we focused on the identification of proteins that bind to the 5ʹ-terminal region of p53 mRNA. Potentially, they may affect the p53 expression pattern. In order to find proteins with such functionalities, RNA-centric affinity chromatography combined with mass spectrometry analysis was applied [Citation21]. In addition to the previously characterized proteins which have been shown to interact with the 5ʹ terminus of p53 mRNA, for example, nucleolin, PTB or p53 (Table S1), our analysis revealed that heterogeneous nuclear ribonucleoprotein K (hnRNP K) binds to this mRNA region ( and Table S2). The ability of purified hnRNP K to interact with RNA oligomers that correspond to the variants of the 5ʹ-terminal region of p53 mRNA was confirmed in vitro ().
The MS data showed that hnRNP K was able to bind similarly to two variants of the 5ʹ-terminal region of p53 mRNA, P1-Δ40p53 and P0-Δ40p53 RNAs, for the applied cell extracts from MCF-7, HepG2 and HT-29 cells which were untreated or subjected to doxorubicin treatment (Table S2). Subsequently, we showed that downregulation of hnRNP K caused a decrease in the p53 protein level under no stress as well as under genotoxic, nucleolar and endoplasmic reticulum (ER) stress conditions (). Parallelly, an increase in p53 expression was detected at the protein level in the presence of overexpressed hnRNP K (). It turned out that in hnRNP K depleted cell alterations of the p53 protein amount were correlated with changes in the p53 mRNA level in MCF-7 cells (). These results clearly demonstrated that hnRNP K could influence the p53 expression profile while acting at the transcriptional level.
The TP53 promoter comprises at least three sequence motifs recognized by hnRNP K and all of them are localized in proximity to P0 and P1 transcription initiation sites (Figure S8). It has earlier been shown that hnRNP K is transiently recruited to multiple sites within egr‐1 and c‐myc genes, including transcribed regions, to influence their transcription process, particularly under stress conditions [Citation37]. Similar recruitment of hnRNP K might occur in the case of TP53 gene since one recognition motif for hnRNP K is also located between two translation initiation codons (). It has been previously demonstrated that hnRNP K is involved in the transcription process of several genes [Citation30,Citation38]. Interestingly, hnRNP K is able to activate transcription of c-myc or c-src genes via interactions with TFIID TATA box-binding protein, TBP, and the transcriptional factor Sp1, respectively [Citation38,Citation39]. On the other hand, hnRNP K can also act as a transcriptional inhibitor through the CT motif present in the promoter region as it has been found for the thymidine kinase gene [Citation30]. It seems that hnRNP K activates transcription of TP53 gene since we observed a reduction of the p53 mRNA level in hnRNP K depleted cells (, left panel and ). We also revealed a correlation between downregulation of hnRNP K and a lower level of p53 mRNA upon no stress conditions (). However, under doxorubicin treatment, a higher level of hnRNP K is accompanied by a higher level of p53 mRNA in MCF-7 cells (, right panel). This is in line with earlier studies which have shown that under genotoxic stress p53 expression is activated not only at the translational and posttranslational level but at the transcriptional level as well [Citation40]. Thus, we hypothesize that hnRNP K is a constitutive transcriptional cofactor which is needed to maintain a proper level of p53 mRNA depending on the cell environment. The foregoing does not contradict our observation that overexpression of hnRNP K did not affect p53 mRNA level under no stress conditions. Presumably, additional stimulation of the p53 transcription by an extra amount of hnRNP K is not needed in the absence of stress factors.
Interestingly, one of the 20 top candidates revealed in our study with the use of HT-29 and MCF-7 cells was the chromatin high mobility group protein B1, HMGB1 (Table S2). In HepG2 cells, the HMGB1 protein was identified only under stress conditions for both P1-Δ40p53 and P0-Δ40p53 RNAs and it was scored a few positions below the ‘20 top candidates’ (Table S2). It has been shown that HMGB1 stimulates DNA binding affinity of both p53 and hnRNP K proteins [Citation41]. The HMGB1 protein is linked to various distinct processes, which mostly occur in the nucleus. This protein also takes part in the immune response to activate monocytes and macrophages when it is relocated to the cytoplasm and then secreted [Citation42]. Presumably, our RNA-affinity chromatography approach allowed to catch proteins which are able to associate with each other. This might concern hnRNP K and HMGB1 proteins which may form a complex regulating the transcription of the TP53 gene. However, further research is needed to reveal in detail how hnRNP K is recruited to the TP53 promoter region and whether other transcriptional factors are involved in this process.
What is also worth mentioning are the Far Upstream Element-Binding Protein 1 and 2 (FUBP1 and FUBP2), which were among the 20 top protein candidates for all the tested cell lines (Table S2) [Citation43]. It has been shown that FUBP1 is a crucial cofactor regulating transcription of c-myc gene [Citation43]. Interestingly, FUBP1 is able to enhance or repress the transcription process [Citation43]. Transcription inhibition by FUBP1 has been observed in the case of P21 gene, which is involved in cell cycle arrest and which is one of the major downstream genes regulated by p53 [Citation44]. Moreover, FUBP1 may interact with the DNA binding domain of p53 protein to repress its transcriptional activity during viral infection [Citation45,Citation46] or under radiation-induced stress in carcinoma cells [Citation47]. We envisage that FUBP1 might be involved in p53 expression not only via protein–protein interaction but also by binding to the TP53 promoter region and influencing its transcription.
hnRNP K is a potential factor regulating the p53 translation initiation
It has been shown that hnRNP K is able to influence the translation of several proteins via interaction with both 5ʹ- and 3ʹ- terminal regions of their mRNAs [Citation18,Citation28–Citation30]. Binding of hnRNP K to DICE element within the 3ʹUTR of lipoxygenase mRNA has been shown to block 60 S ribosomal subunit recruitment and ribosomal complex formation [Citation48], whereas interaction of hnRNP K with IRES of c-myc mRNA stimulates translation [Citation28].
Our analysis revealed that in the presence of overexpressed hnRNP K the p53 amount was increased with no changes in the p53 mRNA level in HepG2 cells under ER stress and upon thapsigargin treatment in MCF-7 cells (-D and 6C, panel TA). However, in the presence of tunicamycin, the p53 mRNA level was increased compared to the control in MCF-7 cells (, panel TU). It has been shown that prolonged treatment with a higher dose of tunicamycin eventually leads to elevation of p53 mRNA and, as a consequence, the p53 activity is enhanced in MCF-7 cells [Citation36]. An increase in p53 expression upon ER stress has also been observed in MEFs cells [Citation49]. Moreover, Candeias and colleagues have shown that changes in p53 expression upon various stress conditions, including ER stresses, depend on cell types [Citation50].
The current overall model assumes that ER stress leads to p53 inhibition via changes in the p53 phosphorylation state of Ser 376 [Citation51]. Upon phosphorylation, the p53 protein is transported to the cytoplasm and then it undergoes degradation. The observed inhibition of the p53 activity has led to a conclusion that p53 is activated only in response to stress conditions that threaten genomic integrity, such as genotoxic or nucleolar stresses [Citation51]. It has also been demonstrated that under ER stress the eIF2a factor is phosphorylated by PERK kinase which results in a global decrease in cap-dependent translation. However, some genes are still expressed at the translational level via cap-independent mode to eventually promote G2 cell arrest [Citation34].
Overexpression of hnRNP K in HepG2 cells subjected to ER stress revealed that hnRNP K is likely to be able to stimulate p53 translation. Although an increase of p53 protein was detected, the p53 mRNA level was not affected by these conditions. The involvement of hnRNP K in p53 translation regulation is supported by the results of the EMSA experiment which clearly showed the formation of hnRNP K–P1-Δ40p53 RNA complex in vitro (). We envisage that hnRNP K might interact with IRES elements within the 5ʹ-terminal region of p53 mRNA, particularly under specific stress conditions when the cap-mediated translation is diminished. Interestingly, p53 regulation by hnRNP K resembles the c-mycregulation by this protein [Citation28,Citation30]. HnRNP K is involved in transcription activation of c-myc gene and it also stimulates c-myc translation through interaction with the IRES element which is present within the 5ʹ UTR of its mRNA [Citation28,Citation30]. Currently, we are investigating in detail how hnRNP K affects the p53 translation initiation viapotential interactions with p53 IRES elements.
Network of p53 and hnRNP K interactions
Recently, it has been proposed that hnRNP K is a mutual partner of p53 to activate the p53 downstream genes in response to DNA damage [Citation20]. Moreover, high throughput analysis of the p53 targets under mitomycin C (MMC) treatment in HCT116 cells has revealed that hnRNP K gene expression is regulated by p53 [Citation52]. It has been demonstrated that augmentation of hnRNP K protein under MMC stress results from an increase in the hnRNP K mRNA level. Rahman-Roblick and colleagues have proposed a model of a positive feedback loop in which hnRNP K, as a coactivator of p53, is transcriptionally activated by p53 protein [Citation52].
Our results nicely complement the previously proposed model of p53 and hnRNP K interactions (). It emerges that hnRNP K and p53 not only work together to activate the p53 downstream genes but they influence each other at the transcriptional level, and additionally, hnRNP K is likely to stimulate p53 translation. This updated model clearly shows that expression processes of hnRNP K and p53 are directly connected at several levels to build a cell response to various environmental conditions. It has to be noted that this network is even more complicated when interactions with lncRNAs are considered as an additional level of regulation of both proteins [Citation35,Citation53,Citation54]. It has been shown that lincRNA-21 interacts with hnRNP K influencing the proper hnRNP K promoter localization which results in repression of the p53 downstream genes [Citation55]. It has also been demonstrated that another lncRNA named as p53-stabilization and activating RNA, PSTAR, is able to interact with hnRNP K [Citation53]. This interaction enhances SUMOylation of hnRNP K and, as a consequence, p53 accumulation and transactivation are observed [Citation53]. Thus, it seems that the role of hnRNP K in p53 regulation is diverse and it may depend on its binding partners [Citation35].
Figure 7. Network of p53 and hnRNP K interactions. hnRNP K and p53 stimulate each other at the transcriptional level and both proteins, as the mutual partners, coactivate the p53 downstream genes in response to stress agents (the present study and [Citation20,Citation52]). Additionally, hnRNP K may also influence the p53 expression at the translational level. New interactions proposed in this paper are marked in green.
![Figure 7. Network of p53 and hnRNP K interactions. hnRNP K and p53 stimulate each other at the transcriptional level and both proteins, as the mutual partners, coactivate the p53 downstream genes in response to stress agents (the present study and [Citation20,Citation52]). Additionally, hnRNP K may also influence the p53 expression at the translational level. New interactions proposed in this paper are marked in green.](/cms/asset/5dae3ae7-4aa4-4d69-b3df-c1623c22f5d9/krnb_a_1771944_f0007_c.jpg)
Direct, mutual regulation of hnRNP K and p53 gives rise to a question concerning the biological significance of the links between p53 and hnRNP K. It has been shown that the hnRNP K expression pattern is correlated with expression of several genes associated with human cancer such as c-myc or c-src [Citation35,Citation56]. In many tumours, the hnRNP protein level is significantly increased [Citation35]. Moreover, based on loss-of-function screening data it has been suggested that hnRNP K may be responsible for tumour aggressiveness, cell migration and metastasis [Citation57].
Based on the results described in this article we suggest that p53 and hnRNP K are key players in maintaining cell homoeostasis and any perturbations in their expression patterns result in cell disorder and, as a consequence, in tumour development. Further research should provide details on how both proteins, working together, influence the p53-response pathway and how regulation of their gene expression is linked to carcinogenesis.
Materials and methods
Cell culture and stress induction
MCF-7, HepG2 and HT-29 cells (originally from ECACC) were maintained in DMEM, MEM and McCoy’s medium, respectively. All medium solutions were supplemented with 10% foetal bovine serum, non-essential amino acids (Gibco-BRL), 100 U/mL of penicillin G, 0.1 mg/mL of streptomycin sulphate (Sigma) and the cells were maintained at 37°C in 5% carbon dioxide atmosphere. Genotoxic stress was generated by addition of doxorubicin to a final concentration of 0.5 µg/mL. Endoplasmic reticulum stress (ER) was triggered by the addition of tunicamycin or thapsigargin to a final concentration of 1.2 µM or 0.1 µM, respectively. Actinomycin D, freshly dissolved in DMSO, was applied at a final concentration of 5 nM. The cells were exposed to stress conditions for 24 h, then harvested.
Cytoplasmic lysate preparation
Approximately 4 × 10⁷ cells were used per extract for one RNA-affinity chromatography procedure. The cells were washed with PBS buffer and then they were collected by centrifugation at 1000 rpm. The pellet was resuspended in 5 pellet volumes of CE buffer (10 mM HEPES, 60 mM KCl, 1 mM EDTA, 0.075% (v/v) NP40, 1 mM DTT and 1 mM PMSF, pH 7.6) and incubated on ice for 3 min. Then, cell lysate was centrifuged at 1000 to 1500 rpm for 4 min and the cytoplasmic extract was collected.
In vitro transcription
The dsDNA templates for preparation of P1-Δ40p53 and P0-Δ40p53 RNAs were obtained previously in our laboratory [Citation7,Citation58]. The nucleotide sequence of P1-Δ40p53 RNA is shown in and an additional nucleotide stretch P0-P1 which is present in P0-Δ40p53 RNA at the 5ʹ end is depicted in the figure inset. For transcription in vitro, dsDNA templates were first linearized with Csp45 and Xba1 restriction enzymes (Thermo Scientific) in accordance with the manufacturers’ protocols. Transcription reactions with GeneJet transcription kit (Thermo Scientific) were performed as recommended by the manufacturer. After the transcription reaction, 1 unit of DNase I was added and the reaction was incubated for 15 min at 37°C. RNA was purified using the RNeasy MinElute Cleanup kit (Qiagen).
RNase-assisted RNA chromatography
RNase-assisted RNA chromatography was performed as described previously [Citation21]. Briefly, RNA (1.3 nmol) was incubated in a 200 µL reaction volume containing 0.1 M NaOAc (pH 5.0) and 5 mM sodium m-periodate (Sigma) for 1 h in the dark at room temperature. After ethanol precipitation, RNA was resuspended in 0.1 M NaOAc (pH 5.0). Adipic acid dehydrazide agarose bead slurry (Sigma) was resuspended in 0.1 M NaOAc (pH 5.0) and added to the periodate-treated RNA. RNA with the beads was incubated overnight at 4°C and then the beads were washed three times in 1 mL of 2 M KCl and three times in 1 mL of buffer D (20 mM Tris-HCl, pH 7.9, 20% (p/v) glycerol, 0.1 M KCl, 0.2 mM EDTA, 0.5 mM dithiothreitol, 0.2 mM PMSF). The RNA coupled to beads was incubated with 40% (v/v) cytoplasmic extract with addition of 1.5 mM MgCl2, 25 mM creatine-phosphate, and 5 mM ATP for 30 min at 37°C with shaking at 400 rpm. Next, the beads were washed four times with 1 mL of buffer D containing 1.5 mM MgCl2 and twice with Milli-Q water. Subsequently, RNA coupled to the beads was incubated in 60 µL reaction mixture containing 10 mM Tris-HCl (pH 7.2), 1 mM MgCl2, 40 mM NaCl, and 5 µL of A/T1 ribonuclease mix (Ambion) for 30 min at 37°C, shaking at 1400 rpm for 10 sec every minute. The concentration of RNases in the A/T1 mix was 500 U/mL for RNase A and 20,000 U/mL for RNase T1. The resulting reaction mixture was centrifuged for 1 min at 4°C and the supernatant was collected.
Mass spectrometry analysis
The proteins obtained after RNase-assisted RNA chromatography were identified using MS/MS analysis. MS analysis was performed by LC-MS in the Laboratory of Mass Spectrometry (IBB PAS, Warsaw). The peak lists were uploaded to the Mascot engine (version 2.4.1, Matrix Science) and searched against SwissProtHomo sapiens database. Subsequently, Mascot results’ list including proteins represented by at least one peptide with a score above the threshold was analysed by using MScan software available at http://proteom.ibb.waw.pl/mscan.
siRNA and vector transfection
The cells between passages 4 and 20 were used for each type of transfection. Transfection was performed when cell confluence reached 50–80%. ON-TARGETplus Human hnRNP K siRNA and ON-TARGETplus Non-targeting Pool siRNA were purchased from Dharmacon. siRNAs, at final concentrations of 10, 25 or 50 nM, were transfected into cells using RNAiMax Lipofectamine according to the manufacturer’s transfection protocol (Invitrogen). The transfected cells were washed with PBS, given fresh medium 4 h after transfection and the cells were harvested 48-h post-transfection. Transfection of pCMV3-hnRNPK-Flag vector (NCBI RefSeq: BCO14980) (Sino Biological Inc.) or phMGFP (Promega), at a final concentration of 1 µg, was performed applying Lipofectamine 3000 or DharmaFECT II transfection reagents according to the manufacturer’s transfection protocols. Cells were harvested 48 h after transfection.
Western blot
Cells were lysed in the buffer: 62.5 mM Tris-HCl pH 6.8, 2% SDS, 10% glycerol, 50 mM DTT and 0.5 mM of protease inhibitor (Roche). Total cell lysates were incubated for 5 min at 95°C, loaded on 10% or 15% SDS-PAGE gels and proteins were transferred to a nitrocellulose membrane. The blot was probed with antibodies specific to p53 (Pab 1801 or DO1) (Santa Cruz), hnRNP K (D-6) (Santa Cruz), hnRNP K (ab32969) (Abcam), Flag (PA1-984B) (Thermo Scientific), GAPDH (6 C5) (Merck). Primary antibody was detected by goat Anti-Mouse-HRP or goat Anti-Rabbit-HRP (Thermo Scientific Pierce) and visualized using chemiluminescent visualization system (ECL) (Thermo Scientific Pierce).
RNA isolation, reverse transcription and quantitative PCR (qPCR)
For RT-PCR, total RNA was isolated from MCF-7 and HepG2 cells using TriReagent according to the standard protocol. Reverse transcription was performed as previously described [Citation9]. Briefly, the cDNA was prepared from 200 ng of RNA using 100 ng of oligo(dT)18 primer and 100 units of SuperScriptTM III reverse transcriptase (Invitrogen). Primers for qPCR reaction were used at a final concentration of 200 nM. Quantitative PCRs (20 μL) were performed on aliquots of cDNA samples (5 µL, dilution 1:50) using 5x HOT FIREPol® EvaGreen® qPCR Mix Plus (Solis Biodyne). Datasets were collected on an Applied Biosystems™ QuantStudio™ 6 Flex Real-Time PCR System (Thermo Fisher Scientific). The cycling conditions were: 12 min at 95°C, followed by 40 cycles consisting of 15 s at 95°C, 20 s at 60°C, and 20 s at 72°C. Fluorescence signal data were collected during the 72°C phase of each cycle. Specificity of amplified targets was assessed by melting curve analysis from 55°C to 95°C (in 0.5°C increments, measuring fluorescence at each temperature) following the last cycle. The analysis showed the presence of only one specific product in each reaction. Sequences of the primers were as follows: P53 Forward: 5ʹ-CAGATCCTAGCGTCGAGCCCC-3ʹ; P53 Reverse: 5ʹ-CTGGGTCTTCAGTGAACCATTGTTC-3ʹ; ß-actin Forward: 5′-AGAGCAAGAGAGGCATCCTG-3′; ß-actin Reverse: 5′-CGACGTAGCACAGCTTCTCC-3′; HPRT Forward: 5′‐TGACCTTGATTTATTTTGCATACC‐3′; HPRT Reverse: 5′‐CGAGCAAGACGTTCAGTCCT‐3′.
All primer pairs were tested with regard to amplification efficiency with 4x log10 serial dilution of a random cDNA sample in triplicates. All tested primers met the criteria of efficiency 90–110% and r2 > 0.985. Statistical analysis was performed using GraphPad Prism 8. The results were expressed as a relative quantity according to the equation RQ = 2ΔΔCt ± standard deviation (SD). Differences between samples were evaluated using a two‐way t-Student test.
Protein expression
E. coli cells (BL21 Star (DE3) pLysS) (Invitrogen) were transformed with the modified pMCSG48 plasmid encoding wild-type hnRNP K protein by a heat shock method [Citation59]. Then, bacteria were inoculated in 250 mL of LB medium containing 100 µg/L ampicillin. The cells were grown at 37°C and when the OD600 of the culture reached 0.5–0.8, IPTG was added to a final concentration of 0.5 mM. After induction, the culture was incubated for 4 h at 37°C. The cell paste was resuspended in lysis buffer: 100 mM Tris-HCl pH 8.0, 500 mM NaCl, 20 mM imidazole, 6% glycerol, 1 mM DTT, 1 mM PMSF and containing 0.2 mg/mL lysozyme (BioShop). After incubation on ice for 30 min, the lysate was sonicated for 5 min: each impulse of 2 sec and 8 sec of intervals on ice. Cell debris was removed by centrifugation at 16,000 rpm for 30 min at 4°C. Affinity chromatography was used to purify hnRNP K protein. After protein binding with Ni-NTA resin (Qiagen), the column was washed with lysis buffer. Then, the protein was eluted from Nickel column with buffer 100 mM Tris-HCl pH 8.0, 300 mM NaCl, 500 mM imidazole, 6% glycerol, 1 mM DTT, 1 mM PMSF. To remove the N-terminal tag TEV protease at a final concentration of 10 U was used. After 1 h digestion, hnRNP K protein was applied to a Ni-NTA charged column to remove the tag and any undigested protein. The first flow-through was collected and the protein sample was concentrated using Amicon Ultra-15 10 K centrifugal filter device according to the manufacturer’s protocol (Merck).
Electrophoresis mobility shift assay (EMSA)
Prior to the formation of RNA-protein complexes, P1-Δ40p53RNA and P0-Δ40p53RNA were radiolabeled at the 5ʹ ends with γ-[32P] ATP and T4 polynucleotide kinase according to standard procedure. Then, RNA was incubated at 90°C for 3 min in the buffer mix containing: 20 mM HEPES pH 8.0 and 100 mM KCl. Subsequently, RNA was renatured at 37°C for 5 min with MgCl2 supplementation of 5 mM final concentration. The RNA-protein binding reaction was conducted in the buffer containing 50 mM Tris-HCl pH 8.0, 150 mM NaCl, 25 mM KCl, 2.5 mM MgCl2, 0.5 mM DTT, 10 mM imidazole, 0.5 mM PMSF, 7% glycerol, 0.5 U/μL RNasin, 75 ng/μL BSA and 100 ng/μL yeast tRNA. Subsequently, 1400 or 2400 nM of hnRNP K protein and [32P]-labelled P1-Δ40p53 RNA were incubated at/for 37°C/10 min, 25°C/15 min or 4°C/25 min. Then, the samples were loaded on 4% polyacrylamide gel (acrylamide to bisacrylamide, 29:1), 2.5% glycerol and TBE buffer. Electrophoresis was conducted at 4°C for 2 h. The gel was dried and visualized using FLA 5100 image analyzer (Fuji).
Supplemental Material
Download PDF (1.7 MB)Acknowledgments
We thank Dr Anna Urbanowicz from The Laboratory of Protein Engineering of our Institute for help in overexpression of hnRNA K in a bacterial system and the protein purification. We also thank mgr Agata Malinowska from Laboratory of Mass Spectrometry (IBB PAS, Warsaw) for help in MS analysis.
Disclosure statement
The authors report no conflict of interest.
Supplemental material
Supplemental data for this article can be accessed here.
Correction Statement
This article has been republished with minor changes. These changes do not impact the academic content of the article.
Additional information
Funding
References
- Aylon Y, Oren M. The paradox of p53: what, how, and why? Cold Spring Harb Perspect Med. 2016;6(10):a026328.
- Aubrey BJ, Kelly GL, Janic A, et al. How does p53 induce apoptosis and how does this relate to p53-mediated tumour suppression? Cell Death Differ. 2018;25(1):104–113.
- Strudwick S, Carastro LM, Stagg T, et al. Differential transcription-coupled translational inhibition of human p53 expression: a potentially important mechanism of regulating p53 expression in normal versus tumor tissue. Mol Cancer Res. 2003;1(6):463–474.
- Hafner A, Bulyk ML, Jambhekar A, et al. The multiple mechanisms that regulate p53 activity and cell fate. Nat Rev Mol Cell Biol. 2019;20(4):199–210.
- Vieler M, Sanyal S. p53 isoforms and their implications in cancer. Cancers (Basel). 2018;10(9). DOI:10.3390/cancers10090288
- Khoury MP, Bourdon JC. p53 isoforms: an intracellular microprocessor? Genes Cancer. 2011;2(4):453–465.
- Gorska A, Blaszczyk L, Dutkiewicz M, et al. Length variants of the 5ʹ untranslated region of p53 mRNA and their impact on the efficiency of translation initiation of p53 and its N-truncated isoform DeltaNp53. RNA Biol. 2013;10(11):1726–1740.
- Zydowicz-Machtel P, Swiatkowska A, Popenda L, et al. Variants of the 5ʹ-terminal region of p53 mRNA influence the ribosomal scanning and translation efficiency. Sci Rep. 2018;8(1):1533.
- Swiatkowska A, Zydowicz P, Gorska A, et al. The role of structural elements of the 5ʹ-terminal region of p53 mRNA in translation under stress conditions assayed by the antisense oligonucleotide approach. PLoS One. 2015;10(10):e0141676.
- Gorska A, Swiatkowska A, Dutkiewicz M, et al. Modulation of p53 expression using antisense oligonucleotides complementary to the 5ʹ-terminal region of p53 mRNA in vitro and in the living cells. PLoS One. 2013;8(11):e78863.
- Haronikova L, Olivares-Illana V, Wang L, et al. The p53 mRNA: an integral part of the cellular stress response. Nucleic Acids Res. 2019;47(7):3257–3271.
- Swiatkowska A, Zydowicz P, Sroka J, et al. The role of the 5ʹ terminal region of p53 mRNA in the p53 gene expression. Acta Biochim Pol. 2016;63(4):645–651.
- Grover R, Ray PS, Das S. Polypyrimidine tract binding protein regulates IRES-mediated translation of p53 isoforms. Cell Cycle. 2008;7(14):2189–2198.
- Grover R, Sharathchandra A, Ponnuswamy A, et al. Effect of mutations on the p53 IRES RNA structure: implications for de-regulation of the synthesis of p53 isoforms. RNA Biol. 2011;8(1):132–142.
- Khan D, Sharathchandra A, Ponnuswamy A, et al. Effect of a natural mutation in the 5ʹ untranslated region on the translational control of p53 mRNA. Oncogene. 2013;32(35):4148–4159.
- Takagi M, Absalon MJ, McLure KG, et al. Regulation of p53 translation and induction after DNA damage by ribosomal protein L26 and nucleolin. Cell. 2005;123(1):49–63.
- Candeias MM, Malbert-Colas L, Powell DJ, et al. P53 mRNA controls p53 activity by managing Mdm2 functions. Nat Cell Biol. 2008;10(9):1098–1105.
- Makeyev AV, Liebhaber SA. The poly(C)-binding proteins: a multiplicity of functions and a search for mechanisms. RNA. 2002;8(3):265–278.
- Kim JH, Hahm B, Kim YK, et al. Protein-protein interaction among hnRNPs shuttling between nucleus and cytoplasm. J Mol Biol. 2000;298(3):395–405.
- Moumen A, Masterson P, O’Connor MJ, et al. hnRNP K: an HDM2 target and transcriptional coactivator of p53 in response to DNA damage. Cell. 2005;123(6):1065–1078.
- Michlewski G, Caceres JF. RNase-assisted RNA chromatography. RNA. 2010;16(8):1673–1678.
- Bakun M, Karczmarski J, Poznanski J, et al. An integrated LC-ESI-MS platform for quantitation of serum peptide ladders. Application for colon carcinoma study. Proteomics Clin Appl. 2009;3(8):932–946.
- Chen J, Guo K, Kastan MB. Interactions of nucleolin and ribosomal protein L26 (RPL26) in translational control of human p53 mRNA. J Biol Chem. 2012;287(20):16467–16476.
- Barberi-Heyob M, Vedrine PO, Merlin JL, et al. Wild-type p53 gene transfer into mutated p53 HT29 cells improves sensitivity to photodynamic therapy via induction of apoptosis. Int J Oncol. 2004;24(4):951–958.
- Mosner J, Mummenbrauer T, Bauer C, et al. Negative feedback regulation of wild-type p53 biosynthesis. Embo J. 1995;14(18):4442–4449.
- Bonnal S, Pileur F, Orsini C, et al. Heterogeneous nuclear ribonucleoprotein A1 is a novel internal ribosome entry site trans-acting factor that modulates alternative initiation of translation of the fibroblast growth factor 2 mRNA. J Biol Chem. 2005;280(6):4144–4153.
- Ray PS, Das S. La autoantigen is required for the internal ribosome entry site-mediated translation of Coxsackievirus B3 RNA. Nucleic Acids Res. 2002;30(20):4500–4508.
- Evans JR, Mitchell SA, Spriggs KA, et al. Members of the poly (rC) binding protein family stimulate the activity of the c-myc internal ribosome entry segment in vitro and in vivo. Oncogene. 2003;22(39):8012–8020.
- Mukhopadhyay NK, Kim J, Cinar B, et al. Heterogeneous nuclear ribonucleoprotein K is a novel regulator of androgen receptor translation. Cancer Res. 2009;69(6):2210–2218.
- Bomsztyk K, Denisenko O, Ostrowski J. hnRNP K: one protein multiple processes. Bioessays. 2004;26(6):629–638.
- Dominguez D, Freese P, Alexis MS, et al. Sequence, structure, and context preferences of human RNA binding proteins. Mol Cell. 2018;70(5):854–67 e9.
- Kim DY, Kim W, Lee KH, et al. hnRNP Q regulates translation of p53 in normal and stress conditions. Cell Death Differ. 2013;20(2):226–234.
- Szpotkowska J, Swiatkowska A, Ciesiolka J. Length and secondary structure of the 5ʹ non-coding regions of mouse p53 mRNA transcripts - mouse as a model organism for p53 gene expression studies. RNA Biol. 2019;16(1):25–41.
- Mlynarczyk C, Fahraeus R. Endoplasmic reticulum stress sensitizes cells to DNA damage-induced apoptosis through p53-dependent suppression of p21(CDKN1A). Nat Commun. 2014;5(1):5067.
- Barboro P, Ferrari N, Balbi C. Emerging roles of heterogeneous nuclear ribonucleoprotein K (hnRNP K) in cancer progression. Cancer Lett. 2014;352(2):152–159.
- Lin WC, Chuang YC, Chang YS, et al. Endoplasmic reticulum stress stimulates p53 expression through NF-kappaB activation. PLoS One. 2012;7(7):e39120.
- Ostrowski J, Kawata Y, Schullery DS, et al. Transient recruitment of the hnRNP K protein to inducibly transcribed gene loci. Nucleic Acids Res. 2003;31(14):3954–3962.
- Michelotti EF, Michelotti GA, Aronsohn AI, et al. Heterogeneous nuclear ribonucleoprotein K is a transcription factor. Mol Cell Biol. 1996;16(5):2350–2360.
- Ritchie SA, Pasha MK, Batten DJ, et al. Identification of the SRC pyrimidine-binding protein (SPy) as hnRNP K: implications in the regulation of SRC1A transcription. Nucleic Acids Res. 2003;31(5):1502–1513.
- Saldana-Meyer R, Recillas-Targa F. Transcriptional and epigenetic regulation of the p53 tumor suppressor gene. Epigenetics. 2011;6(9):1068–1077.
- Dintilhac A, Bernues J. HMGB1 interacts with many apparently unrelated proteins by recognizing short amino acid sequences. J Biol Chem. 2002;277(9):7021–7028.
- Youn JH, Shin JS. Nucleocytoplasmic shuttling of HMGB1 is regulated by phosphorylation that redirects it toward secretion. J Immunol. 2006;177(11):7889–7897.
- Debaize L, Troadec MB. The master regulator FUBP1: its emerging role in normal cell function and malignant development. Cell Mol Life Sci. 2019;76(2):259–281.
- Rabenhorst U, Thalheimer FB, Gerlach K, et al. Single-stranded DNA-binding transcriptional regulator FUBP1 is essential for fetal and adult hematopoietic stem cell self-renewal. Cell Rep. 2015;11(12):1847–1855.
- Dixit U, Pandey AK, Liu Z, et al. FUSE binding protein 1 facilitates persistent hepatitis C virus replication in hepatoma cells by regulating tumor suppressor p53. J Virol. 2015;89(15):7905–7921.
- Frost JR, Mendez M, Soriano AM, et al. Adenovirus 5 E1A-mediated suppression of p53 via FUBP1. J Virol. 2018;92(14):14.
- Dixit U, Liu Z, Pandey AK, et al. Fuse binding protein antagonizes the transcription activity of tumor suppressor protein p53. BMC Cancer. 2014;14:925.
- Ostareck DH, Ostareck-Lederer A, Shatsky IN, et al. Lipoxygenase mRNA silencing in erythroid differentiation: the 3ʹUTR regulatory complex controls 60S ribosomal subunit joining. Cell. 2001;104(2):281–290.
- Li J, Lee B, Lee AS. Endoplasmic reticulum stress-induced apoptosis: multiple pathways and activation of p53-up-regulated modulator of apoptosis (PUMA) and NOXA by p53. J Biol Chem. 2006;281(11):7260–7270.
- Candeias MM, Powell DJ, Roubalova E, et al. Expression of p53 and p53/47 are controlled by alternative mechanisms of messenger RNA translation initiation. Oncogene. 2006;25(52):6936–6947.
- Qu L, Huang S, Baltzis D, et al. Endoplasmic reticulum stress induces p53 cytoplasmic localization and prevents p53-dependent apoptosis by a pathway involving glycogen synthase kinase-3beta. Genes Dev. 2004;18(3):261–277.
- Rahman-Roblick R, Roblick UJ, Hellman U, et al. p53 targets identified by protein expression profiling. Proc Natl Acad Sci U S A. 2007;104(13):5401–5406.
- Qin G, Tu X, Li H, et al. Long noncoding RNA p53-stabilizing and activating RNA promotes p53 signaling by inhibiting heterogeneous nuclear ribonucleoprotein K deSUMOylation and suppresses hepatocellular carcinoma. Hepatology. 2019. DOI:10.1002/hep.30793
- Dangelmaier E, Lazar SB, Lal A. Long noncoding RNAs: p53’s secret weapon in the fight against cancer? PLoS Biol. 2019;17(2):e3000143.
- Huarte M, Guttman M, Feldser D, et al. A large intergenic noncoding RNA induced by p53 mediates global gene repression in the p53 response. Cell. 2010;142(3):409–419.
- Ostareck-Lederer A, Ostareck DH, Cans C, et al. c-Src-mediated phosphorylation of hnRNP K drives translational activation of specifically silenced mRNAs. Mol Cell Biol. 2002;22(13):4535–4543.
- Inoue A, Sawata SY, Taira K, et al. Loss-of-function screening by randomized intracellular antibodies: identification of hnRNP-K as a potential target for metastasis. Proc Natl Acad Sci U S A. 2007;104(21):8983–8988.
- Blaszczyk L, Ciesiolka J. Secondary structure and the role in translation initiation of the 5ʹ-terminal region of p53 mRNA. Biochemistry. 2011;50(33):7080–7092.
- Figlerowicz M, Urbanowicz A, Lewandowski D, et al. Functional insights into recombinant TROSPA protein from Ixodes ricinus. PLoS One. 2013;8(10):e76848.