
ABSTRACT
Transfer RNA-derived fragments (tRFs) are a new class of small non-coding RNAs whose biological roles in cancers are not well understood. Emerging evidence suggests that tRFs are involved in gene regulation at multiple levels. In this study, we constructed an integrative database, OncotRF (http://bioinformatics.zju.edu.cn/OncotRF), for in silico exploration of tRF functions, and identification of diagnostic and prognostic biomarkers in cancers. The database contains an analysis pipeline for tRF identification and characterization, analysis results of 11,211 small RNA sequencing samples and 8,776 RNA sequencing samples, and clinicopathologic annotation data from The Cancer Genome Atlas (TCGA). The results include: tRF identification and quantification across 33 cancers, abnormally expressed tRFs and genes, tRF-gene correlations, tRF-gene networks, survival analyses, and tRF-related functional enrichment analyses. Users are also able to identify differentially expressed tRFs, predict their functions, and assess the relevance of the tRF expression levels to the clinical outcome according to user-defined groups. Additionally, an online Kaplan-Meier plotter is available in OncotRF for plotting survival curves according to user-defined groups. OncotRF will be a valuable online database and functional annotation tool for researchers studying the roles, functions, and mechanisms of tRFs in human cancers.
Introduction
High-throughput deep sequencing technologies have led to the discovery of a wide spectrum of small non-coding RNA species. Although some of these have been well-characterized, such as microRNAs (miRNAs) and Piwi-interacting RNAs, most are not fully understood [Citation1]. Initially, transfer RNA-derived fragments (tRFs) were considered to be tRNA degradation products. Upon further analysis, these sequence reads were recognized as being abundant, with recurring sequences, suggesting the existence of a novel class of small RNAs. Generally, at least six types of tRFs have been defined based on their cleavage sites in tRNAs: 5ʹ-and 3ʹ-halves (>30 nt), 5ʹ- and 3ʹ-tRFs (15–30 nt), i-tRFs and 3ʹU-tRFs (also named as tsRNAs) [Citation2–Citation4]. Several recent studies have shown that tRFs regulate gene expression at multiple levels [Citation2,Citation3]. Emerging evidence has demonstrated that tRFs have biological functions through the regulation of various cellular processes at both post-transcriptional and translational levels [Citation5]. They can regulate RNA silencing [Citation6], long terminal repeat retrotransposons [Citation7], ribosome biogenesis [Citation8], viral infections [Citation9,Citation10], and translation [Citation11,Citation12]. Additionally, some parental sperm tRFs contribute to an offspring’s metabolism [Citation13,Citation14].
tRFs are abundant and conserved across species [Citation15]. They are derived from mature or precursor tRNAs by specific cleavage. Recently, tRFs were found to play important roles in cancer development and progression through the regulation of cell proliferation, invasion, metastasis, and gene expression [Citation16]. Aberrantly expressed tRFs have the potential to serve as diagnostic biomarkers and therapeutic targets in cancer treatments [Citation15,Citation16]. For example, tRF-1001 was the first reported tRF to modulate cell proliferation in prostate cancer [Citation3]. CU1276 was shown to function similar to a miRNA and suppress proliferation in B cell lymphoma [Citation17]. SHOT-RNAAsp-GUC, SHOT-RNAHis-GUG, and SHOT-RNALys-CUU are sex hormone-dependent tRNA halves that promote cell proliferation in breast and prostate cancers [Citation18]. 5ʹ-halves from tRNAGlu, tRNAAsp, tRNAGly, and tRNATyr can bind to oncogenic protein YBX1 competitively with pro-oncogenic transcripts, resulting in inhibition of tumour metastasis in breast cancer cells [Citation19]. However, the mechanism of action of tRFs and their role in cancer development and progression remains largely unexplored.
Currently, only two databases have been constructed for tRFs in humans [Citation20]. tRFdb is a database that contains the sequences and read counts of tRFs from eight species [Citation21]. MINTbase is a repository with tRF information that arises from nuclear and mitochondrial tRNAs [Citation22]. There is another web server named tRF2 Cancer, which can be used for identifying tRFs from small RNA sequencing datasets and it contains tRF expression information from various cancer types [Citation23]. However, these databases only contain tRF expression across cancer types or focus on the identification of tRFs from small RNA-sequencing data. There is currently no database which includes information regarding dysregulated tRFs, the potential functions of these tRFs in cancers, the gene network they may participate in, their clinical and functional relevance to cancers, and whether they are validated by other low throughput methods.
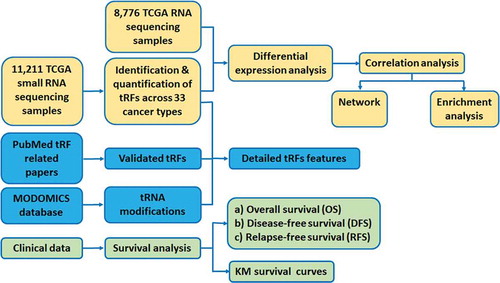
To fill this gap, we constructed a comprehensive tRF database named OncotRF (). With this database, we aim to provide the most comprehensive tRF resource in human cancers and include large-scale integration of small RNA sequencing, RNA sequencing, clinicopathologic datasets from The Cancer Genome Atlas (TCGA), chemical modification sites on their parental tRNAs, and validated literature manually curated from PubMed. OncotRF is a valuable online resource for identifying diagnostic and prognostic biomarkers, developing cancer therapeutic targets, and studying cancer pathogenesis. It is of great interest to cancer and RNA biology fields.
Figure 1. Schematic representation of data processing and flowchart of OncotRF construction.
Results
OncotRF contains 11,211 small RNA sequencing samples, 8776 RNA sequencing samples, and clinicopathologic annotation data from TCGA. It adopts a highly conserved filtering strategy in which only the tRFs with 10th quantile reads per million (RPM) >1 were retained in the reported candidate list, which was widely used in miRNA studies and other non-coding RNA studies [Citation24,Citation25]. As a result, 6966 abundant tRFs derived nuclear and mitochondrial tRNAs were detected in OncotRF, including 992 5ʹ-tRFs, 799 3ʹ-tRFs, 271 3ʹU-tRFs and 4933 i-tRFs (). Based on these datasets, OncotRF provides five main functions to retrieve various data records, including ‘Search’, ‘Cancer’, ‘Custom’, ‘KM-plotter’, and ‘JBrowse’. Various graphical visualization pages are also provided to display the tRF analysis results. From the website, users can retrieve the following data records regarding tRFs: (i) detailed information of each tRF and its expression among different cancer types; (ii) validation information, if available; (iii) differential expression analysis of tRFs and mRNAs between tumour and normal tissues; (iv) genes associated with tRFs; (v) regulatory network; (vi) functional analysis; (vii) survival analysis; (viii) tRF modifications; and (ix) Kaplan-Meier survival curves. We also allow researchers to identify differentially expressed tRFs and provide an online Kaplan-Meier plotter according to two user-defined groups.
Table 1. Summary of TCGA samples used in the study and 5ʹ-tRFs, 3ʹ-tRFs,3ʹU-tRFs and i-tRFs identified in the study.
tRF data search
OncotRF provides an easily searchable interface and can be queried through the tRF ID, tRF type, sequence, source tRNA name, anti-codon, genomic locus, and aliases from the literature. The results returned from the search are organized in an HTML table, listing the detailed information of tRFs including tRF ID, tRF type, source tRNAs, genome loci (hg19), tRF length, sequence, and links to the three additional pages (‘Expression’, ‘Alignment & Modification’, and ‘Validation’ pages). To demonstrate the search function, we took 3ʹ-M-tRNA-Gly-GCC-2-6_L22 (also known as CU1276 and tRF-3018) as an example in because it was a previously reported 3ʹ-tRF that functions similar to a miRNA and suppresses proliferation in B cell lymphoma [Citation17]. When ‘3ʹ-M-tRNA-Gly-GCC-2-6_L22’ is searched, a detailed page will be displayed as . If a tRF sequence can be also mapped to non-tRNA regions, its associated chromosomes and regions will also be provided. For example, ‘5ʹ-tRNA-Ala-AGC-6-1_L24’ can be derived from tRNA ‘tRNA-Ala-AGC-6-1’ (tRF: chr6:28779897-28779920(-)), but can also be mapped to a non-tRNA region on chromosome 10 (chr10:125664644-125664667(-)). Furthermore, these tRF IDs will be highlighted in bold red, and a note will be shown at the top of the search table, warning the possibility of false positiveness.
Figure 2. Search functions of OncotRF. (A) Search result of 3ʹ-M-tRNA-Gly-GCC-2-6_L22. (B) 3ʹ-M-tRNA-Gly-GCC-2-6_L22 expression in cancers. (C) Validation result of 3ʹ-M-tRNA-Gly-GCC-2-6_L22. (D) 3ʹ-M-tRNA-Gly-GCC-2-6_L22 alignment with tRNA-Gly-GCC-2-1, its position on the secondary structure of tRNA-Gly-GCC-2-1, and possible modifications of tRNA-Gly-GCC-2-1 from MODIFICS database.
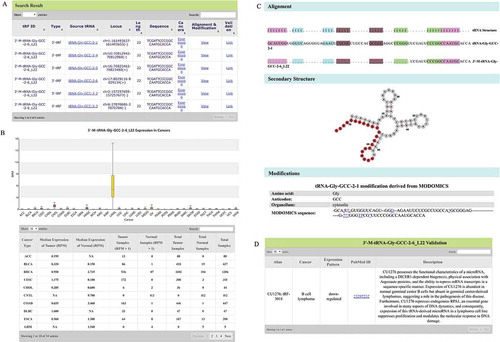
The ‘Expression’ page includes a boxplot of the tRF expression for each cancer and an expression table of the searched tRF in cancers. As shown in , the expression table displayed the median expression of 3ʹ-M-tRNA-Gly-GCC-2-6_L22 in tumour samples (‘Median Expression of Tumor (RPM)’) and normal samples (‘Median Expression of Normal (RPM)’), the number of tumour samples (‘Tumor Samples (RPM>1)’) and normal samples (‘Normal Samples (RPM>1)’) with RPM>1, total number of tumour samples (‘Total Tumor Samples’), total number of normal samples (‘Total Normal Samples’) and total number of samples (‘Total Samples’) ().
The ‘Alignment & Modification’ page provides a visualization of the tRF on the secondary structure of the source tRNA, including possible modifications (). As shown in , 3ʹ-M-tRNA-Gly-GCC-2-6_L22 can be derived from the tRNA ‘tRNA-Gly-GCC-2-1’ on which ten nucleotides are potentially modified based on the information from MODOMICS database. Users can click the link of the nucleotide in blue for the detailed information about its modification. Such modifications may play a role in the tRF function and biogenesis in cancers [Citation26].
The ‘Validation’ page will also be provided if any reports regarding the searched tRF are published in PubMed. For example, a recent study showed that ‘3ʹ-M-tRNA-Gly-GCC-2-6_L22’, alias ‘CU1276’ and ‘tRF-3018’, is down-regulated in B cell lymphoma and possesses a miRNA-like function [Citation17]. As shown in , the information regarding this research article will be displayed by clicking the ‘Validation’ link in . Five terms can be viewed in this page, including the tRF name in the literature (alias), cancer, expression pattern, PubMed ID, and description of the functions. Users can easily access the literature through the link of the PubMed ID.
We also provide a keyword search in ‘Search’ page, such as tissue ‘bladder’, cancer type ‘bladder cancer’ or gene symbol ‘CALD1’. For tissue or cancer type, OncotRF will return the links to i) tRF expression in corresponding cancers, similar to the table shown in ; ii) differential expressed tRFs, mRNAs, and functional analysis; and iii) survival analysis results (similar to ). For example, if users search keywords ‘bladder cancer’, a page shown in Fig. S1 will be displayed. For gene symbol ‘CALD1’, OncotRF will return a table of tRFs which are significantly related to the searched gene in each cancer (Fig. S2). Detailed usage can be found in the ‘Help’ web page of OncotRF (http://bioinformatics.zju.edu.cn/OncotRF/Pages/Help.html).
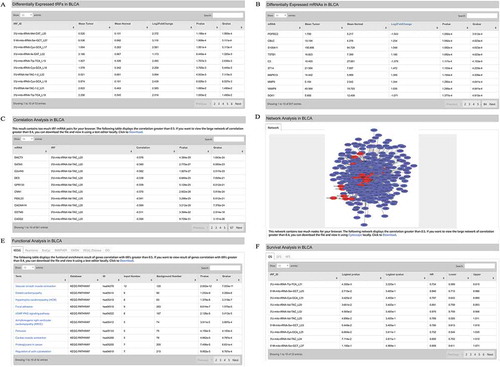
Figure 3. Cancer functions. (A) Differentially expressed 3ʹU-tRFs in BLCA. (B) Differentially expressed mRNAs in BLCA. (C) Correlation analysis of tRFs and mRNAs in BLCA. tRF-mRNA pairs with their absolute correlation coefficients > 0.4 (i.e., |r|>0.4) were presented. (D) Network analysis of differentially expressed tRFs and mRNAs in BLCA. tRF-mRNA pairs with |r|>0.4 in Figure 3 C were subjected to network analysis. (E) Functional enrichment analysis of genes that are co-expressed with 3ʹ- U-tRFs (|r|>0.4). (F) Survival analysis of differentially expressed 3ʹU-tRFs in BLCA.
Analysis of cancer-related tRFs
A key feature of OncotRF is the comprehensive display of cancer-related tRFs. Users can browse this information by clicking the tree navigation bar on the left (e.g. ‘Differential Expression Analysis’ – ‘BLCA’ – ‘3ʹU-tRF’). The differentially expressed tRFs and mRNAs between tumour and normal tissues were calculated using Wilcoxon rank-sum test with default parameters [Citation27] and filtered by the absolute value of Log2FoldChange > 1 and Pvalue < 0.05. The result tables display the mean expression of the tRF or mRNA in tumour and normal tissues, Log2FoldChange, Pvalue, and Qvalue when comparing tumour and normal tissues (, ). The tables can be reordered by clicking the ‘up and down arrows’ next to the column names. Users can also filter the content by keyword search in the top, right corner of each table. For example, users can enter a tRF ID such as the first tRF in the result table ‘3ʹU-mito-tRNA-Val-TAC_L20’ in the ‘Search’ box of the ‘Differential Expressed tRFs in BLCA’ table (), and then only the information including ‘3ʹU-mito-tRNA-Val-TAC_L20’ will be displayed in the table. It is useful for users to quickly identify a particular tRF when there are a very large number of records in the table.
To predict the potential function of tRFs, we calculated the association between tRFs and mRNAs, and took 3ʹU-tRFs and BLCA as an example (). This prediction method is commonly based on ‘guilt-by-association’ from co-expression patterns [Citation28], namely tRFs share similar functions with their co-expressed mRNAs. In our database, tRF and mRNA are treated as a strong relationship, if their absolute correlation coefficients exceed 0.4; whereas, they are treated as a weak relationship, if their absolute correlation coefficients are smaller than 0.4. Users can change this default threshold according to their research design and aim. Strong tRF-mRNA relationships, whose absolute correlation coefficients exceed 0.4, are organized as a network using Cytoscape [Citation29] (). Hub genes or tRFs (e.g., 3ʹU-mito-tRNA-Val-TAC_L22) that have a high degree of intra-module connectivity can be identified in the network. If there are too many tRF-mRNA pairs whose absolute correlation coefficients exceed 0.4, it will be difficult for the user’s web browser to display the correlation table () and network (). Under this circumstance, OncotRF will automatically increase the correlation threshold and display the correlation table () and network () with their absolute correlation coefficients exceeding 0.5 or greater. Users can download the large correlation table and network when there are too many tRF-mRNA pairs with smaller correlation thresholds, and view them using Cytoscape [Citation29] or text editor locally. The filtered mRNAs interacting with tRFs were further functionally analysed using KOBAS 3.0 to predict the cancer tRF-mediated pathways (), incorporating four pathway databases (KEGG PATHWAY, BioCyc, Reactome and PANTHER) and two human disease databases (OMIM and KEGG DISEASE). Significantly enriched Gene Ontology (GO) terms can also be identified and displayed (p-value < 0.05). Each table displays the pathway/disease terms (Term), databases names (Database), pathway ID (ID), the number of genes that are co-expressed with tRFs in the pathway or disease category (Input Number), total number of genes involved in a particular pathway or disease category in human genome (Background Number), Pvalue and Qvalue. A p-value or q-value < 0.05 is statistically significant. Users can view the detailed information by clicking the link of the pathway term. For example, by clicking the first term ‘Vascular smooth muscle contraction’ in , a pathway graph will be shown in Fig. S3. The box with red background indicates genes which are significantly associated with those abnormally expressed tRFs.
The survival analyses of tRFs in a specific cancer type are also displayed (). Three types of survival outcomes were included in the results including overall survival (OS), disease-free survival (DFS), and relapse-free survival (RFS). OS is the length of time that the patients survive from either the date of diagnosis or the start of treatment. DFS is the length of time following treatment during which no disease is found. RFS is the length of time between when a primary treatment for a cancer ends and the patient survives without any signs or symptoms of that cancer. As shown in , each table displays six columns: tRF IDs (tRF_ID), the p-value (Logtest pvalue) and q-value (Logtest qvalue) of log-rank test, hazard ratio (HR), lower 95% confidence interval (Lower), and upper 95% confidence interval (Upper).
The survival analysis of a specific tRF in all cancers and Kaplan-Meier plots for each cancer type can also be obtained by clicking the lower left navigation bar ‘Survival Analysis’ (e.g. ‘Survival Analysis’ – ‘tRF’ – ‘3ʹU-tRF’ – ‘3ʹU-M-mito-tRNA-Tyr-GTA_L20’). In default survival analysis, the patients are divided into two groups with higher or lower expression according to the median of tRF expression. For each tRF, we took ‘3ʹU-M-mito-tRNA-Tyr-GTA_L20’ (the first tRF of 3ʹU-tRF in the navigation bar) as an example. By clicking ‘Survival Analysis’ – ‘tRF’ – ‘3ʹU-tRF’ – ‘3ʹU-M-mito-tRNA-Tyr-GTA_L20’, three types of survival analysis results of this tRF in each cancer, if available, will be displayed in tables, and Kaplan-Meier curves will be also displayed (Fig. S4). For each cancer type, we took ‘ACC’ as an example. By clicking ‘Survival Analysis’ – ‘Cancer Type’ – ‘ACC’, four tRF types will be displayed. Then clicking ‘3ʹU-tRF’, the survival analysis results of all the 3ʹU-tRFs which can be detected in ACC will be displayed in tables (Fig. S5). The only difference of this table from is that the table displays all the 3ʹU-tRFs detected in ACC rather than only the tRFs that differentially expressed between tumour and normal tissues (Fig. S5).
tRFs custom analysis
Another key function of the database is its ability to analyse differentially expressed tRFs between two user-defined groups. Users can filter the datasets by clinical criteria such as cancer subtype, tissue type, gender, age at diagnosis, vital status, days to death, race, or ethnicity (). For example, if we want to compare the difference in tRF expression in tumours between men and women, we can choose the parameters as shown in . By clicking ‘GO’ in , the results of differentially expressed tRFs between the two user-defined groups will be displayed in when the analysis is completed.
Figure 4. Custom functions. (A) Clinical criteria and other parameters for custom functions. (B) tRF differences between two customized groups as defined in (A).
KM-plotter
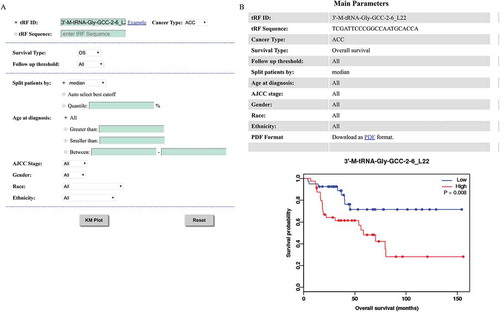
The discovery of prognostic biomarkers is an important task in cancer research. This section can estimate the prognostic value of any selected tRFs in a large cohort of clinical patients. In order to analyse the association between a queried tRF and survival, the samples are separated into two groups according to the mean, median, or other quartile expressions of the selected tRF. Then, the two groups are compared using a Kaplan-Meier plot. Before running the analysis, the patients can be filtered using age, AJCC stage, gender, race, or ethnicity (). Additionally, three types of survival (i.e., OS, DFS, and RFS) can be chosen. The patients are divided into two groups with higher or lower expression according to the split cut-off (such as mean, median, etc). The log-rank test is performed to evaluate statistical differences in survival between the two groups. Taking ‘3ʹ-M-tRNA-Gly-GCC-2-6_L22’ as an example, a web page as shown in will be displayed, including the parameters users chose and a survival curve in ‘png’ format. A ‘pdf’ format of high resolution survival curve can be downloaded by click ‘PDF’ link.
Figure 5. Kaplan-Meier plotter. (A) Choosing plot parameters for the overall survival analysis of 3ʹ-M-tRNA-Gly-GCC-2-6_L22 in ACC. (B) Survival curves of 3ʹ-M-tRNA-Gly-GCC-2-6_L22 in ACC.
JBrowse
The JBrowse genome browser [Citation30], a javascript-based genome browser, is a useful tool for inspecting sequences and locations in a visual way. We configured JBrowse in OncotRF to display tRF, tRNA, and mRNA sequences in the genome (hg19) (Fig. S6). Users can view the position of these tRFs, tRNA or genes on the genome as well as the upstream and downstream of tRFs, tRNA or genes. A pop-up will show details of the tRF, tRNA or gene name in the genome when users click on the tRF, tRNA or gene name. For example, by clicking the tRF ‘i-tRNA-Thr-CGT-chr1-118_L21_pos112’ in red box, a pop-up of the tRF will be shown in the middle of the screen (Fig. S6).
Case analysis
Bladder urothelial carcinoma (BLCA) is a major cause of morbidity and mortality worldwide, causing an estimated 150,000 deaths per year [Citation31]. To identify 3ʹU-tRFs which are potentially involved in BLCA, we first examined OncotRF using the ‘Cancer’ function. After clicking ‘Differential Expression Analysis’, ‘BLCA’, and ‘3ʹU-tRF’ on the menu, a detailed webpage was shown on the right screen. Abnormally expressed tRFs and genes were organized into tables (, ). Based on these differential expression tables, the correlations between 3ʹU-tRFs and mRNAs were estimated in and subsequently visualized in . Next, OncotRF performed a functional enrichment analysis of genes that are co-expressed with 3ʹU-tRFs in the correlation table. As the functional results showed in , the related tRFs and genes were involved in multiple KEGG pathways such as ‘Vascular smooth muscle contraction’, ‘Dilated cardiomyopathy’, ‘Hypertrophic cardiomyopathy (HCM)’, and ‘Focal adhesion’. We took ‘Vascular smooth muscle contraction’ as an example, which was the most significant KEGG pathway enriched in 3ʹU-tRF-related genes. Then, we focused on dysregulated genes that potentially participate in this pathway. By clicking the link of the term ‘Vascular smooth muscle contraction’, a pathway graph will be shown as in Fig. S3. The box with red background indicates genes which are significantly correlated with these aberrantly expressed 3ʹU-tRFs. Based on prior knowledge, CALD1 encodes a calmodulin- and actin-binding protein that plays an essential role in the regulation of smooth muscle and nonmuscle contraction [Citation32]. By clicking the red box ‘CaD’, a web page including the gene name of ‘CaD’ will be shown in Fig. 7SA. In order to filter the related 3ʹU-tRFs and the information of ‘CALD1’, copy the gene name ‘CALD1’ and enter it to the ‘Search box’ on the top right corner of ‘Correlation Analysis in BLCA’ table and ‘Differential Expressed mRNAs in BLCA’. As shown in Fig. S7B-C, six 3ʹU-tRFs were highly correlated with ‘CALD1’, and the expression of CALD1 was significantly differentially expressed between BLCA tumour tissues and normal tissues (Log2FoldChange = −1.629, P = 3.009 × 10⁻⁵). Among them, ‘3ʹU-mito-tRNA-Val-TAC_L22’ was the most negatively correlated with ‘CALD1’. It was also significantly upregulated in BLCA tumours (Log2FoldChange = 2.396, P = 1.995 × 10⁻⁹) (Fig. S7D). Taken together, these results generated a testing hypothesis for users: ‘3ʹU-mito-tRNA-Val-TAC_L22’ is a potential oncogenic regulator in BLCA through its negative regulation of ‘CALD1’ in the ‘Vascular smooth muscle contraction’ pathway.
Discussion
OncotRF is a comprehensive catalogue for dysregulated tRFs across human cancers. It provides several prominent features that were previously either naïvely obtained or unattainable using existing databases [Citation21,Citation22].
First, OncotRF provides an integrated view of dysregulated tRFs among cancers. Users can retrieve the median expression levels in tumour and normal tissue groups, fold changes, p-values, and false discovery rates for differential expression analysis of dysregulated tRFs in each cancer type. Our custom analysis can also detect differential expression of tRFs between two customized groups. Users can specify different clinical parameters such as sex through the ‘Custom’ page, allowing to identify sex-dependent tRFs in cancer. These dysregulated tRFs are relatively stable due to their own chemical modification, and thereby can serve as promising biomarkers for cancer diagnosis and potential new targets for cancer treatment. This resource also serves as a starting point for users to study tRF gene regulation and functional roles in cancers.
Second, OncotRF provides comprehensive functional annotations of dysregulated tRFs among cancers. Studies of tRF functions have been problematic due to a lack of ‘a priori’ knowledge. Therefore, we integrated TCGA RNA-seq datasets with these dysregulated tRFs to allow functional correlation analyses between tRFs and mRNAs. Enrichment analyses of mRNAs co-expressed with dysregulated tRFs can then be performed using multiple annotation categories including GO terms, bio-pathways, and disease associations. Additionally, the regulatory network of tRFs and genes can be visualized online. Based on the functional enrichment results, the potential functions of tRFs can be predicted from their co-expression patterns, namely tRFs share similar functions with their co-expressed mRNAs. This resource provides new insights into dysregulated tRFs and helps users to design their experiments and generate testable hypotheses to study the molecular mechanisms of tRFs in cancers.
Third, OncotRF provides the clinical relevance of these dysregulated tRFs to cancers. Comprehensive clinicopathologic annotation data from TCGA were integrated into the database, along with the dysregulated tRFs for performing survival analysis. An online Kaplan-Meier plotter was also provided as an individual module. The user-friendly interface and additional parameters, such as adjusting for clinical variables like tumour stage and size, were included in the design for plotting survival curves with hazard ratios and log-rank p-values. This function can evaluate the prognostic value of any selected tRFs in a large cohort of clinical patients. This resource helps users to identify promising prognostic biomarkers and new relevant targets for cancer therapy in their clinical investigations.
It is also worth noting that the number of tRFs detected in our OncotRF database is smaller than previously reported in the TCGA datasets [Citation21–Citation23]. This is largely attributed to the different filtering approaches utilized to address low-expression tRFs. For instance, those tRFs that exceeded a normalized abundance of 1 RPM in one sample of each cancer type were retained in MINTbase [Citation22]. However, we adopted a highly conserved strategy in which only the tRFs with the 10th quantile RPM > 1 were included in our reported candidate list, which has been used widely in miRNA and other non-coding RNA studies [Citation24,Citation25]. The robust tRF list obtained led to unbiased findings in our downstream analysis.
Several study caveats should be acknowledged. First, since most small RNA sequencing datasets contain transcripts that are smaller than 30 nts, tRNA halves were not examined. RNA sequencing from total RNA with rRNA depletion or polyA (-) samples may complement this resource. Second, chemical modifications may prematurely terminate cDNA synthesis during library preparation for sequencing. This may affect the detection and quantification of tRFs. Some newly developed methods may overcome this obstacle such as AlkB-facilitated RNA methylation sequencing (ARM-seq) [Citation33]. Therefore, we will collect more ARM-seq-like datasets and improve our pipeline for a full characterization of cancer-related tRFs. Third, tRNA annotation in the human genome is incomplete. It is unclear whether currently unannotated genomic regions similar to the tRNA sequences are true tRNAs, truncated tRNAs, or unrelated to tRNAs entirely. Mapping to the whole genome would result in ambiguity about the origin of many reads [Citation34,Citation35]. In our study, approximately 63% (4410/6966) of the detected tRFs were mapped to the tRNA space as well as to other non-tRNA locations of the genome with unknown transcript statuses. If these sequences were discarded, we would exclude a large number of tRFs that are potentially involved in cancers, thereby running into the risk of greatly inflating the false negative rates. On the contrary, if these reads are retained, a number of multi-mapped reads would be treated as tRFs, thereby running the risk of inflating the false positive rates. The resulting false positive rate is relatively low because the current tRNA annotation of the human genome is incomplete and only the transcribed genome (e.g., small RNAs) is made for sequencing libraries. However, further investigations are required to develop probabilistic models to assign these tRF multireads to their most likely locations using prior information hidden in the genome (e.g., transcript status inferred from the NIH Roadmap Epigenomics Program[Citation36]). We look forward to further updating our database once such new tools are available.
Conclusions
In summary, OncotRF is a valuable online resource for identifying diagnostic and prognostic biomarkers, developing cancer therapeutic targets, and studying cancer pathogenesis. It is of great interest to cancer and gene regulation fields. It provides several prominent features over currently existing databases including information about dysregulated tRFs and their clinical and functional relevance to cancers. We will continue to expand the number of small RNA-seq datasets in our database allowing for more comprehensive functional analyses of cancer-related tRFs. Furthermore, we will continue to increase the database functionality and optimize the organization and layout of our site to improve the user experience and usability.
Methods
Data collection
The data processing and flow chart for constructing the database are shown in . The BAM files of 11,211 small RNA sequencing samples were downloaded from the Genomic Data Commons (https://portal.gdc.cancer.gov/). The mRNA expression profiles of 8776 RNA sequencing samples, and the corresponding patient clinical information, including survival time, age, tumour stage, and tumour grade were downloaded from the International Cancer Genome Consortium (ICGC) Data Portal (http://dcc.icgc.org) (). Human genome (hg19) gene annotations and corresponding sequences of 610 nuclear tRNA genes in humans were downloaded from GtRNAdb (http://gtrnadb.ucsc.edu) [Citation37]. The sequences and positions of 22 mitochondrial tRNA genes were downloaded from NCBI (https://www.ncbi.nlm.nih.gov/nuccore/251831106) and named as ‘mito-tRNA-amino acid abbreviations-anticodon’. For example, ‘mito-tRNA-Val-TAC’ indicates mitochondrially encoded tRNA valine (Val) with anticodon ‘TAC’. tRNA modification information was retrieved from MODOMICS database (http://modomics.genesilico.pl/) [Citation38]. MODOMICS manually curated tRNAs with experimentally validated modified nucleosides.
tRF identification and characterization
A bank of non-redundant tRFs of 15 to 30 nts in length was created. ‘CCA’ was added to the 3ʹ end of mature tRNA sequences, resulting in the CCA-tRNA annotation. All sequences with 15 to 30 nts were enumerated from the 5ʹ or 3ʹ end of these CCA-tRNA sequences. Identical sequences were further merged, and 4,894 and 5,260 unique sequences from the 5ʹ and 3ʹ end (5ʹ-tRFs and 3ʹ-tRFs respectively) of CCA-tRNAs were retained. 271,287 unique i-tRFs sequences were extracted from the body of CCA-tRNAs. Additionally, a 50-nt downstream sequence at the 3ʹ end of each non-CCA tRNA was obtained using bedtools, resulting in the pre-tRNA annotation (https://bedtools.readthedocs.io/en/latest/). In the same way as above, all 15 to 30-nt sequences from the 3ʹ end (3ʹ U tRFs) of pre-tRNAs were selected and then identical sequences were collapsed, yielding 9,103 unique sequences. In total, we built a tRF annotation database with 290,457 candidate tRF sequences with unique identifiers.
As shown in Fig. S8, each class of tRFs in our tRF annotation database starts with a unique class identifier (i.e., 3ʹ U-tRFs start with 3ʹU-, 5ʹ-tRFs start with 5ʹ-, 3ʹ-tRFs start with 3ʹ- and i-tRFs start with i-). The tRFs that are derived from more than one tRNA gene are assigned an identifier ‘-M’ next to the class identifier. The tRNA gene identifier is retrieved from GtRNAdb tRNA id (e.g. tRNA-Ala-AGC-3-1) or mitochondrial tRNA id (e.g. mito-tRNA-Val-TAC). The next identifier is the length of tRF sequence, such as ‘L16ʹ means the tRF is 16 nucleotides in length. For i-tRFs, there is one more identifier which indicates position of the first nucleotide on the source tRNA. For example, ‘3ʹ-M-tRNA-Ala-AGC-3-1_L20’ indicates this tRF is 3ʹ-tRF and can be derived from at least two tRNA genes (one of these source tRNAs is ‘tRNA-Ala-AGC-3-1’). If a sequence belongs to two or more types of tRFs, the following priorities for naming this tRF sequence are applied: 5ʹ-tRF > 3ʹ-tRF > 3ʹ U tRFs > i-tRF. For example, ‘GAGAAAGCTCACAAGAACTGC’ is not only derived from 5ʹ end of mature mitochondrial tRNA mito-tRNA-Ser-GCT, but also derived from pre-mature mitochondrial mito-tRNA-His-GTG. According to the above naming priorities, this sequence is termed as ‘5ʹ-M-mito-tRNA-Ser-GCT_L21’. Detailed nomenclature of tRFs can be found in the ‘Help’ web page.
The small RNA sequencing reads were remapped to the human genome (hg19), and sequences of our tRF annotation database using Burrows-Wheeler Transform (BWA) [Citation39], allowing for no mismatch per read. Next, the remapped reads were used to count the number of reads belonging to each of the candidate tRFs (). Other non-tRNA genome locations to which the tRF candidates were potentially mapped were fetched by samtools [Citation40]. These non-tRNA loci are likely a part of tRNA-lookalikes that harbour sequences resembling known tRNAs [Citation41,Citation42]. Finally, the expression of the tRFs was calculated as reads per million (RPM) of total mapped reads, which has been commonly used in miRNA analyses [Citation24,Citation25]. To obtain robust tRFs, we filtered out the tRFs with 90th quantile RPM < 1, and those remaining were considered detectable tRFs for each cancer type. Prior to the downstream analysis, the tRFs expression was transformed using log2, and was normalized by the upper quantile across samples, and then was adjusted for potential batch effects with sequencing plates as covariates using ComBat [Citation43].
tRFs on tRNA secondary structures
tRNA secondary structures were predicted using the tRNA covariance model of tRNAscan-SE 2.0 [Citation44] and visualized using forna [Citation45].
Differential expression analysis
To compare the expression profile patterns of tRFs and mRNAs between tumour and normal samples in TCGA, we utilized cancer types with at least 15 normal samples. Differentially expressed tRFs were defined as those with pvalues < 0.05 (i.e., p-values < 0.05, obtained using the Wilcoxon rank-sum test) and fold change of expression between tumour and normal samples > 2 or < 0.5 (i.e., the absolute value of Log2FoldChange > 1). Qvalue are corrected p-values with Benjamini-Hochberg (BH) method.
Correlation analysis and network display
Pearson correlation was estimated for each pair of significantly differentially expressed tRFs and mRNAs. Two-sided t-test was used for hypothesis test. The correlation coefficients exceeding a threshold (default as |r| > 0.4) were organized as a network using Cytoscape (v3.7.2) [Citation29].
Enrichment analysis
KOBAS 3.0 [Citation46] was used for identification of enriched pathways and diseases, including four pathway databases (KEGG PATHWAY, BioCyc, Reactome, and PANTHER) and two human disease databases (OMIM and KEGG DISEASE). Enriched pathways in KOBAS were detected using a hypergeometric test. Enriched Gene Ontology (GO) terms and KEGG DISEASE categories were evaluated using Fisher’s exact test.
Survival analysis
Kaplan-Meier curves were plotted using the R survival package [Citation47] and the log-rank test was used to evaluate statistical differences in survival between groups. All statistical analyses were performed using R Statistical Software (version 3.6.2) (https://www.r-project.org/).
Validated tRFs
Experimentally validated tRFs with roles in cancer were manually curated from PubMed using keyword searches such as ‘transfer RNA-derived RNA fragments cancer’, ‘tRNA-derived RNA fragments cancer’, ‘transfer RNA-derived RNA fragments tumor’, ‘tRNA-derived RNA fragments tumor’, ‘tRF cancer’, and ‘tRF tumor’.
Authors’ contribution
YL and PL designed the study. XS and DYperformed the data analysis. DY constructed the database. YL, PL and DY wrote the manuscript. LZ collected of experimentally validated tRFs. XP, YL and ML revised the manuscript. All of the authors discussed and commented the study.
Disclosure of potential conflicts of interest
No potential conflicts of interest were disclosed.
Supplemental Material
Download PDF (1.1 MB)Acknowledgments
We thank TCGA for providing access to small RNA sequencing and RNA sequencing dataset. We thank the Bioinformatics Core Facility at Zhejiang University School of Medicine for providing computing capacity, and Anna Williams and anonymous reviewers for reading and commenting on the manuscript.
Supplementary material
Supplemental data for this article can be accessed here.
References
- Cech T, Steitz J. The noncoding RNA revolution-trashing old rules to forge new ones. Cell. 2014;157:77–94.
- Fu H, Feng J, Liu Q, et al. Stress induces tRNA cleavage by angiogenin in mammalian cells. FEBS Lett. 2009;583:437–442.
- Lee YS, Shibata Y, Malhotra A, et al. A novel class of small RNAs: tRNA-derived RNA fragments (tRFs). Genes Dev. 2009;23:2639–2649.
- Telonis AG, Loher P, Magee R, et al. tRNA fragments show intertwining with mRNAs of specific repeat content and have links to disparities. Cancer Res. 2019;79:3034–3049.
- Raina M, Ibba M. tRNAs as regulators of biological processes. Front Genet. 2014;5:171.
- Haussecker D, Huang Y, Lau A, et al. Human tRNA-derived small RNAs in the global regulation of RNA silencing. RNA. 2010;16:673–695.
- Schorn AJ, Gutbrod MJ, LeBlanc C, et al. LTR-retrotransposon control by tRNA-derived small RNAs. Cell. 2017;170:61–71 e11.
- Kim HK, Fuchs G, Wang S, et al. A transfer-RNA-derived small RNA regulates ribosome biogenesis. Nature. 2017;552:57–62.
- Wang Q, Lee I, Ren J, et al. Identification and functional characterization of tRNA-derived RNA fragments (tRFs) in respiratory syncytial virus infection. Mol Ther. 2013;21:368–379.
- Zhou J, Liu S, Chen Y, et al. Identification of two novel functional tRNA-derived fragments induced in response to respiratory syncytial virus infection. J Gen Virol. 2017;98:1600–1610.
- Sobala A, Hutvagner G. Small RNAs derived from the 5ʹ end of tRNA can inhibit protein translation in human cells. RNA Biol. 2013;10:553–563.
- Ivanov P, Emara MM, Villen J, et al. Angiogenin-induced tRNA fragments inhibit translation initiation. Mol Cell. 2011;43:613–623.
- Chen Q, Yan M, Cao Z, et al. Sperm tsRNAs contribute to intergenerational inheritance of an acquired metabolic disorder. Science. 2016;351:397–400.
- Sharma U, Conine CC, Shea JM, et al. Biogenesis and function of tRNA fragments during sperm maturation and fertilization in mammals. Science. 2016;351:391–396.
- Keam SP, Hutvagner G. tRNA-derived fragments (tRFs): emerging new roles for an ancient RNA in the regulation of gene expression. Life (Basel). 2015;5:1638–1651.
- Sun C, Fu Z, Wang S, et al. Roles of tRNA-derived fragments in human cancers. Cancer Lett. 2018;414:16–25.
- Maute RL, Schneider C, Sumazin P, et al. tRNA-derived microRNA modulates proliferation and the DNA damage response and is down-regulated in B cell lymphoma. Proc Natl Acad Sci U S A. 2013;110:1404–1409.
- Honda S, Loher P, Shigematsu M, et al. Sex hormone-dependent tRNA halves enhance cell proliferation in breast and prostate cancers. Proc Natl Acad Sci U S A. 2015;112:E3816–3825.
- Goodarzi H, Liu X, Nguyen HB, et al. Endogenous tRNA-derived fragments suppress breast cancer progression via YBX1 displacement. Cell. 2015;161:790–802.
- Saleembhasha A, Mishra S. Novel molecules lncRNAs, tRFs and circRNAs deciphered from next-generation sequencing/RNA sequencing: computational databases and tools. Brief Funct Genomics. 2018;17:15–25.
- Kumar P, Mudunuri SB, Anaya J, et al. tRFdb: a database for transfer RNA fragments. Nucleic Acids Res. 2015;43:D141–145.
- Pliatsika V, Loher P, Magee R, et al. MINTbase v2.0: a comprehensive database for tRNA-derived fragments that includes nuclear and mitochondrial fragments from all The cancer genome atlas projects. Nucleic Acids Res. 2018;46:D152–D159.
- Zheng LL, Xu W-L, Liu S, et al. tRF2Cancer: a web server to detect tRNA-derived small RNA fragments (tRFs) and their expression in multiple cancers. Nucleic Acids Res. 2016;44:W185–193.
- de Rie D, Abugessaisa I, Alam T, et al. An integrated expression atlas of miRNAs and their promoters in human and mouse. Nat Biotechnol. 2017;35:872–878.
- Yan X, Hu Z, Feng Y, et al. Comprehensive genomic characterization of long non-coding RNAs across human cancers. Cancer Cell. 2015;28:529–540.
- Guzzi N, Cieśla M, Ngoc PCT, et al. Pseudouridylation of tRNA-derived fragments steers translational control in stem cells. Cell. 2018;173:1204-+.
- Anders S, McCarthy DJ, Chen Y, et al. Count-based differential expression analysis of RNA sequencing data using R and bioconductor. Nat Protoc. 2013;8:1765.
- Huarte M, Guttman M, Feldser D, et al. A large intergenic noncoding RNA induced by p53 mediates global gene repression in the p53 response. Cell. 2010;142:409–419.
- Shannon P, Markiel A, Ozier O, et al. Cytoscape: a software environment for integrated models of biomolecular interaction networks. Genome Res. 2003;13:2498–2504.
- Skinner ME, Uzilov AV, Stein LD, et al. JBrowse: a next-generation genome browser. Genome Res. 2009;19:1630–1638.
- Weinstein JN, et al. Cancer Genome Atlas Research Network. Comprehensive molecular characterization of urothelial bladder carcinoma. Nature.315322.
- Lee MS, Lee J, Kim JH, et al. Overexpression of caldesmon is associated with tumor progression in patients with primary non-muscle-invasive bladder cancer. Oncotarget. 2015;6:40370–40384.
- Cozen A, Quartley E, Holmes AD, et al. ARM-seq: alkB-facilitated RNA methylation sequencing reveals a complex landscape of modified tRNA fragments. Nat Methods. 2015;12:879–884.
- Selitsky SR, Sethupathy P. tDRmapper: challenges and solutions to mapping, naming, and quantifying tRNA-derived RNAs from human small RNA-sequencing data. BMC Bioinformatics. 2015;16:354.
- Telonis AG, Loher P, Kirino Y, et al. Consequential considerations when mapping tRNA fragments. Bmc Bioinformatics. 2016;17. DOI:10.1186/S12859-016-0921-0
- Bernstein BE, Stamatoyannopoulos JA, Costello JF, et al. The NIH roadmap epigenomics mapping consortium. Nat Biotechnol. 2010;28:1045–1048.
- Chan PP, Lowe TM. GtRNAdb 2.0: an expanded database of transfer RNA genes identified in complete and draft genomes. Nucleic Acids Res. 2016;44:D184–189.
- Boccaletto P, Machnicka MA, Purta E, et al. MODOMICS: a database of RNA modification pathways. 2017 update. Nucleic Acids Res. 2018;46:D303–D307.
- Li H, Durbin R. Fast and accurate short read alignment with burrows-wheeler transform. Bioinformatics. 2009;25:1754–1760.
- Li H, Handsaker B, Wysoker A, et al. The sequence alignment/map format and SAMtools. Bioinformatics. 2009;25:2078–2079.
- Telonis AG, Loher P, Kirinoand Y, et al. Nuclear and mitochondrial tRNA-lookalikes in the human genome. Front Genet. 2014;5. DOI:10.3389/Fgene.2014.00344
- Telonis AG, Kirino Y, Rigoutsos I. Mitochondrial tRNA-lookalikes in nuclear chromosomes: could they be functional? Rna Biol. 2015;12:375–380.
- Johnson WE, Li C, Rabinovic A. Adjusting batch effects in microarray expression data using empirical Bayes methods. Biostatistics. 2007;8:118–127.
- Lowe TM, Chan P. tRNAscan-SE on-line: integrating search and context for analysis of transfer RNA genes. Nucleic Acids Res. 2016;44:W54–W57.
- Kerpedjiev P, Hammer S, Hofacker I. Forna (force-directed RNA): simple and effective online RNA secondary structure diagrams. Bioinformatics. 2015;31:3377–3379.
- Xie C, Mao X, Huang J, et al. KOBAS 2.0: a web server for annotation and identification of enriched pathways and diseases. Nucleic Acids Res. 2011;39:W316–322.
- Therneau T A package for survival analysis in S. version 2.38. 2015. Reference Source. 2017.