
ABSTRACT
The invasion of mammalian cells by intracellular bacterial pathogens reshuffles their gene expression and functions; however, we lack dynamic insight into the distinct control levels that shape the host response. Here, we have addressed the respective contribution of transcriptional and translational regulations during a time-course of infection of human intestinal epithelial cells by an epidemic strain of Listeria monocytogenes, using transcriptome analysis paralleled with ribosome profiling. Upregulations were dominated by early transcriptional activation of pro-inflammatory genes, whereas translation inhibition appeared as the major driver of downregulations. Instead of a widespread but transient shutoff, translation inhibition affected specifically and durably transcripts encoding components of the translation machinery harbouring a 5ʹ-terminal oligopyrimidine motif. Pre-silencing the most repressed target gene (PABPC1) slowed down the intracellular multiplication of Listeria monocytogenes, suggesting that the infected host cell can benefit from the repression of genes involved in protein synthesis and thereby better control infection.
Introduction
Invasion and proliferation of intracellular bacterial pathogens in human cells trigger drastic changes in cell functions, including their gene expression [Citation1]. For instance, the infection of cells by a variety of bacterial invaders has been described to trigger the activation of pro-inflammatory transcription factors, as well as a transient inhibition of host cap-dependent translation [Citation2]. Meanwhile, the survival and multiplication of intracellular bacteria depends upon their capacity to subvert host cell metabolism, functions and antibacterial defences, part of which can be achieved by perturbing host gene expression [Citation3].
In the past decade, due to the rise of high-resolution transcriptomic approaches, the host transcriptional response to bacterial infections has been extensively explored in a broad range of biological contexts. In contrast, few studies have investigated the perturbation of host translation at an omics scale. Previous reports, however, support the existence of potent regulations affecting host mRNA translation during bacterial infections. For instance, a growing number of studies have finely characterized miRNA-mediated regulation of specific host transcripts and cellular processes [Citation4,Citation5]. Pathogenic bacteria can also target central host translation mechanisms, and thereby tune – positively or negatively – the production of host defence proteins [Citation6]. The best-described example to date is probably that of the intracellular bacterium Legionella pneumophila (Lp), which has been shown to secrete effectors targeting host translation elongation and thereby stimulate cytokine production [Citation7]. In line with this, the translatome of Lp-infected murine macrophages has pioneered the attempts to discriminate between transcriptional and translational inputs in the fine-tuning of the inducible immune response to infection [Citation8]. Barry et al. highlighted that the superinduction of cytokine mRNA transcription enabled infected cells to overcome the general translation elongation blockade imposed by Lp effectors, and thus launch a pro-inflammatory response.
Listeria monocytogenes (Lm) is the foodborne cause of listeriosis, an opportunistic disease of human and cattle that can have severe consequences during pregnancy or in elderly patients. This facultative intracellular bacterium has long been a model for studying all aspects of infection biology, from host–pathogen interactions at the molecular level to in vivo and epidemiology studies [Citation9]. How the combination of (1) the activity of virulence factors and (2) cell-autonomous responses contribute to the re-organization of cell functions has been extensively studied; however, in this model as in others, gene expression has mostly been addressed in terms of transcriptomics, microRNA profiling, activation of pro-inflammatory signalling cascades or chromatin-based regulations [Citation10]. To our knowledge, the effect of Lm infection on translation has neither been quantified by mapping the translatome of infected cells nor by assessing overall changes in protein synthesis rates. As described for other bacterial infections, cap-dependent translation initiation is nonetheless predicted to be transiently impaired during the first hour of infection. Indeed, infection-related stress, and principally membrane pores generated by a secreted perforin, listeriolysin O (LLO), were reported to activate the eIF2α-kinases of the integrated stress response (ISR) pathway and inhibit mTOR signalling, both of which control cap-dependent translation initiation [Citation11–Citation14]. Meanwhile, other Lm effectors can restore mTOR signalling; for instance, the internalization protein InlB, by binding the cellular receptor Met, is a potent agonist of growth factor-signalling cascades, including mTOR [Citation15]. Signalling pathways coordinating overall cellular translation thus receive positive and negative inputs during infection, which are likely to fluctuate over time. On top of these, specific translational regulations may control the expression of defined subsets of genes, downstream of transcriptional regulation. Ultimately, the possible consequences of modulating host translation on Lm infection outcome have not been explored.
In the present study, we aimed at clarifying the respective contribution of transcriptional and translational regulations on the reshaping of host gene expression in a human epithelial cell line, over a 10-h time course of infection with an epidemic isolate of Lm. Using ribosome profiling [Citation16], we mapped with high resolution the host translatome during infection, compared it with transcriptome data, and grouped genes that were under transcriptional and/or translational control according to their regulation profiles with regards to time. Our results revealed a dominant pattern, where the rapid induction of gene expression was mainly driven by transcriptional regulation and affected inflammation-related genes, whereas most repressive events were translational, and affected genes encoding components of the translation machinery. The most repressed gene was PABPC1, encoding the host cytoplasmic poly(A)-binding protein. Interestingly, preventing PABPC1 expression by using siRNA-mediated silencing dampened the replication of Lm, suggesting that limiting the expression of genes involved in the translational machinery could be part of the cellular responses that help cope with the severity of the infection.
Results
Listeria infection does not significantly impair the translation capacity of epithelial cells during the first 10 h of infection
In contrast to what has been shown for other pathogenic bacterial species [Citation2], whether infection by Lm affects the overall translation activity of host cells was unknown. To assess this, we quantified the ability of a human epithelial cell line from a colon adenocarcinoma (LoVo) to incorporate the methionine analogue homopropargylglycine (HPG) into newly synthesized proteins, over a 10-h time course of infection by a strain of Lm from an epidemic isolate, LL195 [Citation17,Citation18] (). Infection conditions with this hypervirulent strain were optimized in order to maximize the proportion of infected and viable cells over the period considered. When using a multiplicity of infection (MOI) of 30, bacterial intracellular growth was exponential until 10 h post-infection (p.i.), and the loss of viability of host cells was minimal (Fig. S1A). More than 40% of cells were infected as soon as 2 h p.i. and then, due to cell-to-cell spread of bacteria, the infection expanded so that more than 90% of cells were infected at 5 h p.i. (Fig. S1B), which can be considered sufficiently homogeneous for analysing translational effects on cell populations. To avoid possible side effects on host translation due to the change of medium composition in nutrients and growth factors, all experiments were performed using ‘conditioned medium’, in which cells had been grown for 1 day before it was pooled and saved. The doubling time of LoVo cells in conditioned medium remained similar to usual culture conditions when the medium is changed 2–3 times a week (34 h), and entry rates when using a conditioned medium with an MOI of 30 were similar to that obtained in a medium that does not contain serum and with an MOI of 20.
Figure 1. Lm infection has a low impact on total translation activity in LoVo epithelial cells. (A) Principle of the metabolic labelling of newly synthesized proteins with homopropargylglycine (HPG) over an infection time course. LoVo cells, infected or not for 2, 5 or 10 h with Lm LL195 constitutively expressing eGFP, were treated with HPG for 1 h prior to recovery. Cell infection was monitored by immunofluorescence staining on coverslips. DAPI staining of cell nuclei is displayed in white, F-actin staining by fluorescently labelled phalloidin is in red, and eGFP-expressing bacteria are in green. After cell lysis, HPG residues that had been incorporated into newly-synthesized proteins were conjugated with sulpho-Cy5-azide by copper-catalysed alkyne-azide cycloaddition. (B) In-gel fluorescence detection of HPG incorporation into newly synthesized proteins. Following cycloaddition, protein samples were separated by SDS-PAGE, and Cy5 fluorescence was recorded (top panel) before the gel was stained with colloidal Coomassie as a loading control (bottom panel). (C) Quantification of HPG incorporation. The integrated density of Cy5 fluorescence was measured for each lane and normalized to the corresponding integrated density of Coomassie staining. NI, non-infected. Data are average and standard deviation from independent experiments; n = 3 for CHX, 2 and 5 h p.i.; n = 2 for 10 h p.i. p-values were calculated by two-tailed t-tests.
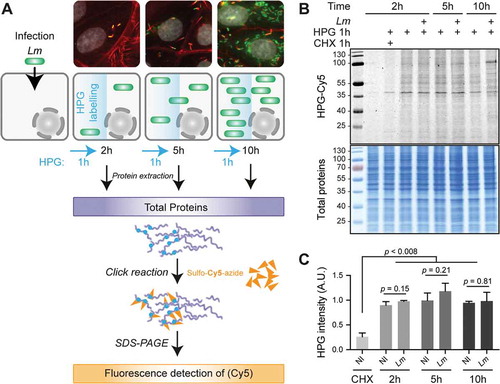
To evaluate the efficiency of protein synthesis, HPG was added to uninfected or infected cell cultures, 1 h prior to each recovery time point; then, the labelling of newly-synthesized proteins was revealed by cycloaddition of HPG residues with sulpho-Cy5-azide, followed by sodium dodecyl sulfate-polyacrylamide gel electrophoresis (SDS-PAGE), in-gel fluorescent detection () and quantification (). Compared to non-infected cells, no major difference was observed in the overall intensity of HPG incorporation in infected cells at 2, 5 or 10 h p.i. compared to non-infected conditions (NI). Whereas total amounts of newly synthesized proteins appeared grossly unchanged, at 10 h p.i., the pattern of labelled proteins started differing, essentially due to the accumulation of an abundant, newly-synthesized protein of ~100 kDa. As expected, treatment of one of the samples with cycloheximide (an inhibitor of translation elongation) concomitantly with HPG addition blocked HPG incorporation, arguing that the detected signals were representative of the cellular activity of protein synthesis.
Lm LL195 thus does not seem to impose a noticeable translational shutoff on its host but tends on the contrary to maintain a level of protein synthesis comparable to that of uninfected cells. Based on this result, we considered that a translatome analysis of the infected cells could be undertaken, without running the risk that normalizing sequencing data to library size would mask overall changes in translation rates.
Early host gene expression response is dominated by transcriptional activation, while repression events are mainly translational
To clarify whether specific host transcripts were the object of translational regulation during infection, we assessed mRNA expression and translation using high throughput Illumina mRNA sequencing (hereafter, RNA-seq) and ribosome profiling (hereafter, Ribo-seq) from biological samples in triplicates that were either non-infected or recovered at 2, 5 or 10 h p.i. As expected from this technique, RNA-seq generally had a higher amount of uniquely mapped reads (24 to 32 million) than the Ribo-seq (Fig. S2A). Almost all Ribo-seq samples had nearly 10 million reads or more, except replicate #2 at the 10-h time-point, which not only had less than three million reads but also had a smaller proportion of reads mapping to coding sequences (CDS). Consequently, this sample was considered of poor quality and subsequently removed from downstream analysis. Sequenced ribosomal footprints (RFPs) displayed the expected length profile, which peaked at 29 nucleotides (Fig. S2B), typical of high-quality Ribo-seq data sets. As expected from Ribo-seq data, RFPs also mapped predominantly to coding sequences (CDSs) and 5ʹ-untranslated regions (UTRs), with little mapping to 3ʹ-UTRs (Fig. S2C). Moreover, mapped RFPs displayed the three-nucleotide codon periodicity characteristic of translating ribosomes (Figs. S2D-E). Infection appeared to have no drastic effect on average translation elongation profiles (Fig. S2D), thus confirming the conclusions drawn from HPG labelling experiments, that overall translation activity was barely perturbed by a 10-h Lm infection in epithelial cells.
Figure 2. Transcriptional up- & translational down-regulations dominate gene expression response to Lm in the first hours of infection. LoVo intestinal epithelial cells were infected for 2 to 10 h. Cell lysates were processed for total cytoplasmic RNA-seq and ribosome profiling (Ribo-seq). (A-C) Scatter plots of changes in normalized RFP (Y-axis) vs RNA (X-axis) levels along the course of infection, when comparing (A) 2 h vs non-infected, (B) 5 vs 2 h or (C) 10 vs 5 h. (D-E) Volcano plots highlighting genes being significantly up- (right) or down- (left) regulated in (D) RNA-seq, (E) Ribo-seq, or (F) translation efficiency (TE) at 5 h p.i. compared to 2 h p.i. Data points coloured in blue, green or red represent genes with padj below 0.05 (above dashed grey horizontal line; -log10padj = 1.3) and an FC below or above 1.5 (vertical dashed grey lines; log2 FC = ± 0.58). Genes for which padj < 0.5 in TE are highlighted in red in D and E. (A-E) Data from three independent replicates (except for RFPs at 10 h). FC, foldchange; padj, adjusted p-value [DESeq false discovery rate (FDR)].
![Figure 2. Transcriptional up- & translational down-regulations dominate gene expression response to Lm in the first hours of infection. LoVo intestinal epithelial cells were infected for 2 to 10 h. Cell lysates were processed for total cytoplasmic RNA-seq and ribosome profiling (Ribo-seq). (A-C) Scatter plots of changes in normalized RFP (Y-axis) vs RNA (X-axis) levels along the course of infection, when comparing (A) 2 h vs non-infected, (B) 5 vs 2 h or (C) 10 vs 5 h. (D-E) Volcano plots highlighting genes being significantly up- (right) or down- (left) regulated in (D) RNA-seq, (E) Ribo-seq, or (F) translation efficiency (TE) at 5 h p.i. compared to 2 h p.i. Data points coloured in blue, green or red represent genes with padj below 0.05 (above dashed grey horizontal line; -log10padj = 1.3) and an FC below or above 1.5 (vertical dashed grey lines; log2 FC = ± 0.58). Genes for which padj < 0.5 in TE are highlighted in red in D and E. (A-E) Data from three independent replicates (except for RFPs at 10 h). FC, foldchange; padj, adjusted p-value [DESeq false discovery rate (FDR)].](/cms/asset/72fb6347-7c71-4dd8-a7db-382182022c08/krnb_a_1777380_f0002_c.jpg)
The number of uniquely mapped reads, then Reads Per Kilobase of transcript, per Million mapped reads (RPKM) values for each gene were computed for each RNA-seq or Ribo-seq sample, and Pearson correlation coefficients of RPKM values were calculated between each pair (Fig. S3). Apart from Ribo-seq replicate #2 at 10 h p.i. that we discarded, maximum correlation coefficients (above 0.97) were observed between all RNA-seq samples, on the one hand, and all Ribo-seq samples, on the other hand. At any given time-point, correlation coefficients between replicates in RNA-seq or Ribo-seq were between 0.98 and 1.
We computed the fold changes in abundance of transcripts between each time-point, either in the RNA-seq or in the Ribo-seq datasets. The Spearman correlation coefficients between log2 fold changes (FC) among differentially regulated genes (DRGs) in the RFP vs RNA values were 0.906, 0.771 and 0.759 at [2 vs 0], [5 vs 2], and [10 vs 5] h p.i., respectively. The corresponding scatterplots are represented as and source data are provided in Table S1.
Comparing the 2-h infected time-point with the non-infected controls, DESeq2 differential expression analysis detected 68 DRGs in the RNA-seq and/or Ribo-seq datasets (adjusted p-value, padj < 0.05) (). Most of these genes clustered next to the diagonal in the upper right quadrant of a Ribo-seq vs RNA-seq scatter plot, highlighting that the dominant feature of gene expression changes during the first 2 h of infection was the transcriptional induction of a subset of host transcripts, which then underwent translation without further translational control. Indeed, out of 29 genes displaying a similar differential regulation at the levels of RNA and RFP, all but one were upregulated, with fold changes ranging from 1.7 to 70. TXNIP, an inhibitor of anti-oxidative pathways, was the only gene to be statistically significantly repressed (FC: −2, padj = 4.2 × 10⁻⁷ for RNAs, and 2.3 × 10⁻³ for RFPs).
Between 2 and 5 h p.i., a total of 621 genes showed differential regulation, in either or both of the datasets (). One hundred and twelve (18%) of these DRGs displayed a similar trend in both the RFP and RNA patterns, indicating that their regulation was driven by changes in their RNA synthesis or decay rates. Three hundred and nineteen transcripts (58% of DRGs) appeared as only significantly regulated in the translatome dataset. The overlap between DRGs that were significantly deregulated (padj < 0.05) and displayed fold-changes above 1.5 in the Ribo-seq versus RNA-seq datasets are displayed as Venn diagrams in Figs. S4A (down-regulated genes) and S4B (up-regulated genes). These intersections reveal a higher overlap between RNA and RFP datasets for up-regulations (59 genes, 28.38% of DRGs) than for down-regulations (14 genes, 7.87% of DRGs).
Between 5 and 10 h p.i., 4,537 genes were further deregulated, among which 1,078 genes (24%) were similarly regulated in both RNA and RFP datasets (). All types of differential regulations (positive or negative, affecting the transcriptome or the translatome) were identified, arguing that over time various regulatory mechanisms cooperate to best adapt the expression of each host gene to changing conditions. Note that, due to the loss of one of the translatome samples at the 10-h time-points, the proportion of transcripts that qualified as significantly regulated for RFPs in this dataset is likely underestimated.
In order to analyse variations in the translation of each transcript independently of transcript abundance, we used Riborex to compute changes in translation efficiency (TE) during the course of Lm infection (, Fig. S5, Table S1). We analysed more extensively changes in TE that occurred between 2 and 5 h p.i. as being the most prominent, and addressed whether they were driven by transcriptional and/or translational regulations. displays the volcano plots of changes in RNA counts, RFP counts or TE values, between 2 and 5 h p.i. The genes for which changes in TE were significant (padj < 0.05, in red) were little affected by variations in the RNA-seq dataset (). In contrast, the majority of DRGs for TE were grouped on the left side of the Ribo-seq volcano plot (), arguing for translational repression. No gene that changed at the RNA level did not also change at the RFP level among the statistically significant genes for TE variation. Regarding RNA-seq data, 121 out of 160 (75.6%) of the significant DRGs with FC > 1.5 were upregulated (, right, Fig. S4B). Out of these, 48.8% were also positively regulated in the RFP data (, right, Fig. S4B), corresponding to the genes that grouped next to the diagonal in the upper right quadrant on , and for which upregulation of protein synthesis correlated with increased transcript abundance without a change in TE. In contrast, only 14 (9.8%) out of the 143 down-regulated genes in the Ribo-seq dataset were also repressed in the RNA-seq dataset (, left, Fig. S4A), indicative of the predominance of repressive events at the translational level over transcriptome level. These repressive translational events are more clearly illustrated by TE data on , where the vast majority of genes that were affected in TE grouped in the left part of the volcano plot.
Altogether, this analysis confirmed that, while the positive regulation of host gene expression in the first 5 h of infection was mainly driven by changes affecting the transcriptome, a subset of genes was affected by translational repression, which was sharply detected between 2 and 5 h p.i.
Transcriptional induction and translational repression affect functionally distinct biological processes
We then sought to investigate whether genes that were subject to similar changes in their gene expression also shared functions that might prove relevant to the infectious process. To this end, we performed over-representation analysis (ORA) of gene ontology (GO) biological processes among DRGs which were either up- or down-regulated in RNA-seq, Ribo-seq or TE at each time-point of the infection, compared to the non-infected condition (, Table S2). The early transcriptional activation highlighted in led to a pronounced induction of genes associated with pro-inflammatory and type I interferon responses to bacterial invasion (, first seven lines). As expected, this transcriptional activation was directly mirrored by an increase in Ribo-seq data, and persisted through to the 5-h time-point, when the activation of genes related to autophagy, apoptosis and ER stress additionally occurred. At 10 h p.i., the up-or down-regulation of other pathways started emerging, including protein catabolic response, chromatin silencing and mitochondrial metabolism.
Figure 3. Early transcriptional regulation of inflammatory response precedes a translational repression of the translational equipment. (A) Over-representation analysis (ORA) of GO Biological Process terms for up- or down-regulated genes in RNA-seq, Ribo-seq or TE over all time-points. For each time-point, DRGs were selected by comparison to the non-infected condition. (B-F) Induction of inflammation and of the integrated stress response by Lm infection of LoVo cells. The variation of RNA (B, D) and RFP (C, E) levels was quantified for selected NF-κB transcriptional target genes related to inflammation (B, C) or genes involved in the integrated stress response (D, E) during infection. Data represent DESeq normalized read counts from three independent experiments and error bars indicate standard deviation. (F) The phosphorylation status of the mTOR substrate S6K1, and of the target of ISR eIF2 kinases eiF2α were assessed by immunoblotting in cells infected for 2, 5 or 10 h by wild-type Lm or by an Lm strain where the hlyA gene encoding LLO had been deleted (∆hlyA). Treatments by tunicamycin and rapamycin were used, respectively, as an inducer of the ISR through endoplasmic reticulum stress, and as a repressor of mTOR activity. (G) Transcripts sharing similar TE profiles over time were clustered by fuzzy clustering. For each cluster, only genes having more than 70% membership are displayed. (H) Functional categories were assigned to each cluster by ORA of GO Biological Process terms.
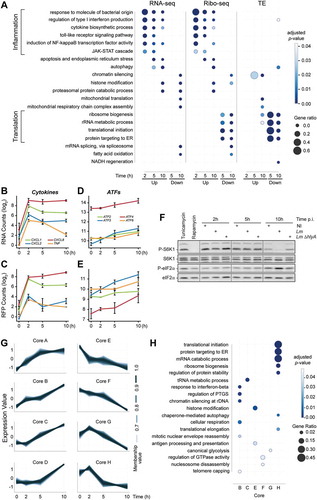
The rapid transcriptional induction of pro-inflammatory cytokine and type I interferon genes in response to Lm infection have been largely documented [Citation19]. The sensing of pathogen-associated molecular patterns (PAMPs) by cell sensors is known to activate the transcription factor role of NF-κB. We analysed the enrichment for transcription factor binding sites (TFBS) in the promoter regions of the genes that were significantly transcriptionally induced at 2 h p.i. (Table S3). Unsurprisingly, binding sites for NF-κB subunits NFKB1/NFKB2/RELA dominated, with normalized enrichment scores (NES) above 9 confirming that the early induction of NF-κB-dependent signalling during Lm infection of epithelial cells drives the inflammatory response. The effects of this early transcriptional activation (followed by a rapid downregulation) on the RNA and RFP profiles of a subset of cytokine genes are illustrated in . At later time-points, the weight of NF-κB-dependent transcription declined and the action of additional transcription actors appeared. Between 5 and 10 h p.i., the most enriched motifs upstream of transcriptionally induced genes were binding sites for the stress-responsive transcriptional factors ATF2, ATF3 and ATF6 (NES above 4, Table S3), highlighting the contribution of the ISR to the host transcription as infection proceeded. In line with this, the expression of these three transcription factors rose over time (). By immunoblotting, we confirmed that eIF2α phosphorylation increased in the latest time-points of infection, suggesting that the ISR eIF2 kinases had been activated (). This activation was not detected when cells were infected with a strain that did not produce LLO, confirming previous reports that the major pore-forming toxin of Lm is a critical determinant of host cell stress responses [Citation13]. Altogether, our data confirm an early transcriptional induction of inflammatory pathways in response to infection, which we find to be followed by the activation of the ISR.
Downregulation of functional pathways only emerged between 2 and 5 h p.i. and was largely dominated by translational repression, noticeable in the comparison of Ribo-seq data, and even more obvious when analysing changes in TE. Strikingly, the majority of the transcripts affected by translational repression encoded proteins involved in translation itself (, lines 14–17). At 10 h post-infection, transcripts encoding translation components were further downregulated translationally, while there was also a modest decrease in the TE of a few genes regulating the type I interferon response, autophagy and NADH regeneration. The decrease in TE of genes involved in NADH regeneration was mostly explained by a decrease in RFPs suggesting repressive translational mechanisms, whereas the apparent decreased TE of genes involved in autophagy and in the regulation of the type I interferon response reflected a higher increase in their transcript abundance than in their RFPs, perhaps suggesting a buffering effect on their translation.
Genes that are translationally co-regulated over time group into functionally related clusters
To investigate the effect of time on host translation during Lm infection, we conducted fuzzy clustering on genes displaying a differential TE in the Riborex analysis, using a cut-off of 0.1 for the adjusted p-value. Eight core clusters were generated, representing the major temporal patterns of TE changes during Lm infection (, Table S4). Four of these cores (A to D) contained 393 genes that showed an overall increase in TE over the 10-h time course, while the remaining four cores (E to H) contained 525 genes that displayed an overall decreased TE. In order to assess the functional relevance of these patterns of TE changes, we conducted an ORA analysis of GO biological processes on each one of the cluster cores. Six of the cores were statistically enriched for specific GO biological processes (, Table S4), which are detailed hereafter.
Transcripts belonging to core B displayed a steady increase in TE throughout the infection and encoded factors involved in distinct biological processes. These include regulation of silencing, either chromatin-based or post-transcriptional, but also genes involved in the host response to pathogens, such as type I interferon response, or cellular respiration. Core C was marked by an increase in TE starting after 2 h p.i., and was enriched for genes involved in non-coding RNA metabolism, and predominantly ‘tRNA metabolic processes’.
Core E, in which transcripts were affected by a steady decrease in TE throughout the infection, was enriched for ‘histone modification’ processes and to a lesser extent, ‘antigen processing and presentation of exogenous antigen’ processes, which mostly represent proteins involved in cargo targeting to vesicles and their processing. In Core F, transcripts were affected by a mild decrease in TE that intensified between 5 and 10 h p.i. It was moderately enriched for processes representing ‘nucleosome disassembly’ and ‘regulation of GTPase activity’. All the genes belonging to the ‘nucleosome disassembly’ process encoded proteins participating in transcriptional regulation via chromatin remodelling. Among them, SMARCA4 had been previously reported to exert a repressive role on E-cadherin transcription [Citation20]. Genes belonging to the ‘regulation of GTPase activity’ process mainly encoded regulators of actin dynamics or vesicle formation and processing. Altogether cores E and F, both of which present a temporal decrease in TE, are broadly enriched for genes involved in chromatin-based regulation, vesicle formation and processing.
Cores G and H were characterized by a slight increase in TE at 2 h p.i. followed by a prominent decrease between 2 and 5 h p.i., which was further amplified until 10 h in core G whereas it plateaued after 5 h in core H. In both of these clusters, changes in TE were largely due to a strong decrease in the abundance of RFPs (rather than to an increase in RNA-seq), suggesting these genes were actually translationally repressed rather than buffered by a lack of translation. Core G was moderately enriched for genes related to the ‘regulation of canonical glycolysis’. In contrast, core H contained essentially genes encoding factors involved in ribosome biogenesis and protein synthesis; indeed, 80% of them encoded ribosomal proteins, translation initiation or elongation factors. A few additional genes were associated with related biological processes, such as ‘mRNA catabolism’, ‘protein stability’, and ‘autophagy’.
When considering the number of co-regulated genes, the enrichment of core H with factors required for host translation was the most striking feature of the fuzzy clustering and ORA analysis. We then asked whether specific features within these functionally related transcripts could determine their co-regulation.
5ʹ-terminal oligopyrimidine motif-containing mRNAs are co-repressed translationally during Listeria infection
The length and sequence of transcript 5ʹ-UTRs are known to play important roles in the regulation of translation initiation [Citation21]. Here, no specific trend linking the length of transcript 5ʹ-UTRs and overall log2 FC in TE over time was observed (Fig. S6) even though we cannot formally exclude their contribution to the observed translational regulations. Several cis-acting motifs located within the 5ʹ-UTRs of mRNAs have previously been described for their ability to modulate eukaryotic translation initiation in response to cellular stresses or infection. Among them, four classes of motifs can have a significant influence on the efficiency of recruitment of the translation pre-initiation complex (PIC) or of initiation at the appropriate AUG, namely: translation initiator of short 5′-UTRs (TISU), 5ʹ-terminal oligopyrimidine motifs (5ʹ-TOP), internal ribosome entry site (IRES) structures or upstream open reading frames (uORF) [Citation22]. To assess whether the presence of these motifs could dictate the co-regulation of the transcripts that were translationally repressed during infection, we tested whether the repressed gene set displayed a statistically significant enrichment for any of these motifs using ROAST. Out of the 1,003 genes that had differential TE across any one condition as calculated by Riborex, 82 were only translationally regulated and had more than twofold change in RFP levels across the 10-hour time-course, while their transcript abundance remained stable. We found that there was a significant enrichment of TOP genes at 10 h p.i. (ROAST padj = 0.021) in this set, whereas none of the other motifs was statistically enriched.
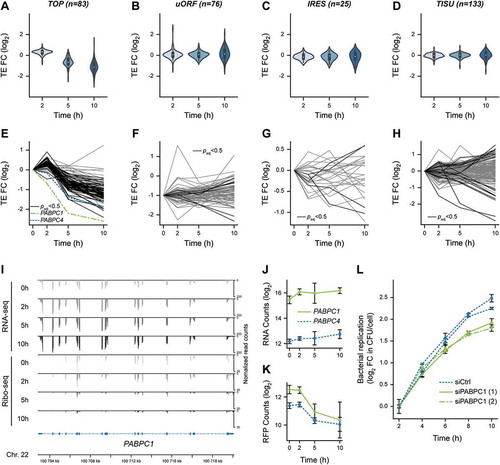
To further illustrate this enrichment, we displayed the distribution of changes in TEs during infection for each list of experimentally validated TOP- (n = 83), uORF- (n = 76) or IRES- (n = 25) containing transcripts or for the 133 transcripts containing a TISU motif with no mismatch (, Table S5). After a modest increase in TE for the bulk of TOP-containing transcripts at 2 h p.i., they consistently displayed a decrease in TE at 5 h p.i., which exacerbated at 10 h p.i. (). In contrast, the distributions of uORF-, IRES- or TISU-containing transcripts remained centred on 0 (). The individual profiles for each one of the transcripts belonging to each category revealed individual variability within the general trends (, Table S5), and emphasised a high similarity in profiles between TOP-containing transcripts () and core cluster H encoding genes involved in host translation (). Altogether, our data indicate that the major common feature of the transcripts encoding translation-related proteins that were translationally repressed during infection was the presence of a TOP motif in their 5ʹ-UTR.
Figure 4. Translational repression of 5ʹ-terminal oligopyrimidine-containing transcripts, including PABPC1, during Lm infection. (A-D) Violin plots representing fold changes in TE over time for transcripts that have been experimentally verified to contain (A) functional TOP, (B) uORF, or (C) IRES motifs, or (D) predicted to contain a TISU in their 5ʹ-UTR regions. (E-H) Translation efficiency profiles of individual transcripts containing either (E) TOP, (F) uORF, (G) IRES or (H) TISU motifs. Transcripts for which the adjusted p-value from Riborex analysis was below 0.5 are displayed in black line (except PABPC1 and PABPC4, in dotted green and blue lines, respectively), while transcripts for which TE changes were not significant are displayed in grey. (I) Profiles of RNA-seq (top) and Ribo-seq (bottom) reads aligned at the PABPC1 locus. Average values of read counts per genomic position from three independent experiments, normalized for library size, are represented for each time-point. (J-K) Quantification of the variation of PABPC1 and PABPC4 RNA (J) and RFP (K) levels during infection. Data represent DESeq normalized counts from three independent experiments and error bars indicate standard deviation. (L) Silencing of PABPC1 reduces Lm intracellular replication rate. LoVo cells were transfected with siRNA against PABPC1 mRNA or a scrambled siRNA (siCtrl) for 48-h before infection. Two independent experiments were carried out using distinct siRNA against PABPC1 (siPABPC1 (1) and (2)). Bacterial entry and replication were assessed by gentamicin protection assay followed by serial dilution plating of infected cell lysates on agar plates. In order to focus on intracellular multiplication rather than differences in the entry, the log2 ratio of colony-forming units (CFU) counts per cell at each time-points relative to time 2 h post-infection were plotted. Values are averages and standard deviation from three infected wells per condition, each counted thrice.
Because TOP-containing transcripts have been previously shown to be translationally repressed in conditions where the activity of the mTOR kinase was impaired [Citation23], we probed for the phosphorylation status of the mTOR substrate S6 kinase 1 α (S6K1) on serine 51 by immunoblotting (). Whereas rapamycin treatment of LoVo cells for 1 h was sufficient to abrogate S6K1 phosphorylation, we only observed a complete dephosphorylation of this substrate after 10 h of Lm infection, arguing that loss of mTOR activity alone could not account for the translational repression of TOP-containing transcripts that we observed as soon as 5 h p.i.
Downstream of mTOR signalling, the main actor of the translational regulation of TOP genes has recently been shown to be LARP1, which would either bind the TOP motif and repress translation when it is unphosphorylated or allow translation when it is phosphorylated [Citation24–Citation26]. To infer whether the impaired translation of TOP genes could be controlled by LARP1 dephosphorylation in infected LoVo cells, we assessed its phosphorylation status by immunoprecipitating LARP1 and then probing with a total anti phosphoserine/threonine antibody (Fig. S7). Whereas LARP1 was efficiently pulled-down, in our hands it did not appear to be phosphorylated in non-infected LoVo cells, suggesting that the translation of TOP genes at 0 h p.i. was independent of LARP1 phosphorylation. We thus assume that another layer of regulation than LARP1 dephosphorylation might be at play for the repression of TOP genes observed in infected LoVo cells.
PABPC1 is translationally repressed during Listeria infection of epithelial cells
Interestingly, the only two TOP-containing transcripts that displayed a decrease in TE as soon as 2 h p.i. were PABPC1 and PABPC4, with PABPC1 being the most heavily repressed of all TOP-containing transcripts (). PABPC1 and PABPC4 encode cytoplasmic poly(A)-binding proteins (PABPs) and are the only two members of this family to be expressed in LoVo cells. Both transcripts underwent a potent translational inhibition during Lm infection, which deepened as the infection proceeded in spite of a slight increase in their transcript abundance over time ( and 4I-K). Because PABPC1 was the most expressed of the two paralogues and displayed the most striking repression, we focussed on the regulation of the expression of this gene during Lm infection. Using fluorescence in-situ hybridization (FISH) against PABPC1 mRNA, we confirmed that its abundance did not decline in infected cells, even though a noticeable heterogeneity between individual cells could be noticed at all time-points (Fig. S8). The cytoplasmic location of PABPC1 transcripts was generally diffuse, and a small proportion of the signal co-localized with the P-body marker DDX6. No remarkable change in the proportion of PABPC1 mRNA localizing to P-bodies was observed throughout the infection time-course, arguing that sequestration of the transcript within these compartments could likely not account for the intensity of the translational repression detected in our analysis.
De-regulation of PABPC1 expression impacts on Listeria intracellular replication
The potent control exerted on PABPC mRNA translation prompted us to scrutinize if cytoplasmic PABPC1 translation or abundance was having an impact on infection progression. Data from a previously published siRNA screen for host factors involved in Lm infection of HeLa cells indicated that silencing of PABPC3 (which is not expressed in LoVo cells), and to a lesser extent PABPC1, reduced intracellular bacterial loads at 5 h p.i [Citation27]. We hypothesized that reducing the synthesis of PABPCs during infection might facilitate the ability of infected cells to control bacterial intracellular multiplication. To test this hypothesis, we transfected LoVo cells with siRNAs against PABPC1 (two distinct siRNAs were used) or with a control scrambled siRNA, 48 h before infecting with Lm, and then monitored the intracellular replication of bacteria in cells (). Intracellular bacteria were recovered by cell lysis and plated on BHI-agar plates at several times post-infection, and then colony-forming units (CFU) counts were normalized to values measured at 2 h p.i. in order to analyse only the intracellular multiplication of bacteria rather than possible variations of entry into cells. In parallel, the efficiency of PABPC1 silencing in transfected cells was assessed by immunoblotting (Fig. S9A). When PABPC1 was silenced in LoVo cells, the intracellular replication rate was significantly (though modestly) reduced, compared to cells transfected with a control siRNA (). These observations suggest that repressing the expression of cytoplasmic PABPs could participate in cellular control of bacterial proliferation.
Discussion
Regulation of gene expression allows organisms to respond to changes in their environment. The intensity and kinetics of the response are strongly influenced by the nature of the regulatory mechanisms involved, affecting various levels on the path from DNA to end-products. In the present study, we aimed at clarifying the respective contribution of transcriptional and translational regulations on the reshaping of host gene expression of a human epithelial cell line, over a 10-h time course of infection with an epidemic isolate of Lm. Metabolic labelling with homopropargylglycine revealed that Lm infection did not drastically impair the overall translation capacity of infected epithelial cells. By comparing translatome with transcriptome data, we then identified genes that were under transcriptional and/or translational control and grouped them according to their regulation profiles with regards to time. Our results revealed a dominant pattern, where the rapid induction of gene expression was mainly driven by transcriptional regulation, whereas most repressive events were translational. Over-representation analysis of gene ontologies also highlighted a frequent co-regulation of genes encoding proteins involved in related biological processes. Typically, whereas inflammation was transcriptionally induced, most genes encoding components of the translation machinery were translationally repressed, likely due to a strong repression of the translation of mRNAs harbouring a 5ʹ-terminal oligopyrimidine (TOP) motif. The most repressed gene was PABPC1, encoding the main host cytoplasmic PABP. Interestingly, further repressing PABPC1 expression using siRNA-mediated silencing dampened the replication of Lm, suggesting that limiting the expression of the translational machinery could be part of the cellular responses that help the cell cope with the severity of the infection.
Contribution of infection-induced stress responses to gene expression regulation
In addition to the expected early activation of NF-κB and its pro-inflammatory effect, a large part of the regulations we observed could be explained by the inhibition of mTOR signalling and the activation of the ISR. Both were previously described in response to Lm infection, and were mainly dependent on the pore-forming activity of LLO [Citation12–Citation14]. Treatment of RPE1 cells by LLO was also shown to trigger a transient phosphorylation of eIF2α – a hallmark of ISR –, as well as a transient arrest in total protein synthesis [Citation11]. However, our results appear to differ significantly from the existing literature in terms of kinetics and intensity. First, no transient arrest in overall protein synthesis occurred during the course of our 10-h infection of LoVo cells (), suggesting that the drastic effects on protein synthesis observed when cells were treated with an elevated dose of LLO (0.5 or 1 μg/ml, i.e. 9 to 18 nM) was not representative of the real exposure of cell membranes to the toxin when it was secreted by invading bacteria. Second, translational and transcriptional effects that could be attributed to the induction of the ISR appeared gradually over time, and became noticeable in transcriptome data only after 10 h of infection, matching an increase of eIF2α phosphorylation at this later time-point (). The translation of ATF4, which is known to be induced upon phosphorylation of eIF2α due to the presence of a series of uORFs in its 5ʹ-UTR, only modestly increased during infection. The transcription and translation of ATF3 increased gradually over time since the beginning of infection, while the induction of ATF6 only occurred between 5 and 10 h p.i. In line with this, the transcriptional targets of ATF3 and 6 were upregulated at 10 h p.i. These observations suggest that in the context of our study, ISR induction by Lm infection is gradual and long-lasting, in agreement with what has been previously shown for the phosphorylation of eIF2α due to activation of the unfolded protein response by Lm [Citation13]. This conclusion contrasts however with other reports that eIF2α phosphorylation was early and transient [Citation12,Citation14]. Part of this discrepancy may have arisen from noticeable differences in our experimental setup compared to that used by Tattoli et al. For instance, we used a lower MOI (30 rather than 100) and lower centrifugation speed and duration (1.5 min at 200 × g rather than 10 min at 2,000 × g) than Tattoli et al. We have also used conditioned medium throughout our experiments to avoid any possible effect on the sensing of amino-acid starvation when replacing media. We hypothesize that our milder conditions of cell culture and infection could be responsible for delaying and lengthening the effects of the ISR activation reported by some of the other groups.
The metabolism and equipment of the LoVo cell line we have used are also of relevance to its response. This colon adenocarcinoma cell line, which is an acknowledged model for the infection of intestinal cells by Lm [Citation28,Citation29], grows relatively slowly (doubling time: 34 h) and displays reduced total translation activity compared with the HeLa cells or mouse embryonic fibroblasts (MEFs) that were used by Tattoli et al.; Pillich et al. used P388D1 mouse monocytes, and did not reproduce their observation in HeLa cells; Shrestha et al. used RAW 264.7 murine macrophages and MEFs. Another important difference between our experimental conditions and that of others was the use of an epidemiological isolate of Lm, the biology of and host response to which have scarcely been addressed to date. The selected strain LL195 (serotype 4b) belongs to the clonal complex 1 (CC1) within lineage I of Lm [Citation18], which is more representative of clinical cases of listeriosis than usual lineage II laboratory strains such as EGD-e (CC9, serotype 1/2a) that was used by Pillich et al., or 10403S(CC7, serotype 1/2a) that was used by Tattoli et al. The haemolytic titre we measured for LL195 was in the same range as that of EGD-e, arguing against a lack of LLO activity in this strain (Fig. S10). However, we cannot exclude that a different repertoire of virulence factors expressed by this strain might impact the host cell response and possibly dampen ISR, compared with other strains. Altogether, we assume that part of our observations is dependent on the biological context and may be relevant to conditions representative of the infection of the intestinal barrier by a clinical isolate of Lm, but obviously not of all possible occurrences of Lm intracellular invasion.
In addition to the gradual induction of ISR, our work highlights a strong translational repression of TOP-containing transcripts starting between 2 and 5 h p.i. The current model for the translational co-regulation of TOP mRNAs involves the direct binding of LARP1, a target of mTOR kinase activity, to TOP motifs [Citation30]. When mTOR is inhibited, LARP1 becomes dephosphorylated and strongly binds TOP motifs, preventing mRNA translation initiation. However, in our hands, we could only detect a consistent drop of mTOR kinase activity at 10 h p.i. (), which fails to explain the translational repression of TOP-containing transcripts observed at 5 h p.i. () unless these transcripts are more sensitive to mTOR inhibition than S6K1 phosphorylation is. The fact that we detected no phosphorylated form of LARP1 in non-infected LoVo cells (Fig. S7) possibly indicates that other signalling pathways than the mTOR-phospho-LARP1 axis might be at play in the regulation of translation initiation of TOP-containing transcripts in our experimental context. It was also recently found that during exposure to sodium arsenite – a potent stress inducer that results in mTOR inhibition –, LARP1 was responsible for the recruitment of a fraction (10–15%) of TOP mRNAs to stress granules and P-bodies [Citation31]. Whereas we observed that a small proportion of the TOP-containing mRNA PABPC1 was associated with P-bodies (Fig. S8), in our experimental conditions, this proportion did not vary throughout the infection time-course, arguing against the docking of PABPC1 to P-bodies being required for its translational repression. In the future, identifying and characterizing the molecular actors of the regulation of TOP-containing mRNAs in our experimental system could provide insights into the translational control of this class of transcripts in cells that are not metabolically hyperactive.
Dynamics of gene expression response to Listeria infection
An important parameter addressed by our study is the timing of the host response to infection, and how different layers of gene expression control contribute to this timing. By studying a time-course of infection rather than a unique time-point as had been done in most studies to date, and by quantifying not only the transcriptome but also the translatome, we reveal that in the first hours of infection most activation events are transcriptional, whereas most repression events are translational (). This rather binary effect is easily understandable by taking mRNA steady-state levels and turnover into account. Before infection, virtually no cytokine-encoding mRNA is present in cells; therefore, their induction necessarily requires first transcription, and then translation. In contrast, mRNAs encoding components of the translation machinery are highly abundant. In addition, the intrinsic stability of human mRNAs is relatively high compared with the kinetics of an infection. Estimates of the median half-lives of mRNAs in mammalian cells are in the range of hours; among these, the half-lives of transcripts from housekeeping genes, especially those encoding translation factors and ribosomal proteins, are among the longest and often above 10 h [Citation32,Citation33]. As a consequence, downregulating the quantity of these transcripts by merely tuning down their transcription would take days. The most effective ways for a cell to rapidly stop the synthesis of proteins from this pathway would thus be either to massively degrade transcripts or to inhibit their translation. The second process – which we found to be prevalent between 2 and 5 h p.i. – is reversible; this might constitute an advantage during recovery from stress by allowing a rapid resumption of the translation of the previously repressed genes. In the longer term, other types of regulation may take place; for instance, the downregulation of cytokine gene expression after 2 h p.i. likely relies both on the reduction of their transcription, and on the generally short half-life for this class of transcripts [Citation33]. In addition to these broad rules drawn from the dominating patterns we observed, a number of individual transcripts are likely finely tuned by a combination of actions on transcription, decay and translation.
One level of regulation that was not addressed in our work was protein stability, which also should consistently contribute to the timing and effectiveness of the regulations we observed. Drastic alterations in the cell proteome and protein turnover in response to Lm infection or to treatment with LLO have previously been described [Citation34,Citation35], and it would be interesting to integrate host proteomic data over an infection time course to assess how translation and proteome degradation contribute to reshaping the cell equipment. Within the time-course of our experiment, which was restricted to 10 h due to loss of viability afterwards, we have verified by immunoblot that the total amounts of PABPC1 were not affected (Fig. S9B), probably due to the long half-lives of most core translation components [Citation32,Citation36]. In case the reduction of the amount of these proteins is playing a role by controlling the overall translation capacity of cells, it must thus be considered in a longer course of infection. In agreement with this, we did not monitor any consistent reduction in total protein synthesis activity within the 10 h we examined ().
The translational repression of TOP-containing transcripts that we have observed is thus unlikely to impact the host cell proteome in a proportion that might affect infection during the first 10 h. An alternative hypothesis would be that a reduction of the translation of TOP-containing mRNAs impacts infection outcome, rather than the reduction of the amounts of its products and of their functions. One could, for instance, imagine that, by pausing their anabolic metabolism and saving on the synthesis of abundant translation components, cells facing a bacterial challenge could reallocate part of their resources to antibacterial defences. Testing these hypotheses will deserve future investigations.
Effects of the repression of PABPC1 expression on bacterial or viral infections
Among the TOP-containing transcripts, PABPC1 was the one most translationally repressed (). The fact that pre-silencing its expression before infection reduced the intracellular multiplication rate of Lm suggests that the host cell can benefit from dampening its expression (). As discussed above for the bulk of TOP genes, this could either be due to a saving of resources by the host cell when avoiding the synthesis of a very abundant protein or to a possible contribution of PABPC1 protein in the host-bacterial dialogue. Given the known function of PABPC1 as a regulator of mRNA translation and stability, its silencing is expected to have widespread effects on the host transcriptome and translatome, which could account for the decreased bacterial replication we observed when PABPC1 was knocked-down, apart from savings on host resources. This could include general effects due to the repression of overall translation, thereby impeding de novo protein synthesis and response to environmental cues [Citation37]. The absence of PABPC1 could also impact gene-specific regulations, as has been previously shown for developmental genes [Citation38–Citation40] or genes containing A-rich motifs in their 5ʹ-UTRs [Citation41]. To the best of our knowledge, a specific regulatory function for PABPs in the response to a bacterial infection has not been addressed so far. And yet, a few pieces of evidence indicate that PABPs could contribute to the regulation of inflammation and innate immune responses. For instance, PABPC1 was among the top five differentially expressed genes among patients with septic shock [Citation42]. Blocking the ability of PABPs to bind poly(A) tails has been shown to reduce the sensitization of mice to pain by dampening de novo protein synthesis and neurogenic inflammation in response to pro-inflammatory signals [Citation37]. Direct interaction of Tristetraprolin/Zfp36 with PABPC1 was also found to mediate the translational repression of cytokine genes in PAMP-activated bone-marrow-derived macrophages [Citation43]. In response to viral infections, the product of an interferon-stimulated gene, RyDEN, was shown to restrict the replication of a variety of viruses by forming an inhibitory complex with PABPC1 and LARP1 [Citation44]. Both PABPC1 and LARP1 were positive regulators of Dengue virus (DENV) replication, reminiscent of our present findings for Lm intracellular multiplication. RyDEN was then hypothesized to interfere with DENV translation, which could not hold true in the case of a bacterial pathogen. A possible explanation to both phenotypes seen for Lm and DENV infections, and that would need testing, might be that PABPC1 inhibition would favour the expression of innate immune effectors that might help counteract infections.
Conclusions
In response to Lm infection, the downregulation of host translation in LoVo epithelial cells affected a specific subset of transcripts, 5ʹ-TOP-containing mRNAs, which encode components of the cell translation equipment. Among these, PABPC1 was the most repressed, and its down-regulation restricted intracellular replication. It appears reasonable to speculate that the coordinated translational repression of 5ʹ-TOP-containing mRNAs would represent a host response to infection, rather than a bacterial strategy to subvert cell functions. The response to Lm infection thus contrasts with the translational repression observed during Lp infection [Citation8], which consistently affected the whole translatome of infected cells, and depended on the inhibitory function of at least four secreted Lp effectors on host translation elongation [Citation7]. Whether effectors that interfere with host translation are also produced by Lm remains an open question.
Material and methods
Bacterial strains and culture conditions
The bacterial source strains used for this work were Escherichia coli NEB5α (New England BioLabs) for plasmid constructions and Listeria monocytogenes LL195 [Citation17] for all of the experiments involving Lm. All strains were grown at 37°C under shaking at 190 rpm in Luria Bertani (LB) medium for E. coli, in brain heart infusion (BHI) for Lm. Whenever required, media were supplemented with antibiotics for plasmid selection (chloramphenicol, 35 μg/ml for E. coli; 7 μg/ml for Lm).
For allelic replacement at the hlyA locus, the pMAD-∆hlyA plasmid was created by amplifying two partially overlapping fragments by PCR: 1,000 base pairs (bp) upstream (plcA gene) and downstream (mpl gene) of the hlyA open reading frame in the LL195 genome were amplified, respectively, with oligonucleotides oAL647-50 and oAL648-9 (Table S6). These fragments were inserted into the pMAD vector between the SalI and BglII restriction sites by Gibson Assembly, using the NEBuilder HiFi DNA Assembly Cloning Kit (New England BioLabs). Allelic replacement of the hlyA open reading frame by these constructs, in the genome of L. monocytogenes strain LL195, was obtained as previously described [Citation45,Citation46].
Culture, infection and transfection of epithelial cells
Infections were performed in LoVo cells, an intestinal epithelial cell line originating from a colon adenocarcinoma (ATCC CCL-229). Cells were maintained in Ham’s F-12 K (Kaighn’s) Medium (Thermo Fisher Scientific Cat# 21127030), supplemented with 10% heat-inactivated foetal bovine serum (PAN-Biotech) at 37°C and 5% CO2. Cells were passage 14 before seeding and were grown to 70–85% confluence prior to infection. The cell culture medium was changed every 24-h and kept for further use during the infection as ‘conditioned medium’. When needed, cells were transfected 48 h before infection with siRNAs against PABPC1 (Table S6) [Citation47,Citation48] or scrambled siRNAs using RNAiMAX in 24-well format as per manufacturer’s recommendations. Knockdown of targeted protein was confirmed by western blot. Control activation of the ISR pathway and inhibition of the mTOR pathway were obtained, respectively, by treating cells with 10 μg/ml of tunicamycin for 2 h or 20 nM of rapamycin for 1 h.
One colony of Lm was grown until they reached stationary phase (OD600 of 2 to 3) in BHI media at 37°C. Bacteria were washed with PBS and added to a cell monolayer in culture flasks (for Hi-seq, HPG incorporation or immunoprecipitation experiments) or in 24-well plate format (for gentamicin protection assay experiments) at an MOI of 30 to 40. The cell culture flasks or plates were centrifuged at 200 × g for 1.5 min and then incubated at 37°C and 5% CO2 for 30 min. Cells were then washed with PBS containing 40 μg/ml gentamicin and conditioned medium containing 25 μg/ml gentamicin was added. Infection was allowed to proceed until specific time-points after which culture plates were snap-frozen in liquid nitrogen and stored at −80°C (for Hi-seq, HPG incorporation or immunoprecipitation experiments) or cells were washed in PBS and trypsinized for counting.
For gentamicin protection assays, cells were counted using a LUNA II automated cell counter and then centrifuged at 700 × g for 5 min. The cell pellet was re-suspended in water, incubated for 5 min, and then titrated through a 25 G needle. The cell lysate was diluted in PBS and plated on BHI agar before overnight incubation at 37°C. Colony-forming units (CFU) were counted and normalized to cell counts.
Global translation using HPG incorporation and fluorescent labelling by copper catalysed cycloaddition
L-Homopropargylglycine incorporation experiments were inspired from previous work exploring protein synthesis during HSV infection [Citation49]. LoVo cells were grown to 70–85% confluence in 75 cm2 flasks and infected with Lm as described above. L-Homopropargylglycine (HPG, Jena Biosciences #CLK-016) was added at 2 mM final concentration 1 h prior to each experiment end-point. Cells were snap-frozen in liquid nitrogen and stored at −80°C. For copper-catalysed alkyne-azide cycloaddition (click reaction), cells were lysed with click reaction compatible lysis buffer (100 mM HEPES, 150 mM NaCl, 1% Igepal CA-630) after which a click reaction was performed with Sulpho-Cy5-Azide (Jena Bioscience) at the following concentrations: 1 μg/μL protein, 100 μM azide sulpho Cy5 or azide-biotin, 1 mM Cu(II) sulphate, 5 mM Tris(3-hydroxypropyltriazolylmethyl)amine (THPTA), and 1 mM sodium ascorbate. Cu(II) sulphate was mixed with the THPTA prior to addition to the click reaction. Components were always added in the following order: azide-conjugate, Cu(II) sulphate-THPTA complex, and sodium ascorbate. The click reaction was allowed to proceed for 1 h at room temperature. Samples were then methanol/chloroform precipitated and resuspended in Laemmli sample buffer (SB 1X). Samples were denatured at 95°C for 5 min and separated on a 12% SDS-PAGE gel. The gel was scanned with a Typhoon FLA 7000 biomolecular imager after which it was stained with colloidal Coomassie Brilliant blue G-250 as previously described [Citation50]. Cycloheximide treated or no-treatment cells were used as negative controls.
Importantly, the cells were not starved of methionine prior to addition of HPG so that amino-acid metabolism pathways remained unperturbed.
Immunofluorescence and FISH on infected cells
LoVo cells were seeded in 24-well plates containing 12 mm diameter coverslips. Infection with bacteria expressing eGFP was performed as described above. At specified time-points, cells were fixed for 15 min with 4% paraformaldehyde in PBS, washed with PBS then stored at 4°C until further processing. Prior to staining, cells were permeabilized for 5 min at room temperature with 0.5% Triton X-100 in PBS. Cells were then blocked for 30 min in PBS buffer containing 2% bovine serum albumin (BSA, Sigma) and incubated with Acti-Stain 670 fluorescent phalloidin (Cytoskeleton #PHDG1, 70 nM) and 4ʹ,6-diamidino-2-phenylindole (DAPI, 100 ng/ml) for 1 h. After three additional washes, cover glasses were mounted on microscope slides with Fluoromount mounting medium (Interchim). For PABPC1 FISH, a set of 48 Stellaris RNA FISH probes (Quasar® 670 dye) against PABPC1 were designed using the Stellaris Probe Designer. PABPC1 mRNA FISH and immunofluorescent co-staining was done according to the Stellaris RNA FISH protocol. Antibodies and counter-staining were performed with DDX6 rabbit polyclonal primary antibody (Bethyl Laboratories #A300-460A), Cy3-goat-anti-rabbit secondary antibody (Jackson ImmunoResearch #111-165-144) both at a 1:500 dilution, and DAPI (100 ng/ml).
Preparations were observed with a Nikon Ti epifluorescence microscope (Nikon), connected to a digital CMOS camera (Orca Flash 4.0, Hamamatsu). Illumination was achieved using a SOLA-SE 365 source (Lumencor) and the following excitation/emission/dichroic filter sets (Semrock): DAPI, 377(50)/447(60)/FF409-Di03; Acti-Stain 670 or eGFP, 472(30)/520(35)/FF495-Di03. Images were acquired with Nikon apochromat 60X objective lenses (NA 1.4) and processed with the MicroManager and Fiji software. Each image is representative of the infected cell population.
Immunoblotting
Total cell lysate was prepared by adding SB 1X supplemented with Pierce™ Universal Nuclease (Thermo Scientific™), phosphatase inhibitor cocktail and protease inhibitor cocktail directly to the cell monolayer. The monolayer was scrapped and the lysate was transferred to an Eppendorf tube after which samples were heated 95°C for 5 min and either stored at −80°C or used directly. Samples were migrated on an SDS-PAGE gel (12% acrylamide) and transferred to Amersham Hybond P 0.2 PVDF membranes using a Pierce G2 Fast Blotter (Thermo Scientific). Membranes were blocked in 5% w/v milk or BSA, TBS, 0.1% Tween® 20 according to antibody manufacturer’s recommendations. Rabbit polyclonal antibodies (PABPC1, Atlas Antibodies #HPA045423; p70 S6 kinase α (H-160), Santa Cruz #sc-9027; LARP1, Bethyl Laboratories #A302-088A), rabbit monoclonal antibodies from Cell Signalling Technology (phospho-p70 S6 kinase (Thr389) clone 108D2 #9234; phospho-eIF2α (Ser51) clone D9G8 #3398) or mouse monoclonal antibodies (eIF2α clone D-3, Santa Cruz #sc-133132, β-Actin clone E4D9Z, Cell Signalling Technology #58169; Phosphoserine/threonine clone 22A, BD Transduction Laboratories #612548) were added to the blocking solution at dilutions ranging from 1:500 to 1:5,000 according to the manufacturer’s datasheets, and incubated overnight at 4°C. Membranes were incubated with the corresponding secondary antibody (Bethyl Mouse or Rabbit IgG heavy and light chain antibodies coupled to HRP, #A120-101P and A90-116P) at a 1:50,000 dilution in the same buffer for 2 h at room temperature. Signal was revealed using Pierce® ECL Western Blotting Substrate on an ImageQuant™ LAS 4000 mini.
Immunoprecipitation of LARP1
LoVo cells were grown to 80% confluence in 75 cm2 flasks and either left uninfected or infected with Lm LL195 wild-type or ∆hlyA for 5 h as described above, or treated for 3 h with 100 nM of rapamycin [Citation26]. Flasks were PBS-washed, snap-frozen in liquid nitrogen and then stored at −80°C until further use. Total cell lysate was prepared by adding 150 μl of lysis buffer (40 mM HEPES pH 7.4, 120 mM NaCl, 1 mM EDTA, 1% Igepal CA-630) supplemented with 1X phosphatase inhibitor cocktail and protease inhibitor cocktail was added to each flask, and two flasks per condition were pooled. The obtained 300 μl of lysate was incubated 30 min on ice, disrupted by 10 passages through a 25 G syringe needle, and clarified by centrifugation for 10 min at 12,000 × g, 4°C. Twenty microlitres of each sample was kept as ‘input’, to which an equal volume of SB 2X was added. Two micrograms of either LARP1 antibody or control rabbit IgG were added to each sample, before overnight incubation at 4°C on a rotating wheel (10 rpm). Forty-two micrograms of Dynabeads-Protein G (ThermoFisher Scientific), pre-washed overnight in 10 volumes of IP buffer (40 mM HEPES pH 7.4, 120 mM NaCl, 1 mM EDTA, 1% Igepal CA-630), was added to each sample followed by incubation for 3 h at 4°C, 10 rpm. The flow-through fractions were discarded and beads were washed 3 times for 2 min in 1 ml of IP buffer. Beads were finally resuspended in 25 μl of SB 1X, denatured, separated on SDS-PAGE and probed by colloidal Coomassie staining and immunoblotting as described above.
Haemolysis assay
Haemolysis titres of Lm LL195 and EGD-e strains were assessed as previously described [Citation51].
RNA-seq and Ribo-seq sample preparation
LoVo cells were grown to 70–85% confluence in 75 cm2 flasks and infected with Lm LL195 as described above. Flasks were snap-frozen in liquid nitrogen before infection (0 h) and at 2, 5, and 10 h p.i., and then stored at −80°C until further use. Ribosome footprinting was done as per the protocol of Ingolia et al. [Citation52] Briefly, lysis buffer (20 mM Tris pH 7.4, 150 mM NaCl, 5 mM MgCl2, 1% Triton X-100, 1 mM DTT, 25 U/ml TurboDNase) was added to the frozen monolayer, which was then scrapped and transferred to an Eppendorf tube and processed. A portion of the lysate was taken, and acid phenol was used to extract total mRNA, which was stored at −80°C. Ribosome footprinting was performed on the same biological sample by adding RNaseI to the lysate at 2.5 U/μl for 45 min at room temperature. The digestion was stopped by adding SUPERase•In (0.66 U/μl) and ribosomes were purified by ultracentrifugation on a 1 M sucrose cushion. Ribosome protected fragments were extracted using acid phenol and used in sequencing library construction. Each time course was reproduced twice at a 1-week interval, thus producing biological triplicates.
RNA-seq library construction
The IBENS Genomics Facility conducted the RNA-seq library construction. The integrity of isolated total cytoplasmic RNA was verified using the RNA Pico method on the Agilent 2100 Bioanalyzer. High-quality RNA (RIN > 8) was used in library preparation with the Illumina TruSeq stranded protocol (Illumina, San Diego, USA). Libraries were rRNA depleted using the Illumina Ribo Zero kit and sequenced as single read 75 base pair read length (SR75) on the NextSeq 550 system by the IBENS Genomics Facility.
Ribo-seq library construction
Library construction was done using a protocol adapted from Huppertz et al. [Citation53] Briefly, RFPs were gel purified on polyacrylamide TBS-urea gels. The RFPs’ ends were then de-phosphorylated using T4 PNK and the 3ʹ-clip primer adaptor was ligated using T4 RNA ligase 2, truncated (New England Biolabs, #M0242). The ligated RFPs were gel purified and the RFPs were converted to cDNA using primers that contained barcodes and randomized nucleotides in order to remove PCR duplicates. The cDNA was then circularized using CircLigaseII (Lucigen, #CL4111 K) and then linearized using BamHI. rRNA purification was performed as previously described [Citation52], with two modifications: (1) extra rRNA oligos were added to the biotinylated oligonucleotide cocktail, and (2) a second bead purification step was added. Purified RFP cDNA was amplified using Solexa primers and the libraries were sequenced as single read 75 base pair read length (SR75) on the NextSeq 550 system by the IBENS Genomics Facility.
The complete list of oligonucleotides used for library constructions is supplied in Table S6.
Read processing
RNA-seq reads that passed the Illumina Quality Filter (IQF) were aligned to rRNA (pre-rRNA 45 S + rRNA 5 S sequences from NCBI Nucleotide Database) using Bowtie2 (v2.3.2, option ‘-L 23ʹ). Reads that were not mapped to rRNA were retained and aligned to the human genome (GRCh38) using the Spliced Transcripts Alignment to a Reference (STAR) software (v2.5.3a) [Citation54]. Uniquely mapped reads were counted using featureCounts (v1.5.0) [Citation55].
For Ribo-seq reads, barcoded files were generated for each multiplexed fastq file. Reads that passed the IQF were then processed to remove PCR duplicates, which were identified by five random bases flanking the sample-specific barcodes. Reads that matched at these five random positions were classified as PCR duplicates and only the first hit was kept for further processing. Reads were trimmed (removing the 5ʹ-index and 3ʹ-adaptor) using cutadapt (v1.10) with option ‘-m/–minimum-length 25’ to discard reads shorter than 25 nucleotides after adapter trimming. Trimmed reads were aligned to rRNA sequences as described above. The remaining reads were aligned to the human genome (GRCh38) using STAR (option ‘–sjdbOverhang 40ʹ). Uniquely mapped reads were counted using featureCounts (v1.5.0).
All Hi-seq data discussed in this publication have been deposited in the European Nucleotide Archive [Citation56] and are accessible under accession number PRJEB26593 (https://www.ebi.ac.uk/ena/data/view/PRJEB26593).
Data analysis and visualization
Library size normalized read alignments were visualized using the Integrative Genomics Viewer (IGV) from bedGraph files generated using samtools and bedtools. Post-mapping quality control and analysis of the distribution of reads by category of annotated genomic features were performed using ALFA [Citation57]. Differential expression (RNA-seq) and differential translation (Ribo-seq) data were analysed using DESeq2 [Citation58]. Translational efficiency was calculated and differential TE was analysed using Riborex with a DESeq2 engine [Citation59]. Functional enrichment analysis was conducted using over-representation analysis of GO biological processes with the clusterProfiler R package [Citation60] on genes that had a false discovery p-value < 0.05 in the DESeq2 or Riborex analysis. Normalized Enrichment Score (NES) for TFBSs in the 500 bp region located upstream of the transcription start sites of RNA-seq DRGs were computed using RcisTarget [Citation61], which is R implementation of iRegulon [Citation62]. Fuzzy clustering of TE values was performed using the Mfuzz package [Citation63]. For the fuzzy clustering, TE values were recalculated by dividing TMM normalized (edgeR package) Ribo-seq counts by RNA-seq counts [Citation64,Citation65]. Only those genes that had an FDR p-value < 0.05 as computed by Riborex at any time-point were included in order to decrease noise during clustering. ROAST (Rotation gene set tests for complex microarray experiments) [Citation66] was used for gene set testing of TOP-, uORF-, IRES-, or TISU-containing transcripts. The list of transcripts containing TOP motifs [Citation67], uORFs [Citation68]or IRES [Citation69] had been experimentally verified. In contrast, the list of transcripts containing a TISU motif with no mismatch was computed [Citation70]. For correlative analysis between TE and 5ʹ-UTR length, 5ʹ-UTR sequences for protein-coding transcripts were extracted from Ensembl using BioMart and limited to those with MANE (matched annotation from NCBI and EMBL-EBI) Select annotation. Python 3.7 was used to parse the sequences into a data frame.
Author contributions
AL designed the project. VB and AL devised experiments and interpreted results. VB performed experiments with the help of SR for Lm genetics and FISH. FH, BN and VB analysed High-Seq data under supervision by AG and AL. AL and VB wrote the manuscript.
Supplemental Material
Download Zip (12.2 MB)Acknowledgments
We warmly thank Zhen Wang for sharing with us her optimized Ribo-seq protocol, and invaluable advice about how to best handle this technique. We are grateful to Caroline Peron-Cane, Chloé Connan, Morgane Corre and José-Carlos Fernandez for their precious experimental assistance and eagerness to help solve technical issues, as well as Morgane Thomas-Chollier for helpful discussion regarding data analysis. Last, we thank the IBENS genomics platform for their careful sequencing of all samples, patient assistance and dedication, as well as the Computational Biology Centre for maintaining access to the servers, and Imaging facility for maintaining access to microscopy equipment.
Disclosure statement
The authors declare no competing financial interests.
Supplementary material
Supplemental data for this article can be accessed here.
Correction Statement
This article has been republished with minor changes. These changes do not impact the academic content of the article.
Additional information
Funding
References
- Cornejo E, Schlaermann P, Mukherjee S. How to rewire the host cell: A home improvement guide for intracellular bacteria. J Cell Biol. 2017;216(12):3931–3948.
- Lemaitre B, Girardin SE. Translation inhibition and metabolic stress pathways in the host response to bacterial pathogens. Nat Rev Microbiol. 2013;11(6):365–369.
- Niller HH, Minarovits J. Patho-epigenetics of Infectious Diseases Caused by Intracellular Bacteria. Adv Exp Med Biol. 2016;879:107–130.
- Duval M, Cossart P, Lebreton A. Mammalian microRNAs and long noncoding RNAs in the host-bacterial pathogen crosstalk. Semin Cell Dev Biol. 2017;65:11–19.
- Aguilar C, Mano M, Eulalio A. MicroRNAs at the Host-Bacteria Interface: host Defense or Bacterial Offense. Trends Microbiol. 2019;27(3):206–218.
- Mohr I, Sonenberg N. Host translation at the nexus of infection and immunity. Cell Host Microbe. 2012;12(4):470–483.
- Fontana MF, Banga S, Barry KC, et al. Secreted bacterial effectors that inhibit host protein synthesis are critical for induction of the innate immune response to virulent Legionella pneumophila. PLoS Pathog. 2011;7(2):e1001289.
- Barry KC, Ingolia NT, Vance RE. Global analysis of gene expression reveals mRNA superinduction is required for the inducible immune response to a bacterial pathogen. Elife. 2017;6:e1004229.
- Radoshevich L, Cossart P. Listeria monocytogenes: towards a complete picture of its physiology and pathogenesis. Nat Rev Microbiol. 2017;16(1):32–46.
- Pillich H, Chakraborty T, Mraheil MA. Cell-autonomous responses in Listeria monocytogenes infection. Future Microbiol. 2015;10:583–597.
- Gonzalez MR, Bischofberger M, Frêche B, et al. van der Goot FG. Pore-forming toxins induce multiple cellular responses promoting survival. Cell Microbiol. 2011;13(7):1026–1043.
- Shrestha N, Bahnan W, Wiley DJ, et al. Eukaryotic initiation factor 2 (eIF2) signaling regulates proinflammatory cytokine expression and bacterial invasion. J Biol Chem. 2012;287(34):28738–28744.
- Pillich H, Loose M, Zimmer K-P CT. Activation of the unfolded protein response by Listeria monocytogenes. Cell Microbiol. 2012;14(6):949–964.
- Tattoli I, Sorbara MT, Yang C, et al. Listeria phospholipases subvert host autophagic defenses by stalling pre-autophagosomal structures. Embo J. 2013;32(23):3066–3078.
- Bhalla M, Law D, Dowd GC, et al. Host serine/threonine kinases mTOR and protein kinase C-α promote InlB-mediated entry of Listeria monocytogenes. Infect Immun. 2017;85(7):e00087–17.
- Ingolia NT, Hussmann JA, Weissman JS. Ribosome Profiling: global Views of Translation. Cold Spring Harb Perspect Biol. 2019:11;a032698.
- Weinmaier T, Riesing M, Rattei T, et al. Complete genome sequence of Listeria monocytogenes LL195, a serotype 4b strain from the 1983-1987 listeriosis epidemic in Switzerland. Genome Announc. 2013;1(1):e00152–12–e00152–12.
- Maury MM, Tsai Y-H, Charlier C, et al. Uncovering Listeria monocytogenes hypervirulence by harnessing its biodiversity. Nat Genet. 2016;48(3):308–313..
- Stavru F, Archambaud C, Cossart P. Cell biology and immunology of Listeria monocytogenes infections: novel insights. Immunol Rev. 2011;240(1):160–184.
- Sánchez-Tilló E, Lázaro A, Torrent R, et al. ZEB1 represses E-cadherin and induces an EMT by recruiting the SWI/SNF chromatin-remodeling protein BRG1. Oncogene. 2010;29(24):3490–3500.
- Andreev DE, Dmitriev SE, Loughran G, et al. Translation control of mRNAs encoding mammalian translation initiation factors. Gene. 2018;651:174–182.
- Hinnebusch AG, Ivanov IP, Sonenberg N. Translational control by 5ʹ-untranslated regions of eukaryotic mRNAs. Science. 2016;352(6292):1413–1416.
- Thoreen CC, Chantranupong L, Keys HR, et al. A unifying model for mTORC1-mediated regulation of mRNA translation. Nature. 2012;485:109–113.
- Hong S, Freeberg MA, Han T, et al. LARP1 functions as a molecular switch for mTORC1-mediated translation of an essential class of mRNAs. Elife. 2017;6:2173.
- Philippe L, Vasseur -J-J, Debart F, et al. La-related protein 1 (LARP1) repression of TOP mRNA translation is mediated through its cap-binding domain and controlled by an adjacent regulatory region. Nucleic Acids Res. 2017;46(3):1457–1469.
- Fonseca BD, Jia -J-J, Hollensen AK, et al. LARP1 is a major phosphorylation substrate of mTORC1. bioRxiv.2018.
- Kühbacher A, Emmenlauer M, Rämo P, et al. Genome-wide siRNA screen identifies complementary signaling pathways involved in Listeria infection and reveals different actin nucleation mechanisms during Listeria cell invasion and actin comet tail formation. MBio. 2015;6(3):e00598–15.
- Lecuit M, Dramsi S, Gottardi C, et al. A single amino acid in E-cadherin responsible for host specificity towards the human pathogen Listeria monocytogenes. Embo J. 1999;18(14):3956–3963.
- Pizarro-Cerda J, Jonquières R, Gouin E, et al. Distinct protein patterns associated with Listeria monocytogenes InlA- or InlB-phagosomes. Cell Microbiol. 2002;4(2):101–115.
- Fonseca BD, Zakaria C, Jia -J-J, et al. La-related Protein 1 (LARP1) Represses Terminal Oligopyrimidine (TOP) mRNA Translation Downstream of mTOR Complex 1 (mTORC1). J Biol Chem. 2015;290(26):15996–16020..
- Wilbertz JH, Voigt F, Horvathova I, et al. Single-Molecule Imaging of mRNA Localization and Regulation during the Integrated Stress Response. Mol Cell. 2019;73(5):946–947.
- Schwanhäusser B, Busse D, Li N, et al. Global quantification of mammalian gene expression control. Nature. 2011;473:337–342.
- Tani H, Mizutani R, Salam KA, et al. Genome-wide determination of RNA stability reveals hundreds of short-lived noncoding transcripts in mammals. Genome Res. 2012;22(5):947–956.
- Ribet D, Hamon MA, Gouin E, et al. Listeria monocytogenes impairs SUMOylation for efficient infection. Nature. 2010;464:1192–1195.
- Malet JK, Impens F, Carvalho F, et al. Rapid Remodeling of the Host Epithelial Cell Proteome by the Listeriolysin O (LLO) Pore-forming Toxin. Mol Cell Proteomics. 2018;17(8):1627–1636.
- Cambridge SB, Gnad F, Nguyen C, et al. Systems-wide proteomic analysis in mammalian cells reveals conserved, functional protein turnover. J Proteome Res. 2011;10(12):5275–5284.
- Barragán-Iglesias P, Lou T-F, Bhat VD, et al. Inhibition of Poly(A)-binding protein with a synthetic RNA mimic reduces pain sensitization in mice. Nat Commun. 2018;9(1):10.
- Burgess HM, Gray NK. mRNA-specific regulation of translation by poly(A)-binding proteins. Biochem Soc Trans. 2010;38:1517–1522.
- Gorgoni B, Richardson WA, Burgess HM, et al. Poly(A)-binding proteins are functionally distinct and have essential roles during vertebrate development. Proc Natl Acad Sci USA. 2011;108(19):7844–7849.
- Chorghade S, Seimetz J, Emmons R, et al. Poly(A) tail length regulates PABPC1 expression to tune translation in the heart. Elife. 2017;6:568.
- Kini HK, Silverman IM, Ji X, et al. Cytoplasmic poly(A) binding protein-1 binds to genomically encoded sequences within mammalian mRNAs. RNA. 2016;22(1):61–74.
- Liu SY, Zhang L, Zhang Y, et al. Bioinformatic analysis of pivotal genes associated with septic shock. J Biol Regul Homeost Agents. 2017;31(4):935–941.
- Zhang X, Chen X, Liu Q, et al. Translation repression via modulation of the cytoplasmic poly(A)-binding protein in the inflammatory response. Elife. 2017;6:619.
- Suzuki Y, Chin W-X, Han Q, et al. Characterization of RyDEN (C19orf66) as an Interferon-Stimulated Cellular Inhibitor against Dengue Virus Replication. PLoS Pathog. 2016;12(1):e1005357..
- Trieu-Cuot P, Carlier C, Poyart-Salmeron C, et al. Shuttle vectors containing a multiple cloning site and a lacZα gene for conjugal transfer of DNA from Escherichia coli to Gram-positive bacteria. Gene. 1991;102(1):99–104.
- Arnaud M, Chastanet A, Débarbouillé M. New vector for efficient allelic replacement in naturally nontransformable, low-GC-content, gram-positive bacteria. Appl Environ Microbiol. 2004;70(11):6887–6891.
- Li W, You B, Hoque M, et al. Systematic Profiling of Poly(A)+ Transcripts Modulated by Core 3’ End Processing and Splicing Factors Reveals Regulatory Rules of Alternative Cleavage and Polyadenylation. PLoS Genet. 2015;11(4):e1005166..
- Tafforeau L, Zorbas C, Langhendries J-L, et al. The complexity of human ribosome biogenesis revealed by systematic nucleolar screening of pre-rRNA processing factors. Mol Cell. 2013;51(4):539–551.
- Su Hui Teo C, RA S, O’Hare P. Spatial and temporal resolution of global protein synthesis during HSV infection using bioorthogonal precursors and click chemistry. PLoS Pathog. 2016;12(10):e1005927.
- Neuhoff V, Arold N, Taube D, et al. Improved staining of proteins in polyacrylamide gels including isoelectric focusing gels with clear background at nanogram sensitivity using Coomassie Brilliant Blue G-250 and R-250. Electrophoresis. 1988;9(6):255–262.
- Peron-Cane C, Leblanc J, Wingertsmann L, et al. Fluorescent secreted bacterial effectors reveal an intravacuolar replication compartment for Listeria monocytogenes. bioRxiv. 2019.
- Ingolia NT, Brar GA, Rouskin S, et al. The ribosome profiling strategy for monitoring translation in vivo by deep sequencing of ribosome-protected mRNA fragments. Nat Protoc. 2012;7(8):1534–1550.
- Huppertz I, Attig J, D'Ambrogio A, Easton LE, Sibley CR, Sugimoto Y, Tajnik M, König J, Ule J. iCLIP: protein-RNA interactions at nucleotide resolution. Methods. 2014;65:274–87.
- Dobin A, Davis CA, Schlesinger F, et al. STAR: ultrafast universal RNA-seq aligner. Bioinformatics. 2013;29(1):15–21.
- Liao Y, Smyth GK, Shi W. featureCounts: an efficient general purpose program for assigning sequence reads to genomic features. Bioinformatics. 2014;30(7):923–930.
- Leinonen R, Akhtar R, Birney E, et al. Improvements to services at the European Nucleotide Archive. Nucleic Acids Res. 2010;38(suppl_1):D39–45..
- Bahin M, Noël BF, Murigneux V, et al. ALFA: annotation landscape for aligned reads. BMC Genomics. 2019;20(1):250.
- Love MI, Huber W, Anders S. Moderated estimation of fold change and dispersion for RNA-seq data with DESeq2. Genome Biol. 2014;15(12):550.
- Li W, Wang W, Uren PJ, et al. Riborex: fast and flexible identification of differential translation from Ribo-seq data. Bioinformatics. 2017;33(11):1735–1737.
- Yu G, Wang L-G, Han Y, et al. clusterProfiler: an R package for comparing biological themes among gene clusters. OMICS. 2012;16(5):284–287.
- Aibar S, González-Blas CB, Moerman T, et al. SCENIC: single-cell regulatory network inference and clustering. Nat Methods. 2017;14(11):1083–1086..
- Janky R, Verfaillie A, Imrichova H, et al. iRegulon: from a gene list to a gene regulatory network using large motif and track collections. PLoS Comput Biol. 2014;10(7):e1003731..
- Futschik ME, Carlisle B. Noise-robust soft clustering of gene expression time-course data. J Bioinform Comput Biol. 2005;3(4):965–988.
- Robinson MD, Oshlack A. A scaling normalization method for differential expression analysis of RNA-seq data. Genome Biol. 2010;11(3):R25–9.
- Robinson MD, McCarthy DJ, Smyth GK. edgeR: a Bioconductor package for differential expression analysis of digital gene expression data. Bioinformatics. 2010;26(1):139–140.
- Wu D, Lim E, Vaillant F, et al. ROAST: rotation gene set tests for complex microarray experiments. Bioinformatics. 2010;26(17):2176–2182.
- Yamashita R, Suzuki Y, Takeuchi N, et al. Comprehensive detection of human terminal oligo-pyrimidine (TOP) genes and analysis of their characteristics. Nucleic Acids Res. 2008;36(11):3707–3715.
- McGillivray P, Ault R, Pawashe M, et al. A comprehensive catalog of predicted functional upstream open reading frames in humans. Nucleic Acids Res. 2018;46(7):3326–3338.
- Mokrejs M, Vopálenský V, Kolenaty O, et al. IRESite: the database of experimentally verified IRES structures (www.iresite.org). Nucleic Acids Res. 2006;34(90001):D125–30.
- Sinvani H, Haimov O, Svitkin Y, et al. Translational tolerance of mitochondrial genes to metabolic energy stress involves TISU and eIF1-eIF4GI cooperation in start codon selection. Cell Metab. 2015;21(3):479–492.