
ABSTRACT
At present, the functional recovery after nerve injury is not satisfactory in clinical practice. The aim of this study was to explore the molecular mechanism of miR-21 promoting Schwann cells (SC) proliferation and axon regeneration after peripheral nerve injury, providing a theoretical basis for injured nerve repair. Nerve injury models were constructed to determine the expression of miR-21 in the injured nerve by Quantitative Real-Time PCR (qRT-PCR). After miR-21 over-expression SC (mimic-miR-21) group, control SC (control-miR-21) group and blank SC (RSC96) group were constructed, SC proliferation was determined by CCK-8, cell cycle was analysed by flow cytometry, dorsal root ganglion neuron (DRGn) axon regeneration was observed after DRGn was cultured with SCs for 7 days, the expressions of TGFβI, TIMP3, EPHA4 as well as apoptosis-related proteins caspase-3 and caspase-9 were detected by qRT-PCR and Western blot in the three groups, respectively. Target genes were confirmed by dual-luciferase reporter gene assay. The expressions of TGFβI, TIMP3 and EPHA4 were assessed by immunofluorescence in vivo. qRT-PCR indicated that miR-21 expression was significantly higher in the model group than in the sham operation and blank groups. SC proliferation index (PI) was significantly higher, the apoptosis rate was significantly lower, the axon was significantly longer, and mRNA and protein expressions of TGFβI, TIMP3, EPHA4 as well as apoptosis-related proteins caspase-3 and caspase-9 were significantly lower in the mimic-miR-21 group than in the control-miR-21 and RSC96 groups. The double luciferase assay confirmed that TGFβI, TIMP3 and EPHA4 were potential target genes of miR-21. In vivo immunofluorescence also indicated that expressions of TGFβI, TIMP3, EPHA4 were lower in the mimic-miR-21 group than in the control-miR-21 and RSC96 groups. We conclude that during injured peripheral nerve repair, miRNA-21 plays an important role in promoting SC proliferation and axon regeneration by regulating TGFβI, TIMP3 and EPHA4 target genes.
Introduction
Different from the central nerve, Schwann cells (SC) become active after peripheral nerve injury. This is essential for maintaining neuron survival, guiding axon regeneration and promoting myelin sheath formation after injury [Citation1]. However, due to the special anatomical structure and function of the peripheral nervous system and unclear repair mechanism after nerve injury, the functional recovery after nerve injury is not satisfactory in clinical practice [Citation2].
MicroRNAs (miRNAs) constitute a class of small non-coding RNAs with a length of about 22–28 nucleotides. miRNAs may lead to degradation or translation inhibition of target genes by binding to the 3ʹUntranslated regions (3ʹUTR) of mRNAs of target genes, affecting downstream signalling pathways [Citation3–5]. miRNAs regulate gene expression, and are involved in almost all biological processes including growth, development, ageing, disease and death [Citation6]. Dicer enzyme is key for miRNA processing. Knocking out Dicer enzyme inhibits axonal regeneration, indicating that miRNAs may play an important role in axonal regeneration after injury. In rat sciatic nerve transection models, up-regulation of miRNAs including miR-21, miR-223, miR-455-5p, miR-431, miR-18, miR-134, miR-379 and miR-539 are found in local nerve tissue [Citation7]. Wu et al. [Citation8] also found that microRNA-21 (miR-21) levels increased after sciatic nerve injury and that these increased levels could be sustained for more than 3 weeks. It was also reported that after sciatic nerve transection, there were changes in miRNA expression in rat dorsal root ganglion neurons (DRGns), where the elevation of miR-21 is the most marked [Citation7]. Arthur-Farraj et al. [Citation9] and Musumeci et al. [Citation10] also confirmed that miR-21 levels increased in SCs of mice with sciatic nerve cuts, but the function of miR-21 in Schwann cells is unknown. All the above mentioned studies suggest that miR-21 is closely associated with regeneration of peripheral nerve injury, however the role of miR-21 in peripheral nerve injury is still to be uncovered. The aim of this study was to explore the molecular mechanism of miR-21 promoting SC proliferation and axon regeneration after peripheral nerve injury, providing a theoretical basis for injured nerve repair.
Results
miR-21expression levels in nerve tissue and SCs, as well as transfection rate of miR-21
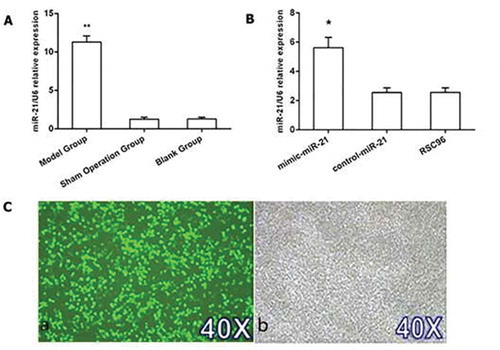
The miR-21 level in nerve tissue may reflect the miR-21 level in SCs because the peripheral nerve tissue contains 85% of SCs. Therefore, we established sciatic nerve injury models in SD rats to determine miR-21 level in nerve tissue, which reflectts miR-21 level in SCs in vivo after peripheral nerve injury. Twenty four hours after the establishment of the nerve injury models, qRT-PCR (Quantitative Real-Time PCR) indicated that miR-21 level was 7.87 ± 0.75 times and 7.75 ± 0.80 times higher in the nerve injury model than in the sham operation group and the blank group, respectively. The miR-21 expression level was significantly higher in the model group than in the sham operation group and blank group (all P < 0.01, ). In order to explore the molecular mechanism of miR-21 overexpression promoting Schwann cell (SC) proliferation and axon regeneration, we established SC models including miR-21 over-expression SC (mimic-miR-21) group, control SC (control-miR-21) group and blank SC (RSC96) group. Seventy two hours after constructing mimic-miR-21, control-miR-21 and RSC96 groups, qRT-PCR indicated that miR-21 level was 2.21 ± 0.14 times and 2.29 ± 0.21 times higher in the the mimic-miR-21 group than in the control-miR-21 group and RSC96 group, respectively. The miR-21 expression level was significantly higher in the mimic-miR-21 group than in the control-miR-21 group and RSC96 group (all P < 0.05, ). The transfected SCs were observed under an inverted phase contrast microscope 48 h after transfection and the transfection rate was more than 90% ().
Figure 1. miR-21 levels in nerve tissues and Schwann cells. A: miR-21 expression in the model group, sham operation group and blank group mean±SD, n = 3, ** P < 0.01 vs sham operation group or blank group. B: miR-21 expression in the mimic-miR-21 group, control-miR-21 group and RSC96 group mean±SD, n = 3, * P < 0.05 vs control-miR-21 group or RSC96 group. C: Transfected Schwann cells; C-a: fluorescence microscope 40×; C-b: Common microscope 40 ×.
miR-21 promoting SC proliferation
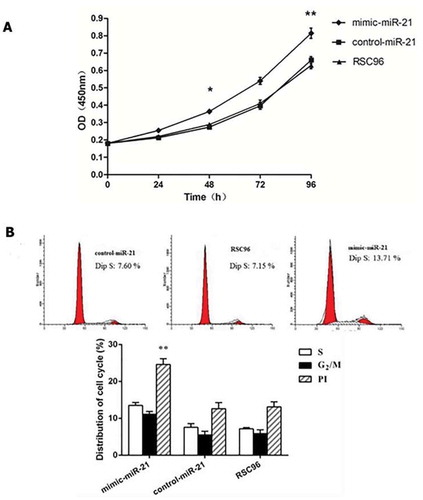
CCK-8 assay indicated that A450 was significantly higher in the mimic-miR-21 group (0.36 ± 0.01, 0.81 ± 0.02) than in the control-miR-21 group (0.29 ± 0.01, 0.64 ± 0.01) and RSC96 group (0.29 ± 0.01, 0.63 ± 0.02) 48 h and 96 h after transfection, respectively (all P < 0.05 and all P < 0.01) (). Flow cytometry displayed that PI was significantly higher in the mimic-miR-21 group (24.65 ± 1.53) than in the control-miR-21 group (12.64 ± 1.61) and RSC96 group (13.10 ± 1.36) (all P < 0.01). Although cell cycle distribution was not statisticaly different between the three groups, there was an upward tendency in SC number of S phase and G2/M phase in the mimic-miR-21 group as compared with the control-miR-21 group and RSC96 group ().
Figure 2. miR-21 promoting Schwann cell proliferation. A: A450 values detected by CCK-8 in the mimic-miR-21 group, control-miR-21 group and RSC96 group mean±SD, n = 3, * P < 0.05, ** P < 0.01 vs control-miR-21 group or RSC96 group. B: The influence of miR-21 on the cell cycle of Schwann cells detected by Flow cytometer %, Mean ± SD, n = 3, ** P < 0.01 vs control-miR-21 group or RSC96 group, PI: proliferation index.
Extraction of DRGns
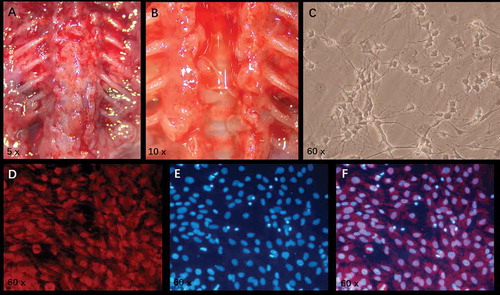
The skin was cut from the back to expose the spine (). The spinal column was cut open, and the whole spinal cord was picked out. The circular semi-transparent spinal DRGs were visible in the bilateral intervertebral foramina (). DRGns were observed under an inverted phase contrast microscope 7 days after incubation (). After immunofluorescence staining, the red fluorescence indicated DRGns and their synapses (), and the blue fluorescence indicated nuclei of various cells (). After merging the two images (), the DRGn purity = (red-stained DRGns/all blue-stained nuclei)×100% was more than 90%, demonstrating that DRGn purity met the requirements (>90%) of subsequent experiments.
Figure 3. Extraction of DRGns and detection of DRGn purity. A: After the skin is cut open, the soft tissue around the spine is stripped to expose the spine completely. B: After the spine is cut open and the whole spinal cord is picked out, circular and semi-transparent spinal dorsal root ganglions are visible in both-side intervertebral foramina. C: After 7-day culture, the morphology of DRGns is observed under an inverted phase-contrast microscope. D: After purification, the red fluorescence (NF-200 staining) indicates DRGns. E: After purification, the blue fluorescence (DAPI staining) indicates nuclei. F: A merged image of D and E. DRGns: Dorsal root ganglion neurons.
Axon growth after co-culture of DRGns and SCs in the three groups
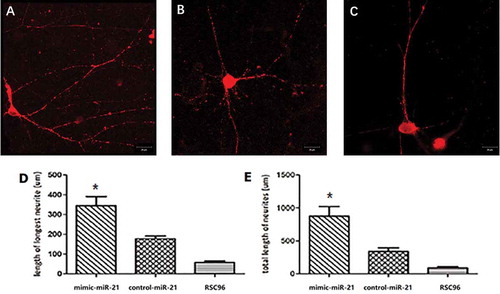
After 7-day co-culture of DRGns and SCs, axonal growth in the mimic-miR-21 group, control-miR-21 group and RSC96 group was observed by confocal microscopy (). The longest axon length of a single cell was significantly longer in the mimic-miR-21 group (344.7 ± 26.5 µm) than in the control-miR-21 group (177.8 ± 11.9 µm) and RSC96 group (153.8 ± 18.9 µm) (all P < 0.05, ). Further comparison indicated that the total axon lengths of a single cell in each group was significantly longer in the mimic-miR-21 group (875.8 ± 84.4 µm) than in the control-miR-21 group (338.6 ± 32.5 µm) and RSC96 group (321.6 ± 35.5 µm) (all P < 0.05, ).
Figure 4. Comparison of axonal length after 7-day coculture under a confocal microscopy. A, B and C: photographs of axon in the mimic-miR-21 group, control-miR-21 group and RSC96 group, respectively. D: Comparison of the longest axon length of a single cell between the three groups E: Comparison of the total axon lengths of a single cell between the three groups. mean±SD, n = 3, *P < 0.05 vs control-miR-21 group or RSC96 group; Scale bar: 30 µm.
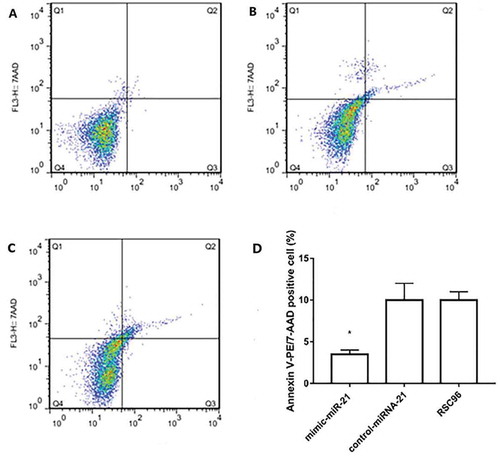
miR-21 inhibits SC apoptosis
Apoptosis was measured by Flow Citometry using Annexin V in the mimic-miR-21 group, control-miR-21 group and RSC96 group, respectively (-). The apoptotic percentage was significantly lower in the mimic-miR-21 group (0.45 ± 0.01%) than in the control-miR-21 group (3.75 ± 0.52%) and RSC96 group (3.75 ± 0.52%) (all P < 0.05, ).
Figure 5. Apoptosis detected by flow cytometry. A, B and C: Apoptosis in the mimic-miR-21 group, control-miR-21 group and RSC96 group, respectively. D: The apoptotic percentage is significantly lower in the mimic-miR-21 group than in the control-miR-21 group and RSC96 group mean±SD, n = 3, * P < 0.05 vs control-miR-21 group and RSC96 group. Q4 quadrant: living cells; Q3 quadrant: early apoptotic cells; Q2 quadrant: late apoptotic cells, Q1 quadrant: mechanical injured cells.
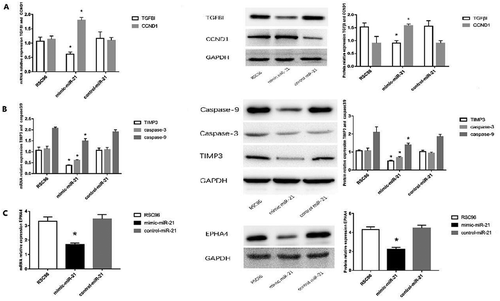
miR-21 down-regulates the expressions of TGFβI, CCND1, TIMP3, EPHA4 and caspase-3/caspase-9 in SCs
Target scan predicts that the 3ʹ-UTR of TGFβI, TIMP3 and EPHA4 contain binding sites with miR-21, so TGFβI, TIMP3 and EPHA4 may be the target genes of miR-21. qRT-PCR and Western blot all indicated that mRNA and protein expressions of TGFβI were significantly lower but CCND1 protein expression was significantly higher in the mimic-miR-21 group than in the control-miR-21 group and RSC96 group (all P < 0.05) ( and supplementary Table 1). Similarly, the mRNA and protein expressions of TIMP3 and EPHA4, and the protein expressions of caspase-3 and caspase-9 were also significantly lower in the mimic-miR-21 group than in the control-miR-21 group and RSC96 group (all P < 0.05) (,).
Figure 6. Expressions of TGFβI, CCND1, TIMP3, EPHA4 and caspase-3/caspase-9. A: mRNA and protein expressions of TGFβI and protein expression of CCND1 in the mimic-miR-21 group, control-miR-21 group and RSC96 group. B: mRNA and protein expressions of TIMP3 and protein expressions of caspase-3 and caspase-9 in the mimic-miR-21 group, control-miR-21 group and RSC96 group. C: mRNA and protein expressions of EPHA4 in the mimic-miR-21 group, control-miR-21 group and RSC96 group mean±SD, n = 3, * P < 0.05 vs control-miR-21 group and RSC96 group.
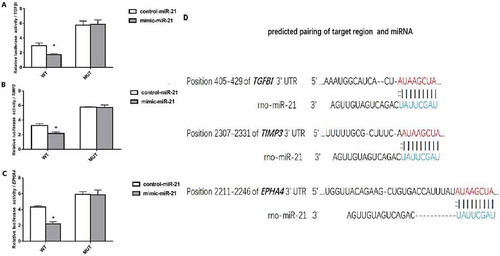
Verification of the target genes of miR-21 by dual-luciferase reporter gene system
miRNA combines with its target mRNA to form RNA-induced transcriptional silencing complex which promotes mRNA degradation or inhibits mRNA translation, exhibiting target gene inhibition at post-transcriptional level. Therefore, verification of miRNA target gene is very important for the biological function of miRNA. There are three ways to verify miRNA target gene: (1) based on the sequence characteristics of miRNA itself, using bioinformatics to predict its target gene; (2) dual-luciferase target gene verification test; and (3) the regulatory effect of miRNA on mRNA expression. Bioinformatics method can quickly predict possible target genes of miRNA, which may provide the clues for finding miRNA target genes. The dual-luciferase target gene verification test may be used to finally confirm miRNA target genes.
The dual-luciferase reporter gene system indicated that in TGFβI, TIMP3 and EPHA4 3ʹ-UTR-WT groups, the luciferase activity was significantly lower in the cells transfected by mimic-miR-21 than in the cells transfected by control-miR-21 (P < 0.05); while in TGFβI, TIMP3 and EPHA4 3ʹ-UTR-MUT groups, the luciferase activity was similar between the cells transfected by mimic-miR-21 and the cells transfected by control-miR-21 (–). This suggested that miRNA-21 bound to AUAAGCUA in the 3ʹ-UTR (non coding region) of TGFβI, TIMP3 and EPHA4 ().
Figure 7. Relative luciferase expression.A: Comparison of luciferase activity between the cells transfected by mimic-miR-21 and the cells transfected by control-miR-21 in TGFβI 3ʹ-UTR-WT and 3ʹ-UTR-MUT group. B: Comparison of luciferase activity between the cells transfected by mimic-miR-21 and the cells transfected by control-miR-21 in TIMP3 3ʹ-UTR-WT and 3ʹ-UTR-MUT group. C: Comparison of luciferase activity between the cells transfected by mimic-miR-21 and the cells transfected by control-miR-21 in EPHA4 3ʹ-UTR-WT and 3ʹ-UTR-MUT group mean±SD, n = 3, P < 0.05 vs the cells transfected control-miR-21. D: The binding sites of miR-21 with TGFβI, TIMP3 and EPHA4. The targetscan indicates that the binding sites of miR-21 with TGFβI, TIMP3 and EPHA4 exist at 405–429 bp (AUAAGCUA), 2307–2331 bp (AUAAGCUA) and 2211–2246 bp (AUAAGCUA) in the 3ʹUTR (non-coding region) of TGFβI, TIMP3 and EPHA4, respectively.
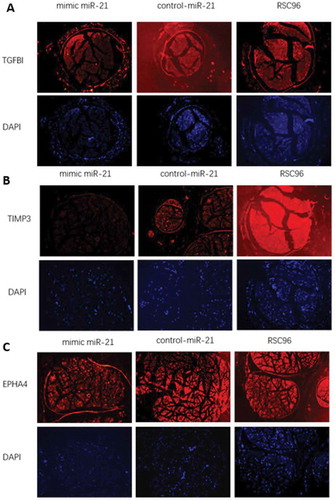
Expressions of TGFβI, TIMP3 and EPHA4 in vivo
The expression of TGF β I, TIMP3 and EPHA4 in vivo was detected by immunofluorescence staining (). At the wavelength of 568 nm, red flourescence indicated the presence of TGFβI, TIMP3 or EPHA4. At the wavelength of 461 nm, blue flourescence indicated the presence of cell nuclei. The red fluorescence intensity was weaker in the mimic-miR-21 group than in the control-miR-21 group and RSC96 group, suggesting that the expression levels of TGF β I, TIMP3 and EPHA4 were lower in the mimic-miR-21 group than in the control-miR-21 group and RSC96 group.
Figure 8. Expressions of TGFβI, TIMP3 and EPHA4 in vivo in the mimic-miR-21 group, control-miR-21 group and RSC96 group, respectively (×100).
Discussion
Peripheral nerve injury is a common disease in the nervous system. Neural function loss seriously affects the life quality of patients. At present, a variety of clinical treatment methods can partially restore the injured nerve function, but they have not achieved satisfactory results. The survival quantity and function level of SCs are decisive factors for peripheral nerve regeneration. In most cases, the number of SCs is too small to support the injured nerve regeneration, resulting in the formation of nerve scar. Therefore, finding the mechanism to regulate SC biological function has become an important issue in the field of peripheral nerve repair and regeneration [Citation11]. It has been reported that in SCs of injured nerves, there are abnormal expressions of miRNAs which regulated the biological behaviours of SCs including differentiation and secretion by changing the expressions of multiple genes [Citation12]. Yu et al. [Citation13,Citation14] found that after nerve injury, miRNAs such as miRNA-21 and miRNA-221 were dramatically increased in rats. Strickland et al. [Citation7] confirmed that miRNA-21 overexpression could regulate axon regeneration of dorsal root neurons in rats, but the action mechanism of miR-21 was not clear.
The miR-21 level in nerve tissue may reflect the miR-21 level in SCs because the peripheral nerve tissue contains 85% of SCs. In this study, we established rat nerve injury models and determined miR-21 expression in nerve tissue. We found that the miR-21 level was 7.87 ± 0.75 times and 7.75 ± 0.80 times higher in the model group than in the sham operation group and blank group, respectively; and was significantly higher than that in the sham operation group and blank group. This demonstrates that the miR-21 level is increased in SCs after nerve injury. CCK-8 assay indicated that SC proliferation was significantly higher in the mimic-miR-21 group than in the control-miR-21 group and RSC96 group 48 h and 96 h after transfection, suggesting that the SC proliferation is enhanced by the elevation of miR-21 level. At the same time, flow cytometry displayed that the proportion of cells in S phase and G2/M phase as well as PI were increased in the mimic-miR-21 group, demonstrating that miR-21 may change the cell cycle of SCs. Flow cytometry also indicated that the percentage of apoptotic SCs was significantly decreased in the mimic-miR-21 group as compared with the control-miR-21 group and RSC96 group (P < 0.01), suggesting that miR-21 can inhibit SC apoptosis. After 7-day co-culture of SCs and DRGns in the mimic-miR-21 group, control-miR-21 group and RSC96 group, the axon lengths of DRGns were significantly different between the three groups and were as follows: the mimic-miR-21 group > control-miR-21 group > RSC96 group. This suggests that the effect of miRNA-21 on the axon growth of peripheral neurons is present in SC. Cyclin D1 (CCND1) is currently recognized as a key factor in the regulation of cell cycle. Cyclin D1 can control G1/S transition. Zhang et al. [Citation15] have reported that TGFβI regulates cyclin D1, and cyclin D1 influences cell cycle by activating downstream cascade. Therefore, cyclin D1 level was determined in this study. In this study, Western blot indicated that TGFβI was significantly lower, but cyclin D1 significantly higher in the mimic-miR-21 group than in the control-miR-21 group and RSC96 group. Based on these, miR-21 probably targets TGFβI to up-regulate cyclin D1 expression, which accelerates SC transition from G1 phase to S phase and promotes SC proliferation. However, this remains to be further confirmed in vivo in our next study. This study also found that TIMP3 protein level was significantly lower in the mimic-miR-21 group than in the control-miR-21 group and RSC96 group, suggesting that miR-21 in SCs can down-regulate TIMP3 expression. Similarly, EPHA4 expression was also significantly lower in the mimic-miR-21 group than in the control-miR-21 group and RSC96 group, demonstrating that there is a negative regulation between miR-21 and EPHA4. In order to further verify the interaction of miR-21 with TGFβI, TIMP3 and EPHA4, we used target scan to predict the binding sites with miR-21 in the 3ʹ-UTR of TGFβI, TIMP3 and EPHA4, and then the dual-luciferase reporter gene system confirmed that these binding site are present indeed. Finally, immunofluorescence test comfirmed that miR-21 also down-regulated the expressions of TGFβI, TIMP3 and EPHA4 in vivo.
TGFβI, an extracellular matrix protein, was discovered in human lung adenocarcinoma cell line A549 in 1992 [Citation16]. TGFβI, one of the potential target genes of miR-21, is involved in the regulation of cell proliferation, differentiation and apoptosis, and is closely associated with injured cell repair. Cyclin D1, a recognized key factor in cell cycle regulation, can positively regulate G1/S transition in cell cycle. It has been confirmed that cyclin D1 expression is regulated by TGFβI [Citation17]. cyclin D1 induces a series of downstream cascade regulation to promote SC proliferation, providing sufficient SCs for nerve repair. TIMP3 family, natural inhibitors of MMPs family, contains a special member TIMP3 which is the only non-soluble protein in the extracellular matrix (ECM). TIMP3 can inhibit ECM hydrolysis caused by MMP and is conducive to ECM repair. TIMP3 is closely related to cell growth and apoptosis, and may be strongly associated with peripheral nerve regeneration. The apoptosis-related signal transduction mechanism is very complex. There are at least three apoptosis-related pathways including mitochondrial pathway, death receptor pathway and endoplasmic reticulum pathway. The activation of caspase family members is important for apoptosis. Caspase-3 is a key enzyme which plays an important role in the degradation of many proteins. Caspase-9 leads to apoptosis by activating downstream caspase-3. We used Western blot to detect the levels of caspase-3 and caspase-9 in SCs, and found that the protein expressions of caspase-3 and caspase-9 were significantly lower in the mimic-miR-21 group than in the control-miR-21 group and RSC96 group, suggesting that miR-21 can inhibit SC apoptosis by inhibiting the activation of caspase-9 and caspase-3 and play a role in the repair and regeneration of peripheral nerve. There is EPHA4 expression in SCs. EPHA4 can affect SC migration and inhibit nerve cell axon regeneration after peripheral nerve injury. Tyrosine kinase receptor family (ephs) and its ligand (ephrins) exist in the entire nervous system and play an important role in cell migration, axon growth and neural network formation [Citation18–20]. EPHA4, a member of tyrosine kinase receptor family, is increased in astrocytes after spinal cord injury and it can inhibit the formation of growth cones [Citation21]. When EPHA4 is inhibited, SC function and peripheral nerve regeneration can be markedly improved [Citation22,Citation23]. However, there has not been the study on the relationship between miR-21 and EPHA4.
The process of nerve repair and regeneration is not regulated by a single gene, so we further explored the relationships of miRNA-21 with TGFβI, TIMP3 and EPHA4. TGFβI and TIMP3 are closely related to the number of survival SCs because they can increase the number of survival SCs by promoting SC proliferation and inhibiting SC apoptosis. While, EPHA4 down-regulation may promote nerve axon regeneration and function recovery.
Conclusions
SCs are important supporting cells for injured peripheral nerve repair, and the number and function of SCs are the key factors of nerve regeneration and repair. In this study, we confirmed the mechanism that miR-21 overexpression plays an important role in maintaining the number of SCs and promoting nerve cell axon growth during nerve repair by exploring TGFβI, TIMP3 and EPHA4. This study also provides a new idea for the repair and regeneration of injured peripheral nerve.
Materials and methods
All work was conducted with the formal approval of the Institutional Review Board and Ethics Committee of the Third Affiliated Hospital, Sun Yat-Sen University.
Materials
Thirty male one or five-day-old SD rats weighing between 8 g and 12 g, and 48 adult SD rats weighing between 150 g and 200 g were purchased from the Animal Experiment Centre of North Campus of Sun Yat-sen University. SC strain RSC96 was purchased from Cell Bank of Chinese Academy of Sciences. Microscissors (WAl030) and microforceps (WA3040/WA3050) were purchased from Jinzhong (Shanghai, China). Stereoscopic microscope was from Nikon (Tokyo, Japan). Transwell system was from corning (USA). Phosphate buffered solution, DMEM/F12, foetal bovine serum, neurobasal medium, B-27 Additive, L-Glutamine, papain and collagenase A were purchased from Gibco (New York, USA). Matrigel-356,234 was from BD (New York, USA). NF200 mouse anti-rat Millipore Cat, No. mab5266 was from Thermo Fisher Scientific (Massachusetts, USA). Sheep anti-mouse IgG/Cy3 red fluorescent second antibody bs-0296 G-Cy3 Lot: AE073003 was purchased from Beijing boorsen biotechnology co., LTD (Beijing, China). DAPI staining was from Nanjing Kaiji Biological Company (Nanjing China). The mirVana miRNA Isolation Kit was from Ambion (Texas, USA). Antibodies TGFBI (catalogue: 10,188-1-AP), TIMP3 (catalogue: ab39184), EPHA4 (catalogue: 37–1600), caspase-3 (catalogue: ab2302), caspase-9 (catalogue: ab32539) were from Nanjing Kaiji Biological Company (Nanjing China). The immunofluorescent reagents and dyes used in the experiment were provided by Nanjing Biyuntian Biotechnology Co., Ltd (Nanjing China). OPTI-MEM medium and Lipofectamine 2000 were purchased from Thermo Scientific (Massachusetts, USA). 293 T cells were purchased from Cell Bank of Chinese Academy of Sciences (Beijing, China). Wild type (3 ‘UTR-WT) and mutant type (3ʹ UTR-MUT) reporter gene vectors of TGFβI, TIMP3 and EPHA4 were purchased from Genepharma (Suzhou, China). Control-miR-21 and mimic-miR-21 were purchased from Ribobio (Guangzhou, China). Lipofectamine 2000 was purchased from Invitrogen (Carlsbad, California, USA).
Establishment of nerve injury models and detection of miR-21 in nerve tissues
A total of 24 adult SD rats were randomly divided into three groups including nerve injury group (model group), sham operation group and normal control group (blank group) (8 rats in each group). After intravenous combined anaesthesia, a longitudinal incision was made on the left lower limb followed by layer-by-layer separation to expose the upper segment of sciatic nerve. In the model group, the sciatic nerve was cut off followed by layer-by-layer tissue suture. In the sham operation group, the sciatic nerve was exposed followed by layer-by-layer tissue suture. In the blank group, rats were not treated. Twenty four hours later, about one centimetre nerve tissue was taken from the broken end in the model group, and in the sham operation group and blank group, about one centimetre nerve tissue was also taken at the same location. All collected nerve tissues were stored in ice boxes. Total RNA was extracted using the mirVana miRNA Isolation Kit (Ambion, Austin) according to the manufacturer’s instructions. The sample underwent cDNA synthesis: at 37°C for 15 min, at 85°C for 5 s. Finally cDNA was stored at −80°C. U6 was used as an internal reference and data were obtained from three independent samples. The sequences and PCR primers of miR-21 and U6 and are shown in .
Table 1. Primer sequences of miR-21, TGFβI, TIMP3, EPHA4, U6 and GAPDH for qRT-PCR.
Establishment of SC models and detection of miR-21 in each group
RSC96 cells in logarithmic growth phase were seeded into 6-well plate 24 hours before transfection. The RSC96 cells were transfected when they reached 80% fusion. Mimic-miR-21 with green fluorescent protein GFP and control-miR-21 with green fluorescent protein GFP were respectively transfected into RSC96 cells to construct SC strain expressing miR-21 (mimic-miR-21 group) and SC strain expressing control-miR-21 (control-miR-21 group). And then the non-treated RSC96 were used as blank group. The transfection efficiency was detected by Image J software 48 hours after transfection. The miR-21 levels in the three groups were determined 72 h after transfection as previously described.
Detection of cell proliferation by CCK-8 assay
The cells in the three groups were collected and prepared into single cell suspensions, and then 3000 cells were seeded into 96-well culture plate with three wells for each group in an atmosphere of 5% CO2 at 37°C for 24 h, 48 h, 72 h and 96 h, respectively. CCK-8 (5 g/L, 20 μl) was added to each well, 2 h later the absorbance (A) value was detected at 450 nm using ELISA instrument.
Detection of cell cycle by flow cytometry
The cells were collected by centrifugation. After removal of the supernatant, the cells were washed twice with pre-cooling PBS, and then pre-cooling 95% ethanol was added at 4°C overnight. The cells were collected by centrifugation. The cells were washed once with one millilitre of PBS, and then 500 μl of PBS containing 50 mg/L of ethidium bromide, 100 mg/L RNase A and 2% of Triton X-100 were added at 4°C in a dark for 30 min. A total of 30,000 cells were counted using a flow cytometer and data were analysed using ModFit software. Cell proliferation index (PI) was calculated according to the following formula: PI = (S+ G2/M)/(G0/G1 + S+ G2/M).
Extraction and purification of DRGns
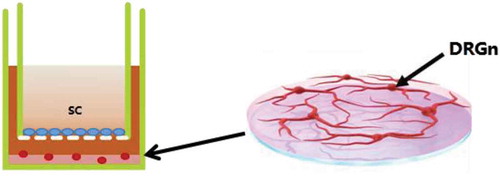
Thirty 1 or 5-day-old SD rats were killed by decapitation and placed under an anatomical microscope. The skin was cut from the back to expose the spine. The spinal column was cut, and the intact spinal cord was picked out. The circular semi-transparent spinal DRGns were collected one by one from both-side intervertebral foramina. The DRGns were placed in a DMEM/F12 medium at 4°C. After cutting DRGns into paste, 2 mg/ml of papain was added at 37°C in a constant temperature incubator for 20 min. After centrifugation, the supernatant was removed, 4 mg/ml of collagenase A was added at 37°C for 20 min. DMEM/F12 + 10% FBS medium was added to stop digestion, the supernatant was removed after centrifugation, the cells were resuspended with NB medium (neurobasal+2% B27 + 2 mmol/L of glutamate), and was gently blown into cell suspension. Frozen matrix and 104/ml of DRGns were mixed according to 1:1, and then spread in the lower chamber of the transwell system at 37°C for 30 min followed by addition of NB medium. After that, medium was completely changed every 24 hours, and 48 hours later 5 umol/L of Arabinoside (Ara-c) was added for purification culture.
Co-culture of DRGns and SCs
After 7 days of purification culture in the lower chamber of the transwell system (), 106/ml of SCs were seeded in the upper chamber, and the medium in the upper and lower chambers was replaced with a low serum medium (neurobasal+B27 + 0.5 mM Gln+5% FBS). Seven days later the axon length was observed under an inverted phase contrast microscope.
Figure 9. Co-culture system of DRGns and SCs. The mixture of DRGns and matrigel are seeded in the lower chamber, and SCs are seeded in the upper chamber. DRGns: dorsal root ganglion neurons; SCs: Schwann cells.
Immunofluorescence staining
The co-cultured medium of DRGns and SCs was collected, washed 3 times with PBS, fixed with 4% paraformaldehyde for 30 minutes, washed with PBS 3 times, followed by addition of 0.1% Triton at room temperature for 10 min. The co-cultured medium was washed 3 times with PBS, sealed using 2% bovine serum albumin for one hour. After washing using PBS, 1:200 primary antibody (NF200, mouse anti-rat Millipore Cat, No. mab526) was added at 4°C overnight. After washing 3 times using PBS, 1:200 of red fluorescence second antibody (sheep anti-mouse IgG, ABGAB Cat, No. 24–00-0296) was added at 37°C for 2 h. After washing 3 times using PBS with each time for 3 min, DAPI was added at room temperature for 5 min. After washing 3 times using PBS, the cell purity was determined under a fluorescence microscope. Under a confocal microscopy, the axon length of DRGn was directly traced out by an image J software, and then the actual length was measured by comparing the scale. In each group, the axonal lengths of 3 DRGns were measured. Cell immunofluorescence images were collected and analysed using inverted phase contrast microscope and inverted fluorescence microscope.
Expression of miR-21, EPHA4, TGFβI and TIMP3 in the cells of three groups detected by qRT- PCR
qRT-PCR was performed at 95°C for 30 s, at 95°C for 5 s, at 60°C for 34 s, 40 cycles using SYBR Green Gene Expression Assay Kit (TaKaRa Bio, Otsu shiga, Japan) and 7500 Fast Real-Time PCR System (Thermofisher Scientific inc, Massa Chusetts, American). U6 and GAPDH were used as internal references of miR-21 and EPHA4, respectively. The data of three independent samples were used for relative quantitative analysis. The reverse transcription primers and PCR primers of U6, miR-21, GAPDH, TGFβI, TIMP3 and EPHA4 are shown in .
Detection of protein expression of EPHA4, TGFβI, EPHA4 as well as apoptosis-related proteins caspase-3 and caspase-9 by Western blot
The cells in the three groups were respectively collected and proteins were extracted with kit. The total protein concentration was determined by BCA method at A562 nm wavelength using ELISA instrument. The samples were isolated by 10%SDSPAGE, were transferred to PVDF membrane by 200 mA constant current for 90 min, and were sealed using 5% skimmed milk powder at room temperature for one hour. The membrane was washed 3 times using TBST with each time for 5 min, the primary antibodies of EPHA4, TIMP3, TGFβI and GAPDH were added at 4°C overnight. The membrane was washed 3 times using TBST with each time for 5 min, HRp-labelled second antibodies was added at room temperature for one hour. The membrane was washed 3 times using TBST with each time for 5 min followed by developing using ECL chemiluminescence kit.
Detection of apoptosis by flow cytometry
The cells in the three groups were digested with 0.25% of trypsin without EDTA, washed with PBS twice, centrifuged at 2000rpm for 5 minutes for collection of 1–5 × 10⁵ cells. The 1–5 × 10⁵ cells were placed in 50 μl of binding buffer containing 5 μl of 7-AAD staining solution in a dark at room temperature for 5–15 min followed by addition of 450 μl binding buffer and 1 μl Annexin V-PE in a dark, at room temperature for 5–15 min. The cells were detected using flow cytometry within one hour, and then the data were analysed using FlowJo software.
Dual-luciferase reporter gene system
Wild type (3 ‘UTR-WT) and mutant type (3ʹ UTR-MUT) reporter gene vectors of TGFβI, TIMP3 and EPHA4 were constructed (). Wild type (3 ‘UTR-WT) reporter gene vector of each gene was co-transfected with mimic-miR-21 or control-miR-21 (), respectively, into human embryonic kidney cells 293 T by lipofectamine 2000; and then the luciferase activity was compared between the cells co-transfected by mimic-miR-21 with wild type (3 ‘UTR-WT) reporter gene vector and the cells co-transfected by control-miR-21 with wild type (3 ‘UTR-WT) reporter gene vector. As the same method, mutant type (3ʹ UTR-MUT) reporter gene vector of each gene was co-transfected with mimic-miR-21 or control-miR-21, respectively, into human embryonic kidney cells 293 T; and then the luciferase activity was compared between the cells co-transfected by mimic-miR-21 with mutant type (3ʹ UTR-MUT) reporter gene vector and the cells cotransfected by control-miR-21 with mutant type (3ʹ UTR-MUT) reporter gene vector.
Table 2. Sequences of mimic-miR-21, control-miR-21 as well as TGFβI, TIMP3 and EPHA4 reporter gene vectors.
The transfection method: 293 T cells in logarithmic growth phase were seeded into 96-well plate 24 hours before transfection. mimic-miR-21 (or control-miR-21) was diluted using 10 μl of OPTI-MEM medium, reporter gene vector was diluted using 15 μl of OPTI-MEM medium and Lipofectamine 2000 was diluted using 25 μl of OPTI-MEM medium, and then the diluted mimic-miR-21 (or control-miR-21), reporter gene vector and Lipofectamine 2000 were mixed followed by addition of 50 μl OPTI-MEM medium to a total of 100 μl in each well. The testing was performed in triplicate.
The luciferase activity in the experimental group was detected by the Dual-Luciferase Report Assay System. Forty eight hours after transfection, the previous medium was removed, and the cells were washed using PBS twice, 65 μl of PLB (passive lysis buffer) was added to each well at room temperature for 15 min followed by collecting cell lysate. After 20 μl of cell lysate was added on the luminous plate, the background value was recorded by a manual double fluorescence detector; each sample was quickly mixed with 100 μl of LAR II working fluid followed by recording value; and then each sample was quickly mixed with 100 μl of Stop&Glo Reagent followed by recording value using a fluorescence detector. These data were stored. Results were calculated according to the following formula: activity multiple = (R/F in sample)/(R/F in control) (F-firefly luciferase, R-ranilla luciferase).
In vivo immunofluorescence test
After nerve injury models was established, one millilitre of cell suspension (5 × 10⁵, mimic-miR-21, control miR-21, RSC96) was injected into the anastomotic site of nerve broken ends, respectively. One week later, the 1 cm-long nerve specimens near anastomotic site were collected, fixed with formaldehyde for 24 hours, embedded in wax blocks, sectioned at a thickness of 5 μ m, spread in 45°C water, baked in constant temperature oven at 70°C for 2 h, soaked in xylene for 10 min, then soaked in anhydrous ethanol, 95%, 70%, 50% ethanol and pure water for 5 min, respectively. Sections were washed with 0.01 mol/LPBS for 5 min followed by addition of 3% methanol-H2O2 solution, 15 min later were washed with PBS 3 times followed by antigen retrieval. Sections were washed again with PBS 3 times with each time for 5 min, sealed using normal sheep serum at room temperature for 60 min. After redundant liquid was removed, 100 μ l of primary antibody with dilution of 1:200 was added overnight at 4 °C, the sections were place at 37 °C for 45 min, washed using PBS 3 times with each time for 10 min. Fluorescent rabbit secondary antibody containing 0.05% Trixton-100(100 μ l) with dilution of 1:1000 was added in a dark at room temperature for 2 h. Sections were washed using PBS 3 times with each time for 10 min, stained with DAPI in a dark for 5 min, were washed using PBS 3 times with each time for 5 min, and funally sealed using glycerol.
Statistical analysis
All assays were performed in triplicate. Statistical treatment was performed using SPSS19.0 software. The measurement data were expressed as mean ±standard deviation (mean ±SD), and one-way analysis of variance (Analysis of Variance, ANOVA) was used for the comparison between groups. Statistical significance was established at P < 0.05.
Abbreviation
| miR-21 | = | microRNA-21 |
| SC | = | Schwann cell |
| DRGn | = | dorsal root ganglion neuron |
| PI | = | proliferation index; A: absorbance |
| CCND1 | = | cyclin D1 |
| ECM | = | extracellular matrix;. |
Supplemental Material
Download MS Word (28.5 KB)Disclosure statement
No potential conflict of interest was reported by the authors.
SUPPLEMENTAL DATA
Supplemental data for this article can be accessed at here
Additional information
Funding
References
- Madduri S, Gander B. Schwann cell delivery of neurotrophic factors for peripheral nerve regeneration. J Peripher Nerv Syst. 2010;15:93–103.
- Webber CA, Christie KJ, Cheng C, et al. Schwann cells direct peripheral nerve regeneration through the Netrin-1 receptors, DCC and Unc5H2. Glia. 2011;59:1503–1517.
- Ambros V. The functions of animal microRNAs. Nature. 2004;431:350–355.
- Chen LJ, Lim SH, Yeh YT, et al. Roles of microRNAs in atherosclerosis and restenosis. J Biomed Sci. 2012;19:79.
- Vo N, Klein ME, Varlamova O, et al. A cAMP-response element binding protein-induced microRNA regulates neuronal morphogenesis. Proc Natl Acad Sci U S A. 2005;102:16426–16431.
- Bartel DP. MicroRNAs: genomics, biogenesis, mechanism, and function. Cell. 2004;116:281–297.
- Strickland IT, Richards L, Holmes FE, et al. Axotomyinduced miR-21 promotes axon growth in adult dorsal root ganglion neurons. PLoS One. 2011;6:e23423.
- Wu D, Raafat M, Pak E, et al. MicroRNA machinery responds to peripheral nerve lesion in an injury-regulated pattern. Neuroscience. 2011;190:386–397.
- Arthur-Farraj PJ, Morgan CC, Adamowicz M, et al. Changes in the coding and non-coding transcriptome and DNA methylome that define the schwann cell repair phenotype after nerve injury. Cell Rep. 2017;20:2719–2734.
- Musumeci G, Leggio GM, Marzagalli R, et al. Identification of dysregulated microRNA networks in Schwann cell-like cultures exposed to immune challenge: potential crosstalk with the protective VIP/PACAP neuropeptide system. Int J Mol Sci. 2018;19:E981.
- Wu D, Murashov AK. Molecular mechanisms of peripheral nerve regeneration: emerging roles of microRNAs. Front Physiol. 2013;4:55.
- Bremer J, O’Connor T, Tiberi C, et al. Ablation of Dicer from murine Schwann cells increases their proliferation while blocking myelination. PLoS One. 2010;5:e12450.
- Yu B, Zhou S, Qian T, et al. Altered microRNA expression following sciatic nerve resection in dorsal root ganglia of rats. Acta Biochim Biophys Sin (Shanghai). 2011;43:909–915.
- Yu B, Zhou S, Wang Y, Qian T, Ding G, Ding F, et al. miR-221 and miR-222 promote Schwann cell proliferation and migration by targeting LASS2 after sciatic nerve injury. J Cell Sci. 2012;125:2675–2683.
- Zhang Y, Wen G, Shao G, et al. TGFBI deficiency predisposes mice to spontaneous tumor development. Cancer Res. 2009;69:37–44.
- Skonier J, Neubauer M, Madisen L, et al. cDNA cloning and sequence analysis of beta ig-h3, a novel gene induced in a human adenocarcinoma cell line after treatment with transforming growth factor-beta. DNA Cell Biol. 1992;11:511–522.
- Wen G, Hong M, Li B, et al. Transforming growth factor-beta-induced protein (TGFBI) suppresses mesothelioma progression through the Akt/mTOR pathway. Int J Oncol. 2011;39:1001–1009.
- Holland SJ, Peles E, Pawson T, et al. Cell-contact-dependent signalling in axon growth and guidance: eph receptor tyrosine kinases and receptor protein tyrosine phosphatase beta. Curr Opin Neurobiol. 1998;8:117–127.
- Klein R. Eph/ephrin signaling in morphogenesis, neural development and plasticity. Curr Opin Cell Biol. 2004;16:580–589.
- Scicolone G, Ortalli AL, Carri NG. Key roles of Ephs and ephrins in retinotectal topographic map formation. Brain Res Bull. 2009;79:227–247.
- Bundesen LQ, Scheel TA, Bregman BS, et al. Ephrin-B2 and EphB2 regulation of astrocyte-meningeal fibroblast interactions in response to spinal cord lesions in adult rats. J Neurosci. 2003;23:7789–7800.
- Goldshmit Y, Spanevello MD, Tajouri S, et al. EphA4 blockers promote axonal regeneration and functional recovery following spinal cord injury in mice. PLoS One. 2011;6:e24636.
- Wang Y, Zheng Z, Hu D. Inhibition of EphA4 expression promotes Schwann cell migration and peripheral nerve regeneration. Neurosci Lett. 2013;548:201–205.