
ABSTRACT
Alzheimer’s disease (AD) has devastating consequences for patients during its slow, progressive course. It is important to understand the pathology of AD onset. Recently, circular RNAs (circRNAs) have been found to participate in many human diseases including cancers and neurodegenerative conditions. In this study, we mined the published dataset on the AMP-AD Knowledge Portal from the Mount Sinai Brain Bank (MSBB) to describe the circRNA profiles at different AD stages in brain samples from four brain regions: anterior prefrontal cortex, superior temporal lobe, parahippocampal gyrus and inferior frontal gyrus. In total, we found 147 circRNAs to be differentially expressed (DE) for different AD severity levels in the four regions. We also characterized the mRNA-circRNA co-expression network and annotated the potential function of circRNAs based on the co-expressed modules. Based on our results, we found that the most circRNA-regulated region in AD patients with severe symptoms was the parahippocampal gyrus. The strongest negatively AD severity-correlated module in the parahippocampal gyrus was enriched in cognitive disability and pathological-associated pathways such as synapse organization and regulation of membrane potential. Finally, a regression model based on the expression pattern of DE circRNAs in the module could help to distinguish the disease severity of patients, further supporting a role for circRNAs in AD pathology. In conclusion, our findings indicate that circRNAs in parahippocampal gyrus are possible biomarkers and regulators of AD as well as potential therapeutic targets.
Introduction
The global increase in the occurrence of Alzheimer’s disease (AD) stresses the urgent need to develop effective medical strategies to help patients suffering from this menacing neurodegenerative disease. Alzheimer’s disease is the most common age-related dementia and it is well known for its slow-progressing and incurable deterioration. The disease manifests as impaired cognitive function caused by neuronal necrosis in specific brain regions [Citation1] and eventually leads to death due to brain dysfunction [Citation2]. Although the exact pathology of AD is still debated, it is hypothesized that the continuous neuron loss and brain structure dystrophy is induced by the accumulation of Amyloid ß (Aß) protein and cell inflammation [Citation3], which leads to memory loss and cognitive decline. Appropriate treatment during disease progression could help slow down the disease and it is therefore important to understand the biological and physiological changes that occur during the disease.
Since the discovery of non-coding RNAs (ncRNAs), increasing evidence suggests that ncRNAs play an important role in disease pathology and therefore could serve as both biomarkers and targets for treatment in several human disorders. Recently, ncRNA-related therapeutics targeting cancers, diabetes and hepatitis C [Citation4] have entered clinical trials. As a new member of the ncRNAs, circular RNAs (circRNA) have caught attention given their abundance in humans [Citation5] and possible pathological importance [Citation6]. CircRNAs were long considered to be by-products of gene expression; however, in recent years, evidence of circRNA dysregulation in cancers [Citation7], neurodegenerative diseases [Citation8], diabetes [Yonghao Citation9] and cardiovascular diseases [Citation10] suggest that circRNAs play an important role in cell homoeostasis and pathogenesis [Citation11].
CircRNAs have covalently linked termini created by a noncanonical back-splicing event and therefore naturally lack free 5ʹ and 3ʹ ends. This closed nature of circRNAs provides resistance to exonucleases, thereby increasing their half-life relative to linear transcripts [Citation12], making circRNAs good potential targets for clinical use. Studies on circRNAs as biomarkers have so far mainly been focused on cancers and, to a lesser extent, neurodegenerative disorders. However, there is evidence suggesting the importance of circRNAs in the brain and neural system. The brain is the organ with the highest accumulation of circRNAs [Citation13] and many brain-expressed circRNAs stem from genes with synaptic function in human [Citation13]. Besides, circRNA expression changes during ageing in mammalian brains [Citation14], a recent study reported a correlation between circRNA expression and the pathological features of AD [Citation15], however, the paper focused on the parietal cortex and discussed the global changes but not the brain region-specific changes.
In this study, we set out to investigate how circRNAs correlate with AD severity in different human brain regions. We profiled circRNA expression in AD patients using a public RNA-sequencing dataset provided by the AMP-AD Knowledge Portal. The dataset was prepared with brain samples from AD patients from Mount Sinai/JJ Peters VA Medical Center Brain Bank (MSBB) [Citation16] and containsRibo-Zero-treated RNAseq libraries of four brain regions: anterior prefrontal cortex (aPFC), responsible for memory retrieval [Citation17] and prospective memory [Citation18], superior temporal lobe (STL) and inferior frontal gyrus (IFG), both involved in language comprehension [Citation19], and parahippocampal gyrus (PHG), essential for episodic memory formation and contextual association [Citation20], from post-mortem brain samples. The samples were classified according to different dementia stages, based on clinical and neuropathological scales: the clinical dementia rating (CDR) score [Citation21] and the neuropathology category measured by CERAD [Citation22]. The CDR score is a numeric scale to grade the severity of AD clinical symptoms, which is derived by combining information from interviews with subject and other information. The score usually ranges from zero (normal cognitive ability) to three (severe), but in the dataset used in this study, additional categories of four (profound dementia) and five (terminal dementia) are present. The CERAD system, which is based on post-mortem semiquantification of neuritic plaques, provides aclinical assessment of four AD stages ranging from no AD, possible AD, probable AD to definite AD. The analysis of differential circRNA expression showed that the PHG was the most influenced region based on either the CDR or CERAD scale. The co-expression network and the functional enrichment analysis revealed that the co-expressed modules in PHG highly associate with disease progression involved pathways including synapse and membrane potential regulation, implying that circRNAs may participate in these pathways. Finally, using a regression model, we show that expression levels of promising circRNA candidates in PHGcan distinguish between different levels of AD severity, providing further evidence for the importance of PHG circRNAs in AD.
Results
Brain region-specific circRNA profiling and changes in Alzheimer’s disease
The number of circRNAs identified in the four brain regions ranged from about 58,000 to 72,000, of which 3500 to 5200 circRNAs remained after removing lowly expressed circRNAs in each region ().
Table 1. The identified and highly expressed circRNAs in each brain region
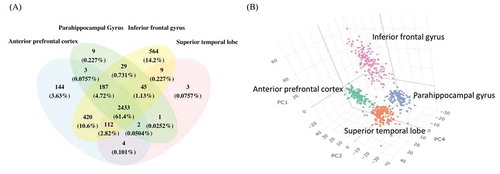
About 19% of the identified circRNAswere found in all brain regions, and the percentage of shared circRNAs increased to nearly two-thirds among the highly expressed circRNAs (). Also, a three-dimensional PCA showed region-specific clustering of the highly expressed circRNAs (), indicating that both the identity and expression level of circRNAs differed between regions. Among the four regions, IFG showed the highest abundance of circRNAs and clustered separately from the other three regions, suggesting that IFG had a unique expression profile.
Figure 1. The highly expressed circRNA in four brain regions. (A) Venn diagrams of highly expressed circRNAs in each brain region. The shared and distinct circRNAs are shown as the number and percentage. (B) The 3D PCA of highly expressed circRNAs that exists in at least 1 brain regions, the axes show the first, second and fourth principal components
We then performed differential expression analysis to observe the relationship between circRNA expression and AD severity. We found that the majority of circRNAs decreased with increased CDR and CERAD stage in all four brain regions, irrespective of circRNA expression level and differential enrichment (Supplementary Table 1).
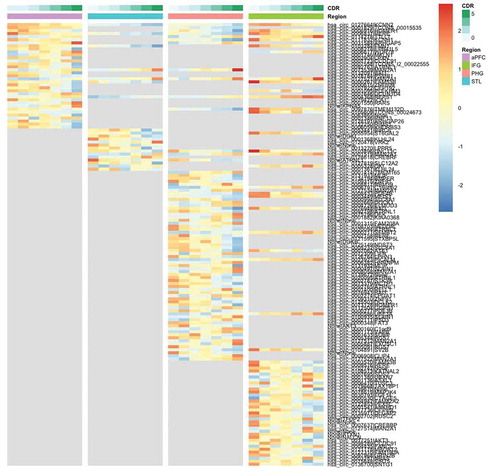
One hundred and forty-seven circRNAs were significantly differentially expressed across CDR stages at FDR ≤0.05 in all four brain regions () and the distribution of the 147 circRNAs was highly specific to the individual regions. Only four of the 147 differentially expressed circRNAs (2.7%) are shared across the four brain regions, and the number of region-specific differentially expressed circRNAs is 19, 9, 54 and 35 in aPFC, STL, PHG and IFG, respectively. Although the profiling data showed that IFG had the highest level of circRNA expression, PHG was the region with the most significantly changed circRNAs with the increased severity based on the clinical symptoms of AD.
Compared to the changes in circRNA expression associated with the CDR score, the correlation between circRNA expression and CERAD was much less pronounced. Although we found a modest correlation between the CDR and the CERAD (Supplementary Fig. 1A), and about 70% of the circRNAs changed with the increased CERAD and CDR, respectively (Supplementary Table 1), the numbers of significant differentially expressed circRNAs associated with the CERAD score were lower than using CDR: 6, 3, 10 and 10, in each brain region, respectively. Only about half of the significant DE circRNAs associated with CERAD were also differentially expressed in correlation with the CDR score (Supplementary Fig. 1B & 1C).
Figure 2. Heatmap of significantly DE circRNAs in brain regions based on CDR. The colour legends on top of the heatmap show the CDR stages and the brain region. The grey area in the plot means the circRNA is not significantly DE in that region
Replication of the circRNA analysis in STL with an independent AD dataset
Currently, circRNA studies are constrained by the sequencing techniques. Poly-A enrichment is often preferred over ribo-depletion due to the lower cost and pure mRNA reads. However, the circularization of circRNAs removes the poly-A tail, and therefore they are not captured by poly-A enrichment methods. Due to this limitation, we were unable to replicate the results of all four brain regions in MSBB dataset and selected the publically available independent AD dataset GSE104704 (lateral temporal lobe, NAD = 12, Nhealth = 10) from the GEO database to validate the DE results of the most related brain region STL in the discovery MSBB dataset. The circRNA profiles between the validation dataset and the discovery dataset were quite similar, 86% of the highly expressed circRNAs in GSE104704 were also highly expressed in STL. Limited by the smaller sample size and low statistical power, only six circRNAs were found to be significantly differentially expressed (FDR ≤ 0.05) in the replication dataset in the lateral temporal lobe. However, 9 of the 21 CDR-associated and 1 of the 3 CERAD-associated DE circRNAs were nominally significant in GSE104704 (P value ≤ 0.05). Additionally, we discovered 115 (out of 147) CDR-associated and 20 (out of 25) CERAD-associated circRNAs in the MSBB dataset that are significantly DE in all four brain regions were also expressed in the GSE104704, and all these circRNAs were consistently up/down-regulated between the two datasets when comparing healthy to AD (Supplementary Fig. 2A–D). The same positive correlation also existed between the CDR-associated DE circRNAs in STL and the GSE104704 (Supplementary Fig. 2E). Since only 2 out of 3 CERAD-associated DE circRNAs were identified in both STL and GSE104704, we were unable to perform a correlation test.
CircRNA-mRNA co-expression network analysis and functional annotation
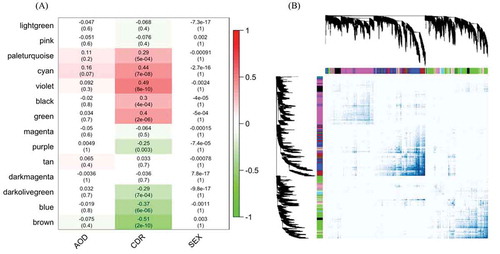
Given the global deregulation in CDR-associated circRNA expression, we speculated that a correlated dysregulation of circRNAs and mRNAs during cognitive decline could imply a functional role in shared pathways. We therefore constructed a circRNA-mRNA co-expression network to capture the relationship between circRNAs and mRNAs. Moreover, the mRNAs and circRNAs in the same module could be involved in similar molecular mechanisms, such that including mRNAs could aid in the functional enrichment test. , B shows the circRNA-mRNA co-expressed modules and CDR in PHG, including sex and AOD as they are strong influence factors of AD. The co-expressed modules were assigned to different colours to visualize the topological overlap but these do not represent any functional information. The co-expressed network of the other three regions is shown in Supplementary Fig. 3 and the composition of modules in Supplementary Tables 2–5. All modules in aPFC and STL were weakly associated with CDR, consistent with a previous study showing that these two regions were the least important of the four brain regions in dementia [Citation23]. Surprisingly, although IFG was shown to be an important region for AD in that study, and it was the region with the highest circRNA expression in our study, the association between the IFG transcriptome and the CDR score in our analysis was nearly as weak as for aPFC and STL. The maximum absolute correlation coefficients of the three regions were 0.32, compared to 0.51 for the PHG. This, however, agreed with the observation that PHG had more significantly DE circRNAs than all the other three regions, suggesting that circRNAs in PHG were most associated with the change of CDR. We therefore focused on the functional role of circRNAs in this specific region. In PHG, the module with the highest correlation coefficient was ‘violet’ (r = 0.49 and P value = 8^10−10) and the lowest was ‘brown’ (r = – 0.51 and P value = 2^10−10).
Figure 3. The circRNA-mRNA co-expressed modules in parahippocampal gyrus. (A) represents the correlation of circRNA-mRNA co-expressed modules clustered by WGCNA in the parahippocampal gyrus and three traits, CDR, AOD and SEX. The numbers in the heatmaps are the correlation coefficients and the P value in the parentheses. (B) shows the topological overlap of the co-expressed modules. Each column and row is a transcript and the colour bands on the top and left represent the modules. The deeper coloured regions in the network matrix correspond to more topological overlap (i.e. higher intra-module similarity of the members). The dendrograms on top and left show the clustering of the transcripts
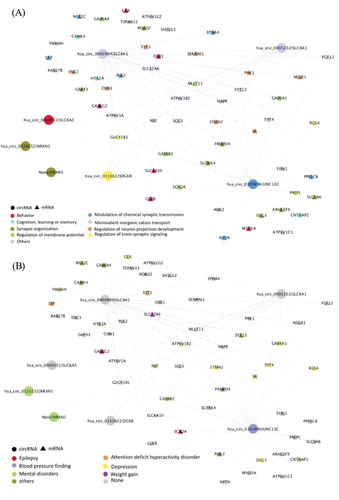
For each module, we performed gene and disease ontology enrichment analysis on the host genes of mRNAs and circRNAs that significantly changed with the CDR. The brown module was enriched in important AD pathological mechanisms such as membrane potential regulation and synaptic function, and advanced cognitive functions including behaviour, learning or memory and cognition (Supplementary Fig. 4A). The DO enrichment test also showed that the brown module was significantly related to mental disorders such as attention deficit hyperactivity disorder, autism, depression and epilepsy (Supplementary Fig. 4B). Interestingly, weight change and, specifically, weight gain were enriched DO terms in our analysis. Although it is not a feature most commonly linked to Alzheimer’s disease, several studies have reported that before and during Alzheimer’s disease progression, some patients experience unusual and dramatic weight change[Citation24]. The networks in , represented the strongest interaction between circRNAs and mRNAs in the brown module, colour-coded by the ontology enrichment terms. Compared to the brown module, the violet module showed lower functional enrichment, the only significant biological pathway-enriched term was epithelial cell differentiation, and circRNA-mRNA correlation in the network was much weaker than in the brown module (data not shown).
Figure 4. The circRNA-mRNA co-expressed network of the brown module in Parahippocampal gyrus. The same network colour coded by either (A) biological pathway, and (B) disease ontology enrichment term. The circle represents the circRNAs and the triangle represents the genes. In order to provide a brief overview, only those circRNAs and mRNAs with log2 fold-change ≥0.2 & FDR ≤0.05 are included, only edges with weights ≥0.2 are shown, and mRNA–mRNA interactions are excluded
Association between circRNAs and the clinical or neuropathological state of AD
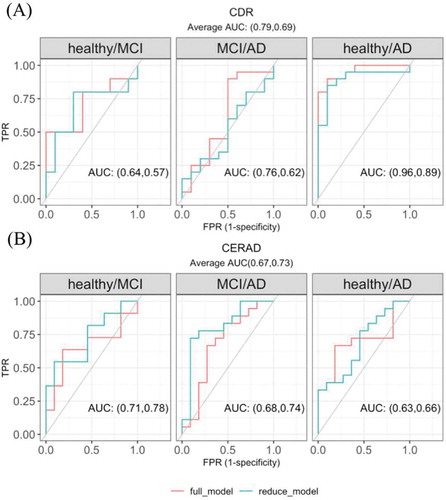
Given that circRNAs in the PHG brown module are related to CDR, we selected 13 circRNAs in the PHG brown module (see methods for specific criteria) as promising candidates for AD clinical state assessment. We grouped individuals by the severity of CDR stages into healthy, mild cognitive impairment (MCI) and AD, and showed the expression differences for the 13 circRNAs in Supplementary Fig. 5. A multinomial logistic regression model was used to quantify how well each of the 13 circRNAs predicted any of the three AD clinical groups (model and analysis details are described in the methods section). Most circRNAs improved the prediction of AD clinical groups to a weak or moderate level (Supplementary Fig 6). Considering that the predictive ability of a single circRNA may be limited, we further combined the five circRNAs that had the largest area under the ROC curve (AUC) in Supplementary Fig 6 and found their joint model improved the predictive power of the AD state in any of the healthy/MCI, MCI/AD and healthy/AD comparisons; the overall AUC also increased from 0.69 in the reduced model to 0.79 in the full model (p = 0.035, ). However, the circRNAs did not show the same predictive power in predicting the AD neuropathological state. When constructing the model with the 10 significantly DE circRNAs in CERAD, the improvement of every single circRNA was negligible and the combination of the top five circRNAs did not improve performance ().
Figure 5. The multivariate regression model with circRNA candidates in predicting (A) CDR and (B) CERAD state. The reduced model included covariates sex, age of death, batch and the first three principal components calculated from the circRNA expression level. The full model further included the five significantly DE circRNAs with the highest average AUC in the univariate regression models (the five circRNAs used in predicting CDR state were shown in Supplementary Fig 6, the five used in predicting CERAD were not shown)
Discussion
In this study, we identified a global dysregulation of circRNAs in four brain regions associated with the worsening of AD neuropathological phenotype (CERAD score) and clinical symptoms such as memory, orientation and judgement ability (CDR score). The general decrease in circRNA expression in diseased brains contrasts the general increase of circRNAs reported during normal ageing [Citation14], suggesting that circRNAs may be beneficial for healthy ageing.
Comparing all four regions studied, we found that although IFG was the region with the most enriched circRNA expression, PHG was the region in which circRNAs were most related to the severity of AD. Considering that PHG is mainly responsible for advanced cognitive abilities (e.g. associative learning), and that many reports have indicated that PHG atrophy could be an early symptom of AD patients [Citation25,Citation26], the abnormal change of circRNAs implies a functional association of circRNAs in PHG and AD pathology. We also built a regression model to test the association between circRNAs and AD (both CDR and CERAD). Due to the limited number of available independent datasets, we used 70% of the samples in our dataset for model training and 30% for the performance test, while all samples were used for DE and co-expression network analysis. The test data for the regression model were therefore not fully independent, and further validation is necessary to confirm the results. Nevertheless, the regression model suggested that the selected circRNAs in PHG could improve the prediction of AD severity based on the CDR scale.
Interestingly, we found that the correlation of circRNA expression changes with the neuropathological phenotype was in general much less pronounced than with the clinical symptoms. Although the majority of circRNAs changed in the same direction when the CDR and the CERAD increased, not only the number of significantly DE circRNAs but also the log2 fold-changes of the circRNAs associated with CERAD were much smaller than with CDR. The regression model built on the significantly DE circRNAs in CERAD did not improve the prediction either. Since the CDR scale is based on the integrative assessment of cognitive-related ability and the CERAD scale estimates the accumulation of neuritic plaque in AD, it seems likely that the circRNAs are involved in molecular mechanisms not directly or closely related to the formation of neuritic plaques. The observation that the strongest CDR-associated module was also enriched in cognitive ability like behaviour, memory and learning also implied that circRNAs could be involved in these high-level cognitive abilities. Our understanding of how high-level cognitive ability works in human is still limited and, although there is no direct evidence showing circRNAs to play a key role in these functional mechanisms, future research in the role of circRNAs in these mechanisms may shed new light on decline and recovery of cognitive ability during brain ageing.
Other benefits of circRNA as biomarkers are the high stability and that circRNAs encapsulated in exosomes have been found to circulate in the bloodstream [Citation27], providing the possibility of using circRNA profiles in blood samples as diagnostic biomarkers for AD. Although it is necessary to further confirm the robustness of the circRNA candidates described here and determine if they can be detected in exosomes or biofluids, our research describes the association between circRNA expression and CDR score and points out the potential importance of PHG circRNAs in the AD disease.
Methods
Dataset information
The clinical information, RNA and QC tables were downloaded from the AMPAD Knowledge Portal (https://www.synapse.org/#!Synapse:syn3159438) in June 2018. As part of the MSBB study, there were 364 individuals at different AD stages in the cohort. Ribo-Zero-treated 100 bp single-end RNA-sequencing libraries were available for one to four of the below brain regions for each patient: aPFC, STL, PHG and IFG. The detailed tissue processing and data preparation procedures have been described [Citation16]. Not all subjects had RNA-Seq libraries available for all four brain regions, and not all the libraries passed the quality control performed by the original group. To avoid low-quality samples, individuals who were not annotated as ‘Okay’ in the QC table provided by the original group, samples where the RNA sequencing had a RIN score lower than 4, or samples where the rRNA rate was higher than 5% were removed. Samples from non-European individuals were also removed. Finally, of 223 individuals, there were 187,166,138 and 158 RNA-sequencing datasets available in four regions, respectively. The demographic summary of the dataset is provided in Supplementary Table 6. The replicate dataset GSE104704 [Citation28], which is publically available in the GEO database, contains AD patients, young and old healthy individuals. To avoid bias from age, we only used the AD and old, healthy individuals for replication.
CircRNA quantification
To quantify circRNA expression in the AD brain regions, the BAM files and the unmatched FastQ files (containing reads that failed to map to the reference genome) of the same individual were downloaded, converted and merged back to the FastQ file containing all sequenced reads with Picard(v2.7.1)[Citation29] and then re-mapped to the human reference genome hg19 with the Burrows-Wheeler Aligner (BWA-MEM, v0.7.15)[Citation30]. The CircRNA detection tool CIRI2 (v2.0.6) [Citation31] was used to identify and quantify the circRNAs. In order to construct co-expression networks, we also downloaded the mRNA expression tables from the AMPAD Knowledge Portal. Further data cleaning and analyses were done using R.
The R package org.Hs.eg.db [Citation32], TxDb.Hsapiens.UCSC.hg19.knownGene [Citation33], Ensembl genomic information from the BioMart portal (www.biomart.org) [Citation34] and information of known circRNAs from circBase(http://circbase.org/) [Citation35] were used for circRNA and mRNA annotation. After annotation, transcripts that passed both of the following criteria: (1) transcripts with zero reads in less than 25% of individuals, (2) average circRNA expression higher than two reads (mRNA higher than ten reads) in any CDR group were considered as highly expressed. The full list of circRNAs that passed the criteria is provided as Supplementary Material Supplementary_Table_S7.xlsx. The highly expressed circRNAs of all samples were then used for principal component analysis (PCA) to find potential clustering. All the following analyses also used only highly expressed transcripts unless otherwise noted. The replicate dataset went through the same quantification pipeline and the differential expression analysis described below. The only difference was that, due to limited information, the replicate dataset only used AOD as the covariate in the DESeq2 model.
Differential expression analysis and the correlation between the log2 fold-changes
DE analysis of circRNA was performed with the R package DESeq2 (v1.18.1) [Citation36]. The model used CDR or CERAD (ordered from normal to definite AD) as the dependent variable and included the post-mortem interval (PMI), age of death (AOD), sex and batch information as covariates. P values were adjusted for multiple testing using the Benjamini-Hochberg (BH) method. Only results with an adjusted P value ≤0.05 were considered significant. The DE result of all circRNAs is provided as Supplementary Material Supplementary_Table_S8.xlsx. For the correlation estimation, the log2 fold-change of the DE circRNAs in the STL (or the averaged log2 fold-change of four brain regions) was correlated with the log2 fold-change of the same circRNAs in GSE104704 with the R lm() function.
Co-expression network construction
The R package WGCNA (v1.66) [Citation37] was used to construct circRNA-mRNA co-expression networks. Before running WGCNA, PCA analysis was performed to check for potential confounder effects in circRNA and mRNA in each brain region, and clustering based on the batch in circRNA and sex in mRNA was detected. Since the sex effect was not the focus in this study, the batch effect in circRNAs and sex effect in mRNAs were removed with the Limma package (v3.38.3) [Citation38] (Supplementary Fig 7); the network construction then followed the tutorial provided by the WGCNA package. Briefly, using default parameters, WGCNA calculated and picked a soft threshold for each brain region and removed outliers. WGCNA then constructed a signed network based on the expression change of all highly expressed circRNAs and mRNAs and calculated the Pearson correlation between the clustered models and the CDR. To avoid too many small modules, the clustered dendrogram was trimmed to keep modules containing at least 100 transcripts. Network visualization was done by Cytoscape (v3.7.1) [Citation39]. Only those circRNAs and mRNAs with a log2 fold-change ≥0.2 & FDR ≤0.05, and the edge weight ≥0.2 were used for network visualization; mRNA–mRNA interactions were excluded to provide a simplified overview.
Functional enrichment analysis
Gene ontology (GO) and disease ontology (DO) enrichment analyses were performed by the R packages clusterProfiler (v3.10.1) [Citation40] and DOSE (v3.8.2) [Citation41]. Given the sparsity of functional information for circRNAs, the mRNAs that were significantly changed during cognitive decline (FDR ≤0.05) and in the most positively or negatively CDR-correlated co-expression modules were also included in the functional enrichment test, while all highly expressed mRNAs and circRNAs were used as the background for the test. The redundant enriched ontology terms were trimmed by the clusterProfiler, and the remaining terms with P value <0.05 were selected.
Regression model construction and the receiver operating characteristics curve (ROC)
We found 13 circRNAs that passed both the following criteria: (1) significantly DE with CDR (FDR ≤0.05 and log2 fold-change ≥0.2), (2) member of the most trait-related WGCNA co-expression modules. The 10 circRNAs associated with CERAD were also significantly DE (FDR ≤ 0.05) and member of the co-expression modules. All individuals were categorized as three disease stages: healthy (CDR < 1 or CERAD = 1), mild cognitive impairment (MCI, CDR = 1 ~ 3 or CERAD = 2 ~ 3) and AD (CDR> 3 or CERAD = 4), which was then used as the predictive target in the model. We included the following covariates in the base model: age of death (AOD), sex, batch and the first three principal components of circRNA expression. We calculated the relative area under the receiver operating characteristic curve (AUC) for each single circRNA candidate, i.e. the increase in AUC obtained by including the circRNA expression as a covariate in the base model. We employed R package caret (v6.0–84) [Citation42] and glmnet (v2.0–18) [Citation43] for the analysis. For model training, 10-fold cross-validation performed on 70% of individuals selected by stratified random sampling by the disease stage. The remaining 30% of individuals were used as test data for model performance estimation. The number of samples in each group in training and testing datasets for the regression model is listed in Supplementary Table 9. The five most strongly associated circRNAs among the 13 and 10 examined individually in the regression were subsequently selected for further analysis. Using the same base model, we included the five circRNAs as covariates and examined the relative AUC.
Data access
MSBB: https://www.synapse.org/#!Synapse:syn3159438
GSE104704: https://www.ncbi.nlm.nih.gov/geo/query/acc.cgi?acc=GSE104704
Supplemental Material
Download MS Excel (3.1 MB)Supplemental Material
Download MS Excel (16.9 MB)Supplemental Material
Download MS Word (5.8 MB)Acknowledgments
The MSBB dataset was obtained from the AMP-AD Knowledge Portal (doi:10.7303/syn2580853). These data were generated from postmortem brain tissue collected through the Mount Sinai VA Medical Center Brain Bank and were provided by Dr Eric Schadt from Mount Sinai School of Medicine. The GSE104704 dataset was obtained from the Center of Neurodegenerative Disease Research (CNDR) biobank at the University of Pennsylvania in accordance with Institutional Review Board approved protocols.
We thank the patients and researchers who contributed to generating the high-quality datasets, without them this study would not be possible. We also thank Dr Anne Færch Nielsen for critically reading the manuscript, the whole Kjems lab, and QIAGEN Aarhus for constructive comments, discussion and support.
Disclosure statement
The authors declare that there is no conflict of interests.
Supplementary material
Supplemental data for this article can be accessed here.
Additional information
Funding
References
- Hyman BT, Van Hoesen GW, Damasio AR, et al. Alzheimer’s disease: cell-specific pathology isolates the hippocampal formation. Sci (New York) 1984;225(4667):1168–1170.
- Pagani M, Giuliani A, Oberg J, et al. Progressive disintegration of brain networking from normal aging to Alzheimer disease: analysis of independent components of (18)F-FDG PET data. J Nucl Med. 2017;58(7):1132–1139.
- Fang -X-X, Sun G-L, Zhou Y, et al. TGF-beta1 protection against Abeta1-42-induced hippocampal neuronal inflammation and apoptosis by TbetaR-I. Neuroreport. 2018;29(2):141–146.
- Rupaimoole R, Slack FJ. MicroRNA therapeutics: towards a new era for the management of cancer and other diseases. Nat Rev Drug Discov. 2017;16(3):203–222.
- Maass PG, Glažar P, Memczak S, et al. A map of human circular RNAs in clinically relevant tissues. J Mol Med. 2017;95(11):1179–1189.
- Han B, Chao J, Yao H. Circular RNA and its mechanisms in disease: from the bench to the clinic. Pharmacol Ther. 2018;187:31–44.
- Chen G, Shi Y, Zhang Y, et al. CircRNA_100782 regulates pancreatic carcinoma proliferation through the IL6-STAT3 pathway. Onco Targets Ther. 2017;10:5783–5794.
- Zhao Y, Alexandrov PN, Jaber V, et al. Deficiency in the ubiquitin conjugating enzyme UBE2A in Alzheimer’s Disease (AD) is linked to deficits in a natural circular miRNA-7 sponge (circRNA; ciRS-7). Genes (Basel). 2016;7(12):116.
- Gu Y, Ke G, Wang L, et al. Altered expression profile of circular RNAs in the serum of patients with diabetic retinopathy revealed by microarray. Ophthalmic Res. 2017;58(3):176–184.
- Holdt LM, Stahringer A, Sass K, et al. Circular non-coding RNA ANRIL modulates ribosomal RNA maturation and atherosclerosis in humans. Nat Commun. 2016;7:12429.
- Kristensen LS, Andersen MS, Stagsted LVW, et al. The biogenesis, biology and characterization of circular RNAs. Nat Rev Genet. 2019;20(11):675–691.
- Enuka Y, Lauriola M, Feldman ME, et al. Circular RNAs are long-lived and display only minimal early alterations in response to a growth factor. Nucleic Acids Res. 2016;44(3):1370–1383.
- You X, Vlatkovic I, Babic A, et al. Neural circular RNAs are derived from synaptic genes and regulated by development and plasticity. Nat Neurosci. 2015;18(4):603–610.
- Gruner H, Cortes-Lopez M, Cooper DA, et al. CircRNA accumulation in the aging mouse brain. Sci Rep. 2016;6:38907.
- Dube U, Del-Aguila JL, Li Z, et al. An atlas of cortical circular RNA expression in Alzheimer disease brains demonstrates clinical and pathological associations. Nat Neurosci. 2019;22(11):1903–1912.
- Wang M, Beckmann ND, Roussos P, et al. The Mount Sinai cohort of large-scale genomic, transcriptomic and proteomic data in Alzheimer’s disease. Sci Data. 2018;5:1–16.
- Ranganath C, Heller AS, Wilding EL. Dissociable correlates of two classes of retrieval processing in prefrontal cortex. NeuroImage. 2007;35(4):1663–1673.
- Costa A, Oliveri M, Barban F, et al. The right frontopolar cortex is involved in visual-spatial prospective memory. PloS One. 2013;8(2):e56039.
- Grossman M, Cooke A, DeVita C, et al. Sentence processing strategies in healthy seniors with poor comprehension: an fMRI study. Brain Lang. 2002;80(3):296–313.
- Li M, Lu S, Zhong N. The parahippocampal cortex mediates contextual associative memory: evidence from an fMRI study. Biomed Res Int. 2016;2016:9860604.
- Morris JC. Clinical dementia rating: a reliable and valid diagnostic and staging measure for dementia of the Alzheimer type. Int Psychogeriatr. 1997;9(S1):173–176.
- Mirra SS, Heyman A, McKeel D, et al. The consortium to establish a registry for Alzheimer’s disease (CERAD). Part II. Standardization of the neuropathologic assessment of Alzheimer’s disease. Neurology. 1991;41(4):479–486.
- Wang M, Roussos P, McKenzie A, et al. Integrative network analysis of nineteen brain regions identifies molecular signatures and networks underlying selective regional vulnerability to Alzheimer’s disease. Genome Med. 2016;8(1):104.
- Gu Y, Scarmeas N, Cosentino S, et al. Change in body mass index before and after Alzheimer’s disease onset. Curr Alzheimer Res. 2014;11(4):349–356.
- Echávarri C, Aalten P, Uylings HBM, et al. Atrophy in the parahippocampal gyrus as an early biomarker of Alzheimer’s disease. Brain Struct Funct. 2011;215(3–4):265–271.
- Krumm S, Kivisaari SL, Probst A, et al. Neurobiology of Aging Cortical thinning of parahippocampal subregions in very early Alzheimer’s disease. Neurobiol Aging. 2016;38:188–196.
- Xu H, Guo S, Li W, et al. The circular RNA Cdr1as, via miR-7 and its targets, regulates insulin transcription and secretion in islet cells. Nat Publishing Group. 2015;July:1–12. DOI:10.1038/srep12453
- Nativio R, Donahue G, Berson A, et al. Dysregulation of the epigenetic landscape of normal aging in Alzheimer’s disease. Nat Neurosci. 2018;21(4):497–505.
- Picard Tools - By Broad Institute. n.d. [cited 2018 Dec 17]. Available from: http://broadinstitute.github.io/picard/
- Li H. Aligning sequence reads, clone sequences and assembly contigs with BWA-MEM. 2013. https://arxiv.org/abs/1303.3997
- Gao Y, Zhang J, Zhao F. Circular RNA identification based on multiple seed matching. Brief Bioinform. 2018;19(5):803–810.
- Carlson M. org.Hs.eg.db: genome wide annotation for Human. 2018. Available from: https://bioconductor.statistik.tu-dortmund.de/packages/3.8/data/annotation/html/org.Hs.eg.db.html.
- Carlson M, Maintainer BP. TxDb.Hsapiens.UCSC.hg19.knownGene: annotation package for TxDb object(s). 2015. Available from: https://bioconductor.org/packages/release/data/annotation/html/TxDb.Hsapiens.UCSC.hg19.knownGene.html .
- Smedley D, Haider S, Durinck S, et al. The BioMart community portal: an innovative alternative to large, centralized data repositories. Nucleic Acids Res. 2015;43(W1):W589–98.
- Glažar P, Papavasileiou P, Rajewsky N. circBase: a database for circular RNAs. RNA (New York). 2014;20(11):1666–1670.
- Love MI, Huber W, Anders S. Moderated estimation of fold change and dispersion for RNA-seq data with DESeq2. Genome Biol. 2014;15(12):550.
- Langfelder P, Horvath S. WGCNA: an R package for weighted correlation network analysis. BMC Bioinformatics. 2008;9:559.
- Ritchie ME, Phipson B, Wu D, et al. Limma powers differential expression analyses for RNA-sequencing and microarray studies. Nucleic Acids Res. 2015;43(7):e47.
- Shannon P, Markiel A, Ozier O, et al. Cytoscape: a software environment for integrated models of biomolecular interaction networks. Genome Res. 2003;13(11):2498–2504.
- Yu G, Wang L-G, Han Y, et al. clusterProfiler: an R package for comparing biological themes among gene clusters. Omics. 2012;16(5):284–287.
- Yu G, Wang L-G, Yan G-R, et al. DOSE: an R/Bioconductor package for disease ontology semantic and enrichment analysis. Bioinformatics. 2015;31(4):608–609.
- Kuhn M. Building predictive models in R using the caret package. J Stat Softw. 2008;1(5):1–26. Available from: www.jstatsoft.org/v028/i05.
- Friedman J, Hastie T, Tibshirani R. Regularization paths for generalized linear models via coordinate descent. J Stat Softw. 2010;33(1):1–22.