
ABSTRACT
Translational regulation plays a critical role in gene expression. However, there are few genome-wide studies on translational regulation in non-alcoholic fatty liver disease (NAFLD), which is a severe non-communicable epidemic worldwide. In this study, we performed RNC-mRNA (mRNAs bound to ribosome-nascent chain complex) sequencing and mRNA sequencing to probe the translation status of high-fat-diet (HFD) induced mouse fatty liver. Generally, in the HFD group compared to the control group, changes of translation ratios and changes in mRNA abundance had a negative correlation. The relative abundance of RNC-mRNAs and mRNAs were positively correlated, yet the former changed more slowly than the latter. However, the rate of change became more balanced when it came to the livers of mice that were fed the HFD plus lycopene, an antioxidant. This indicated relatively independent roles of translational modulation and transcriptional regulation. Furthermore, many genes were differentially regulated at the transcriptional or translational levels, suggesting a new screening strategy for functional genes. In conclusion, our analysis revealed the different and correlated role of translational control with transcriptional regulation in the HFD-induced mouse fatty liver relative to the control, which indicates critical roles of translational control for liver steatosis; thus, adding a new dimension towards a better understanding and improvement of treatment for NAFLD.
1. Introduction
Proteins are the functional products of genes, the regulation of which is controlled at multiple points, including the transcriptional, mRNA degradation, translational and protein degradation levels. Among them, translational regulation that modulates protein synthesis plays a dominant role in the regulation of the cellular abundance of proteins [Citation1]. Additionally, it has been observed that the mRNA abundance has insufficient correlation with the protein abundance [Citation2,Citation3], which also reflects the important effects of translational control. However, unlike other -omics research, such as ‘genomics’ and ‘transcriptomics’, ‘translatomics’, which studies the elements involved in all translation stages at a global level, seems less common. Since translational control is critical for gene expression, more attention should be paid to comprehensive and in-depth study of translatomics.
It is well recognized that non-alcoholic fatty liver disease (NAFLD) is a non-communicable epidemic affecting a large portion of the population. Dietary factors that raise the incidence of obesity, such as high fat, high sucrose and high fructose [Citation4], have high correlations with NAFLD [Citation5]. Along with environmental factors, genetic susceptibility, such as variants in PNPLA3 (patatin-like phospholipase domain containing 3), plays a role in NAFLD [Citation6]. Nevertheless, the detailed mechanisms underlying the development and progression of NAFLD remain poorly understood. Despite research into aspects such as genetic [Citation7], epigenetic [Citation8], transcriptional [Citation9], and post-translational [Citation10] regulation, there seems to be a shortage of studies investigating translational regulation in NAFLD, which hinders our further understanding of this disease.
Although modulations in all stages of translation work together to affect the production of protein, changes controlling translation initiation seem to be critically important [Citation11,Citation12]. Regulation of translation initiation results in the change in the amount of translating mRNAs, which are the mRNAs bound to ribosome-nascent chain complex (RNC-mRNAs) [Citation2]. Thus, translating mRNA could be a cut-in point to study the regulation of translation initiation. With the help of high-throughput RNA-sequencing (RNA-seq), translating mRNA has become the most studied component involved in the stages of translation at a genome-wide level. Ribosome profiling (Ribo-seq), which can monitor the ribosome ‘footprints’ on the translating mRNAs, is a technique that has been widely used [Citation13]. However, despite its advantages, such as detecting the translation initiation sites [Citation14], translational pausing [Citation15], and small open reading frames [Citation15], the abundance of ribosome ‘footprints’ does not represent the amount of translating mRNA, since the former can be affected by the latter, as well as other factors, such as translation elongation speed [Citation16]. In contrast, RNC-mRNA sequencing (RNC-seq) has the ability to probe the global status of translating mRNAs, by separating the translating mRNAs bound by ribosomes from free mRNAs and other cellular components and subsequently performing RNA-seq [Citation2]. Compared to mRNA, the amount of RNC-mRNA is more representative of protein abundance [Citation2,Citation17,Citation18]. Furthermore, the translation ratio (TR) of an mRNA, which is calculated using the abundance ratio of the RNC-mRNA to total mRNA of the gene, can reflect the relative efficiency of translation initiation [Citation2,Citation19,Citation20]. This makes it a practical technique for us to study the initiation state of mRNA translation on a genome-wide scale.
As known, there is no specific drug available for the patients with NAFLD yet [Citation21]. One of the treatments for this disease is using the medicines that target antioxidant activity, such as vitamin E [Citation22]. Lycopene (LYC), which is a non-provitamin A carotenoid, has strong antioxidant activity both in vivo and in vitro that can resist the oxidation of lipids, DNA and proteins [Citation23]. Evidence shows LYC has a protective impact on NAFLD mainly due to its ability of antioxidant [Citation24,Citation25]. In this study, mice fed a high-fat diet (HFD) were used as an animal model of NAFLD, while mice fed HFD mixed with LYC were used to investigate the effect of the antioxidant on the fatty liver. RNA-seq and RNC-seq were performed to assess the status of the transcriptome, as well as to measure the amount undergoing translation. Our results revealed the differences and correlations between the transcriptional and translational control. Additionally, by combining analysis of both sequencing technologies, we were able to screen some known target genes and some new ones for future study.
2. Materials and Methods
2.1. Collection of liver samples
C57BL/6 male mice (8 weeks old) were randomly assigned to the HFD group or the control group. Mice in the HFD group were fed an HFD (45% kcal from fat; MD12032; Jiangsu Medicience Ltd., Jiangsu, China), while those in the control group were fed a normal diet (11.7% kcal% from fat). All mice were housed in a 12 h light/dark environment with free access to food and water with no fasting. They were sacrificed by cervical dislocation after 8 weeks of feeding, and liver tissues were immediately isolated, frozen in liquid nitrogen, and stored at −80°C. The same experimental processes were performed on the mice in the HFD+LYC group, which were fed HFD mixed with LYC (XABC Biotech Co., Ltd., Xi’an, Shaanxi, China) (0.33% w/w), also for 8 weeks. The experimental use of all mice was approved by the Institutional Animal Care and Use Committee of Guangxi University (No. GXU2019-063).
2.2. Hepatic triglyceride (TG) measurement and oil red O staining
TG content of the collected liver samples was measured using an assay kit (Applygen Technology, Inc., Beijing, China), as described previously [Citation26,Citation27]. The TG content was normalized to protein concentration that was determined using a BCA protein quantitative assay kit (P0009; Beyotime Institute of Biotechnology, Shanghai, China).
Liver tissue was prepared into frozen sections, which were stained with Oil Red O (G1016; Wuhan Servicebio Technology Co., Ltd., Wuhan, Hubei, China) for 10 min, and then counter-stained with haematoxylin for 2 min. The slides were viewed at 100× magnification.
2.3. mRNA sequencing and RNC-mRNA sequencing
Three biological replicates from each group were selected to perform the following high-throughput sequencing. Total RNA of a liver sample was extracted using the TRIzol reagent (Ambion, Inc., Austin, TX, USA). RNC isolation was performed in accordance with a previously reported procedure [Citation2], with some modifications. Briefly, 90 mg liver tissue was treated with 200 μl lysis buffer (1% Triton X-100 [GBCBIO Technologies Inc., Guangzhou, Guangdong, China] in ribosome buffer [20 mM HEPES, 2 mM dithiothreitol, 15 mM MgCl2, 200 mM KCl and 100 µg/ml cycloheximide]) and was homogenized. An additional 700 μl lysis buffer was added to the samples, followed by incubation in an ice-bath for 30 min. After centrifuging at 16,200 x g for 20 min at 4°C, supernatants were added to the surface of 5 ml of sucrose buffer (30% sucrose in ribosome buffer), and the RNC complex was pelleted by ultra-centrifugation at 330,000 x g for 3 h at 4°C. RNC-RNA was extracted from the RNC complex using TRIzol. The quality of the total RNA and RNC was detected by electrophoresis using a 2.5% agarose gel. A pooled sample from three independent experiments was used for subsequent RNA-seq assessing mRNA and RNC-RNA.
RNA libraries were prepared according to the protocol of the VAHTS mRNA-seq v.3 Library Prep Kit for Illumina (Vazyme Biotech Co., Ltd, Nanjing, Jiangsu, China), and the raw sequencing reads were generated on an Illumina HiSeq X Ten sequencer.
2.4. Sequence analysis
For both mRNA and RNC-mRNA sequencing data sets, high-quality reads were mapped to RefSeq mRNA reference sequence (mm10 25 March 2017) using the FANSe2 algorithm [Citation28] with the parameters – L80 – E5 – I0 – S14 – B1 – U0. Reads that mapped to alternative splice variants of one gene were merged.
The mRNA and RNC-mRNA in each sample were normalized using rpkM [Citation29], while relative abundance between two groups was normalized using the edgeR package [Citation30]. Differentially expressed mRNA and RNC-mRNA were identified using the edgeR package with a fold-change cut-off of ≥2 and p-value cut-off of <0.05. The TR of a gene of one sample was calculated as previously described: the quotient of the RNC-mRNA rpkM and the mRNA rpkM [Citation2]. Differentially regulated TR was calculated using a t-test with a fold-change cut-off of ≥1.3 and p-value cut-off of <0.05.
2.5. Transient transfection of siRNA
HepG2 cells were maintained in DMEM supplemented with 10% foetal bovine serum at 37°C in 5% CO2. Cells were grown to 80% confluency and transfected with siRNA using Hieff TransTM Liposomal Transfection Regent (40802ES03; Yeasen Biotech Co., Ltd., Shanghai, China). The sequences of the siRNAs were as follows: siRNA-EIF4EBP3: CGCACAAUUUGAAAUGGAC; scrambled siRNA: AAGCGCGCUUUGUAGGAUUC.
2.6. Real-time quantitative reverse-transcription polymerase chain reaction (qRT-PCR)
Total RNA was isolated from cells using a Total RNA Kit I (Omega Bio-tek, Inc., Norcross, GA, USA). cDNA was synthesized by reverse transcription using M-MLV enzyme and the random primer OLIGODT18 according to the manufacturer’s instructions. Real-time qRT-PCR was performed using the GenStar commercial kit (2x RealStar Green Fast Mixture; Takara Bio Inc., Japan). Gene expression levels were determined using β-actin as an internal reference. Each experiment was repeated four times. The forward and reverse primers were as follows: EIF4EBP3: TACGACCGAAAGTTCCTGCTGG and CTCTTCCTCTGTCTCCTGCTCCTTC; β-actin: CGACAGGATGCAGAAGGAGAT and TCAAGAAAGGGTGTAACGCAACTA.
2.7. TG measurement in cells
HepG2 cells were transfected and then cultured in serum-free DMEM containing 200/100 μM OA/PA for 24 h. TG contents were measured using a commercially available assay kit (E1013-105; Applygen Technologies Inc., Beijing, China). The TG contents were normalized to cellular protein concentration per well that was determined using a quantitative protein assay kit (P0009; Beyotime Institute of Biotechnology, Shanghai, China). Each experiment was repeated four times.
2.8. Statistical analysis
Results of experiments are presented as mean ± the standard error of the mean. The Mann–Whitney test was used to determine the significance of the difference between two groups, and p < 0.05 was considered significant.
3. Results
3.1. High-throughput sequencing of transcriptome and translatome
As expected, weekly body weight gain, as well as the final liver weight gain of the mice fed HFDs was higher than the controls (Figure S1A and B). After prolonged feeding, a ~1.6-fold increase was observed in TG levels in the mouse liver of the HFD group relative to the controls (), indicating extensive hepatic lipid deposition, which was also confirmed by the oil red O staining () and the Haematoxylin and Eosin staining (Figure S1C) of the frozen sections. Next, we sought to investigate the gene expression regulation associated with this phenotype at the translatome level.
Figure 1. Overview of genes identified by RNA-seq and RNC-seq. CK: control group; HFD: high-fat diet group. (A) Triglyceride (TG) concentrations in the mouse livers (n = 4). Error bars represent the standard error of the mean. *p < 0.05, the Mann-Whitney test. (B) Oil red O staining of the liver sections in CK and HFD groups, respectively. (C) Venn diagrams of genes identified by RNA-seq and RNC-seq in CK and HFD groups. (D) Correlation between mRNA and RNC-mRNA abundance in the CK and HFD groups. (E) Distribution of the RNC-mRNA abundance in CK and HFD groups. Genes were classified based on their rounded log2 rpkM abundance. Each bar represents the gene count detected by RNC-seq in each category. Every dot represents the percentage of the number of mass spectrometry (MS) quantified proteins to the number of RNC-seq detected genes in each category
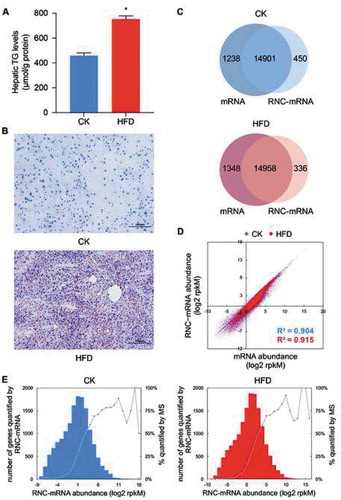
RNA-seq was performed on both mRNA and RNC-mRNA, to assess the transcriptome and translatome in the mouse livers of both the HFD and control groups. Pearson correlation analysis showed high significance of RNA abundance between biological replicates (Figure S1D), suggesting the data were reliable. In general, in both the control and HFD groups, over 16,000 genes were identified by mRNA-seq, and over 15,000 genes were identified by RNC-seq (). While comparing mRNA-seq and RNC-seq datasets, about 14,900 genes overlapped (), indicating that the majority of mRNAs entered the translation process. In keeping with the previous report [Citation2], the average abundance of the RNC-mRNAs showed high correlation with the mRNAs, both in the control and HFD groups (both R2 > 0.9, p < 0.0001; ). The average abundance of RNC-mRNAs in the control and HFD groups were approximately log-normal distributed (). Similar distributions were observed when looking at the abundance of mRNAs (Figure S1E and F). Intriguingly, proteins with higher RNC-mRNA abundance (log2 rpkM [reads per kilobase per million reads] >5) were more easily identified by mass spectrometry (MS), as performed by Liu et al. [Citation31], compared with those with lower RNC-mRNA abundance (). This phenomenon was consistent with a previous study in human cells [Citation2] that showed that RNC-seq is more effective at detecting proteins with low expression levels than MS proteome profiling.
3.2. Differential regulation in the transcriptome and translatome
To identify important functional genes related to the phenotype, differentially expressed mRNAs and RNC-mRNAs (DEmRNAs and DERNCs) were identified using edgeR based on |log2 fold-change| ≥1 and p-values <0.05 (Tables S1 and S2). In total, 212 up-regulated and 172 down-regulated mRNAs were identified (Figure S2A; Table S3), as well as 243 up-regulated and 167 down-regulated RNC-mRNAs (Figure S2B; Table S4). Gene ontology (GO) and Kyoto Encyclopaedia of Genes and Genomes (KEGG) analysis for these DEmRNAs and DERNCs resulted in multiple significantly enriched (p < 0.05) GO terms and KEGG pathways (Figure S2C, D, E, and F), such as the epoxygenase P450 pathway, fatty acid metabolic process, oxidation-reduction process, among others, for the DEmRNAs (Figure S2C) and circadian rhythm, epoxygenase P450 pathway, rhythmic process, among others for the DERNCs (Figure S2D). This indicates that prolonged HFD-induced liver steatosis was involved in many important biological processes and pathways. Further exploring DERNCs’ distribution across chromosomes (the number of DERNCs harboured by chromosomes was normalized based on the length of the respective chromosomes) showed a significant enrichment in chromosome 19 (Chi-square test, p = 2.92 × 10⁻¹⁰; ), which led us to annotate these genes. Intriguingly, GO analysis showed that these genes are mainly associated with epoxygenase P450 pathway, oxidation-reduction process, lipid metabolic process, and so on (). However, why the shortest chromosome, chromosome 19, harboured so many important genes that were expressed differentially at the translatome level remains to be investigated.
Figure 2. Gene expression was differentially regulated at the transcriptome and translatome levels. (A) Left: distribution of differentially expressed RNC-mRNAs (DERNCs) across chromosomes. A heat map showing relative coverage of differentially expressed RNC-mRNAs in each chromosome normalized by length of the respective chromosome. Right: significantly enriched GO biological processes (BPs) by differentially expressed RNC-mRNAs in chromosome 19. (B) Venn diagram of differentially expressed mRNAs (DEmRNAs) and RNC-mRNAs. (C, D) Venn diagrams of significantly enriched GO BPs (C) and KEGG pathways (D) by DEmRNAs and DERNCs. (E, F) Examples showing the different direction of regulation between transcriptome and translatome. Three biological replicate tracks were overlaid into one. Mark1 (E) was down-regulated at the mRNA level but up-regulated at the RNC-mRNA level. While Tram2 (F) was up-regulated at the mRNA level but down-regulated at the RNC-mRNA level
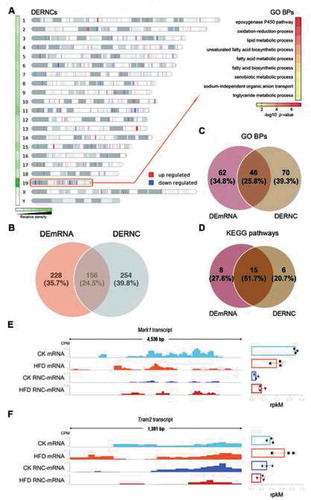
Notably, we noticed that some of the genes were regulated differently at the transcriptome and translatome levels. First, the percentage of the overlap between DEmRNAs and DERNCs was only 24.5% (). Additionally, only 25.8% of GO biological process (BP) terms were overlapping (). For the KEGG pathways analyses, 51.7% of the significantly enriched pathways were shared by both DEmRNAs and DERNCs (). For example, Mark1 demonstrated down-regulated mRNA expression and up-regulated RNC-mRNA expression () in the HFD relative to the control group. Another example showed the opposite situation, where Tram2 mRNA levels were increased, while its RNC-mRNA levels were reduced (). These results revealed that regulation of translation had a relatively independent role in regulating gene expression compared to that of transcription and suggested the possibility that the translational regulation might completely subvert the effects of transcriptional regulation.
3.3. HFD-feeding results in a larger proportion of mRNAs with a decreased TR
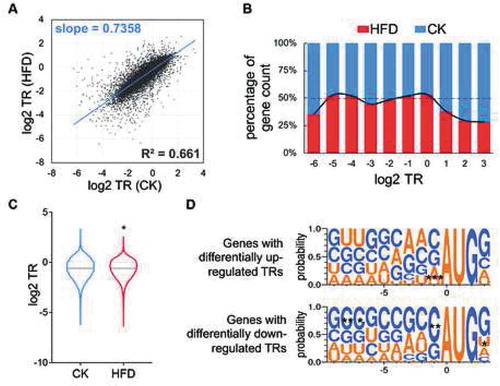
The TR represents the proportion of mRNAs entering the translation process (Table S5). Analysis of genes detected in the mouse livers of HFD and control groups revealed a good correlation between average TRs in these two groups (R2 = 0.661, p < 0.0001; ). However, the slope was less than 1 (slope = 0.7358; ). In other words, generally, when the value of the TR in the control group was getting larger, the growth of the value in the HFD group was less than in the control group. The proportion of genes with higher TRs (log2 TR ≥ 1) in the HFD group was lower than the controls (). Additionally, the mean TR of the HFD group was slightly smaller than in the controls (HFD mean TR (log2) = −0.6024, CK mean TR (log2) = −0.5935, p < 0.05; ). Furthermore, in number, there were 1131 genes with down-regulated TRs (log2 fold change <0), which was a larger number than the genes with up-regulated TRs (log2 fold change >0), in the HFD group compared to the control. All of these findings suggested a slight reduction in the translation ratio when on an HFD.
Figure 3. Distribution of mRNA TRs. CK: control group; HFD: high-fat diet group. (A) Scatter plot of TRs in the CK and HFD groups. (B) Relative TR distribution. Genes were classified based on their rounded log2 TR values. For CK or HFD groups in each category, every bar represents the percentage of the gene counts in this group to the total gene count. (C) Violin plot of TR in CK and HFD groups. *p < 0.05, the Mann-Whitney test. (D) Sequence composition between TR-differentially-up (top) and -down-regulated genes (lower) around the AUG start codon. *p < 0.05, **p < 0.01, *** p < 0.001, Chi-squared test
3.4. Relationship between TR and mRNA abundance or TR and mRNA length
When analysing whether the abundance or length of mRNAs affected the TR, we observed that the TR did not correlate well with mRNA abundance, either in the HFD or the control group (R2 = 0.08 and 0.07, respectively; Figure S3A). The TR correlated weakly with mRNA length in the HFD and control groups (R2 = 0.109 and 0.135, respectively; both p < 0.0001; Figure S3B), and their correlation was negative. Furthermore, fold changes of TRs (HFD/control) and mRNA lengths showed an even weaker correlation (R2 = 0.013; Figure S3C). This indicated that, mRNA abundance and length had little contribution to translational modulation.
3.5. Distinct nucleotide preferences between the genes with differentially up- and down-regulated TRs
The Kozak consensus sequence, which is defined as ‘GCCGCCRCCAUGG’ (R = A or G), plays a major role in translation initiation, especially the ‘G’ at position −6, ‘R’ at position −3 and ‘G’ at position +3 of the sequence (‘A’ of ‘AUG’ is at 0 position) [Citation32–34]. We speculated that it might have an impact on regulation of mRNA TRs. Therefore, we calculated the probabilities of nucleotides around ‘AUG’ start codons of genes with differentially regulated TRs (DRTRs). In the current study, genes with DRTRs were identified with fold change of mean TR > 1.3 and a t-test p value <0.05 (Figure S3D; Table S6). In total, 72 genes with differentially up-regulated (DU-) and 57 genes with differentially down-regulated (DD-) TRs were screened. In genes with non-DRTRs, there was a high probability of the Kozak sequence near the start codons (Figure S3E). In genes with DU- and DD-TRs, the consensus sequence was highly prevalent, especially in those with DD-TRs (). However, comparing the same sites of these two subsets of genes, the consensus nucleotides at position −6, −3 and +3 were not significantly different, whereas the other nucleotides at position −8, −7, −1 and +3 were (). Specifically, for genes with DU-TRs, the probability of ‘A’ at the −1 position was higher than it was in genes with DD-TRs. In genes with DD-TRs, the ‘C’ at position −8, −7 and −1 and the ‘U’ at position +3 had higher probabilities (). The most significantly enriched motifs from HOMER (Hypergeometric Optimization of Motif EnRichment) de novo motif analysis also showed different probabilities between the two subsets of genes around start codons (Figure S3F). These results indicated that upon HFD feeding, regulation of translation initiation in the mouse liver might have different nucleotide preferences in the region around start codon of a gene.
3.6. Correlation between the translational and transcriptional control
Although TR is an artificially defined term, we still can use it to discuss some biological issues. In our study, in comparison of the HFD to the control, if we assume that the relative TR represents degree of regulation of mRNA translation initiation, then regulation of RNC-mRNA abundance will be the result of regulation by the organism at both the transcription and translation initiation levels. As presented in , genes were divided into nine categories based on their fold change of mRNA abundance and TRs (in this case, |log2 fold change| >1 was the cut-off of up- or down-regulation, regardless of p values; log2 fold change of mRNA abundance was calculated using edgeR). We observed that most genes that were up- or down-regulated at the transcriptome level, but ‘unchanged’ (|log2 fold change| <1) in TR, still resulted in DERNCs (, category d and f). Some genes that were ‘unchanged’ in the transcriptome but up- or down-regulated in TR were differentially regulated at the RNC-mRNA level as well (, category b and h). Interestingly, in category e where genes were ‘unchanged’ either at the transcriptome or TR level, the DERNC genes almost all came from those genes with a total |log2 fold change| value greater than one from the two levels. This suggests that both regulation of transcription and translation initiation contributed to the change in abundance of translating mRNAs.
Figure 4. Correlation between transcriptional and translational regulation, in the HFD versus control comparison. (A) Correlation of the fold change of mRNA abundance and TRs. Nine squares indicate nine responsive categories. (B) Correlation of relative mRNA abundance and RNC-mRNA abundance. (C) Relative TR value distribution of differentially regulated mRNAs. ***p < 0.001, the Mann-Whitney test. (D) mRNA fold change value distribution in genes with differentially regulated TRs. ***p < 0.001, the Mann-Whitney test
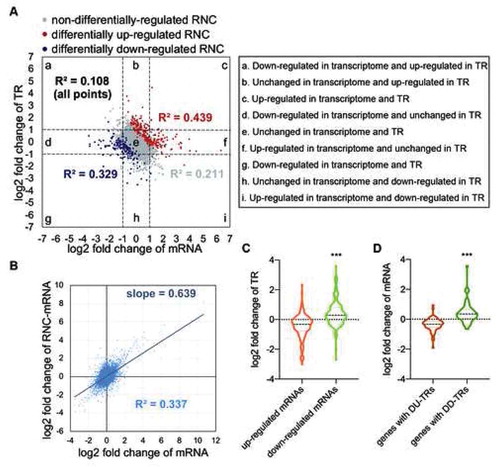
As mentioned, the correlation between TR and mRNA abundance was weak in both the control and HFD group (Figure S3A). However, intriguingly, the correlation between relative TR (calculated based on rpkM) and relative mRNA abundance (calculated based on edgeR) were higher than the non-normalized comparison (R2 = 0.108, p = 3.899 × 10−300; ), in the HFD vs. control comparison. Furthermore, for genes that were regulated differentially at the RNC-mRNA level, these correlations were higher than in genes that were not differentially regulated (R2 = 0.439 and 0.329, p = 6.048 × 10⁻²⁹ and 4.173 × 10⁻¹⁵ in the up- and down-regulated RNC-mRNA genes, respectively, were >0.211 in non-DERNC genes, p < 0.0001; ). This general negative correlation might be related to the inconsistent change rates between relative RNC-mRNA abundance and relative mRNA abundance, as shown in (R2 = 0.337, slope = 0.639 < 1, p < 0.0001). This also indicated that the changes in translation did not catch up with the changes in transcription. In particular, most genes up-regulated at the mRNA level had a smaller TR, while the opposite situation was true in mRNA-differentially-down-regulated genes (). Furthermore, for the majority of genes with DU-TRs and DD-TRs, opposite effects of transcriptional regulation were observed (). These data revealed that in HFD-induced mouse fatty liver, the translational modulation was repressed in comparison to the transcriptional control, which might lead to the weakening of the over-regulation of transcription.
3.7. Relationship between mRNA methylation and translational controls
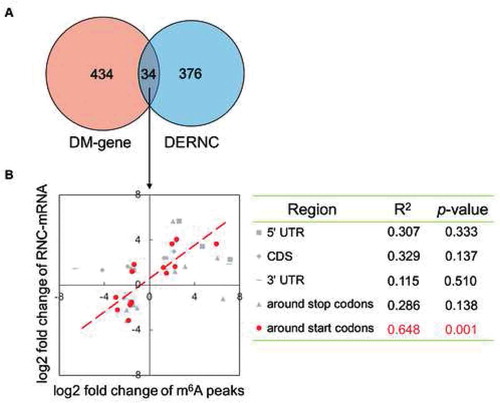
N6-methyladenosine (m6A) is prevalent in mammalian mRNAs and relevant to the regulation of gene expression, as it plays critical roles in RNA alternative splicing, stability, and translation [Citation35]. There is also evidence demonstrating a close relationship between m6A modification and lipid metabolism [Citation36,Citation37]. Thus, we next sought to investigate whether there was a relationship between m6A methylation and translational control in the current study. We used the differentially methylated mRNAs identified in our previous work [Citation38] to interrogate the DERNCs from this study. The results showed that there were 34 shared genes between these two datasets (). We then performed correlation analysis on the fold changes of m6A peaks and fold changes in RNC-mRNA abundance, comparing the HFD vs. control. Notably, when these genes were classified into five categories based on the m6A peaks’ locations (5′ untranslated region [UTR]; around start codons [400 nucleotides centred on the start codon]; coding sequence [CDS]; around stop codons [400 nucleotides centred on the stop codon]; and 3′ UTR), the correlation was a high in genes that had differentially m6A-methylated near start codons (R2 = 0.648, p = 0.001; ), which, furthermore, were significantly enriched in the processes or pathways related to fat metabolism (Figure S4A). In contrast, there was no such a significant correlation for genes that were differentially regulated by m6A-methylation, but not the translation level, in any categories (Figure S4B). This indicated that, at least for this subset of genes, m6A modulation was related to the translational control and the phenotype. However, we noticed that there was also a good correlation between regulation of m6A methylation and transcriptional control in that subset of genes (Figure S4C). Thus, additional data or experiments are needed to distinguish the effects of m6A-methylation and transcriptional controls to the change in abundance of translating mRNA.
Figure 5. Correlation between m6A regulation and translational control, in the comparison of HFD versus control. (A) Venn diagram of differentially m6A methylated genes (DM-genes) and differentially expressed RNC-mRNAs (DERNCs), 34 genes were overlapping. (B) For 34 overlapping genes categorized into 5 transcript segments based on their m6A peaks locations, correlation analysis of fold changes of m6A peaks and fold changes of RNC-mRNA abundance in each category
3.8. RNC-seq performed on the livers of HFD plus LYC-fed mice
It has been reported that LYC, which is an antioxidant, rescues rodents from HFD-induced fatty liver, and may have a protective effect on NAFLD [Citation39,Citation40]. In our study, hepatic TG levels of the mice were decreased upon HFD+LYC feeding, compared to those of HFD-fed mice (). To identify more candidate genes for NAFLD, RNA-seq, as well as RNC-seq were performed on mouse livers in the HFD+LYC group. There were strong correlations between biological replicates both in RNA-seq and RNC-seq datasets (Figure S5A and B). Distributions of mRNA and RNC-mRNA abundance were similar with those in both the control and HFD groups, which were also log-normal-similar distributions (Figure S5C). Intriguingly, in the correlation of relative abundance of mRNAs and RNC-mRNAs, the slope of the HFD+LYC vs. control analysis (Tables S7 and S8) was greater than in the HFD vs. control comparison () and close to 1 (R2 = 0.437, slope = 0.900, p < 0.0001; and C). Furthermore, there was a significant difference between these two slopes (p = 1.65 × 10⁻¹⁷, using univariate analysis of variance; ). This indicated that with supplementation with LYC, the impact of the HFD-induced oxidative stress on the translational control was largely eliminated, suggesting a strong association between translational control and redox signalling.
Figure 6. Performing RNC-seq and RNA-seq on the mouse liver in the HFD+LYC group. CK: control group; HFD: high-fat diet group; HFD+LYC: high-fat diet plus lycopene group. (A) Hepatic TG levels in CK, HFD and HFD+LYC groups (n = 4). *p < 0.05, the Mann-Whitney test. (B) Correlation of the relative mRNA and RNC-mRNA abundance, comparing HFD+LYC with CK. (C) Significance testing of difference between two slopes in the comparisons of HFD vs. CK and HFD+LYC vs. CK, using the univariate analysis of variance. (D) List of screened candidate genes. In comparisons of HFD vs. CK and HFD+LYC vs. HFD, genes with opposite regulation were selected, both at the RNC-mRNA and mRNA levels. (E) Relative level of EIF4EBP3 mRNA expression in HepG2 cells transfected with siRNA, compared to the controls (NC) (n = 4). Error bars represent the standard error of the mean. *p < 0.05, the Mann-Whitney test. (F) Intracellular TG concentration in EIF4EBP3 knockdown cells (n = 4). Error bars represent the standard error of the mean. *p < 0.05, the Mann-Whitney test
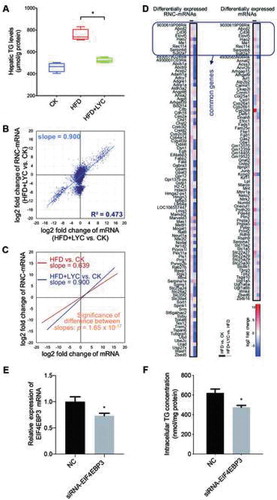
The hepatic TG concentration phenotype showed opposing regulation between HFD vs. control and HFD+LYC vs. HFD comparisons. Based on this observation, we selected shared genes that differentially regulated (|log2 fold-change| ≥1 and p-values <0.05, based on edgeR) in opposite direction from these two comparisons to be highly credible candidate genes (Tables S7, S8, S9 and S10). At the RNC-mRNA level, 95 genes were screened, and at the mRNA level 78 genes were screened (). Among them, only nine genes overlapped, which also indicated distinct regulation of transcription and translation. Additional GO (Figure S5D and E) and KEGG analysis (Figure S5F and G) revealed these genes are involved in many important biological functions or pathways, some of which were annotated to be related with lipid metabolism.
Oxidative stress plays a critical role in hepatic fat deposition induced by an HFD [Citation41,Citation42], and has a link to translational regulation [Citation43,Citation44], which was also seen in our analysis. Hence, translational regulation might be associated with HFD-induced fat deposition in the liver. To test this hypothesis, and more importantly to validate the candidate target gene functions, we, therefore, selected one gene identified at the translatome level, Eif4ebp3 (eukaryotic translation initiation factor 4E binding protein 3), to perform a validation experiment, since it is related to regulation of translation initiation. In HepG2 cells, EIF4EBP3 was knocked down and its mRNA expression was repressed by ~30% (). Correspondingly, the intracellular TG level decreased by ~24% in these EIF4EBP3-knockdown cells (). That provided initial validation of the hypothesis and provided a new potential target gene for fatty liver disease. This will need to be further proved in other models in the future. These data provides verification that RNC-seq is a new strategy to mine functional genes that may be missed at the transcriptional level.
4. Discussion
It is established that protein abundance is a key factor for successful MS identification. In our study, consistent with others [Citation2], there were numerous genes with lower protein expression that were undetectable by the proteomics technique (). However, using RNC-seq, ‘new’ proteins that have not been previously detected could be discovered [Citation45,Citation46]. RNC-seq is also able to identify ‘non-coding RNAs’ that encode peptides [Citation47]. In comparison with mRNAs, translating mRNAs are more representative of protein expression [Citation2,Citation17,Citation18], and by using RNC-seq they can be separated from other free mRNAs, revealing information on protein type and abundance. Hence, to better understand the mechanisms of NAFLD and identify new and valid target genes on a genome-wide scale, RNC-seq provides another layer of analysis in addition to transcriptome, proteome, or other -omic analysis.
In the current study, our results revealed the potential role of translational control may be to weaken the over-regulation of transcription. Additionally, we noticed that only a few genes were regulated in the same direction at the transcription and TR levels (, category c and g). One possible explanation is that, just like the situation in human cells where there are no genes with a high translation initiation efficiency and low elongation speed to prevent a ‘traffic jam’ of ribosomes [Citation20], it is important to avoid an ‘explosion’ of protein production in response to HFD. In other words, there seems to be mechanisms for translational regulation to prevent over-production of genes by fading the effects of transcriptional control. However, specific mechanisms of the phenomenon remain to be investigated. TR fold changes and mRNA lengths did not show good correlation in our study in the comparison of HFD vs. control (Figure S3C). Additionally, changes in mRNA abundance should be length independent. Both of these facts suggested that mRNA length was not related to the correlation between the controls of translation and transcription. Indeed, in the mouse liver, this relationship reflects the adaptation of gene expression in response to HFD feeding.
The Kozak sequence is considered to be important for efficient recognition of the initiation codon by the pre-initiation complex for most genes [Citation48,Citation49]. However, in our study, the signal from the Kozak sequence seemed to be lower in genes with up-regulated TRs than in those with down-regulated TRs as shown in . This might suggest a different mechanism of ribosome scanning for translation initiation. There is a study that reported that, in response to stress, Saccharomyces cerevisiae produced ribosomes lacking Rps26, which increased the translation of genes with weak Kozak sequences [Citation50]. Intriguingly, in our previous study of proteomic analyses of cysteine redox in HFD-fed mouse livers, many cysteines harboured in ribosome proteins, such as RPS3 and RPS6, were differentially oxidized, relative to the control group [Citation51]. Hence, we hypothesize that, in response to an HFD, ribosomes that contain cysteine-oxidized ribosome proteins might have a different impact on translation initiation of transcripts due to nucleotide preferences around the start codons. It would be interesting to verify this conjecture experimentally in the future.
Oxidative stress has been shown to play critical roles in the liver metabolism disorder and has a strong link with NAFLD [Citation52,Citation53]. There are many studies revealing the relationship between oxidative stress and translation regulation [Citation43,Citation44,Citation54]. LYC was reported to reduce HFD-induced oxidative stress and the severity of fatty liver [Citation25,Citation39,Citation40]. We found that upon HFD+LYC, the depressed regulation of translation compared to the transcriptional regulation was largely recovered (). That indicated a link between oxidative stress and translational control. In yeast, it has been shown that oxidative stress raises the mean time of mRNA transit [Citation54], which, to an extent, may be an explanation for the unbalanced rates of change between mRNA and translating mRNA relative abundance in our study.
Supplemental Material
Download Zip (12.6 MB)Acknowledgments
We would like to thank Shenzhen Chi-Biotech Co. Ltd for the support on the RNC-mRNA extraction experiment in terms of method optimization and for their assistance on RNC-mRNA data analysis.
Disclosure statement
The authors declare no conflict of interest.
Data availability
The datasets generated and analysed during the current study are available in the Gene Expression Omnibus database under the accession number GSE146627 (https://www.ncbi.nlm.nih.gov/geo/query/acc.cgi?acc=GSE146627).
Supplementary materials
Supplemental data for this article can be accessed here.
Additional information
Funding
References
- Schwanhausser B, Busse D, Li N, et al. Global quantification of mammalian gene expression control. Nature. 2011;473(7347):337–342.
- Wang T, Cui Y, Jin J, et al. Translating mRNAs strongly correlate to proteins in a multivariate manner and their translation ratios are phenotype specific. Nucleic Acids Res. 2013;41(9):4743–4754. .
- Payne SH. The utility of protein and mRNA correlation. Trends Biochem Sci. 2015;40(1):1–3.
- Asrih M, Jornayvaz FR. Diets and nonalcoholic fatty liver disease: the good and the bad. Clin Nutr. 2014;33(2):186–190.
- Barrera F, George J. The role of diet and nutritional intervention for the management of patients with NAFLD. Clin Liver Dis. 2014;18(1):91–112.
- Sookoian S, Pirola CJ. Genetic predisposition in nonalcoholic fatty liver disease. Clin Mol Hepatol. 2017;23:1–12.
- Mancina RM, Dongiovanni P, Petta S, et al. The MBOAT7-TMC4 variant rs641738 increases risk of nonalcoholic fatty liver disease in individuals of European descent. Gastroenterology. 2016;150(5):1219–1230 e1216.
- Soronen J, Yki-Järvinen H, Zhou Y, et al. Novel hepatic microRNAs upregulated in human nonalcoholic fatty liver disease. Physiol Rep. 2016;4(1):e12661.
- Ryaboshapkina M, Hammar M. Human hepatic gene expression signature of non-alcoholic fatty liver disease progression, a meta-analysis. Sci Rep. 2017;7(1):12361.
- Han Y, Hu Z, Cui A, et al. Post-translational regulation of lipogenesis via AMPK-dependent phosphorylation of insulin-induced gene. Nat Commun. 2019;10(1):623.
- Sonenberg N, Hinnebusch AG. Regulation of translation initiation in eukaryotes: mechanisms and biological targets. Cell. 2009;136(4):731–745.
- Arava Y, Wang Y, Storey JD, et al. Genome-wide analysis of mRNA translation profiles in Saccharomyces cerevisiae. Proc Natl Acad Sci U S A. 2003;100(7):3889–3894.
- Ingolia NT, Ghaemmaghami S, Newman JR, et al. Genome-wide analysis in vivo of translation with nucleotide resolution using ribosome profiling. Science. 2009;324(5924):218–223.
- Michel AM, Andreev DE, Baranov PV. Computational approach for calculating the probability of eukaryotic translation initiation from ribo-seq data that takes into account leaky scanning. BMC Bioinformatics. 2014;15(1):380.
- Woolstenhulme CJ, Guydosh NR, Green R, et al. High-precision analysis of translational pausing by ribosome profiling in bacteria lacking EFP. Cell Rep. 2015;11(1):13–21.
- Zhao J, Qin B, Nikolay R, et al. Translatomics: the global view of translation. Int J Mol Sci. 2019;20. DOI:10.3390/ijms20010212.
- Pradet-Balade B, Boulme F, Beug H, et al. Translation control: bridging the gap between genomics and proteomics? Trends Biochem Sci. 2001;26(4):225–229.
- Greenbaum D, Colangelo C, Williams K, et al. Comparing protein abundance and mRNA expression levels on a genomic scale. Genome Biol. 2003;4(9):117.
- Guo J, Lian X, Zhong J, et al. Length-dependent translation initiation benefits the functional proteome of human cells. Mol Biosyst. 2015;11(2):370–378.
- Lian X, Guo J, Gu W, et al. Genome-wide and experimental resolution of relative translation elongation speed at individual gene level in human cells. PLoS Genet. 2016;12(2):e1005901. .
- European Association for the Study of the Liver (EASL); European Association for the Study of Diabetes (EASD); European Association for the Study of Obesity (EASO). EASL-EASD-EASO Clinical Practice Guidelines for the management of non-alcoholic fatty liver disease. J Hepatol. 2016;64:1388–1402.
- Pacana T, Sanyal AJ. Vitamin e and nonalcoholic fatty liver disease. Curr Opin Clin Nutr Metab Care. 2012;15(6):641–648.
- Mein JR, Lian F, Wang XD. Biological activity of lycopene metabolites: implications for cancer prevention. Nutr Rev. 2008;66:667–683.
- Jiang W, Guo MH, Hai X. Hepatoprotective and antioxidant effects of lycopene on non-alcoholic fatty liver disease in rat. World J Gastroenterol. 2016;22:10180–10188.
- Bahcecioglu IH, Kuzu N, Metin K, et al. Lycopene prevents development of steatohepatitis in experimental nonalcoholic steatohepatitis model induced by high-fat diet. Vet Med Int. 2010;2010:1–8.
- Zhang L, Qi Y, Aluo Z, et al. Betaine increases mitochondrial content and improves hepatic lipid metabolism. Food Funct. 2019;10(1):216–223.
- Qi Y, Zhang Z, Liu S, et al. Zinc supplementation alleviates lipid and glucose metabolic disorders induced by a high-fat diet. J Agric Food Chem. 2020;68(18):5189–5200.
- Xiao CL, Mai ZB, Lian XL, et al. FANSe2: a robust and cost-efficient alignment tool for quantitative next-generation sequencing applications. PLoS One. 2014;9:e94250.
- Mortazavi A, Williams BA, McCue K, et al. Mapping and quantifying mammalian transcriptomes by RNA-Seq. Nat Methods. 2008;5(7):621–628.
- Robinson MD, McCarthy DJ, Smyth GK. Edger: a Bioconductor package for differential expression analysis of digital gene expression data. Bioinformatics. 2010;26(1):139–140.
- Liu M, Ge R, Liu W, et al. Differential proteomics profiling identifies LDPs and biological functions in high-fat diet-induced fatty livers. J Lipid Res. 2017;58(4):681–694.
- De Angioletti M, Lacerra G, Sabato V, et al. Beta+45 G C: a novel silent beta-thalassaemia mutation, the first in the Kozak sequence. Br J Haematol. 2004;124(2):224–231.
- Kozak M. An analysis of 5ʹ-noncoding sequences from 699 vertebrate messenger RNAs. Nucleic Acids Res. 1987;15(20):8125–8148.
- Kozak M. Pushing the limits of the scanning mechanism for initiation of translation. Gene. 2002;299:1–34.
- Frye M, Harada BT, Behm M, et al. RNA modifications modulate gene expression during development. Science. 2018;361(6409):1346–1349.
- Zhong X, Yu J, Frazier K, et al. Circadian clock regulation of hepatic lipid metabolism by modulation of m(6)A mRNA methylation. Cell Rep. 2018;25(7):1816–1828 e1814.
- Lu N, Li X, Yu J, et al. Curcumin attenuates lipopolysaccharide-induced hepatic lipid metabolism disorder by modification of m6A RNA methylation in piglets. Lipids. 2018;53(1):53–63.
- Luo Z, Zhang Z, Tai L, et al. Comprehensive analysis of differences of N 6-methyladenosine RNA methylomes between high-fat-fed and normal mouse livers. Epigenomics. 2019;11(11):1267–1282.
- Ahn J, Lee H, Jung CH, et al. Lycopene inhibits hepatic steatosis via microRNA-21-induced downregulation of fatty acid-binding protein 7 in mice fed a high-fat diet. Mol Nutr Food Res. 2012;56(11):1665–1674.
- Pina-Zentella RM, Rosado JL, Gallegos-Corona MA, et al. Lycopene improves diet-mediated recuperation in rat model of nonalcoholic fatty liver disease. J Med Food. 2016;19:607–614.
- Milagro FI, Campion J, Martinez JA. Weight gain induced by high-fat feeding involves increased liver oxidative stress. Obesity (Silver Spring). 2006;14:1118–1123.
- Nassar AL, Marot LP, Ovidio PP, et al. Oxidative stress and fatty acid profile in Wistar rats subjected to acute food restriction and refeeding with high-fat diets. Acta Cir Bras. 2014;29:178–185.
- Gerashchenko MV, Lobanov AV, Gladyshev VN. Genome-wide ribosome profiling reveals complex translational regulation in response to oxidative stress. Proc Natl Acad Sci U S A. 2012;109(43):17394–17399.
- Vogel C, Silva GM, Marcotte EM. Protein expression regulation under oxidative stress. Mol Cell Proteomics. 2011;10:M111 009217.
- Zhang G, Wang T, He Q. How to discover new proteins—translatome profiling. Sci China. 2014;57:358–360.
- Zhong J, Cui Y, Guo J, et al. Resolving chromosome-centric human proteome with translating mRNA analysis: a strategic demonstration. J Proteome Res. 2014;13(1):50–59.
- Zhang M, Zhao K, Xu X, et al. A peptide encoded by circular form of LINC-PINT suppresses oncogenic transcriptional elongation in glioblastoma. Nat Commun. 2018;9(1):4475.
- Kozak M. Compilation and analysis of sequences upstream from the translational start site in eukaryotic mRNAs. Nucleic Acids Res. 1984;12(2):857–872.
- Kozak M. Point mutations define a sequence flanking the AUG initiator codon that modulates translation by eukaryotic ribosomes. Cell. 1986;44(2):283–292.
- Ferretti MB, Ghalei H, Ward EA, et al. Rps26 directs mRNA-specific translation by recognition of Kozak sequence elements. Nat Struct Mol Biol. 2017;24(9):700–707.
- Li Y, Luo Z, Wu X, et al. Proteomic analyses of cysteine redox in high-fat-fed and fasted mouse livers: implications for liver metabolic homeostasis. J Proteome Res. 2018;17(1):129–140.
- Gambino R, Musso G, Cassader M. Redox balance in the pathogenesis of nonalcoholic fatty liver disease: mechanisms and therapeutic opportunities. Antioxid Redox Signal. 2011;15(5):1325–1365.
- Masarone M, Rosato V, Dallio M, et al. Role of oxidative stress in pathophysiology of nonalcoholic fatty liver disease. Oxid Med Cell Longev. 2018;2018:9547613.
- Shenton D, Smirnova JB, Selley JN, et al. Global translational responses to oxidative stress impact upon multiple levels of protein synthesis. J Biol Chem. 2006;281(39):29011–29021.