
ABSTRACT
The participation of long noncoding RNAs (lncRNAs) and microRNAs (miRs) in the progression of rheumatoid arthritis (RA) is a key area of investigation. The current study aimed to investigate the action of lncRNA nuclear paraspeckle assembly transcript 1 (NEAT1) in fibroblast-like synoviocyte (FLS) proliferation and synovitis in RA. A rat model of RA was established. LncRNA NEAT1 expression in the synovial tissues of patients with RA and FLSs from the RA rat model was determined using RT-qPCR. Next, dual luciferase reporter gene assay was applied to investigate the relationship between miR-129/204 and mitogen-activated protein kinase (MAPK)/extracellular regulated protein kinase (ERK). A putative binding relationship between miR-204 and lncRNA NEAT1 was evaluated by RIP assay, and miR-129 promoter methylation was determined using MSP. After the expression of lncRNA NEAT1, miR-129 or miR-204 was altered in FLSs, the extent of ERK1/2 phosphorylation was assessed. In addition, FLS synovitis and proliferation were determined by ELISA and EdU assay, respectively. In RA rats, lncRNA NEAT1 was silenced and miR-129/miR-204 was overexpressed to explore their roles in vivo. LncRNA NEAT1 was upregulated, while miR-129 and miR-204 were downregulated in RA synovial tissues and FLSs. MAPK1 was target gene of both miR-129 and miR-204. LncRNA NEAT1 bound to miR-204 and promoted miR-129 promoter methylation. Silencing lncRNA NEAT1 or overexpressing miR-129/miR-204 enhanced miR-129/miR-204 expression, but reduced the extent of ERK1/2 phosphorylation, proliferation of FLSs, and synovitis in RA. Collectively, silencing lncRNA NEAT1 promoted miR-129 and miR-204 to inhibit the MAPK/ERK signalling pathway, reducing FLS synovitis in RA.
Abbreviations: ACR: American College of Rheumatology; ELISA: Enzyme-linked immunosorbent assay; ERK: extracellular signal-regulated kinase; FLS: fibroblast-like synoviocyte; GADPH: glyceraldehyde-3-phosphate dehydrogenase; HRP: horseradish peroxidase; IFA: Incomplete Freund’s Adjuvant; lncRNAs: long noncoding RNAs; MSP: Methylation-specific PCR; NC: negative control; NEAT1: nuclear paraspeckle assembly transcript 1; OD: optical density; RA: rheumatoid arthritis; RIPA: Radio Immunoprecipitation Assay; RLU: relative light units; RT-qPCR: reverse transcription quantitative polymerase chain reaction; UTR: untranslated region.
Introduction
Rheumatoid arthritis (RA) is characterized as an inflammatory, chronic and autoimmune disorder, which chiefly affects the joints [Citation1]. RA has a prevalence of about 5 per 1,000 adults worldwide and can lead to severe joint damage, disability, inability to work, and increased mortality [Citation2]. Major risk factors for RA include age, female gender, silica exposure, tobacco use, and obesity [Citation3]. It has also been proposed that a high-risk genetic background, together with epigenetic markers and specific environmental exposures can contribute to synovitis and subsequent destructive arthritis [Citation4]. Synovial leukocyte infiltration and fibroblast-like synoviocyte (FLS) expansion are implicated in key pathological progress of RA, and elucidating their roles has drawn significant research attention [Citation5]. Notably, despite advances in treatment, a considerable number of patients with RA remain unremitted, which underscores the necessity to study detailed molecular mechanisms underlying RA and identify potential therapeutic targets [Citation6].
In the past few years, accruing evidence has shown that aberrant expression patterns of long noncoding RNAs (lncRNAs) are implicated in the etiopathogenesis of autoimmune diseases, including RA [Citation7,Citation8]. LncRNA nuclear paraspeckle assembly transcript 1 (NEAT1), located at chromosome 11q13.1, has six transcripts [Citation9]. Accumulating evidence has indicated that lncRNA NEAT1 is relevant to the development of various cancers including glioma, colon cancer, melanoma, and human gastrointestinal stromal tumours [Citation10–13]. Notably, a previous study that researched lncRNA NEAT1 in RA found a significant upregulation of lncRNA NEAT1 in peripheral blood mononuclear cells in RA [Citation14].
It has been identified that lncRNA NEAT1 can regulate microRNA-129 (miR-129) and miR-204. LncRNA NEAT1 promotes promoter methylation of miR-129-5p and inhibits its expression in breast cancer [Citation15]. Also, lncRNA NEAT1 can target and downregulate miR-204 in sepsis-induced acute kidney injury [Citation16]. In addition, miR-129-3p has been observed to be downregulated in RA synovial fluid [Citation17]. The inhibitory role of miR-204 has also been observed in RA [Citation18]. Based on the aforementioned evidence, it was hypothesized that lncRNA NEAT1 potentially participated in RA progression by regulating miR-129 and miR-204. Hence, we aimed to explore the influence of lncRNA NEAT1, miR-129, and miR-204 specifically on the proliferation of FLSs and synovitis in RA.
Results
LncRNA NEAT1 is overexpressed in patients and rats with RA
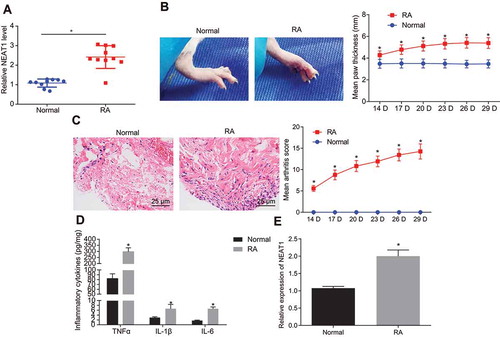
Synovial tissues were collected from patients with RA and healthy control subjects. The expression of lncRNA NEAT1 was measured () and it was found that as compared with the normal synovial tissues, lncRNA NEAT1 expression was significantly upregulated in RA synovial tissues. The RA rat model was then established and evaluated by observing the degree of joint swelling () and synovial inflammatory infiltration () using haematoxylin-eosin (HE) staining. The paw thickness of control rats was normal, the joint was not swollen and deformed, and there was no inflammatory infiltration in normal synovial tissues. Compared with the normal rats, the paw thickness increased significantly, severe swelling occurred at the joint, and a large sized inflammatory infiltrate was evident in synovial tissues of RA rats, suggesting that RA rats were successfully modelled. FLSs were isolated, and using enzyme-linked immunosorbent assay (ELISA) () and reverse transcription quantitative polymerase chain reaction (RT-qPCR) (), it was found that as compared with FLSs of normal tissues, FLSs of RA tissues showed significantly higher levels of tumour necrosis factor-α (TNF-α), interleukin (IL)-1β and IL-6 and lncRNA NEAT1.
Figure 1. The patients and rats with RA show higher expression of lncRNA NEAT1. (A) LncRNA NEAT1 expression in RA and normal synovial tissues determined by RT-qPCR. (B) Joints of RA and normal rats and paw thickness of normal and RA rats. (C) HE staining images of synovial tissues of normal and RA rats and arthritis score of normal and RA rats (× 400). (D) ELISA to analyse the levels of inflammatory factors in normal and RA rats. (E) RT-qPCR to determine the expression of lncRNA NEAT1 in normal and RA rats. * p < 0.05 vs. the normal rats. The data were expressed as mean ± standard deviation and analysed using unpaired t-test and repeated measures analysis of variance. The experiment was repeated three times independently
Inhibition of lncRNA NEAT1 blocks FLS proliferation and attenuates synovitis in RA
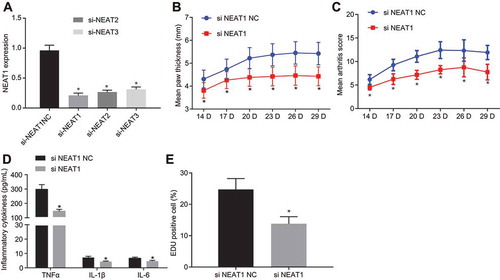
To study the influence of NEAT1 on RA, we isolated and cultured FLSs (Supplementary Fig. 1A, B) and the expression of lncRNA NEAT1 was knocked down. RT-qPCR () indicated that the expression of lncRNA NEAT1 was reduced after the delivery of small interfering RNA (siRNA) targeting lncRNA NEAT1 (si-NEAT1)-1, which was selected for subsequent experiments. The degree of joint swelling () was scored and synovial inflammatory infiltration () was observed using HE staining. Marked swelling in the soles, severe swelling and deformity in the joints, and a large inflammatory infiltrate in the synovial tissue of RA rats treated with negative control for siRNA (si-NC) were noted, while paw thickness and degree of swelling degree in arthritis reduced in rats treated with si-NEAT1. FLSs were isolated, and using ELISA () and -ethynyl-20-deoxyuridine (EdU) assay (), it was evidenced that TNF-α, IL-1β and IL-6 levels in the culture medium supernatant and cell proliferation were significantly lowered upon treatment with si-NEAT1. These results suggested that silencing lncRNA NEAT1 inhibited FLS proliferation and synovitis in RA.
Figure 2. Synovial cell proliferation and synovitis are inhibited upon silencing lncRNA NEAT1 in RA. (A) RT-qPCR analysis of lncRNA NEAT1 expression in FLSs treated with si-NC and si-NEAT1. (B) Paw thickness of rats treated with si-NC and si-NEAT1. (C) HE staining of arthritis score of rats treated with si-NC and si-NEAT1. (D) ELISA to analyse TNF-α, IL-1β and IL-6 levels in FLSs of rats treated with si-NC and si-NEAT1. (E) FLS proliferation in rats treated with si-NC and si-NEAT1 determined by EdU assay. H, The proportion of EdU-positive cells. * p < 0.05 vs. the si-NC treatment. The data were expressed as mean ± standard deviation and analysed using unpaired t-test and repeated measures analysis of variance. The experiment was repeated three times independently
Silencing lncRNA NEAT1 inhibits FLS proliferation and synovitis through inactivation of the mitogen-activated protein kinase (MAPK)/extracellular signal-regulated kinase (ERK) signalling pathway
To investigate the mechanisms underlying lncRNA NEAT1-mediated regulation of RA, we decided to explore the involvement of possible signalling pathways. In RA, MAPK is reported to be involved in the inflammation [Citation19] and the MAPK/ERK signalling pathway is implicated in mediating FLS proliferation [Citation20]. Therefore, we addressed the involvement of the MAPK/ERK signalling pathway in mediating the effect of lncRNA NEAT1 on RA. RT-qPCR and Western blot analysis (, B) showed no obvious difference in ERK1/2 and P38 MAPK expression between patients with RA and normal controls, while the extents of ERK1/2 and P38 MAPK phosphorylation were significantly higher in synovial tissues of patients with RA, suggesting an activation of the MAPK/ERK pathway in RA. ELISA () and EdU assay () showed that TNF-α, IL-1β and IL-6 levels in the culture medium supernatant were significantly raised, and FLS proliferation increased upon treatment with oe-NEAT1. Levels of TNF-α, IL-1β, and IL-6 decreased significantly, while FLS proliferation significantly decreased by phosphorylated ERK1/2 inhibitor (U0126) or phosphorylated P38 inhibitor (SB203580), the effects of which were abrogated by treatment with oe-NEAT1. Gene expression related to lncRNA NEAT1 and the MAPK/ERK signalling pathway was examined using RT-qPCR and Western blot analysis (, F). Compared with FLSs treated with oe-NC, lncRNA NEAT1 expression was increased, while the extents of ERK1/2 and P38 MAPK phosphorylation were also higher in FLSs treated with oe-NEAT1, but no significant difference in ERK1/2 and P38 MAPK expression was noted. Compared with FLSs treated with dimethylsulfoxide (DMSO), lncRNA NEAT1 and ERK1/2 expression levels did not differ significantly, while the extent of ERK1/2 phosphorylation was significantly lowered in FLSs treated with U0126. In FLSs treated with oe-NEAT1 + U0126, lncRNA NEAT1 expression was increased, while the extent of ERK1/2 phosphorylation and the expression of ERK1/2 did not differ significantly. Relative to treatment with DMSO, SB2035809 treatment led to no significant differences in lncRNA NEAT1 and P38 expression but resulted in significantly diminished extent of P38 phosphorylation in FLSs; lncRNA NEAT1 expression was significantly elevated while the extent of P38 MAPK phosphorylation and P38 expression did not differ significantly in the presence of phosphorylated P38 MAPK inhibitor SB2035809 + oe-NEAT1. These data indicated that inhibiting lncRNA NEAT1 reduced FLS proliferation and synovitis through the MAPK/ERK signalling pathway.
Figure 3. Inhibition of lncRNA NEAT1 suppresses FLS proliferation and synovitis through inactivation of the MAPK/ERK signalling pathway. (A) RT-qPCR analysis of ERK1/2 expression in synovial tissues of normal control subjects and patients with RA. (B) Western blot analysis of ERK1/2 and P38 MAPK expression and phosphorylation level of ERK1/2 and P38 MAPK normalized to GAPDH in synovial tissues of normal control subjects and patients with RA. * p < 0.05 vs. normal synovial tissues. (C) ELISA assays for TNF-α, IL-1β and IL-6 levels in FLS upon lncRNA NEAT1 overexpression and MAPK/ERK inhibition. (D) FLS proliferation upon lncRNA NEAT1 overexpression and MAPK/ERK inhibition determined by EdU assay. (E) RT-qPCR determination of lncRNA NEAT1 and ERK1/2 expression after lncRNA NEAT1 overexpression and MAPK/ERK inhibition in FLSs. (F) Western blot analysis of ERK1/2 and P38 MAPK expression and extent of ERK1/2 and P38 MAPK phosphorylation normalized to GAPDH in FLSs after lncRNA NEAT1 overexpression and MAPK/ERK inhibition. * p < 0.05 vs. the oe-NC treatment; # p < 0.05 vs. the DMSO treatment, @ p < 0.05 vs. the phosphorylated ERK1/2 inhibitor, & p < 0.05 vs. the phosphorylated P38 inhibitor. The data were expressed as mean ± standard deviation and analysed using one-way analysis of variance. The experiment was repeated three times independently
LncRNA NEAT1 regulates the MAPK/ERK signalling pathway by inhibiting the expression of miR-129 and miR-204
Using online prediction software, we identified that miR-129/miR-204 could target MAPK1 (, B). A dual luciferase reporter gene assay further validated the targeting relationship between miR-129/miR-204 and MAPK1 (, D). Co-transfection of miR-129 mimic or miR-204 mimic decreased luciferase activity of MAPK1-wide type (WT), but had no influence on the luciferase activity of MAPK1-mutant type (MUT), suggesting the targeting regulatory relationship between miR-129/miR-204 and MAPK1.
Figure 4. LncRNA NEAT1 inhibits the expression of miR-129 and miR-204 to activate the MAPK/ERK signalling pathway. (A) Binding sites between miR-129 and MAPK1 and mutated site sequences of MAPK1 3ʹ-UTR. (B) Binding sites between miR-204 and MAPK1 and mutated site sequences of MAPK1 3ʹ-UTR. (C) Targeting relationship between miR-129 and MAPK1 detected by dual luciferase reporter gene assay. (D) Targeting relationship between miR-204 and MAPK1 luciferase activity detected by dual luciferase reporter gene assay. * p < 0.05 vs. the NC treatment. (E) RIP assay to detect the binding of lncRNA NEAT1 to miR-204 and miR-129, * p < 0.05 vs. IgG. (F) The expression of miR-129 and miR-204 in synovial tissues of normal control subjects and patients with RA determined by RT-qPCR. (G) The expression of miR-129 and miR-204 in FLSs after overexpressing lncRNA NEAT1 determined by RT-qPCR. * p < 0.05 vs. FLSs treated with oe-NC. (H) ELISA to analyse TNF-α, IL-1β and IL-6 levels in FLSs after inhibition of miR-129 or miR-204. * p < 0.05 vs. FLSs treated with inhibitor NC, # p < 0.05 vs. FLSs treated with si-NEAT1 + inhibitor NC. (I) FLS proliferation upon inhibition of miR-129 or miR-204 detected by EdU assay. * p < 0.05 vs. FLSs treated with inhibitor NC, # p < 0.05 vs. FLSs treated with si-NEAT1 + inhibitor NC. (J) Western blot analysis of ERK1/2 and P38 MAPK expression and the extent of ERK1/2 and P38 MAPK phosphorylation normalized to GAPDH in FLSs upon inhibition of miR-129 or miR-204. * p < 0.05 vs. FLSs treated with inhibitor NC, # p < 0.05 vs. FLSs treated with si-NEAT1 + inhibitor NC. (K) Prediction of the enrichment of CpG islands in the promoter of miR-129 by MethPrimer. (L) The methylation level of the promoter of miR-129 determined by MSP. (M) The methylation level of the promoter of miR-129 determined by BSP. (N) The expression of miR-129 in FLSs upon silencing lncRNA NEAT1 determined by RT-qPCR. * p < 0.05 vs. FLS treated with si-NEAT1. (O) Correlation analysis of lncRNA NEAT1 and miR-129. (P) Correlation analysis of lncRNA NEAT1 and miR-204. The data were expressed as mean ± standard deviation and analysed using unpaired t-test. Comparison between multiple groups was made by one-way analysis of variance, and Pearson’s correlation analysis was applied to determine strength of correlation. The experiment was repeated three times independently
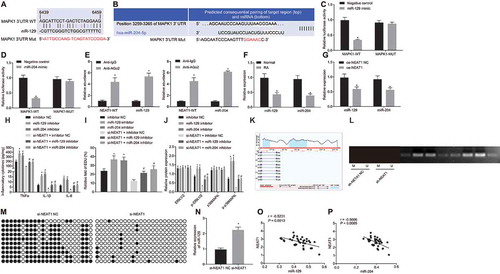
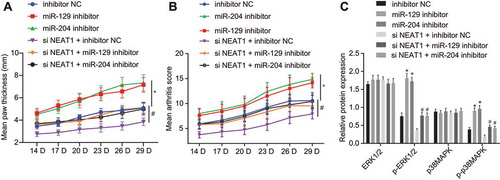
Figure 5. Silencing lncRNA NEAT1 suppresses the expression of miR-129 and miR-204 to inhibit FLS proliferation and synovitis in RA rats. (A) The thickness of rat paws upon inhibition of miR-129 or miR-204. (B) Arthritis score of rats upon inhibition of miR-129 or miR-204. (C) Western blot analysis of ERK1/2 and P38 MAPK expression and the extent of ERK1/2 and P38 MAPK phosphorylation normalized to GAPDH in synovial tissues upon inhibition of miR-129 or miR-204 and overexpression of LncRNA NEAT1. * p < 0.05 vs. rats treated with inhibitor NC. The data were expressed as mean ± standard deviation and analysed using one-way analysis of variance and repeated measures analysis of variance. The experiment was repeated three times independently
RNA immunoprecipitation (RIP) () revealed that miR-129, miR-204, and lncRNA NEAT1 could be precipitated by Argonaute 2 (AGO2) antibody. The expression of miR-129 and miR-204 in synovial tissues was determined by RT-qPCR (). Compared with normal tissues, the expression levels of miR-129 and miR-204 in RA synovial tissues were significantly downregulated. In addition, overexpression of lncRNA NEAT1 in FLSs could decrease the levels of miR-129 and miR-204 (). ELISA () and EdU assay () were conducted to verify the effects of miR-129 and miR-204 on FLS proliferation and synovitis. TNF-α, IL-1β and IL-6 levels were increased significantly, and proliferation was significantly augmented in FLSs treated with miR-129 inhibitor or miR-204 inhibitor. When lncRNA NEAT1 was silenced, TNF-α, IL-1β and IL-6 levels were elevated and the number of proliferative cells was increased in response to miR-204 inhibitor or miR-129 inhibitor. Western blot analysis () showed the extents of ERK1/2 and P38 MAPK phosphorylation were increased in rats treated with miR-129 inhibitor or miR-204 inhibitor while no significant difference was noted in expression of ERK1/2 and P38 MAPK.
Using the online tool MethPrimer (http://www.urogene.org/cgi-bin/methprimer/methprimer.cgi), we found that there was a CpG island enrichment region in the promoter region of miR-129 (). The methylation status of the promoter of miR-129 after silencing lncRNA NEAT1 (, M) was determined by methylation-specific PCR (MSP) and bisulphite sequencing PCR assays. As compared with FLSs treated with sh-NC, the methylation of the promoter region of miR-129 was significantly decreased in FLSs treated with si-NEAT1. RT-qPCR was performed to determine miR-129 expression after silencing lncRNA NEAT1 () and results revealed significant upregulation of miR-129 in response to silencing lncRNA NEAT1. These findings suggested that silencing lncRNA NEAT1 upregulated miR-129 by inhibiting promoter methylation of miR-129. Thereafter, the correlation of lncRNA NEAT1 with miR-129 and miR-204 in synovial tissues was analysed using RT-qPCR. LncRNA NEAT1 was negatively correlated with miR-129 and miR-204 (, P). These findings together demonstrated that lncRNA NEAT1 promoted FLS proliferation and synovitis in RA by activating MAPK/ERK signalling by promoting methylation of miR-129 and downregulation of miR-204.
Silencing lncRNA NEAT1 inhibits FLS proliferation and synovitis by enhancing the expression of miR-129 and miR-204 in RA rats
We examined the effects of lncRNA NEAT1, miR-129 and miR-204 on FLS proliferation and synovitis in rats. The degree of joint swelling (, Supplementary Fig. 2A) was scored and the degree of synovial inflammatory infiltration (, Supplementary Fig. 2B) was observed after HE staining. The paw of rats from FLSs treated with inhibitor NC showed obvious and severe swelling and deformity at the joint, with a large inflammatory infiltrate in synovial tissues. The paw thickness and degree of swelling in arthritis were significantly aggravated in rats treated with miR-129 inhibitor or miR-204 inhibitor. Silencing lncRNA NEAT1 significantly reduced the paw thickness and swelling whereas the addition of miR-129 inhibitor or miR-204 inhibitor reversed these results. The expression of the MAPK/ERK signalling pathway-related factors in synovial tissues was measured using Western blot analysis (). The results showed that the extents of ERK1/2 and P38 phosphorylation were significantly increased upon miR-129 inhibitor or miR-204 inhibitor, along with no significant difference in expression of ERK1/2 and P38 MAPK. In the presence of si-NEAT1, the extents of ERK1/2 and P38 phosphorylation were restored by delivery of miR-129 inhibitor or miR-204 inhibitor but the expression of ERK1/2 and P38 MAPK did not differ significantly. These results demonstrated that lncRNA NEAT1 promoted RA progression by inhibiting the expression of miR-129 and miR-204 by activating the MAPK/ERK signalling pathway.
Discussion
As an autoimmune disease, RA affects about 1.0% of the general population, yet its aetiology remains incompletely understood [Citation21]. Recently, the dysregulation of lncRNAs and their role in RA pathogenesis have attracted research focus and could be crucial to understand and treatment for RA [Citation22]. In this study, we investigated the role of lncRNA NEAT1 in FLS proliferation and synovitis in RA. Chiefly, we demonstrated that silencing lncRNA NEAT1 could upregulate miR-129 and miR-204 to inactivate the MAPK/ERK signalling pathway, and thus reduce FLS proliferation and synovitis in RA.
Our initial findings showed lncRNA NEAT1 was overexpressed in both RA synovial tissues and FLSs. LncRNA NEAT1 is a considerable component of paraspeckles, which has been regarded as a novel form of the nuclear compartment [Citation23]. Consistent with our findings, lncRNA NEAT1 has been found to be upregulated in RA blood mononuclear cells and blood exosomes [Citation24]. FLSs are key effector cells in RA, which have attracted increasing attention in context of RA pathogenesis [Citation25]. Here, we showed that silencing lncRNA NEAT1 could inhibit FLS proliferation and synovitis in RA. A previous study reported that lncRNA NEAT1 expression was increased in peripheral blood mononuclear cells in RA, and found knockdown of lncRNA NEAT1 suppressed CD4+ T cell differentiation into Th17 cells when lenti-siRNA-lncRNA NEAT1 was injected into RA mice [Citation14]. In addition, silencing lncRNA NEAT1 was found to suppress cell proliferation and stimulate apoptosis of cells in laryngeal squamous cell cancer [Citation26]. Furthermore, our study also identified that lncRNA NEAT1 negatively regulated miR-129 and miR-204, both of which were downregulated in RA. In agreement, a prior study noted that lncRNA NEAT1 negatively targeted miR-204 in retinoblastoma, and thus, regulated tumour progression [Citation27]. Negative correlation between lncRNA NEAT1 and miR-129-5p was also noted in hepatocellular carcinoma [Citation28]. A study by Tsai et al. revealed low miR-129-3p expression in RA synovial fluid [Citation17]. Moreover, miR-204 was found negatively regulated by hsa_circ_0001859 overexpression, which stimulated RA [Citation18]. These reports support our conclusion that silencing lncRNA NEAT1 attenuates RA by inhibiting FLS proliferation and synovitis via upregulation of miR-129 and miR-204.
Another interesting finding in our study was that MAPK1 was a target gene of both miR-129 and miR-204. A previous study documented that miR-129 could target both MAPK1 and MAPK3, which supports our findings [Citation29]. Others have noted miR-129 could suppress the occurrence and progression of epilepsy via c-Fos downregulation and inactivation of the MAPK signalling pathway [Citation30]. These reports support the notion that lncRNA NEAT1 could regulate the MAPK signalling pathway. It has also been noted that Solamargine can inhibit gastric cancer through the mediation of lncRNA NEAT1_2 via the MAPK signalling pathway [Citation31]. LncRNA NEAT1 knockdown can also suppress the Ras-MAPK signalling pathway in nasopharyngeal carcinoma cells [Citation32]. In addition, lncRNA NEAT1 is reportedly involved in toll-like receptor4-mediated inflammatory responses through regulating the activation of the late MAPK signalling pathway [Citation33]. Inhibition of the ERK and P38 MAPK signalling pathway could inhibit inflammatory responses in RA [Citation34]. Moreover, upon inactivation of the MAPK/nuclear factor kappa-B pathways, the proliferation, migration, invasion, and inflammation of human FLSs in RA were blocked [Citation35]. Another study showed inhibition of the MAPK signalling pathway caused by andrographolide suppressed synovial cell proliferation and synovial inflammation in RA [Citation36].
Collectively, the present study demonstrated that silencing lncRNA NEAT1 suppressed FLS proliferation and synovitis via the MAPK/ERK signalling pathway by increasing miR-129 and miR-204 expression. These findings indicate lncRNA NEAT1, miR-129, miR-204, and MAPK/ERK may be candidate possible therapeutic targets in RA and advances our understanding of RA pathogenesis.
Materials and methods
Ethics statement
All included patients provided signed informed consent. The experimental protocol was implemented following the ratification of the Ethics Committee of The Affiliated Hospital of Southwest Medical University by conforming to the Declaration of Helsinki. All animal experiments were aligned with the directives announced by the Ministry of Science and Technology of the People’s Republic of China. Care was taken to minimize the suffering and numbers of the experimental animals as far as possible.
Tissue collection
Ten patients with RA who underwent arthroscopic biopsy or total arthroplasty from January–October 2018 to August 2019 in The Affiliated Hospital of Southwest Medical University were randomly selected. The 10 patients with RA included 3 males and 7 females, aged from 48 to 66 years (mean age: 55.10 ± 6.42 years). The duration of RA in these patients ranged from 3 to 7 years. All patients with RA had been assigned a definitive clinical diagnosis under an arthroscope, which met the criteria of the American College of Rheumatology for RA classification, 1987. Peripheral blood samples of patients with RA were collected as the experimental group. During routine arthroscopic examination or open joint surgery, 10 patients with joint trauma, including 4 males and 6 females, provided control synovial tissue samples. The excisional tissues were immediately preserved in liquid nitrogen and stored for subsequent RT-qPCR analysis [Citation37].
RNA isolation and quantitation
Subsequent to total RNA extraction by Trizol (15596026, Invitrogen, Carlsbad, CA, USA), a Nano-Drop ND-1000 spectrophotometer was employed for measurement of RNA concentration and purity. Using a PrimeScript RT reagent kit (RR047A, Takara, Japan) according to standard instructions, reverse transcription primers included random primers and oligo dT primers. Based on the manuals of TaqMan® MicroRNA Reverse Transcription kit (Applied Biosystems, Foster City, CA, USA), primers were reversely transcribed through stem-loop. Then, RNA underwent reverse transcription to generate cDNA. Based on the directions of EasyScript First-Strand cDNA Synthesis SuperMiX (AE301-02, TransGen, Beijing, China), real-time PCR (SYBR®PremixExTaqTM II, TaKaRa) was performed using ABI7500 Fluorescence qPCR. 2−ΔΔCt was used to assess the relative expression of genes [Citation38]. The primers of lncRNA NEAT1, miR-129, miR-204, ERK1/2, U6 and glyceraldehyde-3-phosphate dehydrogenase (GADPH) were designed and synthesized by Sangon (Shanghai, China) ().
Table 1. Primer sequences for RT-qPCR
Western blot analysis
FLSs were lysed using Radio Immunoprecipitation Assay (RIPA) lysis buffer (P0013B, Beyotime, Shanghai, China) encompassing phenylmethylsulphonyl fluoride and phosphatase inhibitor on ice for 30 min. The supernatant was obtained by 10-min centrifugation at 12,000 rpm and 4ºC. The bicinchoninic acid protein quantitative kit was used to determine protein concentration. The compounds (50 μg protein and 2 × sodium dodecyl sulphate [SDS] loading buffer) were boiled for 10 min and dispersed by SDS-polyacrylamide gel electrophoresis. The electrophoretic buffer was purchased from Thermo Fisher Scientific (LC2675, Waltham, MA, USA). The separating gel was obtained by gel electrophoresis at constant 30 mA and then allowed to run at 40 mA at 4ºC in a refrigerator. When the sample reached the bottom, gel running was terminated. The protein was transferred to nitrocellulose membranes with transmembrane solution (BT0006, Thermo Fisher Scientific) using tank blotting at 10 V for 1 h. Then the membrane was blocked with 5% skimmed milk (Tris-buffered saline-Tween-20 formulation) for 1.5 h before overnight probing with the following primary rabbit antibodies (Abcam, Cambridge, UK) to ERK1/2 (ab17942, 1:1000), phosphorylated ERK1/2 (ab201015, 1:1000), P38 (ab182453, 1:1000), phosphorylated P38 (ab178867, 1:1000) and GAPDH (ab9485, 1:2500) at 4ºC. On the second day, 2-h membrane incubation was then implemented with the secondary antibody labelled with horseradish peroxidase (goat anti-rabbit immunoglobulin G [IgG], ab205718, 1:5000, Abcam). The membrane was viewed using enhanced chemiluminescence luminous solution and photographed under a SmartView Pro 2000 (UVCI-2100, Major Science, Saratoga, CA, USA). Gray value analysis of protein binds was conducted using Quantity One software [Citation39].
ELISA
The levels of IL-1β, IL-6 and TNF-α in the culture supernatant were measured using ELISA following standard instructions contained in the kit (RapidBio Systems, LLC, a Tucson, AZ, USA), IL-6 kit (RapidBio Systems), and TNF-α kit (RapidBio Systems). Diluted samples were supplemented into the reaction well of the enzyme label plate with 100 μL/well. Negative and positive controls were set up. Each well was diluted with 100 μL diluted enzyme conjugates at 37ºC for 30 min. After washing and patting, the samples were added with 100 μL horseradish peroxidase substrate solution at 37ºC for 10 to 20 min, avoiding exposure to light. When the positive control presented evident colour change or the NC presented mild colour change, 50 μL termination solution was added to stop the reaction. The optical density (OD) value was measured at 450 nm wavelength (OD450 value) using Molecular Devices (Spectra Max M5) [Citation40].
Establishment of a RA rat model
Animal Laboratory Centre of Southern Medical University (Guangzhou, China) provided 132 male Wistar rats (6–8 weeks) weighing 160–180 g. The rats were housed in a second-class clean environment with 50–60% humidity at 22–24ºC. They were given unrestricted access to water and food with a 12 h circadian cycle. Twelve rats without treatment were taken as control, and the remaining 120 rats were used for RA model establishment. The success rate of the model establishment was 90% (108/120). Twelve of 108 successfully-modelled rats were selected as the model group. To induce arthritis, the rats were administered intradermal injections of 4 mg/mL of porcine type II collagen in Incomplete Freund’s Adjuvant for complete emulsification. The emulsion (0.25 mL) was intracutaneously injected at the left hind sole, caudal root, and back of the rats. A booster was given 7 days post-induction at the right hind sole, caudal root, and back of the rats. The degree of swelling in limbs and feet along with the increase of ankle joint diameter was observed every 1–2 days. Severe swelling of limbs and feet, increase of ankle joint diameter (≥2 mm) and increase of hind claw volume (≥0.80 mL) were indicative of the successful establishment of RA model, which were observed after approximately 14 days [Citation41].
FLS culture and transfection
The synovial tissues were isolated from RA rats and sliced into blocks (1 × 1 × 1 mm) in Dulbecco’s Modified Eagle Medium (DMEM, Gibco, Carlsbad, CA, USA) under sterile conditions. After being removed with sterile pipette, the tissues were evenly spread on the bottom of a 25 cm2 flask and cultured in DMEM encompassing 20% (v/v) inactivated foetal bovine serum (FBS, Gibco) at 37ºC with 5% CO2, with medium renewed every 2 days. The 90% confluent cells were passaged. The following experiments were implemented with cells at passage 3–6. FLSs were then allowed to grow in DMEM encompassing 10% (v/v) FBS, 100 U/mL penicillin, and 100 mg/mL streptomycin (Beyotime) at 37ºC with 5% CO2. Morphological characteristics were observed under an optical microscope. The expression of macrophage biomarker (CD68) and CD90 was determined by flow cytometry. Subsequent to trypsinizing and centrifugation, FLSs at passages 3 were stained in the dark with monoclonal antibodies to CD68 fluorescein-5-isothiocyanate and CD90 phycoerythrin (Biolegend, San Diego, CA, USA). Isotype matched control antibodies served as methodological controls. A FACSCalibur Flow Cytometer (Becton Dickinson Biosciences, Franklin Lakes, USA) was applied for flow cytometry analysis and FlowJo 7.6 (BD Biosciences, San Jose, CA, USA) for data analysis [Citation42].
After cell recovery, FLS incubation was implemented in DMEM encompassing 10% (v/v) FBS, 100 U/mL penicillin, and 100 mg/mL streptomycin (Beyotime) at 37ºC with 5% CO2 with medium renewed every 3 days. FLSs at the logarithmic phase were selected for the following treatment using si-NC, si-NEAT1, oe-NC, oe-NEAT1, DMSO, U0126 (inhibitor of phosphorylated-ERK1/2), SB203580 (inhibitor of phosphorylated P38), oe-NEAT1 + phosphorylated ERK1/2 inhibitor, oe-NEAT1 + phosphorylated P38 inhibitor, NC inhibitor, miR-129 inhibitor, miR-204 inhibitor, si-NEAT1 + inhibitor NC, si-NEAT1 + miR-129 inhibitor, or si-NEAT1 + miR-204 inhibitor. oe-NC, oe-NEAT1, si-NC, si-NEAT1, miR-129 inhibitor, miR-204 inhibitor and inhibitor NC were synthesized by RiboBio (Guangdong, China). After correct sequencing, plasmids were stored at −80ºC for further use. The 293 T cells were seeded in a 10 cm petri dish. When cell confluence reached 70%, lentivirus was packaged. The medium was renewed with complete medium 2 h before package. Then, 10 μg core plasmid, 5 μg packaging plasmid psPAX2 and 5 μg pMD2.G were added into a clean 1.5 mL eppendorf tube for culture at room temperature for 5 min with 500 μL serum-free DMEM. Then, 20 μL Lipfectamine 2000 (12566014, Thermo Fisher Scientific) was added and allowed to stand at room temperature for 30 min. The mixture was cultured in 293 T cell culture medium for 48 h. The virus particles were purified through centrifugation at 4ºC for 2 h at 25,000 rpm with the virus titre of the experimental and control groups being approximately 1 × 10¹⁰ TU/mL and sub-packed at −80ºC. Logarithmically growing FLSs were trypsinized and dispersed into cell suspension at 5 × 10⁴ cells/mL, which was incubation in a 6-well plate at 2 mL/well overnight at 37ºC. Subsequent to 48-h infection, expression of related genes was detected by RT-qPCR. The experiment was repeated 3 times.
EdU assay
FLSs (1.6 × 10⁵ cells/well) were cultured in 96-well plates for 48 h. Next, each well was incubated with 50 mM EdU for 4 h at 37ºC. An EdU assay was conducted as described in the literature [Citation43]. Ten images in each group were captured under a fluorescence microscope (CX31, Olympus, Tokyo, Japan) on a random basis. The number of EdU-positive cells (red cells) was analysed by Image-Pro Plus 6.0 software (Media Cybernetics, Bethesda, MD, USA). The EdU incorporation rate was computed as the proportion of EdU-positive cells to FLS positive cells (blue cells).
Animal experiment
The remaining modelled rats were treated with lentivirus harbouring si-NC (lenti-siRNA-NC group), si-NEAT1 (lenti-siRNA-NEAT1 group), inhibitor-NC (lenti -inhibitor-NC group), miR-129 inhibitor (lenti -miR-129 inhibitor group), miR-204 inhibitor (lenti -miR-204 inhibitor group), si-NEAT1 + inhibitor NC (lenti-siRNA NEAT1 + inhibitor NC group), si-NEAT1 + miR-129 inhibitor (lenti -siRNA NEAT1 + miR-129 inhibitor group), and si-NEAT1 + miR-204 inhibitor (lenti -siRNA NEAT1+ miR-204 inhibitor group) (n = 12/group). NEAT1 full-length sequences, miR-129 inhibitor and miR-204 inhibitor were, respectively, constructed into lentivirus. All lentivirus and control vector lentivirus were packaged and purified at Guangzhou FulenGen Co., Ltd. (Guangzhou, Guangdong, China). Briefly, the effective lentivirus (titre >1 × 10⁸ TU/mL) titre was selected in vitro and delivered into the knee and ankle joints of RA rats through intracavitary injection (2 times every week) for 2 weeks (0.1 mL/times). The swelling of limbs and feet along with the ankle joint diameter were observed every 3 days after injection.
Rat arthritis scoring
From the 14th d, the thickness of the hind paw of rats on the same side was measured with a Vernier caliper every three days and repeated three times each time and the average value was recorded. All measurements were carried out by two investigators independently. The degree of arthropathy was evaluated using the 5-grade scoring method as described earlier [Citation44]. The highest score of each limb was 4 points, and the highest score of each rat was 16 points. After anaesthesia and euthanasia, the inferior end of the embryonic bone and the upper edge of the lateral malleolus were removed, and fixed in formalin solution for histopathological examination.
Histopathological analysis
The synovial tissues of RA rats were fixed in Bouin’s Fixative (picric acid: formaldehyde: glacial acetic acid = 15:5:1) before 4-µm paraffin-embedded slices were made. Subsequent to xylene dewaxing, the tissues were hydrated with ethanol at xylene (I) for 5 min, toluene (II) for 5 min, 100% ethanol for 2 min, 95% ethanol for 1 min, 80% ethanol for 1 min, 75% ethanol for 1 min, and distilled water for 2 min. Subsequent to 5-min haematoxylin staining, the slices were differentiated by ethanol hydrochloride for 30 s, soaked in tap water for 15 min or warm water (about 50ºC) for 5 min, and stained with eosin solution for 2 min followed by routine dehydration, clearing, and sealing. Finally, an inverted microscope (XSP-8CA, Shanghai Optical Instrument Factory, Shanghai, China) was utilized to observe the sections.
Dual luciferase reporter gene assay
The target genes of miR-129 and miR-204 were predicted using a web-based resource (https://cm.jefferson.edu/rna22/), which revealed 3259–3265 nt on MAPK1 mRNA as binding sites to miR-204 and 6349–6459 nt as binding sites to miR-129. To confirm whether MAPK1 was the direct target of miR-129 and miR-204, a dual luciferase reporter gene assay was conducted. WT sequences of 3ʹ-untranslated region (3ʹ-UTR) of MAPK1 gene, which contained potential binding sites to miR-129 and miR-204, were artificially synthesized, and the MUT sequences, in which the binding sites were mutated, were also synthesized. Following double enzyme digestion on pmiR-RB-REPORTTM vector (PMIR1001, RiBoBio) using restriction endonuclease HandIII and SpeI, the artificially synthesized WT and Mut target gene fragments were, respectively, inserted into the luciferase downstream of pmiR-RB-REPORTTM vector. The cells transfected with empty plasmid served as control, and the correctly sequenced WT and Mut luciferase reporter plasmids were used for subsequent transfection. The Mut and WT plasmids were co-transfected into HEK293T cells with NC mimic or miR-129 mimic and miR-204 mimic, respectively. After 48-h transfection, the cells were collected and lysed. The supernatant was harvested through centrifugation for 3–5 min. The relative light unit (RLU) was determined using a dual luciferase detection kit (RG027, Beyotime). The relative luciferase activity = RLU value of firefly luciferase/RLU value of Renilla luciferase [Citation45].
RIP assay
The binding status of lncRNA NEAT1, miR-129, and miR-204 to AGO2 protein was checked by using a RIP kit (Millipore Corp., Core Res. Dev., Bedford, MA, USA). FLSs were lysed in RIPA pyrolysis solution (P0013B, Beyotime) in an ice bath for 5 min. The supernatant was collected after centrifugation at 14,000 rpm for 10 min. Next, 50 μL magnetic beads were washed and resuspended in 100 μL RIP Wash Buffer, which was incubated with 5 μg rabbit anti-AGO2 (ab186733, 1:50, Abcam) or rabbit anti-IgG (ab109489, 1:100, Abcam) as NC. Then the magnetic beads-antibody complex was incubated with 100 μL of cell extract and 900 μL RIP Wash Buffer overnight at 4ºC. Samples were placed on magnetic pedestals to collect beads-protein complexes. They were then treated with protease K for RNA extraction and subsequent PCR detection.
MSP
MSP was performed to determine the methylation status of the promoter of miR-129. Genomic DNA extraction kit from Beijing Tiangen Biochemical Technology Co., Ltd. (Beijing, China) was used to extract genomic DNA. The concentration and purity of DNA were determined by ultraviolet spectrophotometry. DNA was treated with sodium sulphite in EZ DNA Methylation kit (Zymo Research, USA), desulfurized and purified. The purified DNA was used for subsequent PCR. Methylation non-methylation primers were designed based on the sequence of the CpG Island enrichment region of the miR-129 promoter (). The PCR products were analysed by agarose gel electrophoresis and image analysis.
Table 2. Primer sequences for MSP
Statistical analysis
All data were analysed using the SPSS statistical software package (SPSS 21.0, IBM, Armonk, New York, USA). All data were tested for normality of distribution and homogeneity of variance. Normally distributed measurements were summarized as mean ± standard deviation. Independent sample t-test was used for comparison of data between two groups. Comparison among multiple groups was conducted by one-way analysis of variance followed by Tukey’s posthoc test. Data obtained at different time points were compared using repeated measures analysis of variance. Correlation was assessed by applying Pearson correlation analysis. p < 0.05 indicated that the statistical difference was significant.
Disclosure of Potential Conflicts of Interest
No potential conflicts of interest were disclosed.
Author’ contributions
Xiao Luo conceived the study and together with Zixia Zhao designed it. Yue He and Chengsong He were involved in data collection. Mao Liu and Jie Chen performed the statistical analysis and preparation of figures. Lihui Peng drafted the paper. All authors read and approved the final manuscript.
Supplemental Material
Download Zip (7.7 MB)Acknowledgments
The authors would like to acknowledge their colleagues for their valuable discussions and support.
Supplementary material
Supplemental data for this article can be accessed here.
References
- Smolen JS, Aletaha D, Barton A, et al. Rheumatoid arthritis. Nat Rev Dis Primers. 2018;4:18001.
- Aletaha D, Smolen JS. Diagnosis and management of rheumatoid arthritis: a review. JAMA. 2018;320(13):1360–1372.
- Yap HY, Tee SZ, Wong MM, et al. Pathogenic role of immune cells in rheumatoid arthritis: implications in clinical treatment and biomarker development. Cells. 2018;7(10):161.
- Angelotti F, Parma A, Cafaro G, et al. One year in review 2017: pathogenesis of rheumatoid arthritis. Clin Exp Rheumatol. 2017;35(3):368–378.
- Yan ZF, Zhao XY, Liu W, et al. UCA1 impacts progress of rheumatoid arthritis by inducing the apoptosis of fibroblast-like synoviocyte. Eur Rev Med Pharmacol Sci. 2018;22(4):914–920.
- Liang J, Chen W, Lin J. LncRNA: an all-rounder in rheumatoid arthritis. J Transl Int Med. 2019;7(1):3–9.
- Xu D, Jiang Y, Yang L, et al. Long noncoding RNAs expression profile and functional networks in rheumatoid arthritis. Oncotarget. 2017;8(56):95280–95292.
- Li Z, Li X, Jiang C, et al. Long non-coding RNAs in rheumatoid arthritis. Cell Prolif. 2018;51(1):e12404.
- Zhang L, Zhang Z, Yu Z. Long non-coding RNA NEAT1 can predict various malignant tumour lympha node metastasis: a meta-analysis. Artif Cells Nanomed Biotechnol. 2019;47(1):2516–2520.
- Zhou X, Li X, Yu L, et al. The RNA-binding protein SRSF1 is a key cell cycle regulator via stabilizing NEAT1 in glioma. Int J Biochem Cell Biol. 2019;113:75–86.
- He Z, Dang J, Song A, et al. NEAT1 promotes colon cancer progression through sponging miR-495-3p and activating CDK6 in vitro and in vivo. J Cell Physiol. 2019;234(11):19582–19591.
- Xia Y, Zhou Y, Han H, et al. lncRNA NEAT1 facilitates melanoma cell proliferation, migration, and invasion via regulating miR-495-3p and E2F3. J Cell Physiol. 2019;234(11):19592–19601.
- Yan J, Chen D, Chen X, et al. Downregulation of lncRNA CCDC26 contributes to imatinib resistance in human gastrointestinal stromal tumors through IGF-1R upregulation. Braz J Med Biol Res. 2019;52(6):e8399.
- Shui X, Chen S, Lin J, et al. Knockdown of lncRNA NEAT1 inhibits Th17/CD4(+) T cell differentiation through reducing the STAT3 protein level. J Cell Physiol. 2019;234(12):22477–22484.
- Lo PK, Zhang Y, Wolfson B, et al. Dysregulation of the BRCA1/long non-coding RNA NEAT1 signaling axis contributes to breast tumorigenesis. Oncotarget. 2016;7(40):65067–65089.
- Chen Y, Qiu J, Chen B, et al. Long non-coding RNA NEAT1 plays an important role in sepsis-induced acute kidney injury by targeting miR-204 and modulating the NF-kappaB pathway. Int Immunopharmacol. 2018;59:252–260.
- Tsai CH, Liu SC, Wang YH, et al. Osteopontin inhibition of miR-129-3p enhances IL-17 expression and monocyte migration in rheumatoid arthritis. Biochim Biophys Acta Gen Subj. 2017;1861(2):15–22.
- Li B, Li N, Zhang L, et al. Hsa_circ_0001859 regulates ATF2 expression by functioning as an MiR-204/211 sponge in human rheumatoid arthritis. J Immunol Res. 2018;2018:9412387.
- Lan YY, Wang YQ, Liu Y. CCR5 silencing reduces inflammatory response, inhibits viability, and promotes apoptosis of synovial cells in rat models of rheumatoid arthritis through the MAPK signaling pathway. J Cell Physiol. 2019;234(10):18748–18762.
- Liu F, Feng XX, Zhu SL, et al. Sonic hedgehog signaling pathway mediates proliferation and migration of fibroblast-like synoviocytes in rheumatoid arthritis via MAPK/ERK signaling pathway. Front Immunol. 2018;9:2847.
- Jiang H, Ma R, Zou S, et al. Reconstruction and analysis of the lncRNA-miRNA-mRNA network based on competitive endogenous RNA reveal functional lncRNAs in rheumatoid arthritis. Mol Biosyst. 2017;13(6):1182–1192.
- Shaker OG, Mahmoud RH, Abdelaleem OO, et al. Expression profile of long noncoding RNAs, lnc-Cox2, and HOTAIR in rheumatoid arthritis patients. J Interferon Cytokine Res. 2019;39(3):174–180.
- Idogawa M, Nakase H, Sasaki Y, et al. Prognostic effect of long noncoding RNA NEAT1 expression depends on p53 mutation status in cancer. J Oncol. 2019;2019:4368068.
- Song J, Kim D, Han J, et al. PBMC and exosome-derived Hotair is a critical regulator and potent marker for rheumatoid arthritis. Clin Exp Med. 2015;15(1):121–126.
- Zhang Y, Xu YZ, Sun N, et al. Long noncoding RNA expression profile in fibroblast-like synoviocytes from patients with rheumatoid arthritis. Arthritis Res Ther. 2016;18(1):227.
- Wang P, Wu T, Zhou H, et al. Long noncoding RNA NEAT1 promotes laryngeal squamous cell cancer through regulating miR-107/CDK6 pathway. J Exp Clin Cancer Res. 2016;35:22.
- Zhong W, Yang J, Li M, et al. Long noncoding RNA NEAT1 promotes the growth of human retinoblastoma cells via regulation of miR-204/CXCR4 axis. J Cell Physiol. 2019;234(7):11567–11576.
- Fang L, Sun J, Pan Z, et al. Long non-coding RNA NEAT1 promotes hepatocellular carcinoma cell proliferation through the regulation of miR-129-5p-VCP-IkappaB. Am J Physiol Gastrointest Liver Physiol. 2017;313(2):G150–G156.
- Wu J, Qian J, Li C, et al. miR-129 regulates cell proliferation by downregulating Cdk6 expression. Cell Cycle. 2010;9(9):1809–1818.
- Wu DM, Zhang YT, Lu J, et al. Effects of microRNA-129 and its target gene c-Fos on proliferation and apoptosis of hippocampal neurons in rats with epilepsy via the MAPK signaling pathway. J Cell Physiol. 2018;233(9):6632–6643.
- Fu R, Wang X, Hu Y, et al. Solamargine inhibits gastric cancer progression by regulating the expression of lncNEAT1_2 via the MAPK signaling pathway. Int J Oncol. 2019;54(5):1545–1554.
- Liu F, Tai Y, Ma J. LncRNA NEAT1/let-7a-5p axis regulates the cisplatin resistance in nasopharyngeal carcinoma by targeting Rsf-1 and modulating the Ras-MAPK pathway. Cancer Biol Ther. 2018;19(6):534–542.
- Zhang F, Wu L, Qian J, et al. Identification of the long noncoding RNA NEAT1 as a novel inflammatory regulator acting through MAPK pathway in human lupus. J Autoimmun. 2016;75:96–104.
- Huang SP, Guan X, Kai GY, et al. Broussonin E suppresses LPS-induced inflammatory response in macrophages via inhibiting MAPK pathway and enhancing JAK2-STAT3 pathway. Chin J Nat Med. 2019;17(5):372–380.
- Wang Z, Li J, Zhang J, et al. Sodium tanshinone IIA sulfonate inhibits proliferation, migration, invasion and inflammation in rheumatoid arthritis fibroblast-like synoviocytes. Int Immunopharmacol. 2019;73:370–378.
- Li ZZ, Tan JP, Wang LL, et al. Andrographolide benefits rheumatoid arthritis via inhibiting MAPK pathways. Inflammation. 2017;40(5):1599–1605.
- Wang Y, Xu N, Zhao S, et al. miR-410-3p suppresses cytokine release from fibroblast-like synoviocytes by regulating NF-kappaB signaling in rheumatoid arthritis. Inflammation. 2019;42(1):331–341.
- Arocho A, Chen B, Ladanyi M, et al. Validation of the 2-DeltaDeltaCt calculation as an alternate method of data analysis for quantitative PCR of BCR-ABL P210 transcripts. Diagn Mol Pathol. 2006;15(1):56–61.
- Alexopoulou AN, Leao M, Caballero OL, et al. Dissecting the transcriptional networks underlying breast cancer: NR4A1 reduces the migration of normal and breast cancer cell lines. Breast Cancer Res. 2010;12(4):R51.
- Zhang Y, Zhang Z, Wang H, et al. Neuroprotective effect of ginsenoside Rg1 prevents cognitive impairment induced by isoflurane anesthesia in aged rats via antioxidant, anti-inflammatory and anti-apoptotic effects mediated by the PI3K/AKT/GSK-3beta pathway. Mol Med Rep. 2016;14(3):2778–2784.
- Lim MA, Louie B, Ford D, et al. Development of the digital arthritis index, a novel metric to measure disease parameters in a rat model of rheumatoid arthritis. Front Pharmacol. 2017;8:818.
- Du J, Zhang F, Guo J. miR137 decreases proliferation, migration and invasion in rheumatoid arthritis fibroblastlike synoviocytes. Mol Med Rep. 2018;17(2):3312–3317.
- Guo T, Wang W, Zhang H, et al. ISL1 promotes pancreatic islet cell proliferation. PLoS One. 2011;6(8):e22387.
- Dai Q, Zhou D, Xu L, et al. Curcumin alleviates rheumatoid arthritis-induced inflammation and synovial hyperplasia by targeting mTOR pathway in rats. Drug Des Devel Ther. 2018;12:4095–4105.
- Yu HM, Wang C, Yuan Z, et al. LncRNA NEAT1 promotes the tumorigenesis of colorectal cancer by sponging miR-193a-3p. Cell Prolif. 2019;52(1):e12526.