
ABSTRACT
Regulation of gene expression starts from the transcription initiation. Regulated transcription initiation is critical for generating correct transcripts with proper abundance. The impact of epigenetic control, such as histone modifications and chromatin remodelling, on gene regulation has been extensively investigated, but their specific role in regulating transcription initiation is far from well understood. Here we aimed to better understand the roles of genes involved in histone H3 methylations and chromatin remodelling on the regulation of transcription initiation at a genome-scale using the budding yeast as a study system. We obtained and compared maps of transcription start site (TSS) at single-nucleotide resolution by nAnT-iCAGE for a strain with depletion of MINC (Mot1-Ino80C-Nc2) by Mot1p and Ino80p anchor-away (Mot1&Ino80AA) and a strain with loss of histone methylation (set1Δset2Δdot1Δ) to their wild-type controls. Our study showed that the depletion of MINC stimulated transcription initiation from many new sites flanking the dominant TSS of genes, while the loss of histone methylation generates more TSSs in the coding region. Moreover, the depletion of MINC led to less confined boundaries of TSS clusters (TCs) and resulted in broader core promoters, and such patterns are not present in the ssdΔ mutant. Our data also exhibits that the MINC has distinctive impacts on TATA-containing and TATA-less promoters. In conclusion, our study shows that MINC is required for accurate identification of bona fide TSSs, particularly in TATA-containing promoters, and histone methylation contributes to the repression of transcription initiation in coding regions.
Introduction
The actions and properties of cells are largely determined by the precisely regulated transcription of genes. Various regulatory signals of transcription are ultimately integrated into the first step of gene expression – transcription initiation [Citation1,Citation2]. In this regard, elucidating the regulatory mechanisms of transcription initiation is critical to understand how gene expression is regulated to control the fate and function of cells. In eukaryotic cells, transcription of protein-coding genes is carried out by RNA polymerase II, assisted by other transcription factors [Citation3,Citation4]. Transcription of a gene is usually initiated from one or more arrays of the nearby transcription start sites (TSS), which form TSS clusters (TCs) [Citation3,Citation5,Citation6]. In genome-scale studies, a TC is usually considered as a core promoter, which is the minimal DNA region encompassing TSSs and is sufficient to direct specific transcription initiation [Citation7]. The degree of imprecision of transcription initiation, which can be measured by the core promoter shape, varies substantially among different TCs. Some TCs include only a small number of TSSs, while some use a wide-ranging genomics region that over 100 base pairs (bp) [Citation8,Citation9].
In metazoans, TSS is usually found 25–30 bp downstream of a TATA-box, the binding site for the pre-initiation complex (PIC), while this distance ranges from 40 to 120 bp in the budding yeast Saccharomyces cerevisiae [Citation3,Citation10,Citation11], suggesting different selection mechanisms of TSS position among eukaryotic lineages for TATA-containing genes. In fact, the majority of eukaryotic genes do not contain a consensus TATA-box [Citation12], but the regulatory mechanism of locations of TSSs remains mostly obscure for these TATA-less genes. In addition, transcription initiation from non-promoter genomic regions is prevalent, called pervasive transcription [Citation6,Citation13,Citation14]. Our recent study indicated that proper sequence context in a 10bp-region upstream of TSS is required for transcription initiation to occur [Citation10]. However, the presence of the sequence context does not necessarily warrant the occurrence of transcription initiation, suggesting other factors might constrain transcription initiation from non-canonical core promoter regions. However, little is known about how the cells limit transcription from non-canonical promoter regions and determine the boundaries of a TC [Citation15]. These are important questions because transcription initiation from incorrect sites generates ‘transcriptional noise’ of no biological significance and sometimes may generate deleterious protein products.
A major obstacle for transcription initiation in a promoter region is the presence of nucleosomes. Transcription initiation typically occurs near the boundaries of nucleosome-free regions (NFRs) [Citation16]. For genes without an NFR in promoter regions, which are usually found in facultative heterochromatin regions, the activation of transcription is accompanied by alteration of chromatin structure, such as ATP-dependent nucleosome sliding or histone modification. ATP-dependent nucleosome sliding is carried out by chromatin remodeller genes, such as INO80, which encode conserved ATPase motors [Citation17,Citation18]. A previous study also showed that Ino80C and transcriptional regulatory factors Mot1 and NC2 (termed as MINC) function coordinately to regulate pervasive transcription, and depletion of Ino80p and Mot1p proteins in yeast nucleus together leads to significantly increased transcription of upstream antisense RNAs (uaRNA) near promoter regions [Citation19]. Transcriptional factor Mot1 was also found to play a broad role in establishing the precision and efficiency of RNA synthesis [Citation20]. Methylation of lysine residues in histone H3 could increase transcription by weakening chemical attractions between histone and DNA, enabling the DNA to uncoil from nucleosomes [Citation21]. In yeast, the histone H3 lysine residues are methylated by three methyltransferases: Set1p (H3K4), Set2p (H3K36), and Dot1p (H3K79). It was found that Set2p travels with elongating Pol II and prevents transcription in the intragenic region [Citation20,Citation22,Citation23]. Histone acetylations such as H3K56ac have also been reported to regulate the divergent non-coding transcription [Citation24]. Because the precise locations of genome-wide TSSs were not examined in these studies, it remains unclear about the specific roles of the two epigenetic systems in determining the number and location of TSSs, as well as the distribution of transcription initiation activities in these TSSs. It is reasonable to postulate that the chromatin remodelling system and histone modifications may be important for facilitating the identification of transcription initiation sites and increasing the fidelity of transcription initiation.
In this study, we used MINC (Mot1-Ino80C-Nc2) and histone H3 methyltransferases Set1p-Set2p-Dot1p as an example, to investigate the roles of the two epigenetic regulatory systems in regulating the fidelity of transcription initiation. We used the no-amplification non-tagging Cap analysis of gene expression (nAnT-iCAGE) technique to generate precise TSS maps at single-nucleotide resolution and quantify its usage based on the number of sequenced tags [Citation25]. Through comparative studies of CAGE-identified TSS maps between wild-type and mutant cells, we found that MINC and histone H3 methyltransferase influence transcription initiation in distinctive ways. Briefly, the depletion of Ino80p-Mot1p substantially increased the number of TSSs, specifically around the dominant TSS of genes, while the loss of Set2-Set1-Dot1 results in the new TSSs in coding regions. Furthermore, the depletion of Ino80p-Mot1p led to less confined boundaries of TCs and resulted in broader core promoters, while such patterns are not present in the set1Δset2Δdot1Δ mutant. We also found that the depletion of Ino80p-Mot1p has distinguished impacts on TATA-containing and TATA-less promoters. These findings improve our understanding of the eukaryotic cells ensure the fidelity of transcription initiation, which provides new insights into the regulatory mechanisms of transcription initiation and gene expression.
Results
Depletion of Ino80p-Mot1p or loss of Set2p-Set1p-Dot1p increases transcription initiation sites at different genomic locations
We obtained high-resolution TSS maps for two loss-of-function mutants of S. cerevisiae and their corresponding wild-type stains as a control. The first loss-of-function mutant strain is MOT1&INO80 Anchor-away (Mot1&Ino80AA). In Mot1&Ino80AA, Mot1p and Ino80p were tagged by FRB from a wild-type strain MJE7 [Citation26]. Rapid depletion of the Mot1p and Ino80p from the nucleus in Mot1&Ino80AA was achieved by treating with rapamycin. As its control, the wild-type strain MJE7 was treated by rapamycin (WT_MINC). The second mutant strain was generated by the deletion of three histone H3 methyltransferase genes (set1Δset2Δdot1Δ) in the MJE7, called ssdΔ. The control of ssdΔ is wild-type strain MJE7 grown in YPD (WT_SSD). Two biological replicates of each strain were used to generate nAnT-iCAGE sequencing libraries, which were sequenced by Illumina NextSeq 500 (single-end, 75-bp reads).
A total number of ~248 million reads were generated from the eight nAnT-iCAGE sequencing libraries. These reads were mapped to the reference genome of S. cerevisiae (assembly sacCer3), with a mapping rate between 89%-95% (Supplemental Table S1), providing an ultra-high depth of sequencing for each strain. Only uniquely mapped tags were used for further analysis. As shown in , the unique mapped reads are similar between the four strains after combining CAGE reads of biological replicates. However, the total numbers of identified TSSs and TCs in Mot1&Ino80AA have an increase of 111.54% and 93.04%, respectively, compared with its control WT_MINC (). A moderate increase in the numbers of TSSs and TCs (22.6% and 37.4%) were observed in ssdΔ, compared with its control WT_SSD. This data indicates that both MINC and histone H3 methylations play a role in limiting transcription initiation from non-canonical sites, while MINC has a more significant impact.
Figure 1. MINC and SSD regulate transcription initiation at different locations. A. Bar graph of unique mapped reads, TSS and TSS clusters in WT_SSD, ssdΔ, WT_MINC and Mot1&Ino80AA. B. Genome-wide distribution of novel TSSs in the Mot1&Ino80AA in promoter and coding regions. C. Genome-wide distribution of novel TSSs in ssdΔ at the promoter and coding region. D. Metagene profiles of the relative change of TSS in mutants compared to WT
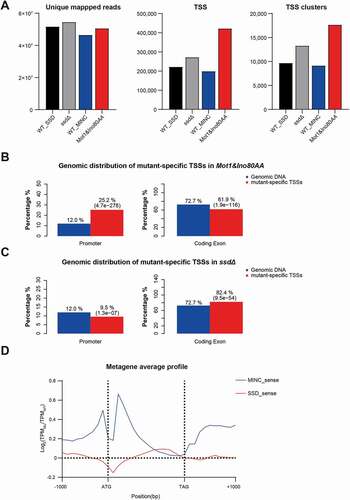
We found that the mutant-specific TSSs in Mot1&Ino80AA are significantly enriched in promoter regions (). In contrast, the mutant specific-TSSs in ssdΔ are moderately enriched in the coding regions (). We also examined the patterns of changes in transcriptional activities of TSSs in the two mutants by calculating log2 ratio of TSS signals (TPM, tags per million mapped tags) between the mutants and WT control. In the Mot1&Ino80AA mutant (), increased transcriptional initiation activities surrounding the translation start codon ATG, including the promoter and downstream of ATG, were observed. This result is consistent with previous findings that combined depletion of Ino80 and Sw2 increased transcription levels around +1 nucleosome region [Citation27,Citation28]. Increased transcription initiation activities in Mot1&Ino80AA were also observed in non-coding genes, including CUTs, SUTs, and XUTs (Supplemental Figure S1A). However, such impact appears to be not significant in CUTs, SUTs, and XUTs of the ssdΔ strain (Supplemental Figure S1B). Malabat et.al., also showed that deletion of SET2 had only a marginal effect on CUTs, XUTs and SUTs [Citation29]. The mildly increased sense transcription near the 3ʹ end of coding region in the ssdΔ ( and Supplemental Figure S1C) is probably due to loss of SET2, which prevents transcription initiation from within gene bodies [Citation23,Citation29]. We used YLR362W as an example of gaining mutant-specific TSSs in its coding region in the ssdΔ mutant (Figure S1D), which is consistent with a previous study on set2Δ [Citation20]. These data suggest that MINC and histone H3 methylation play important roles in regulating transcription initiation at different genomic locations.
Depletion of Ino80p-Mot1p but not loss of Set2p-Set1p-Dot1p increased transcription initiation activities near core promoters
To further distinguish the different impacts on transcription initiation between Mot1&Ino80AA and ssdΔ mutants, we examined their promoter shape by calculating Promoter Shape Score (PSS) [Citation10]. The sharpest promoter has a PSS of 0, and it increases as the promoter becomes broader. As shown in , the peak of PSS distribution in Mot1&Ino80AA shifts to the right compared to WT, suggesting that Mot1&Ino80AA tend to have broader core promoters. However, there is no significant difference in the distribution of PSS between ssdΔ and WT. An example of a core promoter demonstrating the difference in its shape among the four strains is shown at the right panel of . It shows that the core promoter in Mot1&Ino80AA has a broader shape than its WT control, while it is highly similar between ssdΔ and SSD_WT. PSS is determined by the width of TCs and the distribution pattern of CAGE signals within a TC [Citation10]. We found that the change of TC width explains 82.05% of the variance of PSS in the Mot1&Ino80AA mutant (Supplemental Figure S2 A-C). 75.41% of core promoters have an increased TC width in the Mot1&Ino80AA. These results demonstrate that the depletion of MINC resulted in transcription initiation from more positions near canonical core promoter regions, supporting its role in limiting transcription initiation from non-canonical TSSs in core promoter regions.
Figure 2. Impact of the Mot1&Ino80AA mutant on core promoter shape. A. PSS frequency in WT and the Mot1&Ino80AA mutant (left) or WT and the ssdΔ mutant (middle panel). Visualization of CAGE signals in the promoter region of YIR012W by Genome Browser is shown in the right panel. B,D,F. PSS frequency in WT and the Mot1&Ino80AA mutant on single/multiple (B) and TATA and TATA-less (D) clusters. C, E. Violin plot of PSS distribution in WT and the Mot1&Ino80AA mutant on single/multiple (C) and TATA and TATA-less (E) clusters. The p-value more than 1e-50, between 1e-50 and 1e-100, lower than 1e-100 are inidcated as *, ** and ***, respectively
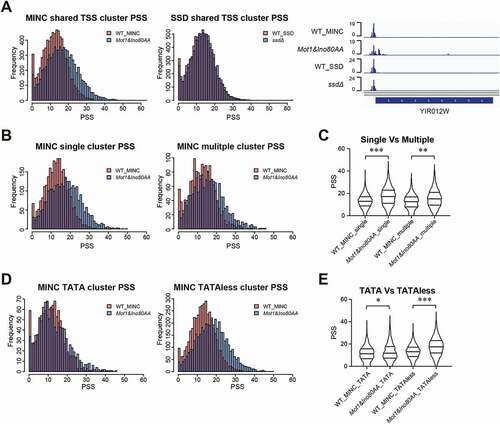
Most genes in S. cerevisiae contain multiple core promoters, and alternative usage of core promoters are prevalent [Citation6]. We then aimed to determine whether the two epigenetic systems have different impacts on single or multiple-core promoters. The result showed that Mot1&Ino80AA, but not ssdΔ, has a significant effect on both the single or multiple core promoters and the effect on single-core promoter are even stronger (, Supplemental Figure S2C and S2D). The broader shape of the single-core promoter in Mot1&Ino80AA indicates that the possible distribution change of TSS intensity within one core promoter and one example on YIR012W are shown in the right panel of . The shift from single-core promoter to multi-core promoter was also found in the Mot1&Ino80AA mutant, and one example is shown in Supplemental Figure S2G.
It has been reported that MINC binds to euchromatin via a TBP-stimulated mechanism [Citation19], and TBP is a TATA box binding protein. Therefore, we also measured the PSS of TCs on TATA and TATA-less clusters. Interestingly, the change of PSS in the Mot1&Ino80AA mutant is much greater in the TATA-less group than the TATA-containing group (), which indicates that MINC regulates transcription initiation differently between the two types of core promoters. Again, the difference of PSS between ssdΔ and WT in these two clusters are mild (Supplemental Figure S2E and F).
Depletion of Ino80p-Mot1p have distinct effects on the transcription initiation between TATA-containing and TATA-less promoters
Previous metagene analyses indicated that the MINC mainly functions in core promoter regions, while Set2-Set1-Dot1 is involved in the transcriptional regulation in coding sequences. To further determine the effect of MINC in the fidelity of transcription initiation in the core promoter regions, we analysed transcription initiation flanking 200 bp of the dominant TSS of genes. The sense (transcripts with the same direction of gene transcription) and antisense (transcripts with the opposite direction of gene transcription) were analysed separately as described in Methods. As shown in , Mot1&Ino80AA significantly increased transcription initiation around TSS and ~30bp downstream of TSS. Such an increase was not observed in ssdΔ mutant, indicating a limited impact of the loss of histone methylation on transcription initiation surrounding canonic core promoters.
Figure 3. MINC regulates transcription initiation differently in TATA containing and TATA-less promoters. A. The relative change of TCs transcription around the TSS in the MINC and ssdΔ mutant versus WT. B. Heatmap of the relative changes of TCs transcription in the MINC mutant versus WT around the TSS on TATA/TATA-less, OPN/DPN, and essential/non-essential group. C. Visualization of CAGE signals in the promoter region of YAL060W (TATA) by Genome Browser. D. Same as C except for gene YAL058W (TATA-less). E. Average profiles of the relative change on TSS activities in the MINC mutant versus WT around the TSS. Genes were divided into TATA and TATA-less groups. F. Same as E except for OPN and DPN groups. G. Same as E except for essential and non-essential groups. H. Average profiles of the relative nucleosome change on TCs around Dyad in TATA and TATA-less group. I. Same as H except for OPN and DPN groups. J. Same as H except for essential and non-essential groups
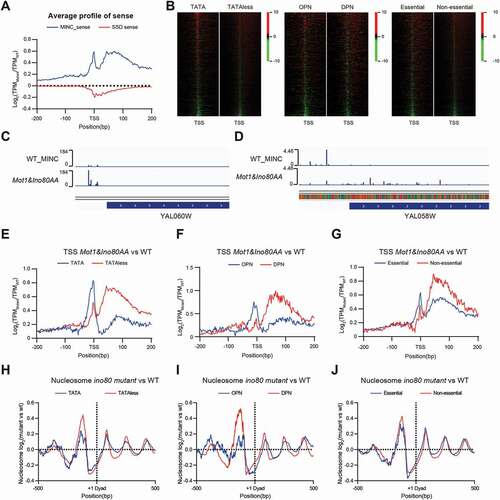
As above-mentioned, larger differences of core promoter shape were observed in the TATA-less than the TATA-containing promoters in the Mot1&Ino80AA mutant. We then further investigate the roles of MINC in transcription initiation in the two groups of promoters separately. Interestingly, transcription initiation is significantly increased immediately upstream of the dominant TSS in TATA-containing promoters in Mot1&Ino80AA, with a peak at −4 bp. In contrast, a significant increase in transcription initiation activities occurs downstream of TSS in TATA-less genes in the Mot1&Ino80AA mutant ( left panel and 3E). illustrate examples of changes in transcription initiation in the two groups in the Mot1&Ino80AA mutant. The change of transcription initiation activities in TATA-containing genes is similar to that of genes with occupied proximal-nucleosome (OPN) ( middle panel and ), in which almost half of them are TATA-containing genes [Citation30]. Instead, the stimulated transcription initiation is mainly located downstream of TSS in genes with depleted proximal-nucleosome (DPN). However, there is no significant change in transcription initiation patterns between essential and non-essential genes ( right panel and ).
The impacts of the depletion of MINC on the transcription initiation support the idea that MINC regulates the fidelity of transcription initiation at the core promoter region. This regulation may function through the chromatin remodelling activity of MINC. To test this hypothesis, we also analysed the change of nucleosome profile in the ino80 mutant at TATA-containing promoters and TATA-less genes [Citation31]. As shown in or 3I, the change of nucleosome profile also showed a distinct pattern between TATA-containing and TATA-less, or OPN and DPN groups. Instead, the difference between essential and non-essential genes are mild ().
MINC inhibits antisense transcription initiation upstream of canonical core promoters
To better understand how MINC influence antisense transcription, we compared the antisense transcription initiation patterns flanking the dominant TSS of genes between mutant and wild-type strains. As shown in , the antisense transcriptions are upregulated in the Mot1&Ino80AA but not ssdΔ mutant, and the peak is around 120 bp upstream of dominant TSS of genes. There is also a clear difference in transcription initiation activities upstream of TSS between the TATA-containing and TATA-less gene in the mutant (). The difference is similar between OPN and DPN genes but not between essential and non-essential genes (). These observations further support that MINC regulates the fidelity of transcription initiation differently at the TATA-containing and TATA-less gene.
Figure 4. MINC regulate upstream antisense transcription initiation. A. The relative change of antisense transcription initiation around the TSS in the MINC and ssdΔ mutants versus WT. B. Average profiles of the relative change on antisense transcription initiation in the MINC mutant versus WT around the TSS in TATA-containing and TATA-less groups. C. Same as B except in OPN and DPN groups. D. Same as B except in essential and non-essential groups. E. Same as B except in divergent promoters and all genes. F. Same as B except in divergent promoters with TSS distance more than 300 bp and all genes. G. Heatmap of relative changes of transcription initiation in the MINC mutant versus WT around the TSS on divergent promoters. The gene pairs with divergent promoters were sorted by the distance between the two TSS and illustrated at the left panel. Heatmap of relative changes of transcription initiation with different directions are shown in the middle panel, and the transcription direction is labelled on the bottom. The relative change of gene expression on the left of the right genes is shown in the right panel. H. Genome Browser example of both upregulated TCs on a divergent promoter
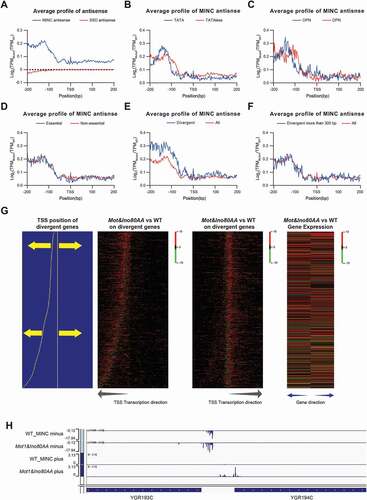
Buratowski and colleagues discovered that INO80 prevents bidirectional transcription at functional promoters [Citation24]. The depletion of MINC also has been shown to stimulate the antisense upstream transcription at divergent promoters [Citation19]. Therefore, we also measured the antisense transcription on divergent promoters after the depletion of Mot1 and Ino80. As shown in , we observed a larger difference of antisense transcription activities at divergent promoters than the average of all genes. However, this larger differnces of transcription initiation activities could come from the upregulated sense transcription of nearby genes. To mitigate the interference of nearby genes, we selected the divergent promoter genes with a distance between their dominant TSS > 300 bp. The average profiles of the increased antisense transcription in the selected divergent promoter genes are similar to the upregulated antisense transcription on all genes () and still showed the upregulated upstream antisense transcription. This data further confirms that MINC represses the antisense transcription initiation upstream of the dominant TSS of genes.
In an attempt to determine the effect of MINC on transcription initiation of two genes that share a divergent promoter, we sorted the divergent promoter genes by the distance between dominant TSSs of the two genes (left panel of ). We then generated a heatmap of the relative changes of transcription initiation in both directions of TSSs in each divergent promoter (the middle panel of ). We observed increased transcription initiation activities from both sense and antisense strands. However, there is no clear correlation between gene expression change either on the TSS distance or the gene expression change between the bidirectional genes. We then divided gene pairs based on their TSS distance and calculated proportions of gene pairs that are co-upregulated (++), co-downregulated (–), or one up and one down-regulated (+-). As shown in Supplemental Figure S3, gene pairs with short TSS distance (0–200 bp) have the highest proportion of co-upregulated transcription, while gene pairs with long TSS distance (600–1000 bp) are enriched in the category of one up and one down-regulated, as illustrated by an example shown in .
Transcription level correlates with promoter shape in both TATA-containing and TATA-less promoter
We then aimed to investigate the relationship between the transcription level and promoter shape of core promoters. The transcription level of a core promoter was quantified as the number of tags (CAGE reads) per million uniquely mapped tags in a sample (TPM). We first plotted the PSS versus TPM values in WT and the Mot1&Ino80AA mutant, respectively. As shown in , both scatter plots show an inverted V-shape, but the position of peak changed from 20 TPM in WT to 50 TPM in Mot1&Ino80AA, indicating that transcription initiation activities from core promoters were generally upregulated after the depletion of MINC. From a different angle, for genes with a similar TPM, Mot1&Ino80AA tends to have a broader promoter shape than wild-type, which is consistent with the results of . When we plotted the change of PSS or width of TCs against their TPM values, it also showed a positive correlation (), supporting an increase of TPM is associated with broader promoter shape. By dividing yeast genes based on the peak of the inverted V-shape in WT (TPM = 10), we observed a lower correlation between PSS and TPM for genes with TPM >10 than those with TPM <10 (), suggesting a reduced impact of transcriptional activities on promoter shape in highly expressed genes.
Figure 5. The correlation between transcription level and promoter shape is different in TATA and TATA-less promoters. A. The scatter plot showing the correlation between PSS and TPM in WT and MINC mutant. B. The scatter plot showing the correlation between the changes of PSS/width(left/right) and TPM in the MINC mutant versus WT. C. The scatter plot showing the correlation between the changes of PSS and TPM in MINC mutant versus WT separated by the TPM level in WT. D. The scatter plot showing a correlation between PSS and TPM in WT and MINC mutant of TATA. E. The scatter plot showing the correlation between the changes of PSS and TPM in the MINC mutant versus WT at TATA group. F. Same as D except in TATA-less group. G. Same as E except in TATAless group. Datas used in these scatter plots were transformed by moving average, which is descripted in the data analysis method
Previous studies showed that the depletion of MINC has distinct effects on the transcription initiation between TATA-containing and TATA-less promoters, and the promoter shape is similar in TATA-containing genes between WT and the Mot1&Ino80AA mutant. We also analysed the correlation of promoter shape and transcription level in TATA-containing and TATA-less genes. As shown in , the plot of PSS versus TPM on TATA containing genes was similar between WT and Mot1&Ino80AA mutant, and the transcriptional level change induced by MINC depletion does not correlate with the change of PSS. Instead, there is a positive correlation between the change of transcription level and PSS value in TATA-less genes (). This data is consistent with previous findings and suggests that transcription level and promoter shape showed a distinguished correlation in TATA-containing and TATA-less promoter.
Discussion
Precise transcription initiation is important for transcription regulation, and core promoter shifts are commonly coupled with altered gene expression [Citation6]. The role of epigenetic control in gene regulation has been extensively studied, but how epigenetic factors regulate TSS is far from well understood. Recently it was found that depletion of general regulatory factors (GRFs) including Rap1 induces widespread ectopic transcription initiation within promoters, and ectopic transcription initiation strongly correlates with altered nucleosome positioning [Citation27]. Chromatin remodellers were also found to control transcription initiation frequency and start site selection [Citation28]. Here we measured the genome-wide effect of MINC and histone H3 methylation on the regulation of transcription initiation. Our results showed that mutant-specific TSSs and transcription initiation activities are significantly enriched in the core promoter region in the Mot1&Ino80AA mutant and slightly enriched in the coding region in the ssdΔ mutant. The depletion of Ino80p and Mot1p proteins have already been shown to greatly increase both sense and antisense transcription near the promoter region [Citation19]. Our data confirmed that MINC is required for the identification of proper TSS in the core promoter region, and regulation of the transcription initiation of non-coding RNAs. However, loss of histone methylation, particularly the H3K4 methylation, which is enriched in the promoter region and required for gene activation, exhibits a mild inhibitory effect on transcription initiation in this region. Instead, the increased transcription initiation activities in the coding region may be due to the loss of histone H3K36 methylation.
The promoter shape, as measured by PSS, is a significant character of TCs. Previous studies [Citation6] showed that alternative core promoter usage or promoter shift might play an important role in controlling gene transcriptional activities. Our data showed that the core promoter is broader on single or multiple core promoters in the Mot1&Ino80AA mutant, and the difference in the single-core promoter in Mot1&Ino80AA is more significant. More importantly, our data showed that MINC has a distinct role in the regulation of transcription initiation in the TATA-containing and TATA-less genes, and transcription level and promoter shape showed a definite correlation in TATA-containing and TATA-less promoter. Mot1 was found to play a broad role in establishing the precision and efficiency of RNA synthesis [Citation20] and it has been reported that TBP recruits MINC to suppress pervasive transcription [Citation19]. The different patterns between the TATA-containing and TATA-less genes further confirm that MINC is required for the identification of proper TSS, particularly for the TATA-containing promoters. It is possible that the effect of MINC on some TATA-less genes was indirect and correlated with the change of transcription. It was reported that loss of Mot1 increased TBP binding from TATA-less to TATA-containing promoters [Citation32]. This indicates another possibility that decreased TBP in TATA-less promoters may contribute to the broader promoter, in which TATA-less promoters have higher PSS values.
MINC represses the antisense transcription initiation with a peak of around 120 bp upstream of canonical TSSs. This region is located approximately the upstream of the TATA box, which is distributed 40–120 bp upstream of TSSs [Citation10]. The increased upstream antisense RNA transcription may arise from a distinct PIC with the same composition as the one driving mRNA transcription [Citation33]. However, it is still unclear whether MINC represses only RNA polymerase II driving opposite to the mRNA direction, or both mRNA and upstream antisense direction. Our data showed that there is a similar pattern of the transcription initiation repression by MINC on TATA-containing genes and non-coding CUTs, SUTs and XUTs, and almost half of bidirectional genes within 200 bp TSS distance were both upregulated in the Mot1&Ino80AA mutant. This data suggests that MINC could repress transcription from both directions, yet whether there is a preference of MINC repression on the upstream antisense direction needs further investigation.
Materials and methods
Yeast strain and growth condition
This study was carried out in the budding yeast S. cerevisiae, a popular eukaryotic model organism. Three different strains were used: MJE7, YXYM103, and MJE98, obtained from Dr. Michael Carey’s lab at UCLA. YXYM103 is isogenic to the wild-type strain MJE7 with a knockout of SET1, SET2, and DOT1 genes (set1Δset2Δdot1Δ, or ssdΔ). Strain MJE98 is also isogenic to MJE7 except carrying the FRB tag in the C-terminal of Mot1p and Ino80p for anchor-away (Mot1&Ino80AA). The anchor-away technique depletes Mot1p and Ino80p in the nucleus by conditional tethering (rapamycin-dependent heterodimerization) to an abundant cytoplasmic protein (the anchor) by the FRB tag [Citation26]. For MOT1-INO80 anchor away, yeast cells were first grown in YPD at 30°C to log phase and treated with rapamycin (8 mg/ml) for 24 hr. The YXYM103 strain was grown in YPD at 30°C. The wild-type strains were grown in both conditions (YPD+Rapamycin, and YPD only), which were used as controls for Mot1&Ino80AA and ssdΔ, respectively.
CAGE library preparation and sequencing
CAGE libraries were prepared following the nAnT-iCAGE protocol by the DNAFORM, Yokohama, Japan [Citation34]. In brief, RNA quality was assessed by Bioanalyzer (Agilent) to ensure that RIN (RNA integrity number) is over 7.0, and A260/280 and 260/230 ratios are over 1.7. First-strand cDNAs were transcribed to the 5ʹ end of capped RNAs, attached to CAGE ‘bar code’ tags. CAGE libraries were sequenced using Illumina NextSeq 500 (single-end, 75-bp reads). The raw CAGE sequencing data generated in this study have been submitted to the NCBI BioProject database under accession number PRJNA658316.
Comparative studies of genome-wide TSS maps
The sequenced CAGE tags were respectively aligned to the reference genome of Saccharomyces cerevisiae S288c (SacCer3) using HISAT2 [Citation35]. To avoid false TSSs, we disabled the soft clipping option in HISAT2 by using ‘–no-softclip’. The numbers of reads successfully mapped to the S. cerevisiae reference genome are provided in Table S1. Reads mapped to ribosomal DNA regions were removed by rRNSAdust. Tags mapping to multiple genomic regions (SAM MAPQ < 20) were also excluded, and only the uniquely mapped tags were used for further analysis. All unique 5ʹ ends of tags will be considered as CAGE tag-defined TSSs by TSSr (https://github.com/Linlab-slu/TSSr). The numbers of reads supporting each TSS were counted and normalized as tag per million uniquely mapped reads (TPM).
Comparative studies of TSS cluster property and usage
To identify TSS clusters (TCs), we used the 5ʹ coordinates of mapped CAGE reads as the input for clustering by using the ‘Peakclu’ method as described in [Citation10]. The ‘Peakclu’ applies a sliding-window approach to scan the 5ʹ end signals (TSSs) of transcripts for both strands of each chromosome. We used a window size of 100 bp with a step size of 1 bp. The TSSs that has the highest TPM value in a window was identified as a peak, representing the dominant TSS of a TC. The surrounding TSSs were grouped with the peak into the same TC, unless a TSS was ≥ 30 bp away from the nearest one. For each TC, we calculated a cumulative distribution of the CAGE signals and determined the positions of the 10th and 90th percentile, which were used as the boundaries of a TC. The width of a TC was calculated as the distance between its boundaries. We only considered TCs with TPM > 1 as active core promoters, which were used or subsequent analyses. We assigned a TC to a protein-coding gene if it is located within 1000 bp upstream of its translation start codon. If an upstream intergenic region of a protein-coding gene is less than 500 bp, only TCs within 500 bp upstream of the gene were assigned.
We calculated the PSS value of each core promoter using the method as described in [Citation10]. In brief, this method takes into consideration both the width and distribution of CAGE signals within a core promoter. The width of a core promoter was calculated as the range between the 10th and 90th CAGE single in a core promoter.
Comparative studies of chromatin structure
To determine if chromatin remodelling mediates the changes of the fidelity of transcription initiation, we retrieved and compare the in vivo maps of nucleosome positions of wild-type, Ino80 mutant [Citation36]. For these regions with significant changes in TSS and TC, we examined whether they are associated with changes in nucleosome occupancy.
The lists of TATA-box and TATA-less gene in S. cerevisiae were obtained from [Citation12]. Many yeast genes contain a nucleosome-free region in their promoters, which exposes prompter DNA for binging by transcription factors. The list of genes with two extreme classes of promoters, depleted proximal-nucleosome (DPN) and occupied proximal-nucleosome (OPN), were retrieved from [Citation30].
Data analysis
The genome-wide distribution data was analysed with CEAS [Citation37]. The ‘Promoter region’ was set within 333 bp from the start codon. The ‘Coding Exon’ was set form start codon to stop codon. The genome annotation file of S. cerevisiae was obtained from [Citation10,Citation29]. The scatter plots between PSS/width and TPM were treated with a moving average. We first sorted all genes based on their TPM values. We then calculated the mean values of PSS, width, and TPM for every group of 40 genes from top to bottom, with a moving step of 20 genes. The CAGE reads were normalized using a custom script as described in [Citation19]. The average profile around TSS was divided into two-bp windows. The metagene average profile was divided into 15 windows between the start codon and stop codon, and the data around the coding region was divided into 100 bp windows. The log2 ratio was calculated between mutants and wild type, and the data window equal to 0 was replaced with 0.02.
Author Contributions
Z. L., Y.Z., and J.R., performed the experiments, H.Z., and Z.L., analyzed the data, Y.X., Z.L., and C.L., conceived and supervised the experiment design and data analysis. Y.X., and Z.L., wrote the manuscript and C.L., helped to revise the manuscript.
Supplemental Material
Download PDF (2.8 MB)Disclosure statement
The authors declare no conflict of interest
Supplementary material
Supplemental data for this article can be accessed here.
Additional information
Funding
References
- Butler JE, Kadonaga JT. The RNA polymerase II core promoter: a key component in the regulation of gene expression. Genes Dev. 2002;16:2583–2592.
- Lenhard B, Sandelin A, Carninci P. Metazoan promoters: emerging characteristics and insights into transcriptional regulation. Nat Rev. 2012;13:233–245.
- Smale ST, Kadonaga JT. The RNA polymerase II core promoter. Annu Rev Biochem. 2003;72:449–479.
- Kadonaga JT. Perspectives on the RNA polymerase II core promoter. WIRES Dev Biol. 2012;1:40–51.
- Haberle V, Li N, Hadzhiev Y, et al. Two independent transcription initiation codes overlap on vertebrate core promoters. Nature. 2014;507:381–385.
- Lu Z, Lin Z. Pervasive and dynamic transcription initiation in Saccharomyces cerevisiae. Genome Res. 2019;29:1198–1210.
- Carninci P, Kasukawa T, Katayama S, et al. The transcriptional landscape of the mammalian genome. Science. 2005;309:1559–1563.
- Hoskins RA, Landolin JM, Brown JB, et al. Genome-wide analysis of promoter architecture in Drosophila melanogaster. Genome Res. 2011;21:182–192.
- Schor IE, Degner JF, Harnett D, et al. Promoter shape varies across populations and affects promoter evolution and expression noise. Nat Genet. 2017;49:550–558.
- LuZ, LinZ. The origin and evolution of a distinct mechanism of transcription initiation in yeasts. Genome Res. 2020 Nov 20:gr.264325.120. doi:10.1101/gr.264325.120
- Qiu C, Jin H, Vvedenskaya I, et al. Universal promoter scanning by Pol II during transcription initiation in Saccharomyces cerevisiae. Genome Biol. 2020;21:132.
- Basehoar AD, Zanton SJ, Pugh BF. Identification and distinct regulation of yeast TATA box-containing genes. Cell. 2004;116:699–709.
- Carninci P, Sandelin A, Lenhard B, et al. Genome-wide analysis of mammalian promoter architecture and evolution. Nat Genet. 2006;38:626–635.
- Kapranov P, Cheng J, Dike S, et al. RNA maps reveal new RNA classes and a possible function for pervasive transcription. Science. 2007;316:1484–1488.
- Struh l K. Transcriptional noise and the fidelity of initiation by RNA polymerase II. Nat Struct Mol Biol. 2007;14:103–105.
- Xu Z, Wei W, Gagneur J, et al. Bidirectional promoters generate pervasive transcription in yeast. Nature. 2009;457:1033–1037.
- Shen X, Mizuguchi G, Hamiche A, et al. A chromatin remodelling complex involved in transcription and DNA processing. Nature. 2000;406:541–544.
- True JD, Muldoon JJ, Carver MN, et al. The modifier of transcription 1 (Mot1) ATPase and Spt16 histone chaperone co-regulate transcription through preinitiation complex assembly and nucleosome organization. J Biol Chem. 2016;291:15307–15319.
- Xue Y, Pradhan SK, Sun F, et al. Mot1, Ino80C, and NC2 function coordinately to regulate pervasive transcription in yeast and mammals. Mol Cell. 2017;67:594–607 e4.
- Poorey K, Sprouse RO, Wells MN, et al. RNA synthesis precision is regulated by preinitiation complex turnover. Genome Res. 2010;20:1679–1688.
- Shilatifard A. Chromatin modifications by methylation and ubiquitination: implications in the regulation of gene expression. Annu Rev Biochem. 2006;75:243–269.
- Kim JH, Lee BB, Oh YM, et al. Modulation of mRNA and lncRNA expression dynamics by the Set2-Rpd3S pathway. Nat Commun. 2016;7:13534.
- Venkatesh S, Li H, Gogol MM, et al. Selective suppression of antisense transcription by Set2-mediated H3K36 methylation. Nat Commun. 2016;7(1):13610.
- Marquardt S, Escalante-Chong R, Pho N, et al. A chromatin-based mechanism for limiting divergent noncoding transcription. Cell. 2014;157:1712–1723.
- Takahashi H, Lassmann T, Murata M, et al. 5ʹ end-centered expression profiling using cap-analysis gene expression and next-generation sequencing. Nat Protoc. 2012;7:542–561.
- Haruki H, Nishikawa J, Laemmli UK. The anchor-away technique: rapid, conditional establishment of yeast mutant phenotypes. Mol Cell. 2008;31:925–932.
- Challal D, Barucco M, Kubik S, et al. General regulatory factors control the fidelity of transcription by restricting non-coding and ectopic initiation. Mol Cell. 2018;72:955–69 e7.
- Kubik S, Bruzzone MJ, Challa l D, et al. Opposing chromatin remodelers control transcription initiation frequency and start site selection. Nat Struct Mol Biol. 2019;26:744–754.
- MalabatC, FeuerbachF, MaL, et al. 2015. Quality control of transcription start site selection by nonsense-mediated-mRNA decay. eLife. 4:e06722.
- Tirosh I, Barkai N. Two strategies for gene regulation by promoter nucleosomes. Genome Res. 2008;18:1084–1091.
- van Bakel H, Tsui K, Gebbia M, et al. A compendium of nucleosome and transcript profiles reveals determinants of chromatin architecture and transcription. PLoS Genet. 2013;9:e1003479.
- Zentner GE, Henikoff S. Mot1 redistributes TBP from TATA-containing to TATA-less promoters. Mol Cell Biol. 2013;33:4996–5004.
- Jensen TH, Jacquier A, Libri D. Dealing with pervasive transcription. Mol Cell. 2013;52:473–484.
- Murata M, Nishiyori-Sueki H, Kojima-Ishiyama M, et al. Detecting expressed genes using CAGE. Methods Mol Biol. 2014;1164:67–85.
- Kim D, Langmead B, Salzberg SL. HISAT: a fast spliced aligner with low memory requirements. Nat Methods. 2015;12:357–360.
- Lademann CA, Renkawitz J, Pfander B, et al. The INO80 complex removes H2A.Z to promote presynaptic filament formation during homologous recombination. Cell Reports. 2017;19:1294–1303.
- Shin H, Liu T, Manrai AK, et al. CEAS: cis-regulatory element annotation system. Bioinformatics. 2009;25:2605–2606.