
ABSTRACT
Alternative splicing is a regulated process by which eukaryotic genes may produce diverse biological products. Defects in the process typically affect cellular function and can lead to disease. Next-generation sequencing (NGS) technologies have been developed to detect alternative splicing events; however, the alternative splicing events detected by standard RNA-Seq may or may not be derived from full-length RNA. The SMARTer method provides full-length double-strand cDNA synthesis, and the resulting gene expression patterns correlate strongly with standard RNA-Seq. However, it also yields non-specific genomic DNA amplification. We improved the SMARTer method by employing a target-capture full-length double-strand cDNA sequencing method. High-fidelity, full-length cDNA is generated by the SMARTer method, followed by target-specific capture with exon probes. The expression pattern observed with this SMARTer Capture method was highly correlated with the results of the original SMARTer method. The number and accuracy of the detected splicing events were increased by eliminating non-specific genomic DNA amplification by the SMARTer Capture. Compared to the original SMARTer method, the SMARTer Capture provided 4-fold greater detection of alternative splicing events at the same read number, and it took less than 1/100 of read number to detect the same number of splicing events. The percent splicing in index (PSI) of the SMARTer Capture is highly correlated with the PSI of the SMARTer. These results indicate that the SMARTer Capture represents an improvement of the SMARTer method to accurately characterize alternative splicing repertories in targeted genes without biases.
Introduction
The large majority of human genes are transcribed as pre-mRNAs that include exons and introns and then processed by the spliceosome to remove the introns and produce a mature mRNA [Citation1]. Post-transcriptional alternate intron splicing generates various mRNA products that encode structurally and functionally different protein isoforms [Citation2], which increases the complexity of the human transcriptome. Genome-wide studies estimate that 90 ~ 95% of human genes undergo some level of alternative splicing [Citation3,Citation4]. Mass spectrometry has shown that 37% of the approximately 20,000 human protein-coding genes generate multiple protein isoforms [Citation5]. Five mechanisms enable alternative recognition of differential splice donor and acceptor sites to produce a variety of mRNA isoforms (alternative splice variants), including exon skipping, mutually exclusive exons, alternative 5ʹ splice site, alternative 3ʹ splice site, and intron retention (). Alternative splice switching occurs simultaneously in multiple genes during development and cell differentiation [Citation6–11]. Inappropriate splicing has been implicated in human disease, including various cancers [Citation12–14]. Disease-associated alternative splice variants may be new tools for disease diagnosis and classification, but the best detection method has not been well established.
Figure 1. Splicing events and SMARTer Capture method (A) Alternative mRNAs result from exon skipping, selection of mutually exclusive exons, usage of alternative 5′ (donor) sites or alternative 3′ (acceptor) sites, and intron retention. (B) Workflow for the SMARTer Capture method
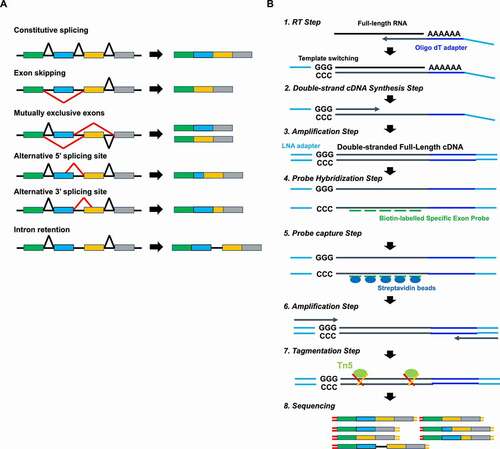
RNA-Sequencing (RNA-Seq) enables accurate and comprehensive measurement of gene expression and detection of novel and known splice variants [Citation15]. In the standard RNA-Seq method, mRNA is fragmented after capture with oligo dT magnetic beads or ribosomal removal from total RNA. Unlike standard RNA-Seq, the SMARTer method allows the generation of full-length cDNA using template switching technology [Citation16] (). Thus, the SMARTer method is better than standard RNA-Seq coverage of 5ʹ transcript positions, providing uniform detection of 5ʹ and 3ʹ ends [Citation17], and may provide improved detection of alternative splice variants.
Few studies have investigated the performance of SMARTer for splice variant analysis. We compared the performance of SMARTer and standard RNA-Seq, then improved the SMARTer method by adding a target-specific capture step (SMARTer Capture). Here we describe the target-capture full-length double-strand cDNA sequencing method for accurate splice variant detection.
Materials and methods
Patient sample
Peripheral blood mononuclear cells were obtained from a patient with tuberous sclerosis complex. Written informed consent was obtained, and the ethics review board of Kanazawa Medical University approved the study design (G111).
Total RNA extraction
Total RNA was extracted with TRIzol reagent (Thermo Fisher Scientific) according to manufacturer instructions. RNA concentration and purity were measured spectrophotometrically (Nanodrop), and the RNA integrity number was measured by TapeStation 4200 with High Sensitivity RNA ScreenTape (Agilent Technologies, Santa Clara, CA).
RNA-Seq library construction
According to manufacturer instructions, double-strand cDNA was synthesized using the TruSeq Stranded mRNA Library Prep Kit (Illumina, San Diego, CA, USA). The Library was built using the KAPA Hyper Prep Kit (Kapa Biosystems, MA, USA). Full-length double-strand cDNA was synthesized from the total RNA using the SMART-Seq v4 ultra-low input RNA kit (Takara Bio USA, Mountain View, CA, USA) as directed. Double-strand cDNA was amplified over 18 cycles. Nextera XT DNA Library Preparation Kit (Illumina, San Diego, CA, USA) was used to preparate the RNA-Seq Library for Illumina Sequencing. Library quality was assessed using the TapeStation 4200 with High Sensitivity D1000 ScreenTape (Agilent Technologies, Santa Clara, CA).
Target-Capture SMARTer library construction
Double-strand cDNA from the SMART-Seq v4 ultra-low input RNA kit was amplified over 18 cycles, then hybridized to cancer gene-targeted capture probes (SureSelect NCC Oncopanel, Agilent). The hybridized cDNA was captured using streptavidin-coated beads as described elsewhere [Citation18]. The captured cDNA was amplified over 12 cycles, and then the Nextera XT DNA Library Preparation Kit was used to create the RNA-Seq library for Illumina Sequencing. Library quality was assessed using the TapeStation 4200 with High Sensitivity D1000 ScreenTape.
Sequencing
The RNA-Seq libraries were quantified using the HS Qubit dsDNA assay (Thermo Fisher Scientific, Waltham, MA) and the KAPA Library Quantification Kit (KAPA Biosystems, MA, USA). According to the standard Illumina protocol, the RNA-Seq libraries were sequenced (2 x 75 bp) on the Illumina NextSeq (Illumina, San Diego, CA). FASTQ files were generated using bcl2fastq software (Illumina).
Data analysis
The FASTQ files were checked by FastQC software (version 0.11.7) [Citation19] and aligned to the reference human genome (hg38) using HISAT2 (version 2.1.0) [Citation20]. The StringTie algorithm (version v1.3.4d) [Citation21] was used with default parameter settings to assemble RNA-Seq alignments into annotated transcripts and estimate their expression. Transcript expression was normalized using the transcripts per million (TPM) algorithm. For differential expression analysis, we used R package edgeR [Citation22]. For analysis and interpretation, we used SAMtools (version 1.9) [Citation23], BEDTools (version v2.27.1) [Citation24], Seqkit (version 0.13.2) [Citation25], and RSeQC (version 3.0.1) [Citation26]. For splice analysis, we used SplAdder software (version 2.4.2) [Citation27].
Results
Comparison between SMARTer sequencing and standard RNA-Seq
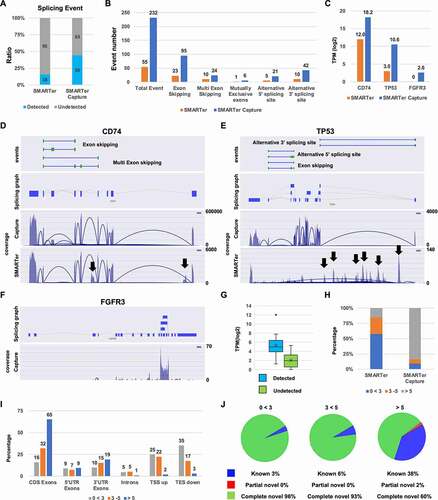
To evaluate RNA-Seq method performance, we compared gene detection, expression pattern, and quality of SMARTer and standard RNA-Seq. The number of paired mapping reads and the percentages of mapped reads was similar in both methods ( and B). The number of expressed genes were also similar (). There were 303 differentially expressed genes (p < 0.05) with strongly correlated expression patterns (). The coverage of transcripts from within gene body showed that the 5′ end coverage of SMARTer was better and more uniform than standard RNA-Seq (). Next, we investigated the distribution of genomic feature. The distribution of coding (CDS) regions in SMARTer was lower than standard RNA-Seq (). The distribution of regions outside the gene body such as introns, transcription start site (TSS) up, and transcription end site (TES) down was higher in SMARTer than in standard RNA-Seq, indicating that the mapped reads were amplified from genomic DNA in the SMARTer method. We analysed the splicing events in SMARTer and standard RNA-Seq to assess efficacy for splice analysis of mapped reads (). In SMARTer, the number of novel splice events was higher than standard RNA-Seq, suggesting that the mapped intron reads led to the detection of artificial complete novel splicing events.
Figure 2. Comparison of SMARTer Sequencing and standard RNA-Seq (A) Mapped read number. (B) Percentage of mapped reads. (C) Number of expressed genes detected. (D) Scatter plot (log2 TPM (Transcripts per million)) of standard RNA-Seq (x-axis) and SMARTer (y-axis). Red spots indicate the differential expression genes (p < 0.05) (E) Gene body coverage. (F) The percentage in each region [CDS Exons, 5′UTR, 3′UTR, intron, TSS upstream (TSS up) and TES downstream (TES down)]. (G) Pie chart of each splicing event
![Figure 2. Comparison of SMARTer Sequencing and standard RNA-Seq (A) Mapped read number. (B) Percentage of mapped reads. (C) Number of expressed genes detected. (D) Scatter plot (log2 TPM (Transcripts per million)) of standard RNA-Seq (x-axis) and SMARTer (y-axis). Red spots indicate the differential expression genes (p < 0.05) (E) Gene body coverage. (F) The percentage in each region [CDS Exons, 5′UTR, 3′UTR, intron, TSS upstream (TSS up) and TES downstream (TES down)]. (G) Pie chart of each splicing event](/cms/asset/8b47c2dd-a34c-4cc4-9a89-83ed0172e153/krnb_a_1872961_f0002_oc.jpg)
Target-capture SMARTer sequencing
To enrich the target genes, full-length double-stranded cDNA generated by the SMARTer method was captured using biotin-labelled specific exon probes for a cancer gene-targeted panel of about 100 genes (). Then, the captured full-length cDNA was amplified and tagmented by Tn5 transposase for Illumina Sequencing. We compared gene detection, expression patterns, and quality of Target-Capture SMARTer (SMARTer Capture) and the original SMARTer method. The number of mapped reads and the ratio of mapped reads per total reads were similar in each method ( and B). The SMARTer Capture coverage of target genes was almost 100% and higher than SMARTer. On the other hand, the coverage of SMARTer was almost 0% coverage(). The 100% coverage region of SMARTer Capture was about 50%, and the 0% coverage region was only about 5% of the total target regions. The 100% coverage region of SMARTer was only 1%, and the 0% coverage region was more than 50% of the total targets regions (). The average depth on the target regions of SMARTer Capture was about 300-fold higher than SMARTer (). Target gene expression was enriched from 3 (SMARTer) to 10 (SMARTer Capture) TPM (). The expression pattern of the target genes in SMARTer Capture was highly correlated with SMARTer (). The detected number of 113 target genes in SMARTer Capture was increased from 85 to 109, compared to SMARTer (). Genes that were undetected by the SMARTer method were almost detected by SMARTer capture (). The distribution of the coding sequence regions was greater in the capture method, with a correlating reduction in sequences falling outside of genes, indicating that SMARTer Capture excludes non-specific sequences (). The pool of novel splicing events was smaller in the capture method than in the original SMARTer method (). These results suggest that SMARTer Capture enhances the coverage, the average depth, expression level in TPM, and the number of detectable genes and is useful for splice analysis by excluding non-specific sequences.
Figure 3. Comparison of SMARTer and SMARTer Capture (A) Mapped read number. (B) Percentage of mapped reads. (C) Frequency of coverage. (D) The percentage of 0% coverage region and 100% coverage region. (E) The average depth in target regions. (F) Expression of Total and Target genes (TPM: transcripts per million). (G) Scatter plot (log2 TPM (Transcripts per million)) of SMARTer (x-axis) and SMARTer Capture (y-axis) in 113 target genes. (H) The percentage of detected and undetected genes. (I) The percentage of SMARTer Capture detected and undetected genes among those undetected by the SMARTer method. (J) The percentage in each region [CDS Exons, 5′UTR, 3′UTR, intron, TSS upstream (TSS up) and TES downstream (TES down)]. (K) Pie chart of each splice event
![Figure 3. Comparison of SMARTer and SMARTer Capture (A) Mapped read number. (B) Percentage of mapped reads. (C) Frequency of coverage. (D) The percentage of 0% coverage region and 100% coverage region. (E) The average depth in target regions. (F) Expression of Total and Target genes (TPM: transcripts per million). (G) Scatter plot (log2 TPM (Transcripts per million)) of SMARTer (x-axis) and SMARTer Capture (y-axis) in 113 target genes. (H) The percentage of detected and undetected genes. (I) The percentage of SMARTer Capture detected and undetected genes among those undetected by the SMARTer method. (J) The percentage in each region [CDS Exons, 5′UTR, 3′UTR, intron, TSS upstream (TSS up) and TES downstream (TES down)]. (K) Pie chart of each splice event](/cms/asset/ca76ee6d-4954-41ee-b5df-74fe9516a50e/krnb_a_1872961_f0003_oc.jpg)
Comparison between SMARTer and SMARTer capture in splicing analysis
We compared the splice event detection and quality of SMARTer and SMARTer Capture. SMARTer Capture detected splice events in half of the target genes; about 3-fold more than were detected by SMARTer (). The total number of detected alternative splice variants by SMARTer Capture was more than 4-greater than SMARTer and detected more of each type of splice event (). Both methods detected high-expression splice events in CD74 (12.0 TPM SMARTer; 18.2 TPM SMARTer Capture) ( and D). Intron retention was detected by SMARTer but not by the capture method, indicating that these intron sequences were not transcribed with exons (, black arrows). SMARTer Capture correctly detected TP53 splice events with the high-expression events (10.6 TPM), and SMARTer were not correct due to the high background of non-target amplification with the low-expression events (< 5 TPM) ( and E, black arrows). The capture method could not detect low-level splice events in FGFR3 (< 5 TPM; and F). Splice events that were detected or undetected by SMARTer Capture were detected by SMARTer at 4 to 6 TPM and 1 to 3 TPM, respectively (). Therefore, the ability to detect splice variants depends on the TPM value. The percentage of genes expressed above 5 TPM was only 20% in the SMARTer analysis and 80% in the SMARTer Capture analysis; thus, SMARTer Capture increases the number of genes that could be analysed (). The percentage of CDS exons decreased with decreasing expression level in SMARTer (), while the percentage of introns, TSS up, and TES down increased. Splice events below 5 TPM included almost exclusively novel events that might be related to non-specific amplification ( and J). These results suggested that SMARTer Capture enhances the number of detected splice events by enriching expressed targets and increasing accuracy by excluding non-specific amplification.
Figure 4. Alternative splice event analysis (A) The ratio of detected and undetected splice events for each sample. The number in the bar indicates the number of genes. (B) The splice event number per event (exon skipping, multiple exon skipping, mutually exclusive exons, alternative 5′ splice site, and alternative 3′ splice site). (C) Transcripts per million (TPM) level of CD74, TP53, and FGFR3. (D, E, and F) Splice maps of CD74, TP53, and FGFGR3. Black arrows indicate non-specific genomic DNA amplification. (G) TPM of detected and undetected splice events by SMARTer (H) The percentage of genes at varying TPM for the standard and improved methods (I) The percentage of splice variants detected in CDS Exons, 5′UTR, 3′UTR, intron, TSS upstream (TSS up) and TES downstream (TES down) by SMARTer TPM. (J) Pie chart of each splicing event for each expression level of genes by SMARTer
Read number
We extracted any number of SMARTer Capture reads using SeqKit software to compare between read numbers between methods. The mapped read number correlated with the number of reads (). The average depth of SMARTer was 1/1000 that of SMARTer Capture when using the Oncopanel (). SMARTer Capture detected total target gene splice events equivalent to SMARTer with a 1/100 to 1/1000 reads (). The overall number of splice events correlated with the read number of SMARTer Capture (). The PSI of the detected splicing events in SMARTer Capture was highly correlated with the PSI in SMARTer (). Also, the PSI in any different read number was highly correlated between methods. These results suggested that splice events detection ability of SMARTer Capture was about 100-fold higher than SMARTer.
Figure 5. Read numbers (A) The total mapped read number for SMARTer, SMARTer Capture, and the 1/10, 1/100, and 1/1000 read extracted by Seqkit from SMARTer Capture. (B) The average depth of targeted regions for each sample. (C) The total number of splicing events for the targeted genes in each sample. (D) Splice event number per event (exon skipping, multiple exon skipping, mutually exclusive exons, alternative 5′ splice site, and alternative 3′ splice site) for each sample. (E) Scatter and correlation plots of the percent splicing in index (PSI) for each sample.pt?>
Discussion
Next-generation sequencing (NGS)-based alternative splice analysis can serve as a powerful tool for the detection and quantification of alternative and de novo splice variants in various human disease and developmental research. Although numerous studies have employed RNA-Seq, almost none have focused on the quantification of known transcripts. We believe an improved method for analysing alternative splice events is still needed. Coverage is poor at the 5′ end of a transcript with standard RNA-Seq, though SMARTer provides better coverage because it is used to synthesize and sequence full-length double-strand cDNA [Citation17]. We confirmed this observation, concluding that SMARTer is better than standard RNA-Seq for alternative splice variant analysis. However, only 20% of all genes can be analysed using SMARTer because it requires about 5 TPM or more gene expression levels. The SMARTer Capture method enriched for expressed genes and was strongly correlated with SMARTer results. SMARTer Capture detected about 4-fold more splice events than SMARTer, and the PSI of the detected splice events were strongly correlated between the original and the capture-enhanced method, indicating the absence of bias in the modified method. Moreover, the SMARTer Capture method removed the sequence was amplified from genomic DNA that causes detection of false splicing events, indicating that it is possible to detect accurate splicing events.
We used an Oncopanel of about 100 cancer genes to test the SMARTer Capture method, although the method may be used for any commercial or laboratory-developed gene panels. Moreover, the SMARTer Capture method applies to long-read sequencing using long-read sequencers such as Nanopore [Citation28] and PacBio [Citation29]. The SMARTer Capture method with a long-read sequencer will provide individual splice events and information on all splice events in a full-length transcript.
The SMARTer Capture method improves the accuracy of alternative splice event detection and eliminates non-specific amplification noise.
Acknowledgments
We thank the members of the Center for Clinical Genomics at Kanazawa Medical University Hospital for helpful discussion and feedback on this manuscript. This work is supported by Kanazawa Medical University (No. 11181, 26699).
Disclosure statement
No potential conflict of interest was reported by the authors.
Additional information
Funding
References
- Shi Y. Mechanistic insights into precursor messenger RNA splicing by the spliceosome. Nat Rev Mol Cell Biol. 2017;18(11):655–670.
- Bush SJ, Chen L, Tovar-Corona JM, et al. Alternative splicing and the evolution of phenotypic novelty. Philos Trans R Soc London, Ser B. 2017;372. DOI:10.1098/rstb.2015.0474
- Pan Q, Shai O, Lee LJ, et al. Deep surveying of alternative splicing complexity in the human transcriptome by high-throughput sequencing. Nat Genet. 2008;40:1413–1415.
- Wang ET, Sandberg R, Luo S, et al. Alternative isoform regulation in human tissue transcriptomes. Nature. 2008;456:470–476.
- Kim MS, Pinto SM, Getnet D, et al. A draft map of the human proteome. Nature. 2014;509:575–581.
- Martinez NM, Pan Q, Cole BS, et al. Alternative splicing networks regulated by signaling in human T cells. RNA. 2012;18:1029–1040.
- Singh RK, Xia Z, Bland CS, et al. Rbfox2-coordinated alternative splicing of Mef2d and Rock2 controls myoblast fusion during myogenesis. Mol Cell. 2014;55:592–603.
- Bhate A, Parker DJ, Bebee TW, et al. ESRP2 controls an adult splicing programme in hepatocytes to support postnatal liver maturation. Nat Commun. 2015;6:8768.
- Dillman AA, Hauser DN, Gibbs JR, et al. mRNA expression, splicing and editing in the embryonic and adult mouse cerebral cortex. Nat Neurosci. 2013;16:499–506.
- Giudice J, Xia Z, Wang ET, et al. Alternative splicing regulates vesicular trafficking genes in cardiomyocytes during postnatal heart development. Nat Commun. 2014;5:3603.
- Llorian M, Gooding C, Bellora N, et al. The alternative splicing program of differentiated smooth muscle cells involves concerted non-productive splicing of post-transcriptional regulators. Nucleic Acids Res. 2016;44:8933–8950.
- Srebrow A, Kornblihtt AR. The connection between splicing and cancer. J Cell Sci. 2006;119:2635–2641.
- Brinkman BM. Splice variants as cancer biomarkers. Clin Biochem. 2004;37:584–594.
- Venables JP. Aberrant and alternative splicing in cancer. Cancer Res. 2004;64:7647–7654.
- Byron SA, Van Keuren-Jensen KR, Engelthaler DM, et al. Translating RNA sequencing into clinical diagnostics: opportunities and challenges. Nat Rev Genet. 2016;17:257–271.
- Picelli S, Faridani OR, Björklund AK, et al. Full-length RNA-seq from single cells using Smart-seq2. Nat Protoc. 2014;9:171–181.
- Song Y, Milon B, Ott S, et al. A comparative analysis of library prep approaches for sequencing low input translatome samples. BMC Genomics. 2018;19:696.
- Ura H, Togi S, Niida Y. Dual deep sequencing improves the accuracy of low-frequency somatic mutation detection in cancer gene panel testing. Int J Mol Sci. 2020;21:21.
- Andrews S FastQC a qurality control tool for high throughput sequence data. 2010.
- Kim D, Langmead B, Salzberg SL. HISAT: a fast spliced aligner with low memory requirements. Nat Methods. 2015;12:357–360.
- Pertea M, Pertea GM, Antonescu CM, et al. StringTie enables improved reconstruction of a transcriptome from RNA-seq reads. Nat Biotechnol. 2015;33:290–295.
- Robinson MD, McCarthy DJ, Smyth GK. edgeR: a Bioconductor package for differential expression analysis of digital gene expression data. Bioinformatics. 2010;26:139–140.
- Li H, Handsaker B, Wysoker A, et al. The sequence alignment/map format and SAMtools. Bioinformatics. 2009;25:2078–2079.
- Quinlan AR, Hall IM. BEDTools: a flexible suite of utilities for comparing genomic features. Bioinformatics. 2010;26:841–842.
- Shen W, Le S, Li Y, et al. SeqKit: a cross-platform and ultrafast toolkit for FASTA/Q file manipulation. PloS One. 2016;11:e0163962.
- Wang L, Wang S, Li W. RSeQC: quality control of RNA-seq experiments. Bioinformatics. 2012;28:2184–2185.
- Kahles A, Ong CS, Zhong Y, et al. SplAdder: identification, quantification and testing of alternative splicing events from RNA-Seq data. Bioinformatics. 2016;32:1840–1847.
- Kono N, Arakawa K. Nanopore sequencing: review of potential applications in functional genomics. Dev Growth Differ. 2019;61:316–326.
- Rhoads A, Au KF. PacBio sequencing and its applications. Genomics Proteomics Bioinformatics. 2015;13:278–289.