
ABSTRACT
NEDD4 is an E3 ubiquitin ligase that recognizes substrates through protein–protein interactions and is involved in cancer development. This study aimed to elucidate the function of NEDD4 in colon cancer (CC) progression and its mechanism of action. NEDD4 was abundantly expressed in CC tissues and cells, and the overexpression of NEDD4 promoted the growth and metastasis of xenograft tumours as well as the tumorigenesis rate of primary CC in mouse models. In in vitro experiments, the silencing (or upregulation) of NEDD4 inhibited (or increased) the viability, invasion, and epithelial-to-mesenchymal transition of CC cells. The binding relationships between NEDD4 and FOXA1, FOXA1 and microRNA (miRNA)-340-5p, and miR-340-5p and ATF1 were validated by Co-immunoprecipitation, chromatin immunoprecipitation and luciferase assays, and NEDD4 was demonstrated to trigger FOXA1 ubiquitination and degradation. FOXA1 transcriptionally activated miR-340-5p, which subsequently bound to ATF1 mRNA. The upregulation of FOXA1 or miR-340-5p or the downregulation of ATF1 blocked certain functions of NEDD4 in CC cells. Altogether, NEDD4 was demonstrated to trigger FOXA1 ubiquitination and promote CC progression under the involvement of microRNA-340-5p suppression and ATF1 upregulation.
Introduction
Colon cancer (CC), also termed colorectal cancer (CRC), is the 4th most common cancer worldwide, with an estimated 1,096,601 cases and 551,269 deaths recorded in 2018 [Citation1]. Surgical resection is conducted on patients with early-stage CC, whereas chemotherapy is also conducted on patients with advanced stage CC, which has a high metastatic potential [Citation2]. Approximately 20% of all CC cases are first diagnosed at advanced stages, and the patients with CC have significantly higher recurrence and mortality rates than those with a localized disease and those who have received colectomy [Citation3]. Owing to an increased clinical awareness and the widespread use of colonoscopic screening in recent years, the incidence and mortality rates of CRC have declined in the past decades [Citation4]. However, in addition to improving the early diagnosis of CC, the development of more effective therapeutic options for CC is also urgently required.
The onset and progression of cancer depend upon abnormal gene expression and post-translational regulation, and protein ubiquitination is one of the major mediators of the post-translational regulation [Citation5,Citation6]. Ubiquitination promotes protein degradation via the proteasome pathway and contributes to protein translocation [Citation7]. Ubiquitination is a cascade of enzymatic reactions, where E3 ubiquitin ligase recognizes substrates through specific protein–protein interactions to control ubiquitin modification reactions [Citation8,Citation9]. Neural precursor cell-expressed developmentally downregulated protein 4 (NEDD4 or NEDD4-1), is a core member of the NEDD4 E3 ubiquitin ligase family, which reportedly regulate fluid and electrolyte homoeostasis, embryonic development and animal growth, and cancer pathogenesis [Citation6]. Importantly, NEDD4 reportedly promotes the ubiquitination of phosphatase and tensin homolog (PTEN), which is a common tumour suppressor, and exerts oncogenic functions in patients with CC [Citation10]; this prompted us to investigate its roles in CC progression and its mechanisms. Intriguingly, NEDD4 was reported to bind to forkhead box A1 (FOXA1) [Citation11]. FOXA1 is a pioneer transcription factor that is crucial for the growth and development of several endoderm-derived organs; however, its aberrant expression in cancer development remains controversial and unclear [Citation12]. Based on data in Oncomine Database (https://www.oncomine.org/resource/), FOXA1 in CC has a poor expression profile. Importantly, FOXA1 may block key cellular behaviours, including epithelial-mesenchymal transition (EMT) and metastasis of cancer cells [Citation13]; therefore, we surmised that NEDD4 regulates the ubiquitination of FOXA1 to promote CC progression. In addition, microRNA-340-5p (miR-340-5p), which is a microRNA that reportedly has tumour-suppressing roles in several cancer types [Citation14,Citation15], was validated as a target transcript of FOXA1 in the present study. Activating transcription factor 1 (ATF1), which is an oncogene [Citation16,Citation17], was confirmed as a target mRNA of miR-340-5p in the present study . Altogether, we hypothesized that NEDD4 triggers FOXA1 ubiquitination and degradation, which lead to changes in miR-340-5p and ATF1 expression and consequently affect CC progression. Both in vitro and in vivo experiments were performed to validate this hypothesis.
Material and methods
Clinical sample collection
Primary CC tissues and adjacent normal colorectal tissues (> 5 cm away from the lesion sites) were collected from 79 patients with CC at the First Hospital of Jilin University before March 2017. All the patients were diagnosed as primary CC and were without any other malignancies, family history of CC, or a history of chemotherapy or radiotherapy before surgical resection. The tissue samples were collected via surgical resection, immediately frozen in liquid nitrogen, and stored at −80°C until further use. The demographic and clinicopathological information of the patients, including age, sex, depth of cancer invasion, lymph node metastasis, distant metastasis, tumour-node-metastasis (TNM) stage, and histological classification, was collected (). Standard TNM staging, as described by the American Journal of Critical Care, Version 7 (2010), was performed. This research was approved by the Ethics Committee of the First Hospital of Jilin University and performed in accordance with the Declaration of Helsinki. Signed informed consent was obtained from eligible participants.
Table 1. Baseline clinical characteristics of the patients with CC
Cell transfection
Human CC cell lines (SW620, HCT116, SW480, Caco-2, Lovo, and RKO) were procured from the Cell Bank of the Chinese Academy of Sciences (Shanghai, China), and NCM460, a colonic mucosal epithelial cell line, was procured from the American Type Culture Collection (ATCC, Manassas, VA, USA). All cell lines underwent single nucleotide polymorphism array analysis and short tandem repeat sequence analysis. The cells were cultured in Dulbecco’s modified Eagle’s medium (DMEM) supplemented with 10% foetal bovine serum (FBS) and 1% penicillin-streptomycin (Beyotime Biotechnology Co., Ltd., Shanghai, China) and humidified atmosphere with 5% CO2 at 37°C. After recovery, the cells were sub-cultured for no more than four months, and the cells at passages 5 to 10 were harvested for subsequent experiments.
Cell transfection was performed using LipofectamineTM 2000 (Invitrogen Inc., Thermo Fisher Scientific Inc., Waltham, MA, USA) according to the manufacturer’s protocol. Gene upregulation was conducted by transfecting pcDNA3.1-eGFP-NEDD4 or pcDNA3.1-eGFP empty vector (designed and constructed by GenePharma Co., Ltd., Shanghai, China) into Lovo cells. Gene downregulation was conducted by transfecting short hairpin (sh)RNA targeting NEDD4 and shRNA control (sh scramble) (all from GenePharma) into Caco-2 cells. Afterwards, 50 μL of Lipofectamine 2000 reagent was mixed with 50 μL of antibiotic-free DMEM. The constructed overexpression vector and shRNA of NEDD4 were added to 200 μL of serum- and antibiotic-free DMEM. Then, the vector mixture was mixed with an equal volume of Lipofectamine 2000 mixture and allowed to stand at 25°C for 20 min. Lovo or Caco-2 cells were seeded in 96-well plates and washed twice, followed by the addition of 2 mL of the vector-Lipofectamine 2000 mixture. The cells were cultured at 37°C in a humidified atmosphere with 5% CO2 for 6 h, and the culture media were replaced with 10% FBS-supplemented DMEM for further incubation. After incubation for 48 h, the cells that were successfully transfected with stable pcDNA3.1-eGFP-NEDD4 were screened by using 300 µg/mL zeocin (Invitrogen) and cultured for another 12 days during which the culture medium was replaced every three days. The cells that were successfully transfected with stable shRNA-NEDD4 were screened by using 3 µg/mL puromycin (Invitrogen). Stable overexpression or downregulation of NEDD4 in the Lovo or Caco-2 cells, respectively, was validated by using reverse transcription quantitative polymerase chain reaction (RT-qPCR) and western blot analysis.
Tumour metastasis in mice
Twenty healthy male NOD/SCID mice (T cell- and B cell-deficient, 4 weeks old, 20 ± 1 g) were procured from SLAC Laboratory Animal Co., Ltd. (Shanghai, China) and divided into four groups. Suspensions (2 × 10⁶ cells/200 μL) of Lovo cells overexpressing NEDD4 or of Caco-2 cells with downregulated NEDD4 were mixed with Matrigel (BD Biosciences, San Jose, CA, USA) at a ratio of 1:1. Afterwards, either of the mixture was injected into each mouse through the caudal vein. Six weeks later, the mice were euthanized with 150 mg/kg pentobarbital, and the liver, lungs, and bone tissues of mice were harvested for further experiments. The experimental protocol in the present study was approved by the Committee on the Ethics of Animal Experiments of the First Hospital of Jilin University.
Growth of xenograft tumours in mice
Another 20 NOD/SCID mice were used for tumour growth experiments. Lovo and Caco-2 cells (2 × 10⁶ cells/200 μL) that were successfully transfected with stable pcDNA3.1-NEDD4 or sh-NEDD4 were mixed with Matrigel and subcutaneously injected in the dorsal region of the right leg of male NOD/SCID mice. Afterwards, swelling at injection sites was measured by using a digital caliper, and tumour size (V) was calculated at 7-day intervals for 28 days using the following formula: tumour volume = 0.523 × (length × width × thickness). The animals were euthanized on the 28th day, and xenograft tumours were harvested and weighed.
Establishment of a mouse model with CC
Male C57BL/6 mice (6–8 weeks old, 15–20 g) were procured from Changsheng Biotechnology Co., Ltd. (Liaoning, China), and male NEDD4-deficient mice (6–8 weeks old, 15–20 g) were procured from Jackson Laboratory (Bar Harbour, Maine, USA). All animals were housed under 12-hour dark/light cycle conditions at 25 ± 2°C and fed ad libitum. After a week of acclimatization, the mice were divided into four groups: NEDD4+/+ + H2O group, NEDD4+/+ + azoxymethane/dextran sodium sulphate (AOM/DSS) group, NEDD4−/- + H2O group, and NEDD4−/- + AOM/DSS group. AOM and DSS (MP Biomedicals, Santa Ana, CA, USA) were used to induce ulcerative colitis CC in mice. On day one, the mice were administered 10 mg AOM/kg. After seven days, the mice were provided water supplemented with 1.5% DSS for a week and distilled water for two weeks. Two DSS cycles were performed. Another two weeks after AOM injection, the mice that survived were euthanized. Whole colorectal tissues were harvested for the subsequent experiments.
Immunohistochemical staining
NEDD4 expression in mouse tissues was determined by immunohistochemical staining using a mouse anti-NEDD4 monoclonal antibody (14,915-1-AP, Proteintech, Rosemont, IL, USA); a standard avidin-biotin-peroxidase method was performed. Mouse tissue samples were embedded, cut into 4-μm sections, dewaxed, dehydrated in ethanol, and treated with 10 mmol/L prewarmed sodium citrate buffer (pH = 6.0) in a pressure cooker for 3 min, for antigen retrieval. The tissue sections were soaked in 3% H2O2 for 10 min to block the activity of the endogenous peroxidase and normal goat serum for 15 min for protection against non-specific staining. Thereafter, the sections were incubated with the primary antibody (1:50) at 4°C overnight, washed with phosphate-buffered saline (PBS), and incubated with biotinylated goat anti-rabbit secondary antibody for 30 min and the avidin-biotin-peroxidase mixture for 10 min. The staining results were developed using 3,3ʹ-diaminobenzidine (Sigma-Aldrich Chemical Company, St Louis, MO, USA). Afterwards, the sections were dehydrated, cleared with xylene, and counter-stained with haematoxylin (Solarbio Science & Technology Co., Ltd., Beijing, China). The staining results were observed under a multiheaded microscope (BX5110, Olympus Optical Co., Ltd, Tokyo, Japan), and the staining was evaluated as previously reported [Citation18].
Haematoxylin and eosin (HE) staining
The paraffin-embedded tissue sections were dewaxed, hydrated, and stained with haematoxylin for 5 min, and the sections were immersed in 1% acid alcohol (1% HCl in 70% alcohol) for 3 s and stained with eosin (Sangon Biotech Co., Ltd., Shanghai, China) for 3 min. Thereafter, the slides were dehydrated in ethanol, cleared with xylene, and observed and imaged under a microscope.
Immunofluorescence staining
The 4-µm sections were heated at 60°C for 2 h, dewaxed in xylene, rehydrated in 100%, 85%, and 75% ethanol, washed with water, and subjected to antigen retrieval. Next, the samples were treated with a fluorescence quencher (Cat. No. G1221, Servicebio Technology Co., Ltd., Wuhan, Hubei, China) for 5 min for protection against spontaneous fluorescence, and washed in water for 10 min. Thereafter, the sections were blocked with bovine serum albumin for 30 min and incubated with the primary antibodies against E-cadherin (#GB12082, 1:5000, Servicebio), vimentin (#PA1-10,003, 1:5000, Thermo Fisher Scientific), Snail (#MA5-14,801, 1:5000, Thermo Fisher Scientific), NEDD4 (1:5000, ab236512, Abcam, Inc., Cambridge, MA, USA), and FOXA1 (#53,528, 1:5000, Cell Signalling Technology, Beverly, MA, USA) at 4°C overnight. The following day, the sections were incubated with horseradish peroxidase (HRP)-labelled goat anti-rabbit immunoglobulin G (IgG, #GB23301, 1:500, Servicebio) at 37°C for 50 min and with 4ʹ, 6-diamidino-2-phenylindole for 10 min. After sealing with an anti-fluorescence quencher, the samples were imaged under a confocal microscope (Nikon Instruments Inc., Tokyo, Japan, magnification: 400×). The total volume of integrated optical density was measured by using Image-Pro Plus 6.0 (Media Cybernetics Inc., Bethesda, MD, USA).
Cell counting kit-8 (CCK-8) method
After transfection, Lovo and Caco-2 cells were seeded in 96-well plates for cultivation. At 0, 24, 48, 72, and 96 h, 10 μL CCK-8 solution was dispensed into each well (KeyGen BioTech, Jiangsu, China), and the seeded cells were incubated at 37°C for 2 h. To measure cell viability, the optical density of each well at 450 nm wavelength was determined by using a microplate reader (ELX-800, BioTek Instruments Inc., Winooski, VT, USA).
Carboxyfluorescein diacetate succinimidyl ester (CFSE) labelling
Cell proliferation assay was performed using CellTrace™ CFSE Kit (Thermo Fisher Scientific). Lovo and Caco-2 cell suspensions (106 cells/mL) were filled with 1 μL of CellTrace™ stock solution in dimethyl sulphoxide and maintained at 37°C in the absence of light for 20 min. Then, a five-fold diluted staining solution containing at least 1% protein was added to the cell suspensions for 5 min for acetate hydrolysis. Afterwards, the cells were incubated at 37°C in a humidified atmosphere with 5% CO2 for 5 days. On days 1 and 5, flow cytometry was performed using fluorescein with excitation and emission filters at 488 nm.
Acridine orange/ethidium bromide (AO/EB) double fluorescence staining
Cells were resuspended in 100 µL PBS and stained using AO/EB Staining Kit according to the manufacturer’s instructions. The final concentration of AO (USA-A6014, Sigma-Aldrich Chemical Company, St Louis, MO, USA) was 0.1 mM and that of EB (USA-E7340-5p, Sigma-Aldrich) was 0.25 mM. Morphological changes in apoptotic cells were measured using a fluorescence microscope (Olympus).
Colony formation assay
Treated cells were detached using trypsin, and the total number of cells was counted. Afterwards, the cells were seeded in 6-well plates at 200 cells/well, incubated for one week at 37°C, and stained with 0.5% crystal violet.
Flow cytometry
Cell apoptosis was evaluated using Annexin V-fluorescein isothiocyanate (FITC)-propidium iodide (PI) Apoptosis Detection Kit (Abcam). In brief, cells were seeded and incubated in 6-well plates, detached by trypsinization, and resuspended in binding buffer. Then, the cells were incubated with 5 μL Annexin V-FITC and 5 μL PI for 15 min. Cell apoptosis was characterized using a flow cytometer (FC500; BD Biosciences).
Western blot analysis
Cells were lysed in phenylmethylsulfonyl fluoride (proteinase inhibitor, Solarbio)-supplemented radioimmunoprecipitation assay (Solarbio) cell lysis buffer and centrifuged at 10,000 × g and 4°C for 10 min, after which the protein supernatant was collected. Protein concentration was determined using a bicinchoninic acid assay kit (Solarbio). Afterwards, 20-μg protein samples were electrophoresed on 8–12% SDS-PAGE and transferred onto polyvinylidene fluoride membranes (Millipore Corp., Billerica, MA, USA). Then, the membranes were blocked with 5% non-fat milk for one hour, incubated with primary antibodies against cytochrome c (Cyto C, #MA5-11,823, 1:1000, Thermo Fisher Scientific), PUMA (#24,633, 1:1000, Cell Signalling Technology (CST), Beverly, MA, USA), apoptotic protease activating factor-1 (Apaf1, 1:1000, ab2001, Abcam), E-cadherin (#GB12082, 1:5000, Servicebio), vimentin (#PA1-10,003, 1:5000, Thermo Fisher Scientific), Snail (#MA5-14,801, 1:5000, Thermo Fisher Scientific), NEDD4 (1:5000, ab236512, Abcam), FOXA1 (#53,528, 1:5000, CST, Beverly, MA, USA), N-cadherin (#GB13044, 1:10,000, Servicebio), and GAPDH (1:10,000, Proteintech) at 4°C overnight, and incubated with HRP-coupled rabbit anti-mouse antibody (1:3000, Solarbio) at 37°C for one hour. Protein bands were evaluated using the enhanced chemiluminescence method (Solarbio).
RT-qPCR
Total RNA was extracted using TRIzol (Cat. No. 12,183,555; Invitrogen, Thermo Fisher Scientific); and RNA concentration and integrity were assessed using NanoDrop-1000 (Thermo Fisher Scientific) and electrophoresis, respectively. A reverse transcription kit (Cat. No. A5001, Promega Corporation, Madison, WI, USA) was used to convert first-strand complementary DNA (cDNA), and miScript II RT Kit (QIAGEN GmbH, Hilden, Germany) was used for the reverse transcription of miRNA. Thereafter, PCR was performed using PrimScriptTM RT-PCR Kit (Cat. No. RR064A; Takara Biotechnology Ltd., Dalian, China). Quantification was performed using a real-time PCR system (ABI 7900HT, Applied Biosystems Inc., Carlsbad, CA, USA). The sequences of primers used are presented in .
Table 2. Primer sequences for RT-qPCR
Transwell assay
Lovo and Caco-2 cells were resuspended in serum-free DMEM and seeded onto Transwell apical chambers with membranes (8.0 µm, EMD Millipore). Basolateral chambers (24-well plates) were loaded with 10% FBS-DMEM. For the invasion assay, each apical chamber was precoated with Matrigel and loaded with 1 × 10⁵ cells. After 24 h of warm incubation at 37°C, the cells in the upper chamber have completely invaded. The migration of cells was determined in a similar manner as the invasion assay except for precoating Matrigel on the apical chambers. The migrated or invaded cells were fixed in 4% paraformaldehyde, stained with 0.5% crystal violet (Beyotime) for 30 min, and evaluated
Co-immunoprecipitation (Co-IP) assay
Cells were lysed in ice-cold IP buffer at 4°C for 10 min and centrifuged, after which the cell extracts were prewashed with protein A/G agarose (Millipore). IP antibodies and protein A/G-agarose were loaded into the pre-cleared supernatant and incubated at 4°C overnight under continuous inversion. Normal IgG was used as a negative control. Immunocompounds were washed five times and boiled in SDS buffer. Then, proteins were analysed by western blot analysis as described above.
Chromatin immunoprecipitation (ChIP)-qPCR
ChIP-qPCR assay was conducted on Lovo cells using SimpleChIP Plus Chromatin IP Kit (Cell Signalling Technology, Beverly, MA, USA) according to the manufacturer’s protocol. Lovo cells (1 × 10⁵) were seeded in a culture dish for 24 h and treated with bisphenol A or bisphenol S for 48 h. The precipitated DNA was dissolved in Tris-ethylene diamine tetraacetic acid (EDTA) buffer and subjected to qPCR as described above.
Dual-luciferase reporter gene assays
The wild-type (WT) sequence containing a putative binding site within miR-340-5p was obtained from StarBase (http://starbase.sysu.edu.cn/) and cloned into a pGL3 vector (Promega) to construct a WT luciferase reporter vector. The binding sequence was also mutated to construct a mutant-type (MT) sequence and vector. The WT and MT luciferase reporter vectors were designed and synthesized by GenePharma. Well-constructed vectors were then co-transfected with hsa-miR-340-5p mimic/mimic NC into 293 T cells using the LipofectamineTM 2000. pRL-TK vector containing the Renilla luciferase reporter was transfected into cells as an internal control. Forty-eight hours later, the relative luciferase activity in the cells was determined using Dual Luciferase Reporter Gene Kit (Promega).
In vitro ubiquitination analysis
Recombinant FOXA1 and NEDD4 proteins were incubated in 50 mM Tris (pH 7.6), 5 mM MgCl2, 2 mM ATP, 0.6 mM DTT, with/without 40 ng E1 UBE1 (Cat. No. E-305, Lot 16,114,714, Boston Biochem, Cambridge, MA, USA), 0.3 μg E2 UbcH5a/UBE2D1 (Cat. No. E2-616, Lot 04201314 C, Boston Biochem), and 1 μg of ubiquitin-FLAG (Cat. No. U-211, Lot DBGI0215011, Boston Biochem). Reactions were allowed to run at 30°C overnight, and the final reaction volume was 30 μL.
Biotin-RNA pull-down assay
The biotinylated ATF1 probe (5′-AGATCTTTTCAAGGCCTCCTGGCTCCGGGGTGT AGCCTC-3′) was designed and synthesized by RiboBio Co., Ltd. (Guangdong, China), and an oligonucleotide probe (5′-TATCACGTAGCCGTTGCATTTGCCGTAGCCCTGTGGGGGCC-3′) was constructed and used as a control. Lovo cells transfected with miR-340-5p mimic were lysed and incubated with biotinylated ATF1 probe. Thereafter, the biotin-coupled RNA compounds were pulled down using streptavidin-coated magnetic beads. Enriched ATF1 and miR-340-5p expression was evaluated by RT-qPCR. Biotinylated miRNA mimic or mutant were synthesized by RiboBio and were used for interaction with target mRNAs. The biotinylated miRNA mimic or mutant were transfected into 1 × 10⁷ cells overexpressing ATF1, and the cells were incubated for 48 h. Streptomycin-coated magnetic beads were lysed using binding buffer, and RNA compounds were purified using TRIzol reagent. The enrichment of ATF1 was determined using RT-qPCR.
Statistical analysis
SPSS software (version 22.0; IBM Corp. Armonk, NY, USA) was used for data analysis. Statistical data were collected from at least three independent experiments and are presented as mean ± standard deviation (SD). Differences were compared using Students t-test (two groups) and one-way or two-way analysis of variance (ANOVA) followed by Tukey’s multiple comparisons test (multiple groups). mRNA expression and protein abundance between normal and cancer tissues were compared using Mann-Whitney U test, and enumeration data were compared using Fisher’s exact test. A p < 0.05 was considered statistically significant.
Results
NEDD4 is abundantly expressed in CC tissues and cells
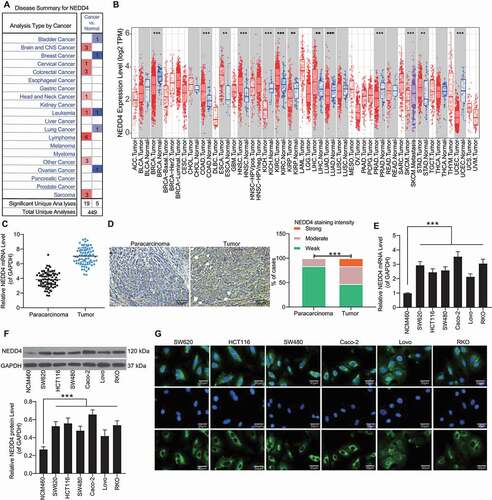
Data available in the Oncomine Database (https://www.oncomine.org/) indicated that NEDD4 is upregulated in several human cancers (highlighted in red in )). Using the Gene Expression Profiling Interactive Analysis (GEPIA) (http://gepia.cancer-pku.cn/index.html) of The Cancer Genome Atlas (TCGA), we further predicted that NEDD4 is highly expressed in cancer tissues in kidney renal clear cell carcinoma, uterine carcinosarcoma, and glioblastoma multiforme (). Tissue microarray indicated that NEDD4 has a high expression profile in the 79 pairs of CC tumour samples compared with the paracancerous tissues (). RT-qPCR and western blot analysis indicated that NEDD4 expression was higher in CC cell lines than in NCM460 cells (). The Caco-2 cell line with the highest NEDD4 expression and the Lovo cell line with the lowest NEDD4 expression among CC cell lines in the present study were selected for subsequent experiments. In addition, immunofluorescence staining results indicated that NEDD4 is mainly localized in the cytoplasm of CC cells ().
Figure 1. NEDD4 is highly expressed in CC tissues and cells. A, high expression profiles of NEDD4 in several human cancers according to the data on the Oncomine Database (https://www.oncomine.org/); B, NEDD4 in several cancer tissues predicted using the TCGA database and the GEPIA system; C, differentially expressed mRNAs in 79 pairs of CC tissue and normal tissue samples analysed by a microarray; D, staining intensity of NEDD4 in CC tumour tissues determined by immunohistochemistry; E-F, mRNA (E) and protein (F) expression of NEDD4 in CC cell lines (SW620, HCT116, SW480, Caco-2, Lovo and RKO) and in colonic mucosal epithelial cell line NCM460 determined by RT-qPCR and western blot analysis, respectively; F, subcellular localization of NEDD4 in CC cell lines determined by immunofluorescence staining. Data were exhibited as mean ± SD from three independent experiments. In panels B and C, Mann-Whitney U test was used to compare mRNA and protein abundance between tumour and normal tissues, while data in panels D and E were compared using one-way ANOVA and Tukey’s multiple comparison test. ** p < 0.01, *** p < 0.001
NEDD4 overexpression promotes CC cell growth and metastasis in NOD/SCID mice
Caco-2 cells with relatively high NEDD4 expression were transfected with pcDNA3.1-eGFP-shNEDD4 or the sh scramble (control), whereas Lovo cells with relatively poor NEDD4 expression were transfected with pCDNA3.1-eGFP-NEDD4 or empty vector; transfection efficacy is presented in Supplementary Fig. S1A–C. Well-transfected Caco-2 and Lovo cell lines were administered into NOD/SCID mice through the tail vein (for metastasis measurement) or subcutaneous injection (for growth measurement). The lung and liver tissues of mice were collected and stained with HE, and the number of metastatic nodules was examined. A significant increase in the number of metastatic nodules in the lung and liver tissues of NOD/SCID mice administered with NEDD4-overexpressing Lovo cells was observed. Accordingly, few metastatic nodules in the mice administered with NEDD4-deficient Caco-2 cells were observed (). In addition, cells in mouse bone marrow were collected, and the proportion of GFP-positive cells (Lovo or Caco-2 cells metastasized from tail veins) in total cells was evaluated; the upregulation of NEDD4 resulted in an increased number of Lovo cells in the bone marrow, whereas the downregulation of NEDD4 resulted in a decreased number of Caco-2 cells ()) These results indicate that NEDD4 promotes the metastasis of CC cells. In terms of tumour growth, NEDD4 overexpression resulted in an increased growth rate of Lovo cells in mice, whereas NEDD4 downregulation in Caco-2 cells in mice resulted in reduced tumour growth rate (). The immunohistochemical analysis of xenograft tumours from mice indicated that the positive expression of Ki67 in tumours was increased following NEDD4 upregulation in Lovo cells and that Ki67 expression in tumours was decreased in mice administered with NEDD4-deficient Caco-2 cells ()).
Figure 2. Overexpression of NEDD4 promotes CC cell growth and metastasis in NOD/SCID mice. A-B, number of metastatic nodules in lung (A) and liver (B) tissues determined by HE staining; C, number of GFP-positive cells in mouse bone marrow determined by flow cytometry; D, growth curves of xenograft tumours in mice according to the tumour growth in vivo; E, weight of the xenograft tumours in mice; F, number of Ki-67 positive cells in tumour tissues determined by immunohistochemical staining; G, a diagram for CC induction by AOM/DSS in both WT C56J/6B mice (NEDD4+/+) and mut (NEDD4−/-) mice; H, occurrence rate of CC in mice following AOM/ASS of H2O treatment; I, number of tumours in each type of mice; J, total volume of the tumours in NEDD4+/+ and NEDD4−/- mice; K, rate of Ki67-positive cells in tumour tissues in both mouse types determined by immunohistochemical staining. There were 5 ~ 6 mice in each group. Data were exhibited as mean ± SD from three independent experiments. In panels A, B, C, E, F, H and K data were compared using one-way ANOVA, while data in panel D were determined by one-way ANOVA followed by Tukey’s multiple comparison test; and data in panels I and J were compared using unpaired t test. ** p < 0.01, *** p < 0.001
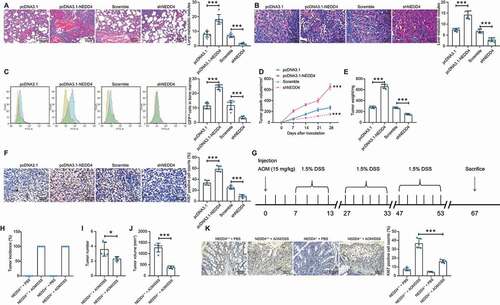
To elucidate the function of NEDD4 in CC progression, CC was induced in mice using AOM/DSS in WT C56J/6B mice (NEDD4+/+) and NEDD4−/- mice ()). After three cycles of DSS administration, CC was successfully induced in both NEDD4+/+and NEDD4−/- mice. The number, size, and weight of tumours in NEDD4−/- mice were less than those in WT mice (). Immunohistochemistry results indicated that positive-Ki67 rates in NEDD4−/- mice tumour tissues were lower than those in WT mice (). These findings reveal that NEDD4 promotes the cell growth and metastasis of CC in mice.
NEDD4 silencing decreases the viability of CC cells
Following the findings above, we focused on the role of NEDD4 in vitro. CCK-8 assay results indicated that the viability of Lovo cells was increased upon NEDD4 overexpression, while that of Caco-2 cells was decreased after NEDD4 downregulation ()). Similarly, CFSE labelling revealed that the number of CFSE-positive cells (proliferative cells) was increased following NEDD4 upregulation, while the CFSE-positive rate in Caco-2 cells decreased upon NEDD4 silencing (). Similar results were found in the colony formation assay, where the number of colonies formed by Caco-2 cells was reduced, while that of Lovo cells was increased (). In terms of cell apoptosis, NEDD4 overexpression increased the number of Annexin-V-FITC/PI-positive Lovo cells, while NEDD4 downregulation reduced the number of apoptotic Lovo cells (). Likewise, the AO/EB staining results suggested that overexpression of NEDD4 in Lovo cells increased the number of cells stained in green (live cells) and reduced the number of cells stained in orange (dead cells). Again, the downregulation of NEDD4 in Caco-2 cells led to a reverse trend (). Western blot analysis of apoptotic molecules suggested that the levels of Cyto C, PUMA, Apaf-1, and Bax were decreased when NEDD4 was upregulated, but those levels were increased in Caco-2 cells where NEDD4 was suppressed ()).
Figure 3. Silencing of NEDD4 inhibits viability of CC cells. A, viability of Lovo and Caco-2 cells determined by CCK-8 method; B, proliferation ability of Caco-2 cells measured by CFSE staining; C, number of cell colonies measured by the colony formation assay; D, apoptosis rate of cells determined by flow cytometry; E, ratio of live/dead cells detected using the AO/EB staining; F, protein levels of apoptosis-related factors (Cyto C, PUMA, Apaf-1 and Bax) detected by western blot analysis; G-H, mRNA (G) and protein (H) expression of N-cadherin, Vimentin and Snail in Caco-2 and Lovo cells determined by RT-qPCR and western blot analysis, respectively; I, fluorescence intensity of N-cadherin and Vimentin in cells validated by immunofluorescence staining; J-K, migration (J) and invasion (K) abilities of cells determined by Transwell assays. Data were exhibited as mean ± SD from three independent experiments. In panels A, E, F, G, H and I, data were compared using two-way ANOVA, while data in panels B, C, D, J and K were determined by one-way ANOVA followed by Tukey’s multiple comparison test. ** p < 0.01, *** p < 0.001
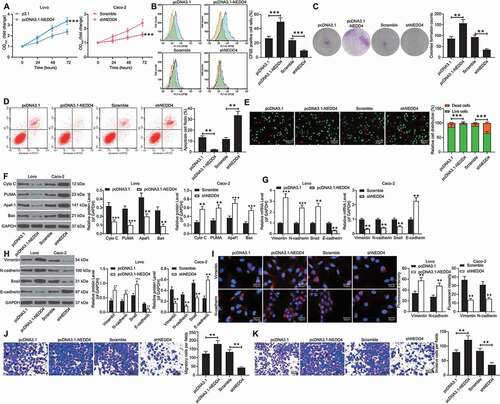
In addition, the expression levels of N-cadherin, vimentin, and Snail were increased, whereas those of E-cadherin were decreased in the Lovo cells. Contrasting results were observed in the Caco-2 cells (); the fluorescence intensities of vimentin and N-cadherin were increased in Lovo cells and reduced in Caco-2 cells ()). Transwell assays indicated that the number of Lovo cells that invaded and migrated into the basolateral chambers was increased, and conversely, that of Caco-2 cells was notably decreased ().
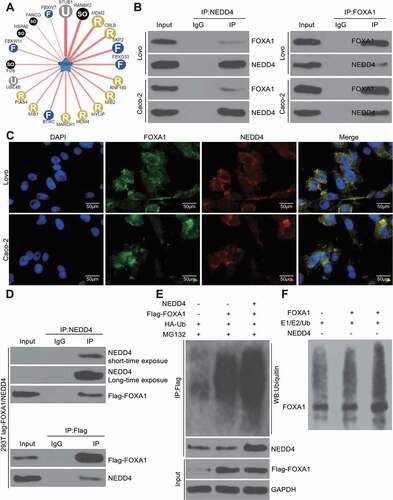
Overexpression of NEDD4 promotes FOXA1 ubiquitination and degradation
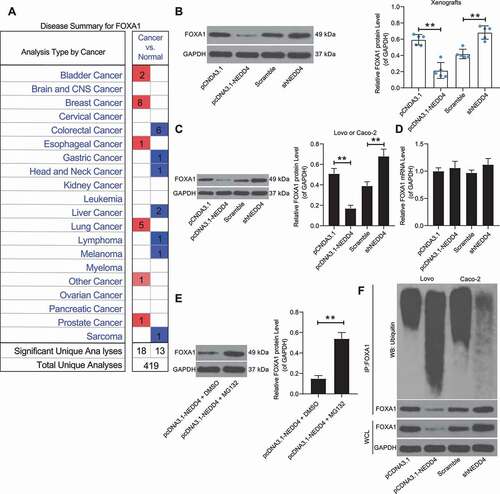
Following the findings above, we further validated the correlation between NEDD4 and FOXA1 expression. According to Oncomine data, FOXA1 was suggested to be poorly expressed in CC ()). Intriguingly, we noticed that the protein levels of FOXA1 in Lovo cells (or in the corresponding xenograft tumour tissues) decreased following NEDD4 overexpression, while the FOXA1 protein levels in Caco-2 cells (or in the xenograft tumour tissues) increased when NEDD4 was suppressed (), but the mRNA expression of FOXA1 in the cells showed no significant changes ()). In addition, MG132, a proteasome inhibitor that specifically inhibits ubiquitinase activity, was administered to Lovo cells, following which the protein levels of FOXA1 in these cells notably increased ()). These results indicated that FOXA1 was mainly degraded by proteasomes. The ubiquitination/proteinase degradation system can regulate the protein levels of FOXA1. Additionally, an overexpression of NEDD4 in Lovo cells was found to trigger the ubiquitination of FOXA1, and accordingly, a downregulation of NEDD4 in Cano cells led to a decline in FOXA1 ubiquitination ()). Therefore, we speculated that NEDD4 may induce the ubiquitination and degradation of FOXA1.
Figure 4. Overexpression of NEDD4 promotes ubiquitination and degradation of FOXA1. A, poor expression of FOXA1 in CC suggested on the oncomine database; B-C, protein level of FOXA1 in xenograft tumours (B) and in Lovo and Caco-2 cells determined by western blot analysis; D, mRNA expression of FOXA1 in Lovo and Caco-2 cells measured by RT-qPCR; E, proteome level of FOXA1 in Lovo cells following MG132 administration detected by western blot analysis; F, ubiquitination of FOXA1 in Lovo and Caco-2 cells determined by IP. Data were exhibited as mean ± SD from three independent experiments. In panels B, C and I, data were compared using one-way ANOVA followed by Tukey’s multiple comparison test, while data in panel E ware analysed by the unpaired t test. ** p < 0.01, *** p < 0.001
NEDD4 serves as an E3 ubiquitin ligase targeting FOXA1 degradation
E3 ubiquitin ligases are major regulatory proteins that control ubiquitination-protein degradation, whereas NEDD4 is a typical E3 ubiquitin ligase. We speculated that NEDD4 might be responsible for FOXA1 ubiquitination and degradation. Thereafter, we first predicted the possible E3 ubiquitin ligases that target FOXA1 using the UbiBrowser Database (http://ubibrowser.ncpsb.org/) ()), and 92 E3 ligases were identified, including NEDD4. The binding relationship between NEDD4 and FOXA1 was first validated using the IP assay, which confirmed the presence of FOXA1 protein in the compounds precipitated by NEDD4-specific antibodies in Lovo and Caco-2 cells. Accordingly, a positive expression of NEDD4 was found in the compound precipitated by the antibody against FOXA1 ()), implying that NEDD4 could bind to the FOXA1 protein. In accordance with these findings, a yellow signal was observed in the cells following immunofluorescence double staining, which was due to the merging of the signals of the FOXA1 staining (red fluorescence) and NEDD4 staining (green fluorescence) (). In addition, we co-transfected NEDD4 and Flag-FOXA1 into 293 T cells, after which we identified positive NEDD4 protein expression in the protein compounds precipitated by anti-Flag, and positive Flag expression was found in the protein compounds precipitated by anti-NEDD4 (). Further, the overexpression of HA-ubiquitin, Flag-FOXA1, or NEDD4 was induced in the 293 T cells, and the results showed that the ubiquitination level of FOXA1 increased following NEDD4 overexpression (). To further validate whether NEDD4 regulates FOXA1 ubiquitination, an in vitro ubiquitination assay was performed. After the addition of E1, E2, and NEDD4 recombinant protein, the ubiquitination level of FOXA1 was notably enhanced, while FOXA1 ubiquitination was not observed in the absence of NEDD4 ()). Collectively, these results validated that NEDD4 can bind to FOXA1 and trigger its ubiquitination and degradation.
Figure 5. NEDD4 serves as an E3 ubiquitin ligase targeting FOXA1 degradation. A, potential E3 ubiquitin ligases that can bind to E3 predicted on ubibrowser; B, binding relationship between Lovo and Caco-2 examined by IP in Lovo and Caco-2 cells; C, subcellular localization of NEDD4 and FOXA1 examined by immunofluorescence double staining; D, NEDD4 and Flag-FOXA1 vector were co-transfected in 293 T cells, and the binding relationship between NEDD4 and FOXA1 was further validated by IP using the anti-Flag and Anti-NEDD4 antibodies; E, overexpression of HA-ubiquitin, flag-FOXA1 or NEDD4 was introduced in 293 T cells, and then the ubiquitination level of FOXA1 was validated by IP; F, NEDD4-mediated ubiquitination regulation on FOXA1 validated by an in-vitro ubiquitination assay. At least three independent experiments were performed
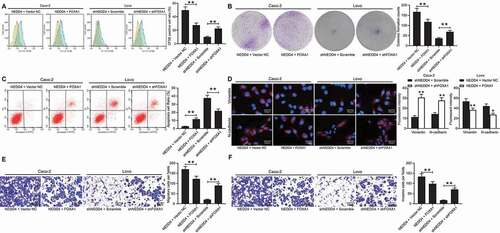
FOXA1 counteracts the functions of NEDD4 in CC cells
To validate the role of FOXA1 in CC development, FOXA1 overexpression was further induced in the Lovo cells, while FOXA1 knockdown was induced in the Caco-2 cells (Supplementary Fig S2A–B). After that, the number of CFSE-positive cells and the number of colonies formed by the Lovo cells, which were initially increased by NEDD4, were reduced following FOXA1 overexpression, and the apoptosis rate of Lovo cells was elevated. Meanwhile, the proliferation and colony formation ability of the Caco-2 cells were restored after further FOXA1 inhibition, and cell apoptosis was reduced (). In addition, the fluorescence intensities of vimentin and N-cadherin were low in the Lovo cells and high in the Caco-2 cells ()). The migration and invasion ability of Lovo cells declined upon FOXA1 upregulation, whereas those of Caco-2 cells increased after FOXA1 downregulation ().
Figure 6. FOXA1 counteracts the functions of NEDD4 in CC cells. Artificial upregulation of FOXA1 was introduced in Lovo cells overexpressing NEDD4 while downregulation of FOXA1 was further introduced in Caco-2 cells with suppressed NEDD4. A, proliferation of cells determined by CFSE staining; B, number of formed colonies measured by colony formation assay; C, apoptosis rate of cells determined by flow cytometry; D, intensities of N-cadherin and vimentin determined by immunofluorescence staining; E-F, migration (E) and invasion (F) abilities of cells determined by transwell assays. Data were exhibited as mean ± SD from three independent experiments. Data in panels A, B, C, E and F were analysed using one-way ANOVA while in panel D by two-way ANOVA, followed by Tukey’s multiple comparison. ** p < 0.01
FOXA1 transcriptionally activates miR-340-5p to inhibit ATF1 expression
FOXA1 has been reported to mediate the transcriptional activity of miRNAs (miR-100-5p and miR-125b-5p) to affect the growth and metastasis of NPC cells [Citation19]. Poor expression of miR-340, according to a study by Takeyama et al., was found to promote the liver metastasis of CRC cells [Citation20]. Data from the UCSC browser (http://genome.ucsc.edu/) suggested that miR-340-5p shared the promoter sequence with RNF130 (), and data from JASPAR (http://jaspar.genereg.net/) suggested that FOXA1 could bind to the promoter region of miR-340-5p (). We assumed that FOXA1 might regulate the transcriptional activity of miR-340-5p. According to the ChIP-qPCR assay, compared to the DNA–protein compound precipitated by the anti-IgG, an enrichment of miR-340-5p promoter fragments was found in the compound precipitated by the FOXA1-specific antibody (). In addition, miR-340-5p expression was decreased in the CC tissues compared to that in the normal tissues of the 79 CC patients ()). Importantly, miR-340-5p was also found to be poorly expressed in Lovo cells after NEDD4 upregulation, while it was highly expressed in Caco-2 cells after NEDD4 silencing ()), indicating that NEDD4 possibly induces FOXA1 degradation and the subsequent transcriptional inactivation of miR-340-5p in CC cells.
Figure 7. FOXA1 transcriptionally activates miR-340-5p to inhibit ATF1 expression. A, miR-340-5p shared the promoter sequence with RNF130 according to the data on UCSC browser (http://genome.ucsc.edu/); B, conservative binding sequence of FOXA1; C, binding site between FOXA1 and miR-340-5p predicted on JASPAR (http://jaspar.genereg.net/); D, binding sites between FOXA1 and the promoter region of miR-340-5p validated by ChIP-qPCR assay; E, miR-340-5p expression in 79 pairs of CC tumour and normal tissues determined by RT-qPCR; F, miR-340-5p expression in lovo and caco-2 cells determined by RT-qPCR; G, target mRNAs of miR-340-5p predicted from four bioinformatic systems; H, binding sequence between miR-340-5p and ATF1 predicted on starbase (http://starbase.sysu.edu.cn/) and validated using a luciferase assay; I, enrichment of ATF1 fragments examined using a biotinylated RNA pull down assay; J, mRNA expression of ATF1 in 79 pairs of CC tumour and normal tissues determined by RT-qPCR; K, staining intensity of ATF1 in tumour tissues and the adjacent normal tissues determined by immunofluorescence staining; L-M, mRNA (L) and protein (M) expression of ATF1 in lovo and caco-2 cells detected by RT-qPCR and western blot analysis, respectively. data were exhibited as mean ± SD from three independent experiments. Data in panels D and H were analysed using two-way ANOVA while in panels F, I, L and M by two-way ANOVA, and Tukey’s multiple comparison was used for post hoc test following ANOVA; data in panels E, J, and K were analysed using the mann-whitney U test. ** p < 0.01, *** p < 0.001
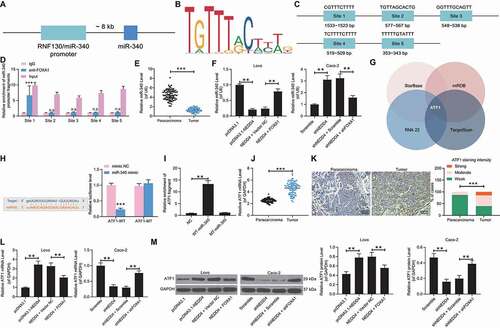
To confirm the downstream molecules involved, we then predicted the candidate target mRNAs of miR-340-5p using four bioinformatic systems: Starbase (http://starbase.sysu.edu.cn/), TargetScan (http://www.targetscan.org/vert_72/), RNA22 (https://cm.jefferson.edu/rna22/), and miRDB (http://mirdb.org/). The crosscheck suggested that ATF1 had the highest prediction score ()). Interestingly, miR-340-5p has been reported as a negative regulator of ATF1 in lung cancer and has shown an important suppressive effect on cell proliferation and invasion [Citation21]. We then wondered if there was a similar network in CC. The putative binding site between miR-340-5p and the ATF1 3′UTR was obtained from StarBase. Next, a dual-luciferase reporter gene assay was performed. The ATF1-WT and ATF1-MT luciferase vectors containing the putative or mutant binding site between miR-340-5p and ATF1 3′UTR were designed and co-transfected with miR-340-5p mimic or mimic NC into 293 T cells. We found that co-transfection of miR-340-5p mimic and ATF1-WT led to a decline in the luciferase activity in cells, while no significant changes were found following other co-transfections ()). In addition, a biotin-RNA pull-down assay was performed, which revealed an enrichment of ATF1 fragments in the compound precipitated by the miR-340-5p probe ()). We further noticed that the mRNA expression of ATF1 was increased in CC tissues ()), and a positive association was found between ATF1 and NEDD4 expression in Lovo and Caco-2 cells ()), indicating an inverse correlation between ATF1 and miR-340.
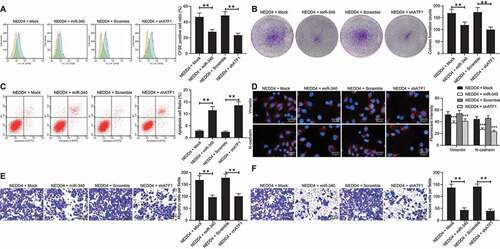
miR-340-5p mimic or sh-ATF1 diminishes the promotion of NEDD4 upon CC cell growth
To examine the involvement of miR-340-5p and ATF1 in NEDD4-mediated events, a miR-340-5p mimic or shRNA of ATF1 was further introduced in Lovo cells overexpressing NEDD4 (Supplementary Fig S3A-B). It was found that the number of CFSE-positive cells and the number of cell colonies reduced, while the apoptosis rate of cells increased following miR-340-5p overexpression and ATF1 downregulation ()). In addition, the fluorescence intensities of vimentin and N-cadherin in Lovo cells, as well as the number of invaded and migrated cells, were notably reduced following the administration of the miR-340-5p mimic or shATF1 ()). These results indicated that the downregulation of miR-340-5p and upregulation of ATF1 were, at least partially, involved in the oncogenic events mediated by NEDD4.
Figure 8. miR-340-5p mimic or sh-ATF1 diminishes the promotion of NEDD4 on CC cell growth. miR-340-5p mimic or shRNA of ATF1 was further introduced in Lovo cells overexpressing NEDD4. A, proliferation of cells determined by CFSE staining; B, number of formed colonies measured by colony formation assay; C, apoptosis rate of cells determined by flow cytometry; D, intensities of N-cadherin and Vimentin determined by immunofluorescence staining; E-F, migration (E) and invasion (F) abilities of cells determined by Transwell assays. Data were exhibited as mean ± SD from three independent experiments. Data in panels A, B, C, E and F were analysed using one-way ANOVA while in panel D by two-way ANOVA, followed by Tukey’s multiple comparison. ** p < 0.01
Discussion
Aberrant proliferation and migration activities are major contributors to unfavourable prognosis, especially in advanced metastatic diseases, including CC. Abnormal expression of NEDD4 has been implicated in cancer progression through its specific mediation in ubiquitination and degradation of target substrates [Citation22]. Here, we report that NEDD4 promotes the growth, development, and metastasis of CC cells in both animal and cell studies, during which the ubiquitination of FOXA1 and the subsequent downregulation of miR-340-5p and upregulation of ATF1 are possibly implicated.
NEDD4 is frequently overexpressed in human cancers and mediates a wide array of cellular processes responsible for tumorigenesis [Citation22]. For instance, high expression of NEDD4 was found in bladder cancer [Citation23], breast cancer [Citation24], and hepatocellular carcinoma [Citation25], and was linked to an unfavourable prognosis and shorter survival time of patients. The same trend was found with CC, in which NEDD4 was highly expressed and promoted cell growth [Citation26,Citation27]. The abundance of NEDD4 was also suggested in the Oncomine database. In accordance with these trends, the initial findings of the present study confirmed high levels of NEDD4 in both the tissue samples from CC patients and in the acquired CC cell lines. The subsequent in vivo experiments suggested that NEDD4 was positively linked to the growth and metastasis of xenograft tumours, as well as the tumorigenesis rate of the primary tumours in mice. An increase in the positive expression of Ki67, a well-known marker for cancer cell proliferation [Citation28], was also identified in the tumour tissues of mice overexpressing NEDD4. These results were reproduced in in vitro experiments where NEDD4 upregulation promoted the proliferation, migration, invasion, EMT, and resistance to apoptosis of CC cells. Collectively, these results validated the oncogenic role of NEDD4 in CC progression.
The cytoplasmic localization of NEDD4 was identified in CC cell lines, and NEDD4 was found to regulate multiple substrates to exert specific functions. Ubiquitination of PTEN has been implicated in the oncogenic functions of NEDD4 in CC patients [Citation10]. Similarly, ubiquitination of p21 has also been noted as a mechanism mediated by NEDD4, which is responsible for an increased proliferation of CRC cells [Citation29]. Here, we first identified an inverse relationship between the protein expression of FOXA1 and NEDD4 in CC cells, but the mRNA expression of FOXA1 showed no significant changes. A proteasome inhibitor led to an increase in FOXA1 protein expression, and the IP results regarding the binding relationship between FOXA1 and NEDD4 further validated that NEDD4 promoted the ubiquitination and degradation of FOXA1. FOXA1 has been noted as a tumour promoter [Citation30,Citation31], and its downregulation by upstream miRNAs results in cancer inhibition. On the other hand, the suppressive roles of FOXA1, especially in the EMT and metastasis of cancer cells, have been well documented [Citation32,Citation33]. Twist1, another EMT biomarker, was reported to promote the invasion and metastasis of malignant cells by silencing FOXA1 expression [Citation34]. FOXA1 has also been suggested to be crucial for epithelial lineage differentiation, whose loss leads to the activation of the transforming growth factor beta pathway, EMT, and cell motility [Citation35]. More importantly, FOXA1 was found to decrease radioresistance in CRC cells [Citation36]. In this study, we validated that an overexpression of FOXA1 suppresses the proliferation, colony formation, EMT, invasion, and migration promoted by NEDD4, and induces the apoptosis of cells. FOXA1 has been reported to mediate the transcriptional activity of miRNAs (miR-100-5p and miR-125b-5p) to affect the growth and metastasis of NPC cells [Citation19]. Here, we found that FOXA1 binds to the promoter region of miR-340-5p, while miR-340-5p further bound to ATF1 mRNA and induced ATF1 downregulation. miR-340-5p expression was positively correlated with FOXA1 and inversely correlated with ATF1 expression in the collected tumour tissues and the Lovo and Caco-2 cell lines. miR-340-5p is a potential prognostic biomarker and therapeutic target for CC via the suppression of ANXA3 expression [Citation37]. Likewise, the suppression of miR-340-5p by the long non-coding RNA LINC00662 was reported to trigger the growth and metastasis of CC tumours [Citation38]. In contrast, ATF1 is an oncogene. A recent study reported ATF1 in the genome-wide association study Loci as a crucial driver in CC by activating a subset of genes involved in an increased risk of CC [Citation39]. Interestingly, in line with our findings, miR-340-5p was found to be a regulator of ATF1, whose aberrant expression by LINC01354 leads to the proliferation and invasion of lung cancer [Citation21]. Additional rescue experiments in which miR-340-5p mimic or sh-ATF1 counteracted the promoting functions of NEDD4 on CC cell growth further validated their relevance in NEDD4-regulated events.
In conclusion, this study demonstrated a novel molecular mechanism involving NEDD4/FOXA1/miR-340-5p/ATF1 in the development of CC. The findings of this study offer novel insights that would serve useful in the elucidation of the pathogenesis of CC as well as in the development of gene-based treatments for CC. We hope that more studies will be conducted to examine our findings and to provide more ideas to aid humanity’s persistent efforts towards the cure of malignancies, including CC.
Declosure statement
The authors declared no conflict of interest.
Supplemental Material
Download MS Word (1.8 MB)Data availability statement
All the data generated or analyzed during this study are included in this published article.
Disclosure statement
No potential conflict of interest was reported by the authors.
Supplementary material
Supplemental data for this article can be accessed here.
References
- Bray F, Ferlay J, Soerjomataram I, et al. Global cancer statistics 2018: GLOBOCAN estimates of incidence and mortality worldwide for 36 cancers in 185 countries. CA Cancer J Clin. 2018;68(6):394–424.
- Wen J, Min X, Shen M, et al. ACLY facilitates colon cancer cell metastasis by CTNNB1. J Exp Clin Cancer Res. 2019;38(1):401.
- Moghadamyeghaneh Z, Hanna MH, Hwang G, et al. Outcomes of colon resection in patients with metastatic colon cancer. Am J Surg. 2016;212(2):264–271.
- Siegel RL, Miller KD, Jemal A. Cancer statistics, 2020. CA Cancer J Clin . 2020;70(1):7–30.
- Jeusset LM, McManus KJ. Developing targeted therapies that exploit aberrant histone ubiquitination in cancer. Cells. 2019;8(2). DOI:10.3390/cells8020165
- Zou X, Levy-Cohen G, Blank M. Molecular functions of NEDD4 E3 ubiquitin ligases in cancer. Biochim Biophys Acta. 2015;1856(1):91–106.
- Debelouchina GT, Gerecht K, Muir TW. Ubiquitin utilizes an acidic surface patch to alter chromatin structure. Nat Chem Biol. 2017;13(1):105–110.
- Tu J, Zhang B, Fang G, et al. Neddylation-mediated Nedd4-2 activation regulates ubiquitination modification of renal NBCe1. Exp Cell Res. 2020;390(2):111958.
- Yao H, Xu J. Regulation of Cancer Immune Checkpoint: mono- and Poly-Ubiquitination: tags for Fate. Adv Exp Med Biol. 2020;1248:295–324.
- Hong SW, Moon JH, Kim JS, et al. p34 is a novel regulator of the oncogenic behavior of NEDD4-1 and PTEN. Cell Death Differ. 2014;21(1):146–160.
- Tan Y, Jin C, Ma W, et al. Dismissal of RNA polymerase ii underlies a large ligand-induced enhancer decommissioning program. Mol Cell. 2018;71(4):526–539 e8.
- Parolia A, Cieslik M, Chu SC, et al. Distinct structural classes of activating FOXA1 alterations in advanced prostate cancer. Nature. 2019;571(7765):413–418.
- Huang JZ, Chen M, Zeng M, et al. Down-regulation of TRPS1 stimulates epithelial-mesenchymal transition and metastasis through repression of FOXA1. J Pathol. 2016;239(2):186–196.
- Liu L, Yan Y, Zhang G, et al. Knockdown of LINC01694 inhibits growth of gallbladder cancer cells via miR-340-5p/Sox4. Biosci Rep. 2020;40(4):BSR20194444.
- Shi S, Chen X, Liu H, et al. LGR5 acts as a target of miR-340-5p in the suppression of cell progression and drug resistance in breast cancer via Wnt/beta-catenin pathway. Gene. 2019;683:47–53.
- Ding G, Li W, Liu J, et al. LncRNA GHET1 activated by H3K27 acetylation promotes cell tumorigenesis through regulating ATF1 in hepatocellular carcinoma. Biomed Pharmacother. 2017;94:326–331.
- Xu Y, Zhou W, Zhang C, et al. Long non-coding RNA RP11-552M11.4 favors tumorigenesis and development of cervical cancer via modulating miR-3941/ATF1 signaling. Int J Biol Macromol. 2019;130:24–33.
- Li D, Xiao L, Ge Y, et al. High expression of Tob1 indicates poor survival outcome and promotes tumour progression via a Wnt positive feedback loop in colon cancer. Mol Cancer. 2018;17(1):159.
- Yuan Z, Ye M, Qie J, et al. FOXA1 promotes cell proliferation and suppresses apoptosis in HCC by directly regulating miR-212-3p/FOXA1/AGR2 signaling pathway. Onco Targets Ther. 2020;13:5231–5240.
- Takeyama H, Yamamoto H, Yamashita S, et al. Decreased miR-340 expression in bone marrow is associated with liver metastasis of colorectal cancer. Mol Cancer Ther. 2014;13(4):976–985.
- Yang G, Yang C, She Y, et al. LINC01354 enhances the proliferation and invasion of lung cancer cells by regulating miR-340-5p/ATF1 signaling pathway. Artif Cells Nanomed Biotechnol. 2019;47(1):3737–3744.
- Wang ZW, Hu X, Ye M, et al. NEDD4 E3 ligase: functions and mechanism in human cancer. In Semin Cancer Biol. 2020;67(Pt 2):92-101.
- Wen W, Li J, Wang L, et al. Inhibition of NEDD4 inhibits cell growth and invasion and induces cell apoptosis in bladder cancer cells. Cell Cycle. 2017;16(16):1509–1514.
- Wan L, Liu T, Hong Z, et al. NEDD4 expression is associated with breast cancer progression and is predictive of a poor prognosis. Breast Cancer Res. 2019;21(1):148.
- Zheng H, Ke X, Li D, et al. NEDD4 promotes cell growth and motility in hepatocellular carcinoma. Cell Cycle. 2018;17(6):728–738.
- Eide PW, Cekaite L, Danielsen SA, et al. NEDD4 is overexpressed in colorectal cancer and promotes colonic cell growth independently of the PI3K/PTEN/AKT pathway. Cell Signal. 2013;25(1):12–18.
- Kim SS, Yoo NJ, Jeong EG, et al. Expression of NEDD4-1, a PTEN regulator, in gastric and colorectal carcinomas. APMIS. 2008;116(9):779–784.
- Yang C, Zhang J, Ding M, et al. Ki67 targeted strategies for cancer therapy. Clin Transl Oncol. 2018;20(5):570–575.
- Zhang S, Yu C, Yang X, et al. N-myc downstream-regulated gene 1 inhibits the proliferation of colorectal cancer through emulative antagonizing NEDD4-mediated ubiquitylation of p21. J Exp Clin Cancer Res. 2019;38(1):490.
- Shen SQ, Huang LS, Xiao XL, et al. miR-204 regulates the biological behavior of breast cancer MCF-7 cells by directly targeting FOXA1. Oncol Rep. 2017;38(1):368–376.
- Wang D, Ren J, Ren H, et al. MicroRNA-132 suppresses cell proliferation in human breast cancer by directly targeting FOXA1. Acta Pharmacol Sin. 2018;39(1):124–131.
- BenAyed-Guerfali D, Dabbeche-Bouricha E, Ayadi W, et al. Association of FOXA1 and EMT markers (Twist1 and E-cadherin) in breast cancer. Mol Biol Rep. 2019;46(3):3247–3255.
- Lin M, Pan J, Chen Q, et al. Overexpression of FOXA1 inhibits cell proliferation and EMT of human gastric cancer AGS cells. Gene. 2018;642:145–151.
- Xu Y, Qin L, Sun T, et al. Twist1 promotes breast cancer invasion and metastasis by silencing Foxa1 expression. Oncogene. 2017;36(8):1157–1166.
- Song B, Park SH, Zhao JC, et al. Targeting FOXA1-mediated repression of TGF-beta signaling suppresses castration-resistant prostate cancer progression. J Clin Invest. 2019;129(2):569–582.
- Chen X, Liu J, Zhang Q, et al. Exosome-mediated transfer of miR-93-5p from cancer-associated fibroblasts confer radioresistance in colorectal cancer cells by downregulating FOXA1 and upregulating TGFB3. J Exp Clin Cancer Res. 2020;39(1):65.
- Yang L, Men WL, Yan KM, et al. MiR-340-5p is a potential prognostic indicator of colorectal cancer and modulates ANXA3. Eur Rev Med Pharmacol Sci. 2018;22(15):4837–4845.
- Cheng B, Rong A, Zhou Q, et al. LncRNA LINC00662 promotes colon cancer tumor growth and metastasis by competitively binding with miR-340-5p to regulate CLDN8/IL22 co-expression and activating ERK signaling pathway. J Exp Clin Cancer Res. 2020;39(1):5.
- Tian J, Chang J, Gong J, et al. Systematic functional interrogation of genes in GWAS loci identified ATF1 as a key driver in colorectal cancer modulated by a promoter-enhancer interaction. Am J Hum Genet. 2019;105(1):29–47.