
 ?Mathematical formulae have been encoded as MathML and are displayed in this HTML version using MathJax in order to improve their display. Uncheck the box to turn MathJax off. This feature requires Javascript. Click on a formula to zoom.
ABSTRACT
TrmB belongs to the class I S-adenosylmethionine (SAM)-dependent methyltransferases (MTases) and introduces a methyl group to guanine at position 7 (m7G) in tRNA. In tRNAs m7G is most frequently found at position 46 in the variable loop and forms a tertiary base pair with C13 and U22, introducing a positive charge at G46. The TrmB/Trm8 enzyme family is structurally diverse, as TrmB proteins exist in a monomeric, homodimeric, and heterodimeric form. So far, the exact enzymatic mechanism, as well as the tRNA-TrmB crystal structure is not known. Here we present the first crystal structures of B. subtilis TrmB in complex with SAM and SAH. The crystal structures of TrmB apo and in complex with SAM and SAH have been determined by X-ray crystallography to 1.9 Å (apo), 2.5 Å (SAM), and 3.1 Å (SAH). The obtained crystal structures revealed Tyr193 to be important during SAM binding and MTase activity. Applying fluorescence polarization, the dissociation constant Kd of TrmB and tRNAPhe was determined to be 0.12 µM ± 0.002 µM. Luminescence-based methyltransferase activity assays revealed cooperative effects during TrmB catalysis with half-of-the-site reactivity at physiological SAM concentrations. Structural data retrieved from small-angle x-ray scattering (SAXS), mass-spectrometry of cross-linked complexes, and molecular docking experiments led to the determination of the TrmB-tRNAPhe complex structure.
Introduction
Ribonucleic acids (RNA) are subject to a vast number of post-transcriptional modifications. Currently, about 172 post-transcriptional RNA modifications are known, introducing an enormous diversity to the basic four RNA nucleosides adenosine (A), uridine (U), cytidine (C), and guanosine (G) [Citation1]. Over 90 of these modifications are found in transfer RNAs (tRNA) across all three kingdoms of life, rendering them highly versatile molecules (see http://mods.rna.albany). Of all modifications, methylation is the most abundant one. Methylation of the guanine base at position 7 (m7G) is a highly conserved modification and common to eubacteria, eukaryotes, and a few archaea [Citation2]. m7G occurs not only in tRNA [Citation1,Citation3], but also in other RNA species such as messenger RNA (mRNAs) as the 5´-cap, ribosomal RNA (rRNA), small nuclear RNA (snRNA), and small nucleolar RNA (snoRNA) [Citation4,Citation5]. In tRNAs, m7G is frequently found at position 46 in the variable loop and forms a tertiary base pair with C13 and G22 leading to the stabilization of the tRNA core. The formation of the tertiary base pair in turn introduces a positive charge at the N7 of the guanine base [Citation6–8]. The enzyme introducing the m7G modification in tRNA is the tRNA(guanine-N7-)-Methyltransferase (MTase), also denoted as TrmB or Trm8 (TRMT8, EC 2.1.1.33) [Citation1,Citation3]. The TrmB/Trm8 protein family belongs to the SAM-dependent MTases and is structurally diverse, ranging from monomeric or homodimeric to heterodimeric functional assemblies [Citation9–11]. While the eubacterial E. coli homologue consists of a single functional subunit [Citation12], the B. subtilis and A. aeolicus TrmB form a homodimeric biological assembly only differing in a C-terminal extension seen in thermophilic TrmBs such as A. aeolicus TrmB [Citation11,Citation13]. In contrast, the eukaryotic yeast TrmB consists of two unrelated subunits Trm8/Trm82 [Citation9,Citation14], with the known homologues in human METTL1/WDR4 [Citation15].
Crystallographic studies of eubacterial and eukaryotic tRNA(guanine-N7-)-MTases revealed a class I MTase fold [Citation9,Citation11,Citation12], [PDB ID: 3 CKK] [Citation16,Citation17] ; hence, these enzymes belong to the Rossmann-like fold (RFM) MTase superfamily [Citation11,Citation18]. The Rossmann-fold consists of six β-strands forming the central β-sheet flanked by α-helices, giving rise to a doubly wound αβα sandwich. The central β-sheet harbours a switch-point introduced by an antiparallel β-strand, forming the S-Adenosylmethionine (SAM) binding pocket. However, the tRNA(guanine-N7-) (uanine-N7-) MTases, also called TrmB/Trm8, differ from the canonical Rossmann-fold by an additional β-strand inserted between β-strands 5 and 6 [Citation11,Citation19].
The lack of TrmB/Trm8 – tRNA complex crystal structures renders biochemical characterization of this enzyme family extremely valuable, in particular concerning the protein-RNA interaction. Mutagenesis studies on the Aquifex aeolicus TrmB (AaTrmB) showed that replacing the highly conserved Asp133 by alanine or asparagine abolishes MTase activity completely [Citation20]. Furthermore, AaTrmB recognizes its cognate tRNA via the T-stem with the tertiary base pair in the tRNA core being not essential for methylation [Citation21]. In agreement with biochemical characterization of AaTrmB, mutation of the Escherichia coli TrmB (EcTrmB) Arg180 to alanine (in AaTrmB Asp133) reduced MTase activity by 90% [Citation22]. Additionally, single mutations of Arg26, Asp144, His151, Arg154, Arg155, Thr217, and Glu220 to alanine either caused at least 10-fold reduction of MTase activity, or in case of Asp144, Arg154, and Arg155, abolished it completely. In the yeast homolog Trm8, Asp220, which corresponds to the A. aeolicus and E. coli Asp133 and Arg180, respectively, adopts the same side chain orientation and position within the TrmB structure. This led to the conclusion that AaTrmB Asp133 forms the catalytic centre of the TrmB/Trm8 enzyme family [Citation20]. The proposed reaction mechanism includes the capture of the N-H of the guanine base by the carboxyl group of Asp133 (nomenclature according to AaTrmB), and the subsequent nucleophilic attack of the methyl group of SAM by the N7 atom of the guanine base.
The physiological role of m7G46 has been subject to recent studies. The m7G46 modification is located in the tRNA core. The influence of the modification on other cellular processes depends on the position of the modification. In general, modifications in the tRNA body mostly enhance RNA processing and stability, whereas modifications within the anticodon can influence translational accuracy and stress response. Hence, the lack of modifications outside the anticodon rarely lead to phenotypic defects as for TrmB gene disruption in E. coli [Citation23]. Interestingly, deletion of the yeast homolog Trm8/Trm82 either as single mutant or double mutant coupled to other genes leads to phenotypic defects [Citation14]. Alexandrov et al. described a conditional temperature sensitivity on basis of a physiological function for the m7G modification in tRNA. Thermus thermophilus TrmB knockout mutants showed severe growth defects in high temperatures and hypo-modification of m1G37 leading to the specific degradation of tRNAPhe and tRNAIle. Additionally, the authors could show that m7G46 has a positive effect on other modifications indicating the existence of a complex modification network [Citation24]. Furthermore, mutations of the human TrmB homolog METTL1 are linked to genetic diseases. In humans, WDR4 gene mutation abolishes the m7G46 modification in tRNA and causes microcephalic primordial dwarfism [Citation25]. These studies show the complexity and importance of m7G46 modification of tRNAs.
In this study, we present the crystal structure of Bacillus subtilis TrmB (bsTrmB) in complex with its substrate SAM, the post-catalytic product SAH as well as an unliganded state. We show that under near physiological SAM concentrations, the TrmB homodimer methylates tRNA in a negative cooperative manner and shows a half-of-the sites reactivity. Furthermore, using protein-RNA cross-linking, we could map the RNA interaction sites on TrmB and propose a ccross-link-based three-dimensional model of TrmB-tRNAPhe complex, which has been verified by SAXS measurements.
Material and methods
Cloning of bsTrmB
Bacillus subtilis TrmB (bsTrmB) gene was amplified from genomic B. subtilis DNA introducing BamHI and PstI restriction sites at the 5´ and 3´position, respectively (forward primer: BamHI- CG GGATCC atgagaatgcgccacaagcc, reverse primer: AA CTGCAG ttacgttctccattcaacctcagc- PstI). bsTrmB was cloned in the expression vector pQE80 introducing a N-terminal 6x His-tag. The Y193A mutant was obtained by site directed mutagenesis and both, the wild type and mutant genes verified by sequencing.
Protein expression and purification
Wild type and mutant His6-bsTrmB fusion proteins were expressed in Escherichia coli BL21(DE3) cells and cultivated in 2YT medium containing 100 µg/ml Ampicillin. The expression cultures were grown at 37°C until the optical density (OD600) reached 0.5 and protein expression was induced by the addition of 1 mM Isopropy β-D-1-thiogalactopyranoside (IPTG). After 4 h at 37°C cells were harvested, frozen in liquid nitrogen, and stored at −20°C until further use.
Frozen cells were thawed in Lysis buffer (50 mM Tris/HCl pH 8.5, 500 mM KCl) and disrupted by micro fluidization for 7 cycles at 90 psi (M-110S Microfluidics). The soluble protein was collected by centrifugation for 30 min at 50,000 g, 4°C, and filtered through a 0.45 µm syringe filter. The lysate was applied to a His-Talon FPLC affinity column (Protino Ni-NTA MN) equilibrated against Lysis buffer. Nucleic acids were removed from the protein bound to the resin (lysis buffer + 1 M LiCl2) and the fusion protein was eluted with 50 mM Tris/HCl pH 8.5, 50 mM MgCl2, 300 mM KCl, 500 mM imidazole. Further purification was achieved by Superdex S200 size exclusion chromatography (50 mM Tris/HCl pH 8.5, 50 mM MgCl2, 300 mM KCl). Purified bsTrmB was concentrated to 6–9 mg/ml and stored at −80°C until further use.
In vitro transcription and RNA purification
Bacillus subtilis tRNAPhe (bstRNAPhe) was transcribed from a linearized vector in a run-off in vitro transcription containing T7 Polymerase, 10 mM rNTPs each, 1x HT buffer (30 mM HEPES pH 8.0, 25 mM MgCl2, 10 mM DTT, 2 mM spermidine, 0.01% Triton X-100). The reaction was incubated for 3 h at 37°C, PPi was pelleted and the reaction terminated by the addition of 50 mM EDTA. Self-cleavage of the ribozyme GlmS was induced upon glucosamine-6-phosphate (GlmN6P) addition and further incubated for 1 h at 37°C. bstRNAPhe was purified by ion exchange chromatography (1 ml Resource-Q GE). The in vitro transcription reaction was applied to the resin with IEX-A buffer (20 mM HEPES pH 7.5, 20 mM KCl) and eluted with a linear gradient from 10% to 35% IEX-B buffer (20 mM HEPES pH 7.5, 2 M KCl). Fractions containing pure tRNA were pooled, ethanol precipitated, and subsequently dissolved in ddH2O. tRNA was stored at −20°C until further use.
tRNA labelling and binding assays
tRNA was labelled with fluorescein-5-thiosemicarbazide (Sigma Aldrich) according to Johannsson et al. 2018 [Citation26]. Unreacted fluorophore was removed using Zeba Spin desalting columns (Thermofisher Scientific). bsTrmB was stepwise diluted in assay buffer from 0.007–2.1 µM (20 mM Tris/HCl pH 8.0, 200 mM KCl). Anisotropy was measured using a multimode microplate reader (PerkinElmer) and plotted with R [Citation27].
Methyltransferase assay
bsTrmB kinetics were analysed with the MTase-Glo methyltransferase assay (Promega). The assay was performed according to the manufacturer’s recommendations. 0.1 µM TrmB were mixed with 61 to 0 µM tRNAPhe, 40 µM, 10 µM, and 1 µM SAM and incubated for 30 min at RT. The reaction was stopped adding 0.5% TFA. After the addition of the MTase-Glo reaction solution and MTase-Glo detection solution, luminescence was measured using a multimode microplate reader (PerkinElmer). The data was transformed to display the consumed SAM molecule using a SAH standard curve. Data were plotted with R [Citation27] and fitted with the Hill equation v = Vmax*xn/(kn+xn).
Crystallization
bsTrmB was crystallized using sitting drop vapour diffusion. 1 µl 2 mg/ml TrmB supplemented with 20-fold molar excess SAM (Sigma Aldrich) was mixed with 1 µl crystallization buffer (20% PEG 4000, 20% Glycerol, 0.06 M KAc pH 5.0, 0.08 M Ammonium sulphate, 0.01 M Trimethylamine hydrochloride). Crystals grew over night at 293 K. Soaking experiments were performed with 20-fold molar excess SAH (Sigma Aldrich). These crystals were harvested using loops and flash cooled and subsequently stored in liquid nitrogen. bsTrmB apo was crystallized via sitting drop vapour diffusion at 293 K. 1 µl 2 mg/ml TrmB was mixed with 1 µl crystallization buffer from the commercially available MIDAS MD1-59 screen (Molecular Dimensions). Crystals grown in 0.2 M NaCl, 0.1 M MES pH 6.0, 15% v/v Pentaerythritol propoxylate (5/4PO/OH) were cryo protected by adding glycerol to a final concentration of 23%, flash frozen in liquid nitrogen, and stored at 77 K.
Diffraction data collection, molecular replacement and refinement
X-ray diffraction data were collected at PETRA III P13 beamline (EMBL, DESY, Hamburg [Citation28]) and at MX-14.1 (BESSY, Berlin). Diffraction images were indexed, integrated and scaled using the XDS-package [Citation29]. The TrmB complex structures were solved using molecular replacement by PHASER [Citation30] implemented in the CCP4 suite [Citation31] and bsTrmB apo structure used as model (PDB ID: 2FCA). Structure refinement was done by iterative steps using Refmac implemented in the CCP4 suite [Citation32] and subsequent manual adjustments in Coot [Citation33]. Ligand omit maps were calculated using the Phenix package [Citation34]. Figures were prepared with PyMOL v.2.2 [Citation35].
Protein-RNA cross-linking and LC-MS/MS analysis and data analysis
For UV cross-linking, the complex was irradiated at 254 nm for 10 min on ice using an in-house built cross-linking apparatus as described [Citation36]. For chemical cross-linking, 1,2,3,4-diepoxybutane (DEB) or nitrogen mustard (NM) were added to a final concentration of 50 mM and 1 mM, respectively [Citation37]. The cross-linking reaction was performed for 30 min at 37°C. Cross-linked samples were ethanol-precipitated and further processed as described in [Citation36]. Briefly, 10 μg RNase A (EN0531, Thermo Fisher Scientific), 1kU RNase T1 (EN0531, Thermo Fisher Scientific) and 250 U PierceTM universal nuclease (88,700, Thermo Fisher Scientific) were used for tRNA digestion followed by protein hydrolysis using trypsin (sequencing grade, Promega) at a 1:20 mass ratio. Sample clean-up was performed using C18 columns (74–4601, Harvard Apparatus) and cross-linked peptides were enriched with in-house packed TiO2 columns (Titansphere 5 μm; GL Sciences, Japan). Peptides were dried and subjected to MS measurement.
Sample pellets from TiO2 enrichment were dissolved in 2% [v/v] acetonitrile, 0.05% [v/v] TFA. LC-MS/MS analyses were performed on a Q Exactive HF-X (Thermo Fisher Scientific) instrument coupled to a nanoflow liquid chromatography system Dionex Ultimate 3000, Thermo Scientific. Sample separation was performed with a flow rate of 300 nl/min using a linear gradient and a buffer system consisting of 0.1% [v/v] formic acid (buffer A) and 80% [v/v] acetonitrile, 0.08% [v/v] formic acid (buffer B). Peptides were separated over 58 min. Eluting heteroconjugates were analysed in positive mode using a data-dependent top 15 acquisition method. MS1 and MS2 resolution were set to 120,000 and 30,000 FWHM, respectively. AGC targets were set to 106 and 5x10⁵, normalized collision energy (NCE) to 28, dynamic exclusion to 21 s, and max. injection time to 104 ms (for both MS1 and MS2). MS data were analysed and manually validated using the OpenMS pipeline RNPxl and OpenMS TOPPASViewer [Citation36].
SAXS measurements on the TrmB complex
The scattering signal of TrmB, tRNA and the TrmB-tRNAPhe complex was measured with an in-house small-angle x-ray scattering (SAXS) setup (Xeuss 2.0, Xenocs, Sassenage, France): A Cu Kα source (Genix 3D, Xenocs, Sassenage, France) generated x-rays with a wavelength of 1.54 Å, at 50 kV and 600 µA. The resulting beam was reduced to a size of approximately 0.5 × 0.5 µm2 with multilayer optics and scatterless slits. Proteins, dissolved in buffer solutions, were measured in quartz glass capillaries with a nominal inner diameter of 1.48 mm and a wall thickness of 10 µm (Art. no. 4017515 Hilgenberg GmbH, Mansfeld, Germany). During the measurements the capillaries were sealed with wax to avoid evaporation. A Pilatus3R 1 M pixel detector (Dectris Ltd., Baden, Switzerland) with 981 × 1043 px2 and a pixel size of 172 × 172 µm2 recorded the scattering images at a sample-to-detector distance of 575 mm. To avoid air scattering, most of the beam path was kept at low pressure (p< 0.56 mbar).
For each protein sample, the same capillary was first used for an empty measurement, then filled with ultrapure water for a calibration measurement, then refilled with buffer for a background measurement and finally refilled with the protein in buffer. In each case, a transmission measurement with an exposure time of 0.1 s was performed. The scattering signal of buffers and proteins with exposure times ranging from 12 to 25 hours per capillary were recorded and divided into 30 min intervals. During these measurements a 3 mm beamstop blocked the primary beam. The scattering signal of both TrmB and the TrmB-tRNA complex was measured at 3 protein concentrations each (3 mg/ml, 2 mg/ml and 1 mg/ml) to ensure that no form factor influenced the measurement (Figure S1). The final concentration of 3 mg/ml was measured 3 times for TrmB (20 mM Tris, pH 8.5, 500 mM KCl and 10 mM MgCl), the TrmB-tRNA complex (20 mM HEPES, pH 7.4, and 50 mM KCl) and tRNA (20 mM HEPES, pH 7.4, and 50 mM KCl).
The scattering data were processed with self-written Matlab (Matlab 9.3, 2017, The MathWorks, Natick, MA, USA) scripts, based on the PSI cSAXS matlab package (www.psi.ch/en/sls/csaxs/software). Multiple scattering images were summed up, masked to exclude contributions of beam stop and detector grid, and azimuthally averaged. The resulting radial intensity profiles were functions of the absolute value of the scattering vector q:
where λ is the wavelength of the x-rays and Θ is half the scattering angle. The radial intensity profiles were corrected by their total exposure time and their transmission factor. Here, the transmission factor was the ratio of the summed intensities of a transmission measurement and the primary beam intensity in a 35 × 35 px2 window around the beam centre. The scattering signal was background corrected by subtracting the radial intensity profile of the buffer from the one of the proteins in buffer. Further, it was divided by the protein concentration and the inner diameter of the capillary to be able to compare intensity profiles from capillaries with different inner diameters and with different protein concentrations. The inner diameters of the capillaries were determined with the transmission measurements of the empty and water filled capillaries as well as the density ρ = 1 g/cm3 and the mass attenuation coefficient (µ/ρ) = 10.4 cm2/g of water (www.nist.gov/pml/x-ray-mass-attenuation-coefficients). Finally, an average radial intensity profile was calculated from all available profiles for every protein by using a pointwise weighted average.
To further analyse the average radial intensity profiles and assuming a globular shape of the scattering proteins, Guinier analysis was performed to obtain the radius of gyration. For this purpose, the software PRIMUS [Citation38] (ATSAS, EMBL, Hamburg, Germany) was used and a q range of 0.21 < q< 0.41 nm−1 was considered for TrmB, 0.27 < q < 0.51 nm−1 for tRNA and 0.12 < q < 0.24 nm−1 for the complex.
RNA-protein molecular docking
Preparation of protein and tRNA model
The homodimeric model of apo/holo bsTrmB was prepared based on the reported crystal structure by removing all non-protein atoms from the atomic model and used for in silico docking experiments. Atomic coordinates of the tRNA model were extracted from the crystal structure of yeast phenylalanine tRNA (PDB id: 1EHZ) and converted to a format suitable for Rosetta. All modified bases were replaced by unmodified ones, the sequence has been adjusted to match bstRNAPhe and the resulting model was idealized using ERRASER [Citation39].
Protein-RNA docking combined with SAXS and cross-link based validation
Initially, the bstRNAPhe model was manually docked with the G 46 positioned close to the active site of bsTrmB using spatial restrains obtained from the cross-linking experiment. However, SAXS based validation of the symmetric protein-tRNA complex, comprising two bstRNAPhe molecules bound in the same manner by the homodimeric bsTrmB, indicated not a perfect fit. This was most likely a consequence of not optimal orientation of the docked partners as well as different conformations (bending) of the tRNA molecule. Hence, two models of bend bstRNAPhe were prepared in Coot [Citation33] utilizing local distance restraints (ProSMART) [Citation40] in order to perform in silico docking, and subsequently verified by both, SAXS and cross-link experimental data.
Docking was performed with the RosettaDock application [Citation41] optimized for predicting RNA-Protein complexes [Citation42]. Docking was divided into two stages: low resolution global docking and high resolution refinement of selected decoys. The former stage uses a coarse-grained representation of docking partners and facilitates quick sampling of the available search space. In order to thoroughly sample the search space, 100.000 poses have been generated for each tRNA model. Favourable low resolution (initial) docking orientations were identified as follows. First, a point in space was selected which is located in the active site of bsTrmB. This point corresponds to the position of the SD atom of SAM bound in the here reported bsTrmB structure and is located between Phe71 Trp120 Phe197 residues which have been identified by UV cross-link experiment. Then, the distance criterion of maximum 8 Å, calculated between that point and the phosphate atom of G 46, was applied to select decoys with G 46 positioned in vicinity of the active site. The best 100 decoys for each of two tRNA models were selected based on the I_sc score (representing the energy of the interactions across the interface) and the total Rosetta score. These models have been subjected to the high resolution (second) docking step which performed rebuilding of all-atom models followed by model optimization (1000 decoys per low resolution model). The resulting decoys were first sorted by I_sc score and the most favourable 100 models have been validated based on crosslinking data and subsequently by calculating the fit to the SAXS curve. The latter step required generation of symmetrical dimeric bsTrmB – bstRNAPhe complexes. Modelling of the flipped G 46 nucleotide was performed in Coot.
Results
Affinity of in vitro tRNAPhe to TrmB
To date, the binding affinity of TrmB enzymes to their cognate tRNAs were measured by studying methylation kinetics via the Michaelis-Menten equation and taking the Km value as binding constant. Here, we directly measured the dissociation constant using quantitative binding analysis via fluorescently labelled, in vitro transcribed, unmodified tRNAPhe of Bacillus subtilis. TrmB binds tRNAPhe with a Kd of 0.12 µM ± 0.002 µM ().
Figure 1. Quantitative analysis of wt bsTrmB tRNAPhe complex formation measured by fluorescence polarization. The fluorescently labelled tRNAPhe was analysed within increasing bsTrmB concentration, in the range of 0.007 to 2.1 µM. Complex formation was observed with fluorescence polarization. Measurements were performed in three indepentend experimental replicates. Results are shown as mean ± SD with error bars of SD (n = 3). tRNAPhe binds to TrmB in the nanomolar range of 0.12 µM ± 0.002 µM. Data were plotted with R [Citation27]
![Figure 1. Quantitative analysis of wt bsTrmB tRNAPhe complex formation measured by fluorescence polarization. The fluorescently labelled tRNAPhe was analysed within increasing bsTrmB concentration, in the range of 0.007 to 2.1 µM. Complex formation was observed with fluorescence polarization. Measurements were performed in three indepentend experimental replicates. Results are shown as mean ± SD with error bars of SD (n = 3). tRNAPhe binds to TrmB in the nanomolar range of 0.12 µM ± 0.002 µM. Data were plotted with R [Citation27]](/cms/asset/7cd4395f-b25b-4e18-a501-2a1aa6faa011/krnb_a_1925477_f0001_b.gif)
TrmB half-of-the-sites reactivity under near physiological conditions
We further tested TrmB MTase activity using the MTase-GloTM Methyltransferase Assay (Promega). The MTase assay was performed under MTase-GloTM standard conditions using 40 µM SAM. The obtained data were described best using the Hill-equation, which provides further information about cooperativity during catalysis by the Hill coefficient n. In general, a Hill coefficient of n < 1 describes negative cooperative effects during catalysis, n > 1 positive cooperative effects, and n = 1 independent binding [Citation43,Citation44]. TrmB methylated tRNAPhe with a Vmax of 1.7 nM/s ± 0.09 nM/s, a Km of 4.8 µM ± 0.8 µM, and a Hill coefficient of n = 0.8, indicating mild negative cooperative effects during catalysis (). The observed Km value for bsTrmB is in the range of the previously reported Km values of 0.7 µM for AaTrmB to yeast tRNAPhe and 6 µM for EcTrmB to tRNAPhe [Citation20,Citation22]. To further assess the degree of negative cooperativity during TrmB catalysis, additional MTase assays, using in vitro tRNAPhe with SAM concentrations of 10 µM and 1 µM, were performed and results were summarized in . Comparison of the Hill coefficient of all three samples shows a shift of mild negative cooperativity at 40 µM (n = 0.8 ± 0.09) to a strong negative effect of n = 0.4 ± 0.07 for 10 µM and n = 0.6 ± 0.1 for 1 µM SAM (). Additionally, the Hill coefficient also describes how many active sites within a macromolecule are catalytically active. A Hill coefficient of 0.5 for the homodimeric TrmB suggests that only one of two active sites is active. This leads to the hypothesis that bsTrmB shows a half-of-the-sites reactivity at low SAM concentrations, with only one subunit being catalytically active at any given time.
Table 1. Kinetic parameters of wt bsTrmB using SAM concentrations from 1 to 40 µM
Figure 2. Methyltransferase assay of wt bsTrmB with varying SAM concentrations to analyse cooperativity. Methyltransferase assay was performed according to the Promega MTase-Glo assay and measured via luminescence. Cooperativity of the TrmB subunits was tested with increasing concentrations of SAM in the range of 1–40 µM (1 µM SAM in blue, 10 µM SAM in red, and 40 µM in lilac). The colour code is identical between main plot and inset. Measurements were performed as independent duplicates with increasing substrate concentrations from 0 to 60 µM tRNAPhe. Data were plotted using R [Citation27] and fitted with the Hill equation, errors are presented as standard deviation. TrmB methylated tRNAPhe with a Vmax of 1.7 nM/s ± 0.09 nM/s, a Km of 4.8 µM ± 0.8 µM, and a Hill coefficient of n = 0.8. Lowering SAM concentrations led to a decrease in the Hill coefficient from n = 0.8 (40 µM SAM) to n = 0.4 (10 µM SAM) and n = 0.5 (1 µM SAM)
![Figure 2. Methyltransferase assay of wt bsTrmB with varying SAM concentrations to analyse cooperativity. Methyltransferase assay was performed according to the Promega MTase-Glo assay and measured via luminescence. Cooperativity of the TrmB subunits was tested with increasing concentrations of SAM in the range of 1–40 µM (1 µM SAM in blue, 10 µM SAM in red, and 40 µM in lilac). The colour code is identical between main plot and inset. Measurements were performed as independent duplicates with increasing substrate concentrations from 0 to 60 µM tRNAPhe. Data were plotted using R [Citation27] and fitted with the Hill equation, errors are presented as standard deviation. TrmB methylated tRNAPhe with a Vmax of 1.7 nM/s ± 0.09 nM/s, a Km of 4.8 µM ± 0.8 µM, and a Hill coefficient of n = 0.8. Lowering SAM concentrations led to a decrease in the Hill coefficient from n = 0.8 (40 µM SAM) to n = 0.4 (10 µM SAM) and n = 0.5 (1 µM SAM)](/cms/asset/88cea384-ac1f-45a9-83bc-18ada4ed0c22/krnb_a_1925477_f0002_c.jpg)
Crystal structure of bsTrmB
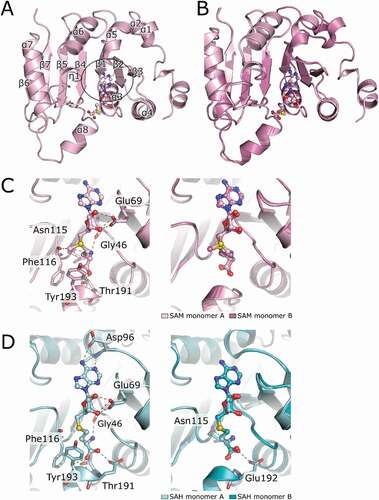
To get insight into the catalytic mechanism of B. subtilis TrmB, we solved bsTrmB crystal structures of the apo state, bound with the catalytic methyl group donor SAM, and in complex with the post-catalytic ligand S-adenosyl-L-homocystein (SAH). All structures were solved by molecular replacement and determined to 1.98 Å, 2.5 Å, and 3.1 Å resolution for the apo, SAM-, and SAH complex, respectively (). The details of data collection and structure refinement statistics are summarized in . The N-terminal regions (up to 11 residues) in all structures were not visible in the electron density and thus could not be modelled. Apparent high flexibility of this region is consistent with the prediction of the N-terminal residues 1–10 to be disordered. The determined crystal structures adopt a classic class I RFM MTase fold consisting of 7 β-strands building the central β-sheet flanked by two side layers of 6 α-helices forming an αβα sandwich (), confirming data of the apo bsTrmB structure [Citation11]. Superposition of both monomers of the homodimeric apo bsTrmB, TrmB-SAM (), and TrmB-SAH structures revealed, that they are structurally identical (root mean square deviation between all Cα atoms of 0.119 Å (apo), 0.146 Å (SAM), and 0.181 Å (SAH)). The solvent accessible area of the dimer interface sums up 779.2 Å2 indicating existence of a stable homodimer in solution. The dimer interface is formed by 22 residues constructing a hydrophobic interface with a Δ´G of −6.3 kcal/mol, as assessed by PISA [Citation45].
Table 2. Crystallographic data collection and refinement statistics
Figure 3. Crystal structures of SAM and SAH bound to bsTrmB. (A) TrmB subunit A is represented as cartoon with annotated secondary elements. SAM is shown as ball and stick model, central switch point is highlighted by the black circle. (B) superposition of TrmB monomer A (light pink) and monomer B (dark pink) represented in cartoon mode, SAM is shown as ball and stick. the crystal structure was determined to 2.5 Å. (C) close-up view of the ligand binding sites of TrmB monomer A (left) and superposition of both (right) complexed with SAM. Ligand interacting residues are shown in sticks and interactions are marked as dashed lines. (D) close up view of the SAH-TrmB complex structure. bsTrmB is depicted as cartoon (light cyan (monomer A, left) and superposition of both (right)). the soaked S-Adenosyl-L-homocysteine is depicted in ball and stick mode. SAH coordinating residues are shown as sticks and hydrogen bonds as dashed lines. the crystal structure was determined at 3.1 Å. hydrogen bonds are colour coded for 2.2–2.8 Å (red) and 2.8–3.2 Å (green)
SAM binding pocket
In the SAM-TrmB crystal structure, in each monomer the electron density for SAM is clearly visible at higher sigma levels on both 2mFo-DFc as well as mFo-DFc (polder) omit maps (Figure S2). The SAM binding pocket is built by the C-terminal edges of β-strands β2, β3, and β5 (), forming the central topological switch-point (), common to SAM-dependent MTases. Bound SAM molecule adopts an elongated conformation (). The binding pocket of both SAM molecules consists of three motifs, motif I (Glu69 (β2), Gly46 (β1)), motif II (Asn115, Phe116, β4), and motif III (Thr191, Tyr193, α8), of which Glu69 and Thr191 are highly conserved among TrmB members (). The 2´ OH group of the ribose forms hydrogen bonds with the side chain of Glu69, the carboxyl group of the methionine moiety is hydrogen bonded to the side chain of Thr191 and the main chain of Tyr193, and the amine group to the main chain of Asn115 and Gly46.
The overall topology of the TrmB-SAH complex structure is similar to the TrmB-SAM complex. Additional hydrogen bonds are formed between the N6 amine group of the SAH adenine moiety to the side chain of Asp96 (). Interactions of Asn115 and SAH could only be seen for TrmB monomer B. Hydrogen bonds of Glu192 to the carboxyl group of SAH are established only in monomer A.
Conformational rearrangement of the active site
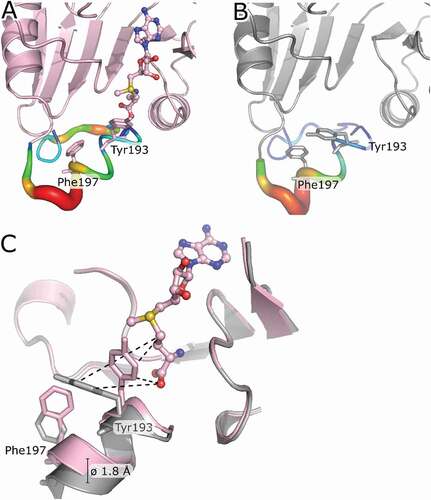
Next, we were interested in whether the binding of SAM or SAH leads to conformational changes of the active site. Therefore, we compared the TrmB-SAM/SAH complex structures with the TrmB apo structure. In both liganded structures, Tyr193 in motif VI shows a rearrangement in its side-chain orientation towards the ligand. Upon ligand binding, Tyr193 OH group is displaced by about 8 Å towards the sulphur atom of SAM/SAH. This side-chain conformational change leads to a decrease in local B-values of the loop region connecting α8-β7 (). Furthermore, the observed rotation of Tyr193 pulls helix α8 on average 1.8 Å towards SAM and results in a reorientation of Phe197 (). This movement of α8 further leads to a ‘closing’ of the catalytic pocket.
Figure 4. Structural rearrangement of the bsTrmB active site upon ligand binding. (A) TrmB (monomer A, light pink) is shown as cartoon, the bound SAM is represented as ball and stick model. Local B-factors are ramp coloured from blue to red representing regions of low and high flexibility, respectively. Tyr193 and Phe197 are shown as sticks. (B) apo TrmB (monomer A, grey) is shown as cartoon. Local B-factors are ramp coloured from blue to red representing regions of low and high flexibility, respectively. Tyr193 and Phe197 are shown as sticks. (C) Superposition of TrmB-SAM and apo TrmB. Tyr193 and Phe197 are depicted as sticks and the residue movement upon ligand binding is shown as dashed lines. Average displacement of cα of helix 8 is about 1.8 Å
Interestingly, the Tyr193 is not conserved across the TrmB/Trm8 family. In yeast Trm8 and human METTL1, this tyrosin is replaced by glutamate at position 261 and 210, respectively. Both Glu residues adopt, like Tyr193 in B. subtilis, the same position relative to the sulphur group of SAM [Citation9], [PDB ID: 3 CKK]. However, due to lacking the active site loop harbouring amino acids 260–270 in determined complex and apo Trm8 crystal structures, no structural data are available which could shed the light on similarities or dissimilarities of this region when compared to bsTrmB.
To investigate whether Tyr193 plays a crucial role in SAM binding and/or methyl group transfer, we generated a Tyr193Ala mutant of TrmB. This mutation resulted in a reduced affinity of TrmB to its cognate tRNAPhe from a Kd of 0.12 µM to 0.32 µM. Furthermore, MTase activity was significantly reduced (25 fold reduction) (Figure S3). These results confirm the importance of Tyr193 in SAM binding and methyl group transfer.
Conserved water molecules in SAM binding pocket and possible reaction mechanism
Comparison of crystal structures from bsTrmB complexed with SAM/SAH or in the apo state with TrmB enzymes from E. coli, S. cerevisiae, and H. sapiens revealed the presence of a few structurally conserved water molecules surrounding the SAM binding pocket, 4 in subunit A () and 5 in subunit B (). In both chains, one conserved water molecule (named W2) interacts with the highly conserved residue Asp154. W3 interacts with the side chain of the conserved Thr153 and further forms hydrogen bonds to the side chain of Ser117 and main chain of Phe116. Additionally, W1 forms hydrogen bonds with W2, W3, Asp154 (monomer A), and Tyr193 (monomer B). These water molecules protrude into the putative tRNA G46 binding pocket. Prior to tRNA binding, these water molecules might just fill up the void space, but upon binding, they could play a role in aligning the guanine base for methyl group transfer or even aiding in catalysis.
Figure 5. Structurally conserved water molecules in TrmB crystal structures mapped on the TrmB-SAM structure. (A) Monomer A of the TrmB-SAM complex structure is shown in surface mode (left). SAM is shown as ball and stick model and water as spheres. Water coordinating residues are represented as sticks (right), water is shown as spheres, and hydrogen bonds are shown as dashed lines. (B) Monomer B of the TrmB-SAM crystal structure shows TrmB in surface representation (left). SAM is shown as bal and stick model. Water molecules are represented as spheres. Water coordinating residues (right) are shown as sticks, water as spheres and hydrogen bonds as dashed lines
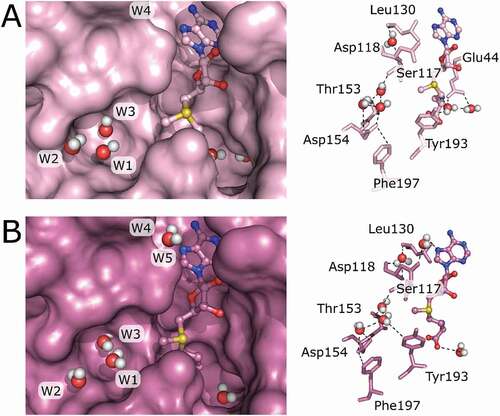
The remaining two structurally conserved water molecules, W4 and W5 are located near the adenine binding site, possibly bridging the protein main chain with SAM. W4 forms hydrogen bonds with the Leu130 and Asp118 main chain. W5 in turn hydrogen bonds to Asp118 side chain and the N7 atom of the adenine SAM ().
tRNAPhe-TrmB complex cross-linking
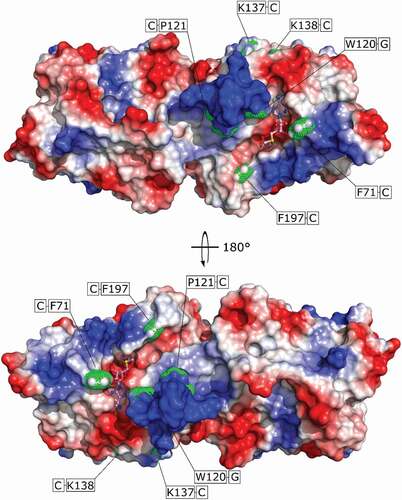
To get a structural insight in how TrmB binds its tRNA substrates, we performed UV light induced cross-linking of the TrmB-tRNAPhe complex and analysed the cross-linked peptides by means of mass spectrometry. We found 6 residues cross-linked to RNA (). Phe71, Pro121, Lys137/138, and Phe197 cross-linked to cytosine and Trp120 cross-linked to guanine. Phe71, Trp120 and, Phe197 are part of the SAM binding pocket. Residues Phe71 and Trp120 are oriented vertically upward, so they could interact with tRNA via π-stacking to fix the tRNA substrate in a proper position for catalysis. Phe197 flanks the proposed guanine bbase-binding pocket. The electrostatic surface potential surrounding the SAM binding pocket shows positively charged areas especially in the conserved region η1 connecting β4 and α6, which could indicate possible tRNA binding sites to bind and stabilize the tRNA structure upon base flipping of G46 and catalysis (). Taken together, the observed tRNAPhe-TrmB cross-links suggest the binding of tRNAPhe above the SAM-binding pocket with the ASL aligning with the methionine moiety and the acceptor stem aligning with the adenine moiety. Additional strong interactions are established between the η1 with the tRNA molecule.
Figure 6. UV-Cross linking of TrmB to tRNAPhe. Surface representation of TrmB, electrostatic potential is depicted at a contour level of ± 7 kBT/e. SAM is shown in ball and stick mode. Residues cross-linked to tRNAPhe are shown as green dots. Covalent links are mapped on the protein surface and shown in green boxes
Low resolution model of the TrmB-tRNAPhe complex using SAXS and molecular docking
After the identification of direct TrmB-tRNAPhe interaction sites, we aimed for more structural insight about the TrmB-tRNAPhe complex. Therefore, we reconstituted this complex, as for the cross-linking experiments, and performed small-angle X-ray scattering (SAXS) measurements. To better evaluate the obtained SAXS data, we measured each component of the TrmB-tRNAPhe complex separately. Guinier radii for the individual components were determined to be 3.29 ± 0.04 nm (TrmB), 2.67 ± 0.02 nm (tRNA), and 5.3 ± 0.05 nm (tRNA-TrmB complex). However, evaluation of the complex SAXS curves was challenging. Therefore, molecular docking experiments were performed and validated using the experimental SAXS curves. Complex models were generated by molecular docking using Rosetta [Citation41]. First, a low-resolution global docking, generating 100.000 decoys in a coarse-grained representation, was performed. These initial poses were sorted by their relative position to the sulphur atom of SAM, and the distance to the G46 of the tRNA molecule. The best 100 models were subsequently sorted by the energy of the interactions across the interface (I_sc score) and the total Rosetta score. Second, decoys exhibiting the best scores were used for high resolution docking, and again sorted by the I_sc score. Initially, the crystal structure of tRNAPhe (PDB ID: 1EHZ) has been used, however the validation against SAXS data indicated some structural changes of the tRNA molecule. As the G46 base needs to break hydrogen bonds in the tRNA core and flip into the active site pocket, bending of the tRNA molecule can be assumed. Indeed, much better fits of the computationally generated complex models were obtained when slightly bend tRNA molecules [Citation33] were used. The most favourable models were validated based on the cross-linking data and the calculated SAXS curves to fit the experimental SAXS data. Evaluation of the TrmB crystal structure against the TrmB SAXS data resulted in a good fit of the SAXS and X-ray data (). The protein-tRNA complex SAXS data could be described best with a TrmB-tRNAPhe complex model in a 2:2 stoichiometry (). Hence, the final TrmB-tRNA complex model comprises two slightly bend tRNA molecules bound to the homodimeric protein (). The tRNA molecules lie on top of TrmB, with the T-arm facing towards the protein (), agreeing with previously published data about the yeast TrmB homolog Trm8-Trm82 [Citation9]. The tRNA core makes intermolecular contacts, while the acceptor stem and the anticodon stem protrude off the protein. Extensive protein-RNA contacts are established by the α helix α5 to the RNA backbone of the T-arm (). Further contacts are established between residues of α5, α8, and η1 to G46 and U47.
Figure 7. Predicted TrmB – tRNAPhe complex model. (A) Experimental and simulated SAXS curves of TrmB. The curve of the model is calculated from the TrmB-SAM complex crystal structure and scaled to match the experimental curve between 0.1 ≤ qr ≤ 2 nm−1. (B) Experimental SAXS curves and predicted SAXS curves from docking models. The model consisting of two tRNA molecules per TrmB homodimer (red, dotted) shows a higher agreement with the experimental data compared to the model consisting of one tRNA molecule per TrmB (blue, dashed), also seen at larger qr-values. The feature of the experimental data at qr~2.0 nm−1 is shifted to smaller qr-values in the 2-tRNA model and is not visible in the 1-tRNA model (inset). The data is plotted with Matlab (MathWorks Inc. Natick, Massachusetts, USA). (C) TrmB – tRNAPhe complex model is depicted as cartoon (left) with surface representation of TrmB (right). (D) Close-up view of the tRNA binding to TrmB monomer A (light pink). Residues of TrmB interacting with tRNAPhe are shown as sticks (yellow), hydrogen bonds are shown as dashed line. (E) TrmB-tRNAPhe complex model is shown with surface representation of TrmB and tRNAPhe highlighted by its domain architecture. the domain architecture of tRNAPhe is colour coded in Aminoacyl stem (purple), T-arm (green), variable loop (orange), Aminoacyl stem (blue), and D-arm (red) with the G46 base depicted as sticks
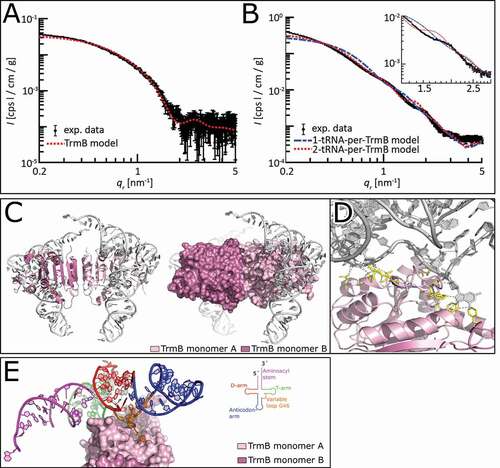
Taken together, the TrmB-tRNAPhe complex model suggests that each of the TrmB subunits is able to bind a tRNA molecule. Further, the tRNA substrates are recognized via the D- and T-arm. The conserved loop region η1 of TrmB seems to stack between the variable loop and the T-arm, probably ensuring proper positioning of the tRNA molecule on the SAM binding pocket and catalytic pocket.
Discussion
The m7G46 modification introduced in tRNAs is gaining attention since the discovery of its connection to the human disease microcephalic primordial dwarfism [Citation25]. Structural analysis of the TrmB-tRNA complex as well as biochemical investigation would give valuable insight into TrmB function. Hence, in this study, we focused on the tRNA-TrmB interaction on both, a biochemical and structural level. The TrmB/Trm8 enzyme family is structurally diverse with monomeric, homodimeric, and heterodimeric biological assemblies [Citation9–11]. Interestingly, even though the TrmB homologues of E. coli and B. subtilis belong both to the bacterial kingdom they show differences in their biological assembly [Citation10,Citation11]. While E. coli functions as a single subunit, B. subtilis TrmB evolved a homodimeric assembly. Hence, the impact of homodimerization of bsTrmB was studied. TrmB catalysis was shown to follow negative cooperative effects by pinpointing the reaction kinetics to be described best by the Hill equation (). While under standard assay conditions this effect is mildly distinct, this effect becomes more drastic when decreasing SAM concentrations. In near physiological conditions [Citation46,Citation47], TrmB cooperativity drops from mild negative effects to a half-of-the-sites reactivity. With this, TrmB is able to ensure both substrates, SAM as well as tRNA, to bind to the same subunit and catalysis can occur. Thus, we propose a ligand based control system to ensure effective enzyme catalysis under low ligand concentrations.
However, this raises the question of whether both subunits of the TrmB homodimer are capable of binding SAM and tRNA. To shed light on this question, we solved the crystal structure of TrmB with its methyl group donor SAM and reaction product SAH (). In our ligand complex structures SAM and SAH are well resolved in both subunits. As reported previously, bsTrmB belongs to the SAM-dependent class I methyltransferases, containing a Rossman fold core [Citation11]. Comparison of TrmB-SAM/-SAH crystal structures with its homologs from yeast and E. coli shows an identical mode of binding across species. The amino group of the adenine moiety is captured by the oxygen atom of either Asp or Asn, the ribose moiety is coordinated strictly by glutamate, and the methionine moiety is coordinated by a main chain oxygen. This shows, that even though the TrmB/Trm8 protein family is divergent in their amino acid sequence, they are structurally highly similar with a conserved mode of ligand binding and therefore exhibit most likely a similar catalytic mechanism. Furthermore, we observed a repositioning of Tyr193 in the SAM-binding pocket upon ligand binding. This movement can be also seen in the yeast homologue Trm8, as well as in the human homolog METTL1. Here, Trm8 Glu261 and METTL1 Glu210 adopt the same position and side chain orientation, compared to the B. subtilis Tyr193. Examining the importance of Tyr193, we exchanged Tyr193 by alanine which abolished MTase activity completely while still being able to bind tRNA, even though with 2.6 times less affinity. This provides the importance of Tyr193 during catalysis by probably correct positioning of SAM.
To address the open question of whether the homodimeric TrmB is able to bind two tRNA molecules, we performed SAXS measurements of the tRNAPhe-TrmB complex complemented by cross-linking experiments and molecular docking approaches. The Guinier radii obtained by SAXS for TrmB (32.9 Å ± 0.4 Å) and tRNA (26.7 Å ± 0.2 Å) fit the crystallographic values of 32.5 Å (TrmB) and 29.9 Å (tRNA) well, assuming a hydration shell of 7 Å [Citation48,Citation49]. The final docked complex model consists of the TrmB homodimer and two tRNA molecules (one bound to each subunit ). Although the SAXS curves of the model and the measurements are similar, our model exhibits some misfits compared to the experimental SAXS curve. This can be explained by extensive bending of the tRNA molecule upon binding and structural rearrangement of the tRNA core during G46 base flipping. This could also explain the observed differences in the Guinier radii of the tRNAPhe-TrmB complex of 53 Å compared to the complex model with a Guinier radius of 43 Å. Moreover, SAXS is a sensitive method able to detect small changes in length scales upon conformational rearrangements. Subsequently, such chances would lead to altered SAXS curve. Additionally, the T-arm of tRNAPhe comes into close vicinity of a more negatively charged area of TrmB. We assume that this negative charge may be needed to force the tRNA core to release the G46 base from base pairing and in that manner facilitate its flipping into the catalytic pocket.
The overall positioning of the tRNA on TrmB is in agreement with prior biochemical studies. In A. aeolicus, mutation of Lys101Ala (in B. subtilis Lys122) located in a conserved loop, leads to a weakened tRNA binding and a reduction in the turnover rate from 1 to 0.36 [Citation20]. This indicates that this amino acid could be involved in intermolecular communication. In our complex model, Lys122 and the phosphate backbone of G10, located in the D-loop, are in close proximity to each other and might function as ruler to ensure optimal positioning of the tRNA molecule on TrmB. Additionally, mutation of the E. coli Arg154Ala (in B. subtilis Lys128) results in a loss of function of ecTrmB [Citation22]. In our model, Lys128 is involved in three protein-RNA contacts, positioning the tRNA over the SAM binding pocket. These examples of mutagenesis studies across different TrmB species strengthen our complex model and show the importance of the conserved loop region and η1 in catalysis.
Further, comparison of the ligand binding pockets of the TrmB-SAM and TrmB-SAH crystal structure presents hints of how pre-, and post-catalytic states could differ. In TrmB-SAH, the active sites of chain A and chain B are identical. In TrmB-SAM, the active site pocket of subunit B is narrower than the active site pocket of subunit A. This indicates, that the TrmB-SAM complex shows most likely two structurally different catalytic states, with subunit A being in the post-catalytic state and subunit B in the pre-catalytic state. Concluding that even though both subunits are topologically identical, they appear to be in chemically different states. This is reinforced by conserved water molecules located in the catalytic pocket. While subunit A displays water molecules W1-W3 with even distribution across the guanine binding pocket, subunit B shows a different distribution with W3 being positioned deep in the binding pocket whereas W2 is located at the rim of the pocket.
Lastly, cross-linked amino acids Leu70 and Phe71 built contacts with tRNA bases C48 and U47 of the variable loop, respectively (). An extensive study about yeast tRNAPhe secondary structure, the formation of hydrogen bonds within the tRNA core and anticodon stem, and methyltransferase activity of yeast Trm8/Trm82 on yeast tRNAPhe showed the importance of both, U47 and C48 for efficient methyl group transfer [Citation50]. Upon mutation of U47A and C48A, Vmax dropped from 1.4 µmol mg−1 h−1 to 0.28 µmol mg−1 h−1 and 1.4 µmol mg−1 h−1 to 0.04 µmol mg−1 h−1, respectively, resulting in a reduction of the methyl acceptance activity by a decrease in Vmax. Substitution of the pyrimidine C48 by the purine A results in the disruption of the G15-C48 base-pairing, which in turn results in an impaired methyl acceptance activity. This perturbation could be based on additional rearrangements of the tRNA core. Base flipping of G46 in our model led to a rearrangement of both, U47 and C48. While U47 moves ~11 Å to the front forming hydrogen bonds with TrmB Phe71, C48 breaks the base pairing with G15 and forms additional hydrogen bonds with Phe71. If the pyrimidine C48 is substituted by the purine adenine, the interactions between A48 and Phe71 could be too strong and methyl transfer cannot be achieved (Figure S4). Furthermore, the involvement of U47 and C48 on MTase activity shows the importance of the variable loop, as seen in A. aeolicus TrmB which distinguishes cognate from non-cognate tRNA by the size of the variable loop [Citation21]. However, the exact mechanism by which TrmB/Trm8 enzymes recognize their substrate tRNAs diverged during evolution. In general, TrmB/Trm8 enzymes commonly recognize substrate tRNAs by their D-arm and T-arm, only differing in their strictness of structural features to be recognized. In contrast to A. aeolicus TrmB for which the substrate tRNA T-arm plays a key role in recognition and MTase activity [Citation21], for yeast Trm8/Trm82 the T-arm is essential and the D-arm semi-essential for recognition. However, in both cases, deletion leads to a complete loss of activity [Citation50].
In conclusion, we showed the cooperative activity of the TrmB homodimer with half-of-the-sites reactivity at physiological SAM concentrations. Albeit this half-of-the sites reactivity, both subunits of the TrmB homodimer are capable to bind its methyl group donor. Tyr193 is important for SAM coordination and catalysis might be mediated by conserved water molecules. Furthermore, we reported the TrmB-tRNAPhe complex model in which each TrmB subunit binds a tRNA molecule and protein-RNA contacts are formed by the T-arm and to a lower extent by the D-arm.
Disclosure of potential conflicts of interest
No potential conflict of interest was reported by the author(s).
Supplemental Material
Download Zip (2.5 MB)Acknowledgments
The synchrotron MX data was collected at beamline P13 operated by EMBL Hamburg at the PETRA III storage ring (DESY, Hamburg, Germany) and beamline MX 14.1 operated by the Helmholtz-Zentrum Berlin at the BESSY II storage ring (BESSY, Berlin, Germany). We would like to thank Johanna Hakanpää, Saravanan Panneerselvam, and Jan Wollenhaupt for the assistance in using the beamlines.
Supplementary material
Supplemental data for this article can be accessed here
Additional information
Funding
Related Research Data
References
- Boccaletto P, Machnicka MA, Purta E, et al. MODOMICS: a database of RNA modification pathways. 2017 update. Nucleic Acids Res. 2018 Jan;46(D1):D303–D307.
- Juhling F, Morl M, Hartmann RK, et al. tRNAdb 2009: compilation of tRNA sequences and tRNA genes. Nucleic Acids Res. 2009 Jan;37(Database):D159–D162.
- Machnicka MA, Milanowska K, Osman Oglou O, et al. MODOMICS: a database of RNA modification pathways—2013 update. Nucleic Acids Res. 2012 Oct;41(D1):D262–D267.
- Wang K-T, Desmolaize B, Nan J, et al. Structure of the bifunctional methyltransferase YcbY (RlmKL) that adds the m 7 G2069 and m 2 G2445 modifications in Escherichia coli 23S rRNA. Nucleic Acids Res. 2012 Jun.;40(11):5138–5148.
- Okamoto S, Tamaru A, Nakajima C, et al. Loss of a conserved 7-methylguanosine modification in 16S rRNA confers low-level streptomycin resistance in bacteria. Mol Microbiol. 2007 Feb.;63(4):1096–1106.
- Quigley G, Rich A. Structural domains of transfer RNA molecules. Science. 1976 Nov;194(4267):796–806.
- Hoburg A, Aschhoff HJ, Kersten H, et al. Function of modified nucleosides 7-Methylguanosine, Ribothymidine, and 2-Thiomethyl-N6-(Isopentenyl)adenosine in procaryotic transfer ribonucleic acid. J Bacteriol. 1979;140(2):408–414.
- Agris PF, Sierzputowska-Gracz H, Smith C. Transfer RNA contains sites of localized positive charge: carbon NMR studies of [13C] methyl-enriched Escherichia coli and yeast tRNAPhe. Biochemistry. 1986 Sep;25(18):5126–5131.
- Leulliot N, Chaillet M, Durand D, et al. Structure of the yeast tRNA m7G methylation complex. Structure. 2008 Jan;16(1):52–61.
- Liu Q, Gao Y, Yang W, et al. Crystallization and preliminary crystallographic analysis of tRNA (m7 G46) methyltransferase froms cherichia coli. Acta Crystallogr F Struct Biol Cryst Commun. 2008 Aug;64(8):743–745.
- Zegers I, Gigot D, Bujnicki JM, et al. Crystal structure of Bacillus subtilis TrmB, the tRNA (m7G46) methyltransferase. NAR. 2006 Dec;34(6):1925–1934.
- Zhou H, Liu Q, Yang W, et al. Monomeric tRNA (m7G46) methyltransferase from Escherichia coli presents a novel structure at the function-essential insertion. Proteins. 2009 Aug;76(2):512–515.
- Tomikawa C, Ochi A, Hori H. The Cterminal region of thermophilic tRNA (m7G46) methyltransferase (TrmB) stabilizes the dimer structure and enhances fidelity of methylation. Proteins Struct Funct Bioinf. 2007;71(3):1400–1408.
- Alexandrov A. tRNA m7G methyltransferase Trm8p/Trm82p: evidence linking activity to a growth phenotype and implicating Trm82p in maintaining levels of active Trm8p. RNA. 2005 May;11(5):821–830.
- Alexandrov A, Martzen MR, Phizicky EM. Two proteins that form a complex are required for 7-methylguanosine modification of yeast tRNA. RNA. 2002 Oct;8(10):1253–1266.
- Martin JL, McMillan FM. SAM (dependent) I AM: the S-adenosylmethionine-dependent methyltransferase fold. Curr Opin Struct Biol. 2002 Dec;12(6):11.
- Schubert HL, Blumenthal RM, Cheng X. Many paths to methyltransfer: a chronicle of convergence. Trends Biochem Sci. 2003 Jun;28(6):329–335.
- Ahn HJ. Crystal structure of tRNA(m1G37) methyltransferase: insights into tRNA recognition. EMBO J. 2003 Jun;22(11):2593–2603.
- Bujnicki JM. Comparison of protein structures reveals monophyletic origin of the AdoMet-dependent Methyltransferase family and mechanistic convergence rather than recent differentiation of N4-Cytosine and N6-Adenine DNA methylation. In Silico Biol. 1991;1(3):334–344.
- Tomikawa C, Takai K, Hori H. Kinetic characterization of substrate-binding sites of thermostable tRNA methyltransferase (TrmB). J Biochem. 2018;163(2):10.
- Okamoto H, Watanabe K, Ikeuchi Y, et al. Substrate tRNA recognition mechanism of tRNA (m7G46) Methyltransferase from Aquifex aeolicus. J Biol Chem. 2004 Nov;279(47):49151–49159.
- Purta E, Van Vliet F, Tricot C, et al. Sequence-structure-function relationships of a tRNA (m7G46) methyltransferase studied by homology modeling and site-directed mutagenesis. Proteins. 2005 Mar;59(3):482–488.
- De Bie LGS, Roovers M, Oudjama Y, et al. The yggH gene of Escherichia coli encodes a tRNA (m7G46) Methyltransferase. J Bacteriol. 2003 May;185(10):3238–3243.
- Tomikawa C, Yokogawa T, Kanai T, et al. N 7-Methylguanine at position 46 (m7G46) in tRNA from Thermus thermophilus is required for cell viability at high temperatures through a tRNA modification network. Nucleic Acids Res. 2010 Jan;38(3):942–957.
- Shaheen R, Abdel-Salam GMH, Guy MP, et al. Mutation in WDR4 impairs tRNA m7G46 methylation and causes a distinct form of microcephalic primordial dwarfism. Genome Biol. 2015 Dec;16(1):210.
- Johannsson S, Neumann P, Wulf A, et al. Structural insights into the stimulation of S. pombe Dnmt2 catalytic efficiency by the tRNA nucleoside queuosine. Sci Rep. 2018 Dec;8(1):8880.
- R Core Team. R: a Language and Environment for Statistical Computing. Vienna, Austria: R Foundation for Statistical Computing; 2017.
- Cianci M, Bourenkov G, Pompidor G, et al. P13, the EMBL macromolecular crystallography beamline at the low-emittance PETRA III ring for high- and low-energy phasing with variable beam focusing. J Synchrotron Rad. 2017 Jan.;24(1):323–332.
- Kabsch W. XDS. Acta Crystallogr D Biol Crystallogr. 2010 Feb;66(2):125–132.
- McCoy AJ, Grosse-Kunstleve RW, Adams PD, et al. Phaser crystallographic software. J Appl Crystallogr. 2007 Aug;40(4):658–674.
- Winn MD, Ballard CC, Cowtan KD, et al. Overview of the CCP 4 suite and current developments. Acta Crystallogr D Biol Crystallogr. 2011 Apr;67(4):235–242.
- Murshudov GN, Skubák P, Lebedev AA, et al. REFMAC 5 for the refinement of macromolecular crystal structures. Acta Crystallogr D Biol Crystallogr. 2011 Apr;67(4):355–367.
- Emsley P, Lohkamp B, Scott WG, et al. Features and development of Coot. Acta Crystallogr D Biol Crystallogr. 2010 Apr;66(4):486–501.
- Adams PD, Afonine PV, Bunkóczi G, et al. PHENIX: a comprehensive Python-based system for macromolecular structure solution. Acta Crystallogr D Biol Crystallogr. 2010 Feb;66(2):213–221.
- Schrödinger LLC. The PyMOL molecular graphics system, version 5.0. 2015 Nov.
- Kramer K, Sachsenberg T, Beckmann BM, et al. Photo-cross-linking and high-resolution mass spectrometry for assignment of RNA-binding sites in RNA-binding proteins. Nat Methods. 2014 Aug;11(10):25.
- Loeber R, Michaelson E, Fang Q, et al. Cross-linking of the DNA repair protein O 6 -Alkylguanine DNA Alkyltransferase to DNA in the presence of Antitumor nitrogen mustards. Chem Res Toxicol. 2008 Apr;21(4):787–795.
- Konarev PV, Volkov VV, Sokolova AV, et al. PRIMUS : a windows PC-based system for small-angle scattering data analysis. J Appl Crystallogr. 2003 Oct;36(5):1277–1282.
- Chou F-C, Sripakdeevong P, Dibrov SM, et al. Correcting pervasive errors in RNA crystallography through enumerative structure prediction. Nat Methods. 2013 Jan;10(1):74–76.
- Nicholls RA, Long F, Murshudov GN. Low-resolution refinement tools in REFMAC5>. Acta Crystallogr D Biol Crystallogr. 2012 Apr;68(4):404–417.
- Chaudhury S, Berrondo M, Weitzner BD, et al. Benchmarking and analysis of protein docking performance in Rosetta v3.2. PLoS ONE. 2011 Aug;6(8):e22477.
- Guilhot-Gaudeffroy A, Froidevaux C, Azé J, et al. Protein-RNA complexes and efficient automatic docking: expanding RosettaDock possibilities. PLoS ONE. 2014 Sep;9(9):e108928.
- Barcroft J, Hill AV. The nature of oxyhaemoglobin, with a note on its molecular weight. J Physiol. 1910 Mar;39(6):411–428.
- Weiss JN. The Hill equation revisited: uses and misuses. FASEB J. 1997 Sep;11(11):835–841.
- Krissinel E, Henrick K. Inference of macromolecular assemblies from crystalline state. J Mol Biol. 2007 Sep;372(3):774–797.
- Melnyk S, Pogribna M, Pogribny IP, et al. Measurement of plasma and intracellular S-Adenosylmethionine and S-Adenosylhomocysteine utilizing Coulometric electrochemical detection: alterations with plasma Homocysteine and Pyridoxal 5Ј-Phosphate concentrations. Clin Chem. 2000;46(2):8.
- Caudill MA, Wang JC, Melnyk S, et al. Intracellular S-Adenosylhomocysteine Concentrations predict global DNA Hypomethylation in tissues of Methyl-Deficient Cystathionine -Synthase Heterozygous Mice. J Nutr. 2001 Nov;131(11):8.
- Chen P, Hub JS. Validating solution ensembles from molecular dynamics simulation by wide-angle X-ray scattering data. Biophys J. 2014 Jul;107(2):435–447.
- Park S, Bardhan JP, Roux B, et al. Simulated x-ray scattering of protein solutions using explicit-solvent models. J Chem Phys. 2009 Apr;130(13):134114.
- Matsumoto K, Toyooka T, Tomikawa C, et al. RNA recognition mechanism of eukaryote tRNA (m7 G46) methyltransferase (Trm8-Trm82 complex). FEBS Lett. 2007 Apr;581(8):1599–1604.