
 ?Mathematical formulae have been encoded as MathML and are displayed in this HTML version using MathJax in order to improve their display. Uncheck the box to turn MathJax off. This feature requires Javascript. Click on a formula to zoom.
ABSTRACT
Maintaining a healthy protein folding environment is essential for cellular function. Recently, we found that nucleic acids, G-quadruplexes in particular, are potent chaperones for preventing protein aggregation. With the aid of structure-function and NMR analyses of two G-quadruplex forming sequences, PARP-I and LTR-III, we uncovered several contributing factors that affect G-quadruplexes in preventing protein aggregation. Notably, three factors emerged as vital in determining holdase activity of G-quadruplexes: their structural topology, G-quadruplex accessibility and dynamics, and oligomerization state. These factors together appear to largely dictate whether a G-quadruplex is able to prevent partially misfolded proteins from aggregating. Understanding the physical traits that govern the ability of G-quadruplexes to modulate protein aggregation will help elucidate their possible roles in neurodegenerative disease.
Introduction
Molecular chaperones are molecules (often proteins) that help determine the destiny of their nascent, misfolded or aggregated protein clients, whether it be refolding or degradation [Citation1]. It has recently been shown that nucleic acids can also be potent molecular chaperones, preventing protein aggregation (also called holdase activity) on a per-weight basis more effectively than any known chaperone protein by binding partially folded states [Citation2]. Although bulk DNA can have holdase properties [Citation3], further investigation into the structural and sequence dependence of chaperone activity found that RNA G-quadruplexes possess powerful holdases activity in vitro and are able to improve the folding of a protein folding biosensor that often misfolds when expressed in E. coli [Citation4].
In proteostasis, a large factor in ageing-related disease is the relative balance of the cell’s chaperones and degradation machinery with the accumulation of protein misfolding and aggregation [Citation5]. While the misfolding and aggregation of particular proteins can cause larger problems for the cell, the overall chaperoning capacity of the cell is also important to disease onset. For this reason, understanding how chaperones and other factors that modulate aggregation interact with run-of-the-mill proteins that can aggregate under stress is an important component to understanding proteostasis collapse in neurodegenerative disease.
G-quadruplexes are a secondary structure in guanine-rich DNA or RNA, where four guanines form a square plane stabilized by a cation (often potassium or sodium). These planes can then stack to form an intramolecular G-quadruplex within the same polynucleotide chain, or intermolecular G-quadruplexes with other chains. G-quadruplexes can also adopt a variety of different topologies based on the directionality of their backbone: parallel, hybrid (3 + 1), anti-parallel (2 + 2) and anti-parallel [Citation6]. () We previously found that the holdase activity of a G-quadruplex is loosely correlated with topology, with mixed hybrid (3 + 1) being the most active, followed by parallel, while anti-parallel G-quadruplexes display negligible holdase activity [Citation4]. Having shown that G-quadruplexes are potent holdases and with their activity dependent on structural topology, we sought to investigate the underlying causes of this activity.
Figure 1. G-quadruplex topologies based on strand arrangement. Each tetrad is represented as grey box. Each strand is shown with arrows indicating directionality (5’ to 3’), circles represent deoxyribose sugar and phosphate group. 5’ is shown as filled (black) circle.
RNA G-quadruplexes recently have been identified to potentially have important roles in neurodegenerative protein misfolding and aggregation diseases such as Alzheimer’s Disease, Fragile X Syndrome and Amyotrophic Lateral Sclerosis (ALS) [Citation7]. Understanding how G-quadruplexes exert power over aggregation could give clues to the roles of G-quadruplexes in these diseases.
Here, we reveal the underlying biophysical and molecular determinants of the holdase activity of G-quadruplexes. We systematically mutagenized known G-quadruplex sequences to determine important properties correlated with holdase function, as has been previously performed with other chaperones [Citation8]. Structural investigations were then used to explore these properties in greater detail. We found that single nucleotide changes in the G-quadruplex forming sequences can dramatically alter holdase activity. Although the most important structural elements can vary depending on the G-quadruplex-containing sequence, structural dynamics or heterogeneity appears to be a common important feature of holdase activity. These results link specific structural features of G-quadruplexes to their chaperone activity.
Results
Single point mutations dramatically affect chaperone activity
To investigate why G-quadruplexes are such potent holdases, we began probing the activity of two mixed (3 + 1) G-quadruplexes, LTR-III and PARP-1. LTR-III is a section of the HIV-1 long terminal repeat that can regulate transcription through G-quadruplex formation [Citation9], and PARP-I is a section of the poly-ADP-ribose polymerase 1 gene that can form a G-quadruplex and could be targeted to regulate expression in cancer [Citation10]. Our motivation for using these sequences is that they have solved tertiary structures and display multiple structural elements [Citation11,Citation12]. Therefore, we could design mutants to disrupt particular structural features and test their importance in holdase activity. To ensure that the G-quadruplex core of both sequences and hairpin of LTR-III remained intact, mutations were systematically made only to loop regions connecting G-quadruplex planes for both sequences and the hairpin loop of LTR-III. Each base in these connecting loops was changed to one of the other non-redundant DNA-bases (e.g. A4 was mutated to G, C, and T). If mutations were made to the G-quadruplex core (or duplex region of the hairpin), we anticipated large structural fluctuations would occur and potentially obfuscate analysis. To evaluate the activity of the mutants, we used a previously published thermal denaturation aggregation assay using the protein citrate synthase (CS) as a model client [Citation4]. To compare the holdase activity of the G-quadruplex mutants, we normalized the signal of each mutant to CS alone. The resulting ratio of the maximum aggregation level of a given mutant to that of CS alone is denoted as percent aggregation (%aggregation, ). Therefore, the most effective holdases have a low percent aggregation and are denoted ‘strong’ chaperones in .
Figure 2. A/B. PDB-deposited NMR structures and wild-type sequences for G-quadruplexes A. LTR-III (PDB 6H1K) and B. PARP-1 (PDB 6AC7). Bolded guanines are contained in the G-quadruplex core. Numbers on the structure indicate their positions in the 5’ to 3’ sequence given below the structures. The NMR structure is shown of PARP-1 G6T and the sequence beneath is for WT PARP-1. C.-F. Thermal denaturation aggregation assay results comparing %aggregation of 0.55 µM citrate synthase in the presence of C./E. 1.1 µM LTR-III mutants and D./F. 0.275 µM PARP-1 mutants in either 10 mM potassium phosphate pH 7.5 (C./D.) or 40 mM HEPES LiOH pH 7.5 (E./F.) buffers. We also performed the experiment in HEPES KOH to confirm the buffer identity did not alter holdase activity. The %aggregation across mutants is similar to the results obtained in potassium phosphate buffer (Figure S1.) Colors of the bars indicate the nucleotide substitution: bases in the WT sequence changed to guanine are green, to thymine yellow, to cytosine cyan, and to adenine red. Strong, intermediate, weak cut-offs (vertical-dashed lines) were determined by averaging the potassium phosphate %aggregation values across a given sequence and its mutants (marked by a solid black line). Values outside 1 standard deviation from the mean were considered weak if >1 SD or strong <1 SD from the mean. Experiments were performed in triplicate and the error bars represent ± SE.
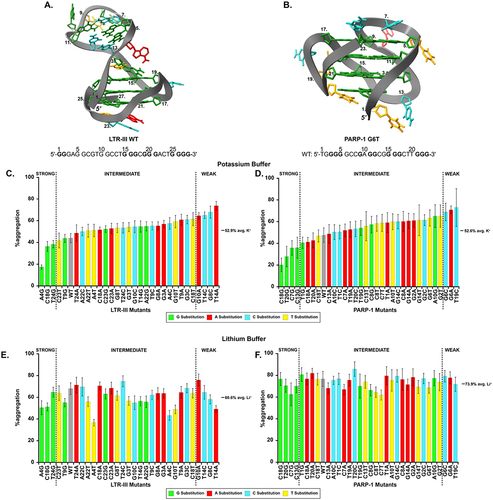
To allow a more unbiased comparison of holdase activity across the mutations for both sequences we determined the average and standard deviation of the %aggregation in potassium buffer for LTR-III and PARP-I. All data contained within one standard deviation of the average %aggregation (52.9%, SD = 12.0 for LTR-III and 52.6%, SD = 13.6 for PARP-1) were considered intermediate holdases, whereas %aggregation outside 1 SD were considered strong or weak chaperones if the value fell above or below 1 SD from the mean.
LTR-III WT has multiple distinguishing structural features. It is a 28-base DNA strand, containing a 12-guanine G-quadruplex core with a hairpin region extending from bases 5 to 13 (, PDB 6H1K). Out of the 30 mutants, seven fell outside the intermediate holdase range with three being considered strong and four weak holdases. Overall, changes to holdase activity were observed in both the positive and negative directions, demonstrating that simple single mutations could either increase or decrease holdase activity (, Table S1).
The other mixed (3 + 1) quadruplex, PARP-1, is a 23-base DNA sequence [Citation12], with a 12-guanine quadruplex core with a small capping region (). Initially, PARP-1 and its mutants’ concentration used in the assay was identical to that of LTR-III’s (2:1 DNA:protein ratio), but PARP-1 WT and its mutants almost completely inhibited the aggregation of CS, with the resulting light scattering signal essentially unchanged over the course of the 90-min assay (data not shown). Although at this ratio, PARP-1 was highly effective, it made it difficult to compare how the point mutations affected chaperone activity. As a result, we screened lower PARP-1 concentrations and at a 0.5 to 1 DNA to CS ratio, we began to observe differential effects of the mutations (). At this lower PARP-I concentration, clear activity differences between the mutants can be seen. Most of the mutations dramatically decreased the activity of the quadruplex. However, several strong holdases emerged as well (, ‘Strong’ and Table S1). Therefore, like LTR-III, simple point mutations cause dramatic changes in holdase activity in both directions. These experiments demonstrate the sensitivity of the holdase activity to changes in nucleic acid sequence.
Quadruplex integral to chaperone activity
When looking at both sequences, mutants that extended G-tracts in and adjacent to the G-quadruplex core were the strongest holdases. The inverse, disrupting G-tracts near the quadruplex core were likely to be detrimental to holdase activity, particularly for PARP-1. Together, this suggests that G-quadruplex formation and stability is necessary for holdase function (see Figure S2, Tables S1 and S2 for more detail).
To test this hypothesis, we took advantage of the differences in G-quadruplex stability in potassium or lithium buffers, as potassium stabilizes G-quadruplexes compared to lithium [Citation13]. For LTR-III WT and its mutants, the switch to lithium generally decreased holdase activity (). The mutants with the largest decrease in activity in lithium were also the most powerful holdases in potassium.
For PARP-I and its mutants, holdase activity was almost entirely lost in lithium (). Overall, the substitution of potassium for lithium was highly detrimental to the holdase activity of the quadruplex forming sequences, particularly for PARP-1, indicating the importance of the G-quadruplex structure for holdase activity.
To look more closely at the level of G-quadruplex formation by the mutants, we used a fluorescent G-quadruplex binding dye, N-methylmesoporphyrin IX (NMM) [Citation14], and measured the fluorescent signal of the dye in both potassium and lithium buffers ( and Figure S3). To directly compare between different experiments, the signal of NMM + G-quadruplex was divided by NMM alone to yield an NMM turn-on ratio (NMM Signal, . and Figure S3A/B.). As NMM doesn’t fluoresce in the absence of a G-quadruplex, its turn-on ratio will be 1 when there is no G-quadruplex present. To verify its specificity, we also tested two negative controls: a single-stranded DNA 20mer and a 20-base pair version, ssDNA and dsDNA, respectively. Neither of these are G-quadruplex forming sequences and therefore NMM should not interact with either sequence. Our positive control was a 22-base parallel quadruplex forming sequence, Myc22 [Citation15]. NMM is thought of as primarily a parallel quadruplex-binding dye [Citation16,Citation17] and therefore was expected to bind strongly to Myc22.
Figure 3. A/B. the ratio of the fluorescent signal of 1 µM NMM + 5 µM DNA. The fluorescent signal of the given DNA sequence was divided by the fluorescent signal of NMM alone to yield an NMM “turn-on” ratio we denote as NMM Signal (error bars are ± SE of triplicate data). A. NMM signal yielded by LTR-III mutants and B. PARP-1 mutants in potassium (grey) and lithium buffers (green). To verify the specificity of NMM G-quadruplex sequences, a parallel topology forming G-quadruplex Myc22 served as a positive control and two negative controls were used: a single-stranded DNA 20mer (ssDNA), and a duplexed version of the 20mer (dsDNA). To ensure the switch to HEPES from phosphate buffer did not affect NMM signal, we also ran the experiment in HEPES KOH, and NMM signal is consistent across buffer types (Figure S4). C/D. Correlation plot between the %aggregation for a given LTR-III C. or PARP-1 D. sequence (n≥3 technical replicates) and its NMM signal. To ensure the NMM assay was consistent with the thermal aggregation assay, we measured the NMM signal with 1 µM DNA and 5 µM NMM (Figure S3), as the initial assay condition at 5 µm DNA to 1 µM NMM may have left some G-quadruplex species undetected. Generally, the results were consistent with the initial assay. This correlation between NMM and PARP-1 is consistent; however, it yields a weaker Pearson R (0.38 compared to 0.49 in /Figure S3C).
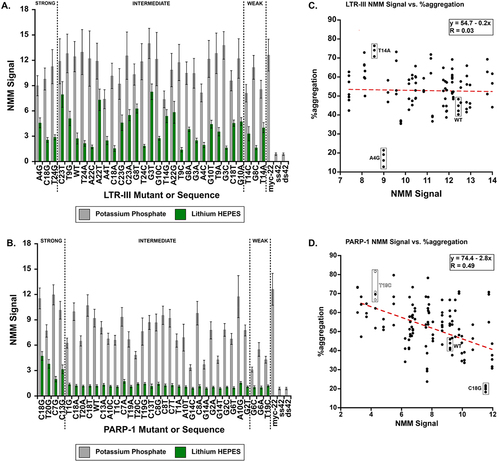
As can be seen in (also see Figure S3A/B), LTR-III and PARP-1 mutants had dramatically reduced NMM signal in lithium compared to potassium. LTR-III WT and its mutants were sensitive to the cation change, but the NMM signals in both lithium and potassium buffers were generally higher compared to PARP-1 mutants (). In general, it appears that a majority of LTR-III mutants can still stably form G-quadruplex even in the presence of lithium. This is in sharp contrast to PARP-1 mutants where only 6 of the 33 sequences yielded NMM signal above the negative controls. This loss of G-quadruplex in PARP-I potentially explains the loss of holdase activity.
For both sequences, substituting any base for cytosine appears to disrupt the G-quadruplex stability and holdase activity (Table S1). For LTR-III, these are among the only LTR-III sequences with NMM signals equal to the negative controls in lithium and for PARP-1 all cytosine substitutions resulted in lower NMM signals compared to WT in potassium buffer. The location of these mutants does not seem follow any structural pattern; however, cytosine substitutions effectively increase G-C Watson-Crick base pairing competition within the structure which could inhibit G-quadruplex formation. Interestingly, LTR-III has a notable exception to this where C18A appears to have little to no NMM binding in lithium and in theory should be reducing GC base pair competition. However, this may introduce an A-T base pair competition with T14, which may alter accessibility of stability of the G-quadruplex as this base pair sits at the top of the G-quadruplex core and base of the stem-loop ().
To further validate the importance of G-quadruplex structure to holdase activity, we plotted NMM Signal for each of the mutants against their %aggregation across all their replicates (n ≥ 3 technical replicates). To determine whether a correlation existed between NMM signal and holdase activity, we subjected the data to a linear regression to determine the Pearson R value (). For LTR-III mutants, there was no correlation, likely due to a small spread in NMM signal levels (). However, for PARP-1, a moderate correlation between NMM Signal and %aggregation emerged, with a Pearson R of 0.49. As shown in , higher NMM values correlate with lower %aggregation values, indicating that stronger NMM binding is associated with stronger holdase activity. Given the preference of NMM for parallel-stranded G-quadruplexes, these results point to a possible correlation between holdase activity and the structural topology adopted by a particular G-quadruplex sequence. We therefore continued to explore the dependence on specific G-quadruplex topology using circular dichroism (CD) spectroscopy.
Dependence of holdase activity on G-quadruplex topology
A lingering question from the chaperone activity assay was if the point mutations were making large changes to the G-quadruplexes’ topology. To test this possibility, we performed CD spectroscopy on all the sequences for both G-quadruplexes. As can be seen in (also Figure S5, S6 and SI Supplemental Data), the structure of many of the G-quadruplexes is relatively similar to the WT and all but one of the sequences retained the mixed (3 + 1) G-quadruplex characteristic maxima at 260 and 295 nm. In general, the CD spectra indicate the mutations are not disrupting the G-quadruplex core. Interestingly, one of the poorer performing PARP-1 sequences A10G induced a topology change from mixed (3 +1) to anti-parallel (Figure S7). This is consistent with our prior data indicating that anti-parallel G-quadruplexes are generally poorer holdases compared to their mixed (3 + 1) counterparts [Citation4]. However, a limitation of CD is that it will only show the dominant stable species in solution, and we therefore cannot rule out more transient, less stable structures also influencing holdase activity.
Figure 4. A. the G4r-value is a means to measure the relative topology of a given G-quadruplex forming sequence via CD. Subscript values indicate CD signal in mdeg at those given wavelengths in nm. B/C. CD spectra of select B. LTR-III mutants and C. PARP-1 mutants with G4r-value shown. D/E. Correlation plot for LTR-III mutants D. or PARP-1 mutants E. between all %aggregation found for a given sequence (n≥3 technical replicates) and their G4r-value. Note the position of the y-axis in E., one of the PARP-1 mutants, A10G caused the mixed (3 + 1) G-quadruplex to convert to a fully anti-parallel topology resulting in a negative G4r-value (see Figure S7 for full spectra).
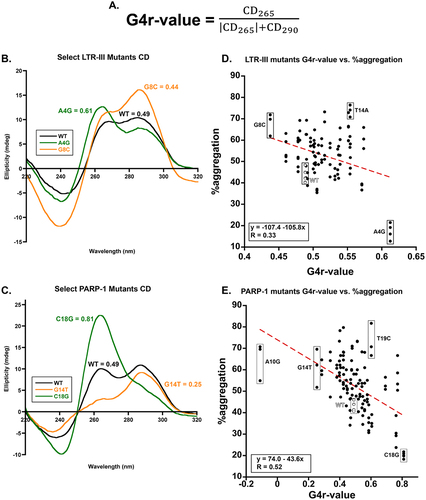
To further determine the relationship between G-quadruplex topology and holdase activity, we used the 290 and 265 nm CD signals to quantify the topology of the G-quadruplexes (). We used a previously published method that quantitates the amount of parallel and anti-parallel character of a G-quadruplex forming sequence using these signals as a ratio, referred to originally as an r-value, here as a ‘G4r-value’ () [Citation18]. To determine the relative topology of the quadruplexes used here, a G4r-value of 0.5 is treated as the ideal mixed (3 + 1) quadruplex with equal peaks at 290 and 265 nm. A G4r-value closer to 1 indicates the quadruplex is more parallel, and closer to zero indicates more anti-parallel. If a G4r-values is negative (<0) the G-quadruplex has an anti-parallel topology and if a G4r-value = 1 it is parallel [Citation18].
We plotted the %aggregation against the G4r-value and used Pearson R to quantify whether there was any correlation. For PARP-1, more parallel character correlated with stronger holdase activity with a moderate Pearson R of 0.52 (). Of the ‘strong’ holdases as defined in , the average G4r value ranged from 0.51 to 0.61 for LTR-III and 0.59 to 0.81 for PARP-1. The correlation for LTR-III was far weaker, likely due to a much smaller range of G4r-values (Pearson R = 0.33). PARP-1 mutants had a much larger range of data, from completely anti-parallel (negative data points) to G4r-values as high as 0.8, which is almost completely parallel. These data agree with prior data indicating that generally anti-parallel quadruplexes are poor holdases and parallel quadruplexes generally make stronger holdases [Citation4].
Impact of the stem-loop on G-quadruplex activity
The presence of a G-quadruplex core is not the single determinant involved in holdase activity of LTR-III: mutations near and to the stem-loop yielded the strongest and weakest holdases (along with several mutants on either side of the intermediate cut-off). Given the observation that the stem-loop sequence impacts holdase activity, we hypothesized that conformational preferences of the stem loop contribute to the holdase activity.
To attempt to show that the G-quadruplex core is essential to holdase activity, we created a variant that exchanged the stem loop in LTR-III WT for a 4-thymine diagonal loop across quadruplex plane-3, (LTR-III TTTT mutant, ). The G-quadruplex core of the LTR-III TTTT construct had similar activity to LTR-III WT in the holdase assay (). NMR spectroscopy confirmed that the structure of the G-quadruplex core in LTR-IIII TTTT is similar to that found for LTR-III WT ( and Figure S8C).
Figure 5. A. Select G-quadruplex and duplexed DNA sequences used for thermal denaturation aggregation assay and NMR studies (all sequences included in Figure S8). B. Schematic for LTR-III WT-based G-quadruplex constructs (duplexed DNA constructs are shown in Figure S8). C. Overlay of 13C-1H region (aromatic) resonances of LTR-III WT (blue), LTR-III TTTT (green), LTR-III mutants: G10A (red), G10C (pink), T9G (dark grey), and G8C (cyan). Closely matched resonances are marked in black and all other resonances in respective colors and numbering indicates positioning according to LTR-III WT sequence. Highlighted regions are a “#” indicates broadened resonances in 13C dimension and an “*” indicates 13C aliased resonances of adenine C2-H2. For all G-quadruplex forming sequences, the 13C/1H shifts confirm the formation of hybrid (3+1) conformation similar to that of LTR-III WT. D. Thermal denaturation aggregation assay comparing %aggregation vs DNA construct (error bars ± SE). E. Chemical shift perturbations (CSP) for C6-H6 or C8-H8 resonances of the hairpin-stem region for LTR-III mutants: G10A (red circles), G10C (pink squares), T9G (dark grey triangles), and G8C (cyan diamonds) compared to WT sequence. Positions C8-G10 are omitted for clarity as the mutations create large CSPs (full data are in Figure S8). F. Correlation plots of the CSPs for positions G6 and C12 correlate with their %aggregation (n ≥ 3 replicates); larger perturbations from WT at these positions are correlated with worse holdase activity. Color and shape-coding is the same as E. with the addition of LTR-III WT (dark blue circles).
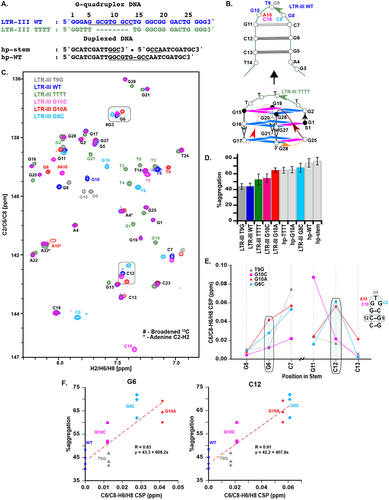
To determine whether the loop or the stem of the hairpin was contributing to the chaperone activity of LTR-III, we created a series of duplexed hairpin variants without the G-quadruplex core: a hairpin version of the WT stem-loop (hp-WT), a version of the WT stem without a loop (hp-stem), a hairpin with an all thymine loop (hp-TTTT), and a hairpin of mutant G10A (hp-G10A) (), which had weak activity in its G-quadruplex form. Duplex formation was confirmed by NMR (Figure S8). Despite all of these variations, none of the duplexed variants displayed substantially different activity from each other, suggesting that the loop on its own does not substantially govern holdase activity (). Therefore, the effect of the G10A mutation on holdase activity requires the native structural context and it is possible this is also true for other hairpin variants.
We hypothesized that the local structure of the hairpin loop and/or its influence on accessibility to the G-quadruplex could affect the holdase activity. To examine the role of the loop mutations towards structural variability, we performed 1D and 2D NMR experiments with LTR-III WT and stem-loop mutants with weak (G10A and G8C) and intermediate (T9G and G10C) chaperone activity. The mutants that most enhance the activity (A4G, C18G and T24G, ) were excluded from the analysis as they also contribute towards G-register shifts [Citation19] that result in conformational exchange across multiple species at equilibrium complicating interpretation of NMR data. Excellent agreement of imino 1H resonances (Figure S8C-E) was observed between LTR-III WT and LTR-III mutants, confirming similar overall structure [Citation11].
13C/1H chemical shifts indicated LTR-III stem-loop mutants retained the hybrid (3 + 1) topology from LTR-III WT, including the characteristic v-loop (, adjudged from 8:4 guanosine nucleotide in anti:syn ratio) [Citation6,Citation11]. Next, excellent agreement in chemical shift perturbation (CSP <0.02 ppm) of the aromatic C6/C8-H6/H8 resonances was observed in tetrad forming region with CSP > 0.02 ppm observed only in the hairpin loop region (Figure S8F).
Looking at all of the CSP perturbations ( and Figure S8), one striking change could explain the activity difference: chemical shift perturbations of the G6-C12 base pair correlated with holdase activity. Those stem-loop variants with weak activity (G10A and G8C) had a higher CSP on the C6/C8-H6/H8 atoms at the G6-C12 base pair compared to the mutants with intermediate activity (T9G and G10C, .). Importantly, this base-pair is near to the G-quadruplex core and suggests a more WT-like conformation or a completely flexible loop (such as the TTTT loop) is important to retaining holdase activity. This observation suggests that the structural orientation of highly structured regions near the G-quadruplex affect activity, possibly by changing access to the G-quadruplex to the protein.
In prior NMR work by the Phan group, it was shown that the PARP-1 WT sequence adopts a range of G-quadruplex conformations, while a single mutation, G6T, results in the formation of a stable hybrid (3 + 1) G-quadruplex topology without any flexible loops being present [Citation6,Citation12]. In our study of PARP-1, the G6T mutant resulted in a significant reduction in holdase activity compared to PARP-1 WT (). In combination with our NMR work, we suggest that the changes in the hairpin-loop region that stabilize it could restrict access to the G-quadruplex, inhibiting its ability to serve as a holdase.
LTR-III mutant stability and holdase activity
While the NMR experiments did not show that dynamics was a critical component to loop mutants, it remained possible that flexibility is an important variable in holdase activity. To approximate changes in dynamics from other mutants, we measured melting temperatures for LTR-III mutants. This approach is analogous to that previously used to analyse the role of structural dynamics in the chaperone Spy [Citation8]. In this previous study, there was a negative correlation between melting temperature and activity. Although melting temperature and dynamics are not perfectly correlated, previous studies of nucleic acid dynamics suggest that nucleic acid motions and non-native conformations typically increase with increased temperature [Citation20,Citation21].
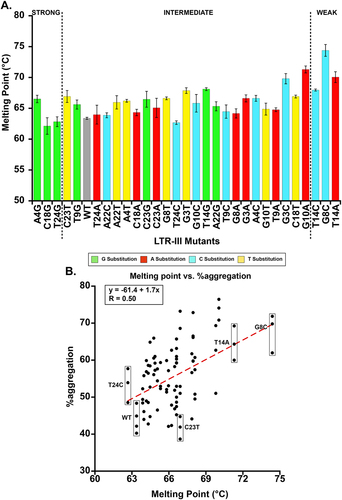
Overall, single point mutations were able to yield a melting point 1°C lower (T24C) than WT LTR-III and as much as 11°C higher ( and Supplementary Data). To determine whether there was a correlation between increased dynamics (assumed to correlate with melting temperature) and holdase activity, we plotted melting temperature and %aggregation for all LTR-III mutants (minus oligomerically heterogeneous mutants covered in the next section). This found a strong correlation (Pearson R = 0.50) in which increased melting point was correlated with decreased holdase activity (). This comparison suggests mutations in that stabilize the structure are correlated to less powerful holdases. Although this data suggests that dynamics can be an important factor, it also is consistent with the NMR results, in that the increased dynamics may create a more favourable and accessible conformation around the G-quadruplex core.
Figure 6. A. The melting points of LTR-III mutants determined from a qPCR primer melting point assay using SYBR green fluorescence to monitor unfolding (error bars are ± SE). Colors of the bars indicate the nucleotide substitution: bases in the WT sequence changed to guanine are green, to thymine yellow, to cytosine cyan, and to adenine red. B. Correlation plots between all %aggregation found for a given LTR-III mutant (n≥3 technical replicates) and their melting point. The linear regression yielded a positively sloped correlation between higher melting points and decreased holdase activity. LTR-III A4G, C18G and T24G were excluded from the analysis due to their oligomerization obscuring the melting point analysis. When their melting points are included in the data set, it also yields a positively sloped, moderate correlation between melting point and decreased holdase activity (Figure S9).
Heterogeneity and chaperone activity
Despite observing changes in holdase activity that depend on topology and stability, other factors could still influence holdase activity. To examine whether higher order structure could also play a role, we ran native gels to determine whether some of the mutants produced larger oligomeric structures. In prior literature [Citation12], PARP-1 WT was shown to be relatively unstable, readily forming larger oligomers while LTR-III was shown to be largely monomer (also indicated by the NMR work here) [Citation11].
To test the oligomeric states of the G-quadruplex sequences, we ran mass photometry (MP) on the strongest and weakest holdase sequences. MP measures the relative masses of species in solution based on their ratiometric contrast compared to the background. A more negative ratiometric contrast, i.e. more light is being scattered compared to the background, the larger the species’ mass [Citation22]. As can be seen in Figure S10, the stronger holdase mutants LTR-III A4G and PARP-1 C18G have higher ratiometric contrasts compared to the weaker holdase mutants LTR-III T14A and PARP-1 G6C. This indicates, despite similar monomer molecular weights, that the stronger mutants are forming larger oligomers in solution compared to the weaker mutants.
To confirm the MP observations and extend them both to known sizes and to more of the G-quadruplexes tested here, we also performed native gels. The native gels were visualized with a G-quadruplex-specific and a non-specific nucleic acid stain (NMM and SYBR Gold, respectively).
We ran gels directly comparing the three strongest holdases, four weakest holdases, WT LTR-III and PARP-1 sequences, and LTR-III A4T, which was a strong holdase that did not involve extending a G-tract unlike the other LTR-III strong mutations, in potassium buffer ( and Figure S11). When observing the WT of each G-quadruplex forming sequence, there is large discrepancy in the number of bands present for each. LTR-III WT has one predominant band and in addition to monomer, PARP-1 WT has two major bands, several fainter bands, and a degree of smearing. This pattern holds true for all the PARP-1 sequences ( and Figure S11C), where there is generally a greater degree of smearing and number of bands compared to LTR-III WT and mutants.
Figure 7. A-C. 1 µM DNA non-denaturing native PAGE gels of four stronger (left side of each gel) and four weaker (right side of each gel) holdase sequences for LTR-III and PARP-I A/B. LTR-III mutants or C. PARP-1 mutants in potassium A/C. or lithium containing TBE buffer B. All gels stained with G-quadruplex-specific NMM (left) or non-specific SYBR gold dyes (right). Going from potassium to lithium containing buffers reduces the overall number of NMM positive bands for heterogeneous LTR-III mutants, this suggests less stable larger G-quadruplexes are lost in the absence of potassium. For PARP-1 in lithium, there are little to no detectable NMM-positive bands for any mutants at 1 µM (Figure S12), and at 5.6 µM there is also weak NMM binding with only faint bands or streaking detectable (Figure S19). D. LTR-III A4G (left side of gel) and PARP-1 C18G (right side of gel) were visualized at 6, 3, and 1 µM in NMM (left) or SYBR gold (right) in potassium containing 1x TBE buffer, arrows indicate presumed monomer band. All gels had brightness and contrast adjusted for each gel individually, but within each gel, the same brightness and contrast were used across the whole gel.
When we compare the strongest vs. weakest holdase sequences for both sequences, the number of bands and degree of smearing can be loosely correlated with its holdase activity. For example, all of the strong sequences (aside from LTR-III A4T) have a large degree of smearing with more high molecular weight bands compared to the weakest holdases and WT. These higher order bands are also typically NMM-positive for the strong chaperones, indicating intermolecular G-quadruplex structures are likely contributing to their potent holdase activity.
However, PARP-1 at 1 µM does not bind NMM as strongly as LTR-III (see , and Figure S17) and this results in a much fainter gel, making direct comparisons using NMM more difficult. To detect the NMM bands, we used a higher concentration of PARP-1 (5.6 µM) and observed the same trends of higher smearing associated with stronger holdase activity.
To determine whether the oligomerization was highly sensitive to concentration changes in this range, a native gel of two heterogeneous sequences LTR-III A4G and PARP-1 C18G at 6, 3, and 1 µM was run to determine if there were any differences in the oligomers present (). Comparing 6 and 1 µM for both sequences, there appears to be little difference as the same bands are present throughout but become fainter at lower concentrations. This indicates there is likely not a large difference in the sizes of G-quadruplex forming species present at 5.6 µM and 1 µM.
In the thermal denaturation aggregation activity assay described above (), the holdase activity of both PARP-1 and LTR-III mutants were negatively impacted by the switch from potassium to lithium counterion. As we had already determined that lithium destabilized PARP-I but only partially destabilized LTR-III structure via NMM binding (), we sought to visualize how the metal change would affect the G-quadruplex oligomerization by running the same native PAGE experiments in lithium buffer.
For LTR-III, the switch from potassium to lithium caused many of the larger molecular weight bands to disappear, with the sequence becoming largely monomer. However, the G-quadruplex monomer structure was largely maintained, as evidenced by strong NMM staining of the monomer band. The loss of oligomerization in lithium as well as the loss of holdase activity suggests the importance of larger oligomers to LTR-III chaperone activity. Together, these data indicate that the higher activity of these most powerful LTR-III mutants stemmed primarily from their higher order structure, similar to PARP-I.
LTR-III improves TagRFP675 folding in E. coli
In prior work, we used a relatively unstable fluorescent protein, TagRFP675 as an in-cell folding sensor [Citation4]. Like other fluorescent proteins, TagRFP675 does not fluoresce at its excitation maximum unless it is in its native state, and in the absence of co-expressing chaperones, we have shown that the protein has very little fluorescent yield (). To observe if the G-quadruplexes tested here had any effect on the folding and fluorescent yield of TagRFP675 in E. coli we co-expressed TagRFP675 with wild-type PARP-1 and LTR-III. Of note, in these cases, the G-quadruplexes will be expressed as RNA in E. coli.
Figure 8. A. a simplified model of expression vectors used here. The expression of an empty vector, GroEL, and G-quadruplex forming sequences: PARP-1 WT, LTR-III WT, and the previously studied G-quadruplex Seq576 are under the control of an L-arabinose (0.2%) inducible pBAD promoter. B. Cellular fluorescence assay of TagRFP675 with negative controls (+Empty NI and IN, and GroEL NI), positive controls (+GroEL in and +Seq576 IN), and G-quadruplex-forming sequences LTR-III WT and PARP-1 WT. Protein expression was induced at 42°C. The experiment shown here were technical triplicates (n = 3) and performed more than two times. C. Harvested cells showing relative color of E. coli pellets, more purple pellets correlate to stronger fluorescent signal. NI and in indicate non-induced and induced, respectively.
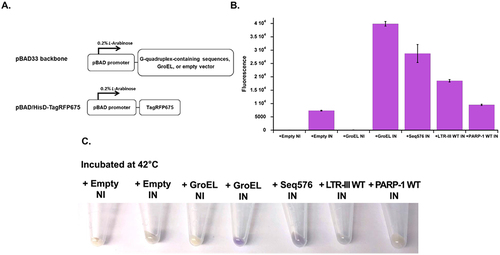
We see very little fluorescence when TagRFP675 is induced without a co-expressed chaperone. However, when we induce TagRFP675 with chaperones, we see a large difference in the amount of fluorescence compared to the negative controls. Consistent with prior results, co-expressing GroEL creates large amounts of folded protein as does a previously studied parallel G-quadruplex forming sequence, Seq576 that is reflected as a higher fluorescence signal. When we focus on LTR-III WT and PARP-1 WT, we see that LTR-III has a much higher signal than PARP-1, which displays little fluorescence (). These results are qualitatively supported by simply pelleting out the E. coli from these various conditions (). There is clearly a much darker purple color associated with the strongest chaperones: GroEL, Seq576 and LTR-III compared to the predominantly paler yellow color of the negative controls and PARP-1.
This result is interesting in that from everything we have shown so far, PARP-1 and its mutants have been the stronger holdase than LTR-III in vitro. However, there are several factors that likely lead to it being a less powerful chaperone in E. coli. From the NMM-fluorescence binding assays as well as the NMM-positive gels (), we can see that LTR-III WT has a much stronger signal than PARP-I WT, suggesting perhaps it forms G-quadruplex structure more stably especially under non-ideal conditions. Similarly, we also have shown that in the absence of potassium that NMM is unable to bind PARP-I, suggesting the G-quadruplex is essentially destroyed. It therefore seems likely that in the complex environment of the cell, perhaps PARP-I WT is not forming as stable a G-quadruplex as LTR-III WT due to its high heterogeneity and is degraded, and therefore is unable to provide significant chaperoning power.
Discussion
In summary, here we determined several important aspects of G-quadruplexes that drive their ability to prevent protein aggregation (). We first showed that the holdase activity of G-quadruplexes could be altered positively and negatively by single mutations. We then showed that the G-quadruplex core was essential for activity through a combination of ion interchange and NMR experiments. From CD spectroscopy and NMM binding experiments, we showed that the topology contributed greatly to the activity. Melting experiments suggests a role for dynamics in the chaperone activity. As chaperones need to interact with mobile clients, dynamics are a common feature of many chaperones [Citation23]. Although some of these dynamics are large-scale motions driven by ATP hydrolysis, the ATP-independent chaperone Spy also has dynamics as an important component of its mechanism [Citation8,Citation24]. And our limited evidence indicates that several of the G-quadruplexes could be oligomeric, which might also influence activity. Although not exhaustive, we have studied several factors involved in the holdase activity of G-quadruplexes.
Table 1. The measured value’s correlation with chaperone activity strength is summarized, EG High NMM is correlated with low %aggregation for PARP-1. The correlation strength Pearson R cut-offs used: <0.30 weak, 0.31–0.49 moderate, >0.50 strong.
The dependence of the holdase activity on structural topology was previously hinted at by examining a small number of parallel, anti-parallel, and mixed (3 + 1) G-quadruplexes [Citation4]. The larger sample size presented here strongly indicates a topology dependence for holdase activity. What is less clear is how the oligomerization state, binding stoichiometry, and dynamics drive holdase activity. One limitation of the present study is that an aggregating protein client was used, precluding determination of binding affinity, likely one of the major parameters being modulated by the properties observed here.
The suggestion that oligomerization was important to activity was not surprising, as we had previously seen the formation of protein:nucleic acid oligomers as a regular phenomenon among nucleic acids acting as chaperones [Citation3], and G-quadruplexes in particular [Citation4]. We had previously found that this oligomerization could at times act as kinetic traps to prevent further aggregation, but sometimes could accelerate overall protein aggregation. Given the nucleic acid itself oligomerizes could provide a mechanism for co-oligomerization with protein clients, and this process was aided by including extra guanine residues that likely could form heterogeneous G-quadruplex structures. The oligomerization of G-quadruplexes is also reminiscent of the mechanism of small heat shock proteins [Citation25]. It is possible that the oligomerization and dynamics are both feeding from a similar entropic driving force to maximize binding sites. Future studies of the detailed mechanism of aggregation and protein folding can make use of computational modelling to approach these questions.
In vivo, the exact impact of mutations on activity of any biological molecule can be difficult to assess due to changes in stability that may not be easily tracked in vitro. Therefore, studies of activity in vitro can be very helpful to dissect structure-function relationships that will be difficult in cells. In the case of PARP-I here, in-cell complications due to stability prevented further detailed investigation.
In terms of biological relevance, a recent study has shown that RNA G-quadruplex formation in the cell increases substantially under stress conditions [Citation26]. As a result, the G-quadruplexes that are formed will be able to interact with partially denatured proteins that are increasingly present under stress. This observation puts G-quadruplexes in a cellular environment where the effects of the sort we observed here would be likely to occur.
In total, these mechanisms help elucidate the roles G-quadruplexes can play in RNA-containing oligomers and aggregates related to stress.
Materials and methods
Sourcing nucleic acids
All were ordered from Integrated DNA Technology using their standard desalting and purification procedures. For the heat aggregation plate reader assays, DNA was ordered lyophilized, and normalized to guaranteed molar weights by IDT. The DNA was then resuspended in 10 mM potassium phosphate buffer pH 7.5. For experiments using HEPES, DNA was transferred to the respective buffer with an Amicon spin column after three rounds of concentrating and washing with filtered de-ionized water and three rounds of concentrating and washing with the buffer it was being transferred into (e.g. 40 mM HEPES brought to pH 7.5 with KOH or LiOH).
Refolding nucleic acids
Prior to every experiment, G-quadruplex stocks were annealed by heating to 95°C for two minutes and allowed to cool to 25°C by a controlled temperature ramp of 1°C/min with 550 RPM shaking in a heating block (Eppendorf ThermoMixer C). For all experiments the nucleic acid stocks were diluted into the assay/experiment, and the experiment began within 30 minutes of the annealed samples reaching 25°C.
Thermal aggregation plate reader assays
For the initial thermal aggregation assays 550 nM citrate synthase from porcine heart (Sigma-Aldrich C3260-5KU) in a 1:2 protein:DNA strand concentration for LTR-III mutants and 1 t 0.5 PARP-1 mutants (1.1 or 0.275 µM DNA or pre-folded G-quadruplex) in 10 mM potassium phosphate pH 7.5 or 40 mM HEPES brought to pH 7.5 with 6 M KOH or 2 M LiOH. Aggregation was measured via absorbance at 360 nm in a Biotek Powerwave XS2 multimode plate reader using black clear flat bottom half-area plates (Corning 3880), with shaking and measurements every 36 sec for 90 minutes as previously described [Citation4]. The choice of protein concentration was to optimize reproducibility and dispersion of aggregation.
Briefly, for all assays, the plates were transferred from ice to a preheated 50°C plate reader, and the temperature was held constant throughout the entire experiment. The sequences were run in triplicate. Percent aggregation was calculated as a function of the maximum absorbance value recorded in the hour and a half divided by the maximum protein alone absorbance value. Error bars shown are standard error propagated from both the triplicate protein alone and triplicate experimental measurement. As a control, herring testes DNA (htDNA, Sigma D6898-1 G) was also run on each plate to ensure consistency of data. Although htDNA is much larger (≈10,000 bp) than the nucleic acids used in the study here, we use it as a control on every plate for its high consistency in activity at a medium level of holdase activity to ensure the experiment ran correctly.
The melting temperatures of the quadruplexes are all > 60°C, which means we assume that the quadruplexes are folded in our chaperone activity assay at 50°C.
N-methylmesoporphyrin IX fluorescence
In a Corning 3880 plate, the emission spectra of 1 µM N-methylmesoporphyrin IX (NMM, Cayman Chemical) was measured using an excitation wavelength of 399 nm, and an emission of 610 nm in the presence or absence of 5 µM pre-folded G-quadruplex, ssDNA, or dsDNA in 10 mM potassium phosphate pH 7.5 or 40 mM HEPES brought to pH 7.5 with LiOH or KOH at a total volume of 100 µL per sample. Samples were run in triplicate at 25°C in a multimode plate reader (Tecan infinite M200). Reported values are the ratio of the emission at 610 nm for NMM + sequence divided by NMM emission in buffer alone.
The above experiment was repeated at 5 µM NMM dye with 1 µM or DNA in 10 mM potassium phosphate and 40 mM HEPES LiOH to ensure all G-quadruplex was being detected at concentrations used in the thermal aggregation assay.
Circular dichroism and G4 r-value
All CD spectra were measured using a Jasco J-1100 circular dichroism spectrophotometer. All samples were made with pre-folded 22 µM G-quadruplex DNA in 10 mM potassium phosphate pH 7.5 buffer in a 1 mm pathlength quartz cuvette.
For CD spectra of select sequences at elevated temperatures, spectra of samples made with pre-folded 5 µM G-quadruplex DNA were taken at 25, 42, and 50°C in 10 mM potassium phosphate pH 7.5 buffer. Samples were measured in ascending temperature and samples were allowed to incubate in the instrument for 4 min at the given temperature.
For all CD measurements, spectra were taken from 320 nm to 195 nm at 1 nm intervals using a 50 nm/min scanning speed, 8 sec data integration time (D.I.T.), and the resulting spectra shown is the average of three accumulations (22 µM data) or two accumulations (5 µM data).
To determine an individual sequence’s G4r-value, an equation from [Citation18] was adapted where G4r-value = where CD “### nm” represents the CD signal in mdeg at the given wavelength.
QPCR melting point analysis of LTR-III mutants
For determining the melting point of pre-folded LTR-III and its mutants, a QPCR (QuantStudio 3) primer melting point analysis was used. To a room temperature 96-well, full skirt, clear PCR microplate (Axygen PCR-96-FS-C) a 50 µl solution of 1× SYBR Green (from 10,000× DMSO concentrate, MCE HY-K1004) with or without DNA in 10 mM potassium phosphate pH 7.5 were added. Once the samples were added, MicroAmpTM Optical Adhesive Film was used to seal the plate and ensure there was no evaporation from the sample. The samples were run in triplicate with measurements being made every 1°C from 25° to 95°C. The curves were analysed via the QPCR software (QuantStudioTM Design & Analysis Software v1.5.1) and the first derivative of the melting curve was used to determine the melting point of a given sequence.
Construction of expression vectors
pBAD33 vector was used to generate the expression vectors of G-quadruplex containing sequences, GroEL, and Empty (). pBAD33-GroEL and pBAD33-empty were obtained from previous study [Citation4], and pBAD33mut-LTR-III WT and pBAD33mut-PARP-1 WT vectors were synthesized and cloned (Genscript) into pBAD33mut vector using the SacI and SpeI restriction enzyme sites. pBAD/HisD-TagRFP675 was a gift from Vladislav Verkhusha (Addgene plasmid # 44274; http://n2t.net/addgene:44274; RRID:Addgene_44274) [Citation27].
Protein expression, and Escherichia coli fluorescence assay
Each pBAD33 backbone-based vector and pBAD/HisD-TagRFP675 were co-transformed into the E. coli strain MC4100(DE3) by heat shock. Expression of protein and RNA was performed following the previous study [Citation4]. Briefly, each transformant was grown on a LB plate containing 0.2% L-Arabinose, ampicillin (200 μg/ml), and chloramphenicol (50 μg/ml) at 42°C overnight. To examine whether the expression is tightly controlled, LB plates containing the same amount of antibiotics but without L-Arabinose were used for both +Empty and +GroEL samples, shown as NI. The next day, samples were prepared in 170 mM NaCl, and harvested by centrifugation at 10,000 g for 2 min at 4°C. Color of cell pellets was immediately compared after harvesting, and then cells were resuspended in the same buffer to 0.1 OD600 for further fluorescence assay. Fluorescence of TagRFP675 was measured by microplate reader (Infinite M200 Pro, Tecan) using a black 96-well plate (Corning Black NBS 3991) upon excitation at 598 nm and emission at 675 nm.
NMR sample preparation and data analysis
Oligonucleotides for NMR studies were procured in lyophilized form from Integrated DNA technologies (IDT USA), which were made with solid phase synthesizer and purified with desalting columns (standard desalting). Oligos were used without further purification. Concentration of DNA was estimated with UV absorbance at 260 nm, measured using Shimadzu UV-1800 UV-Vis spectrophotometer. G-quadruplex and duplex systems were made to 9 mL (50 µM) concentration and heated at 95°C for 5 min, after addition of 1 mL of 0.2 M potassium phosphate buffer (pH 7.0), the solution was mixed vigorously and heated again at 95°C for 5 minutes. Samples were allowed to cool at room temperature overnight. For making hp-stem duplex, a similar annealing protocol was used where the concentration of two complementary strands was 500 µM. Annealed samples were exchanged to NMR buffer (20 mM potassium phosphate, pH 7.0) using 3 kDa centrifugal filters (Amicon, Merck Inc.) spun at 4000 g and 4°C to a final volume of 250 µL. NMR samples were made to 300 µL by adding 5% (v/v) D2O and 50 µM sodium trimethylsilylpropanesulfonate (DSS) as internal standard. The final concentration of DNA samples was of 1–2.5 mM concentration. Samples were then transferred to 5 mm medium wall tubes (I.D 3.4 mm, Norell, Inc.).
NMR data was acquired with Bruker 700 MHz spectrometer equipped cryogenic triple 1H, 13C and 15N probe with z-gradients. All the data were acquired at 298 K (and 310 K for G-quadruplex systems) as described previously [Citation6]. 1H-1H NOESY (150/200 ms mixing time) [Citation28], 13C-1H heteronuclear single quantum coherence (HSQC) [Citation28] and 15N-1H heteronuclear multiple quantum coherence (HMQC) [Citation29] spectra were acquired for each sample. Spectra were acquired with topspin 3.5.6 (Bruker Inc.), processed with NMRPipe [Citation30] and analysed using NMRFAM-SPARKY [Citation31]. Chemical shifts were referenced to DSS.
Native PAGE
Prior to running the gel, 50 µM nucleic acid stocks in 10 mM potassium phosphate pH 7.5 or 40 mM HEPES LiOH pH 7.5 were annealed using the annealing protocol in ‘Refolding nucleic acids’ above. Once annealed, the pre-folded samples were diluted to 5.6 µM or 1 µM in non-denaturing loading buffer (10% glycerol, 0.8 mM Tris base, and 9.6 mM glycine), and 1X TBE buffer with 10 mM KCl or LiCl. Immediately after dilution, 10 µL of 5.6 µM or 15 µL of 1 µM sample were loaded into each lane.
All native PAGE gels were performed at 4°C with 1X TBE running buffer (8.9 mM Tris base, 8.9 mM borate, with 2 mM EDTA) with 10 mM KCl or LiCl with Invitrogen 1.0 mm x 12 well 20% TBE-PAGE gels (EC63152BOX, Thermo Fisher Scientific). Gels were pre-run and run for 1 hour (unless otherwise stated) at 4°C once samples were added.
For gels loaded with 5.6 µM DNA, the gels were first stained with 2 µM NMM (from a 10 mM stock in anhydrous DMSO stored at −20°C) in 1× TBE with 10 mM KCl or LiCl for 20 minutes and visualized with the SYBR green filter. Once visualized, the same gels were stained with 1× SYBR gold (from a 10,000× concentrate in DMSO) in 1× TBE with 10 mM KCl or LiCl and visualized with the SYBR gold filter. For gels loaded with 1 µM DNA the gels were stained with 10 µM NMM for 20 minutes and 0.5× SYBR gold for 10 minutes in their respective running buffers. Gels were visualized on a BioRad ChemiDoc Imaging System.
A gel of two sequences with a propensity to form higher molecular weight species (LTR-III A4G and PARP-1 C18G) in potassium buffer were visualized via the same conditions as above at several concentrations: 6, 3, and 1 µM. Gels were run at 4°C for 1 hour in 1× TBE buffer with 10 mM KCl, and stained with 10 mM NMM for 20 minutes and 0.5× SYBR gold for 10 minutes.
For gel images of all mutants at 5.6 µM see Figures S13–S20.
Mass photometry
Prior to sample analysis, fresh poly-L-lysine (PLL) coating was applied per Refeyn protocols. Briefly, 7 µL of PLL (Sigma-Aldrich 25,988-63-0) was applied to a pre-cleaned coverslip (Refeyn) and a second pre-cleaned coverslip was placed on perpendicular on top of the first cover slip. The samples were allowed to sit for 30 seconds and immediately after were washed by briefly submerging the coverslip in MilliQ DI water, rinsing with MilliQ water, and briefly submerging again. The coverslips were then dried under argon and samples were applied within 10 minutes of applying the PLL coating.
All samples were analysed on a Refeyn TwoMP mass photometer (2MP–0232). All sample mass distributions were obtained on a pre-cleaned PLL coated coverslip fitted with pre-cleaned and dried 6-well gasket (Refeyn). To a well, 14 µL of 10 mM potassium phosphate pH 7.5 buffer was added and the focus was set to ensure a clear area of buffer was sampled. Once focused, a mass distribution of the buffer was acquired for 60 seconds in the ‘Regular’ field of view (150 × 59 binned pixels or 10.9 µm x 4.3 µm) Immediately after, 1 µL of a 50 µM stock of freshly annealed G-quadruplex forming sequence was mixed into the same well as the previously measured buffer droplet. Once mixed the mass distribution was acquired for 60 seconds. All data was analysed and exported via Refeyn MP software (Refeyn DiscoverMP v2022 R1). Although MP has been used to determine the mass of heterogeneous mixtures of nucleic acids in solution [Citation32], the technique needs to be calibrated by known standards to obtain absolute masses. G-quadruplexes standards currently do not exist, so only the ratiometric contrasts are given that represent relative mass.
ANOVA statistical analysis
The %aggregation data of all LTR-III and PARP-1 mutants in potassium phosphate buffer was compared via ANOVA (%aggregation replicates, n ≥ 3) and subsequently subjected to a Student-Newman Keuls (SNK) post hoc analysis using the Kaleidagraph software suite (version 5.0). For SI Tables 3 and 4 mutations that extended G-tracts were compared to mutants that disrupted G-tracts and random mutants via ANOVA and subjected to SNK post hoc analysis. For data displayed in SI Tables 5–8 the mutants were compared to WT (SI Tables 5 and 7) or the median for that given sequence (SI Tables 6 and 8). Non-redundant random mutants were chosen via the Microsoft Excel randomizer equation, where the number of random mutants was equal to the number of G-tract extending mutants (nrandom = nG-tract extending mutations). Statistical differences were defined as an α ≤ 0.1 across all data sets.
Supplemental Material
Download Zip (7.1 MB)Disclosure statement
No potential conflict of interest was reported by the authors.
Data availability statement
All data except NMR spectra and raw aggregation data available in Supplementary Data and Supplementary Information. For raw NMR data and raw aggregation data, please contact the authors.
Supplementary material
Supplemental data for this article can be accessed online at https://doi.org/10.1080/15476286.2023.2228572
Additional information
Funding
References
- Hartl FU, Bracher A, Hayer-Hartl M. Molecular chaperones in protein folding and proteostasis. Nature. 2011;475(7356):324–332. doi: 10.1038/nature10317
- Docter BE, Horowitz S, Gray MJ, et al. Do nucleic acids moonlight as molecular chaperones? Nucleic Acids Res. 2016;44(10):4835–4845. doi: 10.1093/nar/gkw291
- Litberg TJ, Docter B, Hughes MP, et al. DNA facilitates oligomerization and prevents aggregation via DNA networks. Biophys J. 2020;118:162–171. doi: 10.1016/j.bpj.2019.11.022
- Begeman A, Son A, Litberg TJ, et al. G-Quadruplexes act as sequence-dependent protein chaperones. EMBO Rep. 2020;21:e49735. doi: 10.15252/embr.201949735
- Balch WE, Morimoto RI, Dillin A, et al. Adapting proteostasis for disease intervention. Science. 2008;319(5865):916–919. doi: 10.1126/science.1141448
- Reddy Sannapureddi RK, Mohanty MK, Gautam AK, et al. Characterization of DNA G-quadruplex topologies with NMR chemical shifts. J Phys Chem Lett. 2020;11(23):10016–10022. doi: 10.1021/acs.jpclett.0c02969
- Guzman BB, Son A, Litberg TJ, et al. Emerging roles for G-quadruplexes in proteostasis. FEBS J. 2022. doi: 10.1111/febs.16608
- Quan S, Wang L, Petrotchenko EV, et al. Super spy variants implicate flexibility in chaperone action. Elife. 2014;3:e01584. doi: 10.7554/eLife.01584
- Perrone R, Nadai M, Frasson I, et al. A dynamic G-quadruplex region regulates the HIV-1 long terminal repeat promoter. J Med Chem. 2013;56:6521–6530. doi: 10.1021/jm400914r
- Salvati E, Scarsella M, Porru M, et al. PARP1 is activated at telomeres upon G4 stabilization: possible target for telomere-based therapy. Oncogene. 2010;29(47):6280–6293. doi: 10.1038/onc.2010.344
- Butovskaya E, Heddi B, Bakalar B, et al. Major G-Quadruplex form of HIV-1 LTR reveals a (3 + 1) folding topology containing a stem-loop. J Am Chem Soc. 2018;140:13654–13662. doi: 10.1021/jacs.8b05332
- Sengar A, Vandana JJ, Chambers VS, et al. Structure of a (3+1) hybrid G-quadruplex in the PARP1 promoter. Nucleic Acids Res. 2019;47:1564–1572. doi: 10.1093/nar/gky1179
- Bhattacharyya D, Mirihana Arachchilage G, Basu S. Metal cations in G-Quadruplex folding and stability. Front Chem. 2016;4:38. doi: 10.3389/fchem.2016.00038
- Nicoludis JM, Barrett SP, Mergny JL, et al. Interaction of human telomeric DNA with N-methyl mesoporphyrin IX. Nucleic Acids Res. 2012;40:5432–5447. doi: 10.1093/nar/gks152
- Phan AT, Modi YS, Patel DJ. Propeller-type parallel-stranded G-quadruplexes in the human c-myc promoter. J Am Chem Soc. 2004;126:8710–8716. doi: 10.1021/ja048805k
- Sabharwal NC, Savikhin V, Turek-Herman JR, et al. N-methylmesoporphyrin IX fluorescence as a reporter of strand orientation in guanine quadruplexes. FEBS J. 2014;281(7):1726–1737. doi: 10.1111/febs.12734
- Tippana R, Xiao W, Myong S. G-quadruplex conformation and dynamics are determined by loop length and sequence. Nucleic Acids Res. 2014;42(12):8106–8114. doi: 10.1093/nar/gku464
- Cheng M, Cheng Y, Hao J, et al. Loop permutation affects the topology and stability of G-quadruplexes. Nucleic Acids Res. 2018;46:9264–9275. doi: 10.1093/nar/gky757
- Grun JT, Hennecker C, Klotzner DP, et al. Conformational dynamics of strand register shifts in DNA G-Quadruplexes. J Am Chem Soc. 2020;142:264–273. doi: 10.1021/jacs.9b10367
- Coman D, Russu IM. A nuclear magnetic resonance investigation of the energetics of basepair opening pathways in DNA. Biophys J. 2005;89:3285–3292. doi: 10.1529/biophysj.105.065763
- Rangadurai A, Shi H, Xu Y, et al. Measuring thermodynamic preferences to form non-native conformations in nucleic acids using ultraviolet melting. Proc Natl Acad Sci U S A. 2022;119:e2112496119. doi: 10.1073/pnas.2112496119
- Cole D, Young G, Weigel A, et al. Label-free single-molecule imaging with numerical-aperture-shaped interferometric scattering microscopy. ACS Photonics. 2017;4(2):211–216. doi: 10.1021/acsphotonics.6b00912
- Bardwell JC, Jakob U. Conditional disorder in chaperone action. Trends Biochem Sci. 2012;37:517–525. doi: 10.1016/j.tibs.2012.08.006
- Horowitz S, Salmon L, Koldewey P, et al. Visualizing chaperone-assisted protein folding. Nat Struct Mol Biol. 2016;23:691. doi:10.1038/nsmb.3237
- Haslbeck M, Vierling E. A first line of stress defense: small heat shock proteins and their function in protein homeostasis. J Mol Biol. 2015;427:1537–1548. doi: 10.1016/j.jmb.2015.02.002
- Kharel P, Fay M, Manasova EV, et al. Stress promotes RNA G-quadruplex folding in human cells. Nat Commun. 2023;14(1):205. doi: 10.1038/s41467-023-35811-x
- Piatkevich KD, Malashkevich VN, Morozova KS, et al. Extended stokes shift in fluorescent proteins: chromophore-protein interactions in a near-infrared TagRFP675 variant. Sci Rep. 2013;3:1847. doi: 10.1038/srep01847
- Cavanagh J. Protein NMR spectroscopy : principles and practice. Amsterdam; Boston, USA: Academic Press; 2007.
- Farjon J, Boisbouvier J, Schanda P, et al. Longitudinal-relaxation-enhanced NMR experiments for the study of nucleic acids in solution. J Am Chem Soc. 2009;131:8571–8577. doi: 10.1021/ja901633y
- Delaglio F, Grzesiek S, Vuister GW, et al. Nmrpipe: a multidimensional spectral processing system based on UNIX pipes. J Biomol NMR. 1995;6(3):277–293. doi: 10.1007/BF00197809
- Lee W, Tonelli M, Markley JL. NMRFAM-SPARKY: enhanced software for biomolecular NMR spectroscopy. Bioinformatics. 2015;31(8):1325–1327. doi: 10.1093/bioinformatics/btu830
- Li Y, Struwe WB, Kukura P. Single molecule mass photometry of nucleic acids. Nucleic Acids Res. 2020;48:e97. doi: 10.1093/nar/gkaa632