
 ?Mathematical formulae have been encoded as MathML and are displayed in this HTML version using MathJax in order to improve their display. Uncheck the box to turn MathJax off. This feature requires Javascript. Click on a formula to zoom.
ABSTRACT
In mammals, RNA editing events involve the conversion of adenosine (A) in inosine (I) by ADAR enzymes or the hydrolytic deamination of cytosine (C) in uracil (U) by the APOBEC family of enzymes, mostly APOBEC1. RNA editing has a plethora of biological functions, and its deregulation has been associated with various human disorders. While the large-scale detection of A-to-I is quite straightforward using the Illumina RNAseq technology, the identification of C-to-U events is a non-trivial task. This difficulty arises from the rarity of such events in eukaryotic genomes and the challenge of distinguishing them from background noise. Direct RNA sequencing by Oxford Nanopore Technology (ONT) permits the direct detection of Us on sequenced RNA reads. Surprisingly, using ONT reads from wild-type (WT) and APOBEC1-knock-out (KO) murine cell lines as well as in vitro synthesized RNA without any modification, we identified a systematic error affecting the accuracy of the Cs call, thereby leading to incorrect identifications of C-to-U events. To overcome this issue in direct RNA reads, here we introduce a novel machine learning strategy based on the isolation Forest (iForest) algorithm in which C-to-U editing events are considered as sequencing anomalies. Using in vitro synthesized and human ONT reads, our model optimizes the signal-to-noise ratio improving the detection of C-to-U editing sites with high accuracy, over 90% in all samples tested. Our results suggest that iForest, known for its rapid implementation and minimal memory requirements, is a promising tool to denoise ONT reads and reliably identify RNA modifications.
Introduction
Epitranscriptome refers to all chemical modifications affecting cellular RNAs, and more than 150 different types have been identified up to now [Citation1]. Non-transient epitranscriptome modifications, also known as RNA editing, occur in primary transcripts by indels (insertions or deletions) or base substitutions [Citation2,Citation3]. In mammals, the most prevalent type of RNA editing involves the conversion of adenosine (A) to inosine (I), carried out by the adenosine deaminase family of enzymes acting on double-stranded RNA (ADARs) [Citation4,Citation5]. To date, millions of A-to-I editing events, primarily located in non-coding and Alu-rich regions, have been identified in humans by deep transcriptome sequencing and ad hoc computational pipelines [Citation6–9].
A second, less frequent, type of RNA editing concerns the hydrolytic deamination of cytidine (C) to uridine (U) in single-stranded RNAs by members of the AID (activation-induced cytidine deaminase)/APOBEC (apolipoprotein B mRNA editing enzyme, catalytic polypeptide) proteins [Citation10,Citation11]. C-to-U editing is rare in mammalian transcriptomes and is mainly linked to the activity of the APOBEC1 enzyme. The only physiologically characterized example of C-to-U editing in humans involves the apolipoprotein B (apoB) transcript in which tissue-specific RNA editing in the small intestine leads to a truncated apoB protein (apoB-48) that is essential for the formation of chylomicron lipoprotein particles and the absorption and transport of dietary lipids [Citation12,Citation13]. Large-scale investigations based on comparative analysis of massive sequence data of murine RNAs from the small intestine and liver from wild-type and APOBEC1-deficient mutants revealed novel C-to-U editing changes mainly located in AU-rich segments of 3’ untranslated regions of mRNA transcripts (3’UTRs), characterized by a common sequence motif [Citation14,Citation15].
Beyond APOBEC1, hundreds of additional C-to-U editing events have been correlated to APOBEC3A expression in human macrophages during M1 polarization and in monocytes in response to hypoxia and interferons [Citation16,Citation17]. Overexpression of APOBEC3A in human HEK293T cells has also revealed C-to-U editing in more than 4200 sites [Citation18].
Deep transcriptome sequencing by short-reads (mostly by Illumina technology) has improved genome-wide identification of C-to-U changes and significantly boosted the number of known events and gene targets [Citation14,Citation16]. Nowadays, the only feasible strategy to accurately decipher the RNA editing repertoire is to compare transcriptomes from two conditions (i.e. wild type and knockout) sequenced by short-reads with adequate transcript coverage and read depth [Citation14,Citation19]. Although the use of knockout lineages allows distinguishing RNA editing changes from intrinsic and base-calling errors (i.e. background noise), knocking out target genes is not always a viable option. As a consequence, deciphering the complete C-to-U editing landscape in mammals using short-reads and without a comparative approach is still a challenging task. Additionally, the error noise of short reads combined with the small number of events per sample (in physiological conditions) as well as the generally low editing level per site hampers a reliable detection of C-to-U changes [Citation18,Citation19].
Recent advances in third-generation sequencing technologies now allow direct RNA sequencing by the Oxford Nanopore Technology (ONT) [Citation20,Citation21]. The passage of RNA molecules through nanometric biological pores generates characteristic ionic currents depending on the chemical composition of the nucleobases [Citation22]. Such currents represented as squiggles are recorded and analysed by a variety of computational algorithms to unveil both the sequence and the different types of RNA modifications, such as N6-methyladenosine (m6A), pseudouridine (Ψ), or inosine [Citation23–27]. Direct sequencing of native RNA molecules offers also the unique opportunity to profile C-to-U RNA editing at the transcriptomic scale and overcome short-reads issues including biases related to the RNA-cDNA conversion and to clonal PCR amplification. Indeed, APOBEC-converted Us at putative RNA editing sites should be easily read and identified after base-calling, allowing discrimination of real C-to-U events from mistaken C-to-T changes due to sequencing errors (or PCR artefacts in case of short reads).
Although the release of novel ONT pores has raised read accuracy to over 90%, the error rate of native ONT reads is still high [Citation28]. The systematic error profile of base calling at the DNA level has recently shown that errors at transitions are significantly more frequent than those at transversions, with C-to-T changes being the second most recurrent base change [Citation28,Citation29]. Since direct RNA reads are generally noisier than DNA reads, a higher error rate is expected as well [Citation27,Citation28].
By using synthetic ONT RNA reads as well as real direct RNA reads from APOBEC1 null mutant mouse cell lines, we provide compelling evidence that ONT RNA reads are affected by a systematic C-to-U base-calling error. This error significantly impairs the accurate identification of genuine editing events.
In order to overcome the intrinsic ONT noise and unveil the APOBEC1 editing signal in direct RNA sequencing experiments, here we present a new machine-learning approach that uses the isolation Forest (iForest) algorithm [Citation30,Citation31] to identify C-to-U editing changes as sequencing anomalies and distinguish them from ONT errors, without requiring the analysis of ionic currents. We use synthetic RNA and real ONT data from human HEK293T cells to show the effectiveness of our new approach and reveal, for the first time, the feasibility of using direct RNA sequencing to detect C-to-U changes. In particular, the iForest algorithm is a practical and efficient model to denoise ONT direct RNA reads and reveal a full range of C-to-U RNA editing events. Additionally, it does not depend on the editing enzyme and is expected to properly work on APOBEC1-dependent as well as non-APOBEC1-dependent sites.
Results
Challenging detection of C-to-U editing sites by short reads
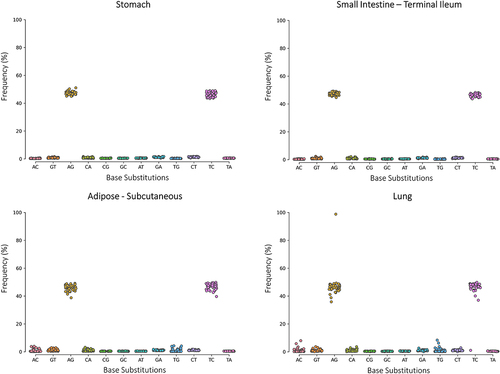
To demonstrate the challenging identification of genuine APOBEC1 C-to-U editing events by short reads, we selected from the GTEx portal four human tissues: small intestine and stomach, expressing APOBEC1 (Supplementary Fig. S1) and adipose subcutaneous and lung with no evidence of APOBEC1 expression (Supplementary Fig. S1). All tissues expressed ADAR (known as ADAR1) and ADARB1 (known as ADAR2) genes for the adenosine deamination (Supplementary Fig. S2). From SRA (GTEx project), we randomly selected and downloaded 50 RNAseq and WGS experiments per tissue. After checking the quality and aligning the reads, we used our REDItools software with strict parameters to call all RNA variants, as previously described [Citation8,Citation32]. All four tissues showed a clear and unambiguous A-to-G signal (and T-to-C on the reverse strand) corresponding to A-to-I RNA editing (). However, the C-to-T signal (and G-to-A on the reverse strand), which included putative C-to-U editing sites, was not evident and indistinguishable from the background error noise in all tissues (). This was true regardless of APOBEC1 expression, suggesting that artifactual C-to-T changes might mask C-to-U modifications and prevent the detection of real editing events ().
Figure 1. Distribution of RNA variants in four GTEx tissues.
Error noise of direct RNA sequencing prevents the call of C-to-U editing
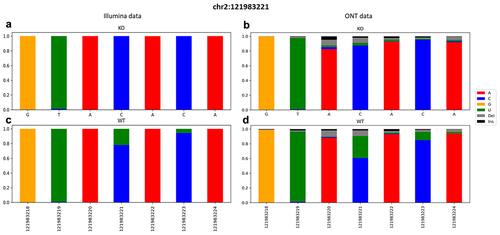
Direct RNA sequencing technology by ONT should enable C-to-U editing detection, as base-calling of raw current signals should easily identify U bases. To prove this statement, we sequenced RNA molecules from a wild-type macrophagic mouse cell line (RAW 264.7) physiologically expressing APOBEC1 (WT) and a derived APOBEC1 knockout cell line (KO) [Citation33]. Raw ionic currents were converted in fastq by guppy (see Materials and Methods for details), aligned onto the reference mouse genome and base changes were called by our REDItools software. Focusing on known editing sites in the 3’UTR of the Beta-2-Microglobulin (B2m) gene () [Citation33], we found unexpected C-to-U signals in KO reads, however, at a lower frequency than in WT reads. This trend was also confirmed by exploring additional editing sites from a previous large-scale transcriptome investigation (data not shown) [Citation14,Citation33]. To exclude a background activity of APOBEC1 in KO cells, we deep sequenced an aliquot of the same WT and KO RNAs by Illumina technology, producing an average of 202,649,982 reads per sample. Short reads were quality checked and aligned to the mouse genome. We detected base changes by using the REDItoolDnaRna.py script of the REDItools package [Citation32] in which KO reads were used in place of genomic reads (generally from WGS or WES experiments). This gave us a simple and unique output table with variants from WT and KO samples. At known editing positions, short reads (with an average coverage of over 150 reads per site) confirmed C-to-U editing only in WT cells and were absent in KO cells at known editing positions. This ruled out any background APOBEC1 activity at those sites and suggested that C-to-U changes in ONT reads were likely due to systematic error noise.
Figure 2. Snapshot of a ±3 region surrounding the known editing site chr2:121983221 of the B2m gene. A graphical representation of the frequencies of aligned bases along with deletions and insertions. Data were retrieved from both KO (on the top) and WT (on the bottom) from Illumina (a, c) and ONT (b, d) runs.
Exploratory data analysis of the ground-truth set of editing sites
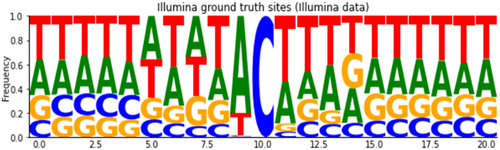
To better characterize ONT systematic errors, we performed an exploratory analysis of base-calling and ionic current features at editing sites detected by Illumina short reads analysis. Traversing the previously generated REDItools table, we retained only positions supported by at least 50 high-quality short reads, showing no base change in the KO sample and displaying a C-to-U editing level of at least 5% in the WT sample. On the whole, we identified 687 bona fide C-to-U editing events (due to APOBEC1 deamination), defined as our ground-truth set of editing sites. Of these, 631 resided in 3’ UTR regions, 17 in intronic long non-coding RNA regions, 12 in coding exonic regions, and the remaining 27 in downstream, intergenic and 5’ UTR regions (see Table S1 in Supplementary material). Considering the 20-nt sequence region around the editing site, we found that the typical sequence motif already identified for APOBEC1 target sites characterized by an enrichment of adenosines or uridines at positions immediately adjacent to the edited cytidine [Citation14]. This analysis confirmed the quality of our ground-truth set of editing sites ().
Figure 3. Average alignment profile of Illumina ‘ground-truth’ sites putatively related to the APOBEC1 enzyme signature (U bases are shown here as T).
Next, we examined the aligned ONT reads of the KO sample at the editing sites detected by Illumina. We found that incorrectly called C-to-U changes were closely correlated with indels or consecutive mismatches. This is similar to what has been observed in the case of other RNA modifications [Citation26,Citation27]. To investigate the inefficient base-calling behaviour at putative C-to-U changes, we extracted for each ground-truth editing site the base quality of the edited U bases and the mean quality and the number of indels and mismatches (excluding C-to-U mismatches at the edited position) for the surrounding ±3 nucleotides, taking into account that the base-calling of ONT RNA reads is performed at the pentamer level [Citation34]. The resulting features were stratified by condition (WT or KO) and analysed. Globally, the base quality of edited Us and the mean quality of surrounding bases were significantly higher in WT than in KO (17.10 ± 8.70 vs 7.51 ± 4.54, p-value MW test: 2.96 × 10–195 and 17.63 ± 5.85 vs 11.97 ± 4.48, p-value MW test: 5.09 × 10–141), while the number of mismatches and indels was significantly increased in KO (Chi2 test p < 0.01, ).
Figure 4. a) Pairplot of the principal component analysis summarizing basecalling features (central U base quality, mean quality, mismatches, insertion and deletion count) extracted from Illumina ‘ground-truth’ sites of WT (blue) and KO (orange) CU-context reads. The first three components explain more than 80% of the total variance of the data. b) Pairplot describing CU context reads retrieved from Illumina ‘ground-truth’ sites of both WT (blue dots) and KO (orange dots) ONT runs. A total of five features are shown: T_qual is the quality of the uridine central base; mean_qual is the average quality of bases on an interval of ±3 nucleotides; mism_count is the number of mismatches with respect to the reference expected bases on the same interval; ins_count and del_count are the total numbers of insertions and deletions within the interval, respectively.
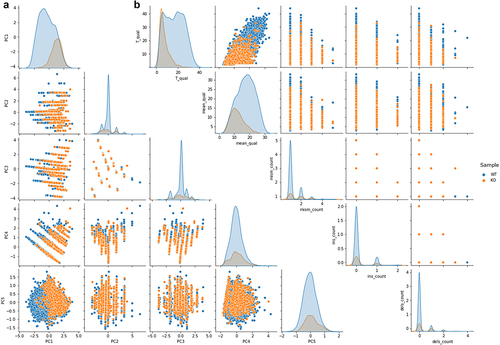
As depicted in the pairplot of , base-calling features of C-to-U mismatches showed a slight overlap between WT and KO positions, also confirmed by a linear and non-linear dimensionality reduction analysis through the PCA and t-SNE, respectively (). PC1 and PC5 components of the PCA analysis clearly showed that C-to-U changes of the KO sample were in overlap with a small subset of the same base change of the WT sample ().
Figure 5. Dimensionality reduction by t-SNE of basecalling features (central U base quality, mean quality, mismatches, insertion and deletion count) extracted from Illumina ‘ground-truth’ sites of WT (blue) and KO (orange) CU-context reads.
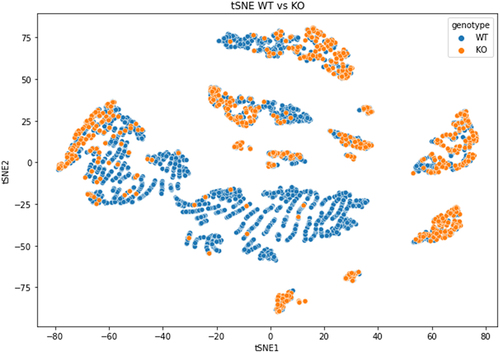
Several clusters with overlapping C-to-U changes appeared in the t-SNE graph, suggesting two different C-to-U populations. The first one from the WT sample, with real C-to-U editing events, and the second one from both WT and KO samples containing mistaken C-to-U changes ().
The origin of the small t-SNE clusters could not be ascertained, but it was not due to the presence of specific C-containing pentamers (as shown in Supplementary Fig. S3).
In parallel, we investigated the ionic currents at editing sites of the ground-truth set after resquiggling the raw signals by means of Tombo [Citation35] and Nanopolish eventalign [Citation36] (through the fast f5c implementation) [Citation37]. Currents of pentamers including the edited U base resulted quite divergent from those containing the unedited C base in the WT sample. In contrast, currents at putative edited U bases of the KO sample appeared much closer to those from unedited C bases, a trend already observed for base-calling features. As an example, we report here the analysis of ionic currents for the well-known editing site chr2:121983221 located on the 3’ UTR of the B2m gene in mice [Citation33]. In the WT sample, 153 out of 366 reads supported the C-to-U editing at position chr2:121983221; however, in the KO sample, only 19 out of 346 reads showed putative C-to-U changes at the same site. The currents around the chr2:121983221 site per sample were plotted as kernel density estimates histograms. In the WT sample, we found that current distributions for pentamers carrying the edited U base were shifted from those of unedited pentamers (). However, in the KO sample, the current distributions for putative edited and unedited pentamers overlapped ().
Figure 6. Analysis of the ionic current features for the site chr2:121983221 residing in the 3’UTR of the mouse B2m gene locus. (a) and (b) are shown the distributions of C and U currents for WT and KO samples, respectively. (c) is reported the distribution of U currents only from WT and KO samples, while (d) is depicted the same distribution for C currents only. PCA of current features (intervals of ±2 nucleotides) for WT and KO samples are shown in (e) and (f), respectively. Each dot in PCA graphs represents an aligned C (blue) or a U (red).
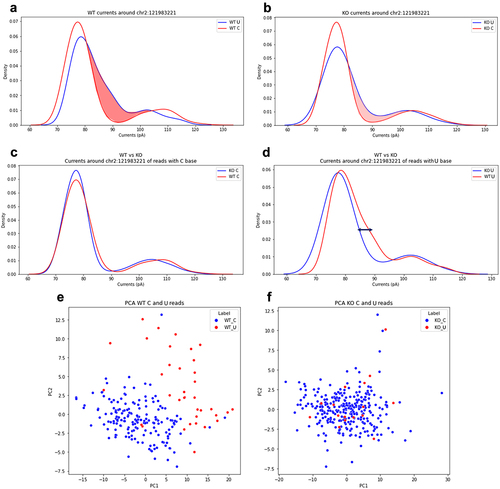
Interestingly, current distributions of pentamers with unedited bases were almost identical in both WT and KO samples (). However, currents from pentamers carrying the U base diverged (). This suggested that KO currents of putative C-to-U editing were likely artifactual. The analysis of current intensities at the per read level as well as the PCA also confirmed this trend. We found that currents from edited pentamers at the position chr2:121983221 in the WT sample clustered differently from currents of unedited pentamers at the same position, suggesting a clear RNA editing signal (). In contrast, currents of unedited and putatively edited pentamers in the KO sample did not show any remarkable difference ().
Taken together, our exploratory analysis of base-calling and ionic current features in direct ONT RNA reads at established editing sites revealed a clear systematic error during the ONT base-calling process. This error subsequently impacts the reliability of C-to-U RNA editing events (Supplementary Figs. S4 and S5).
C-to-U ONT error is systematic
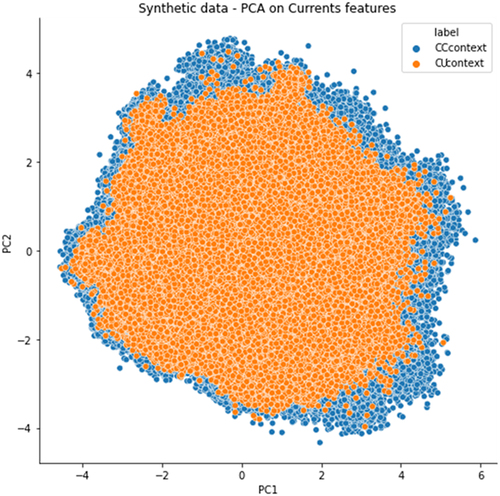
Alterations of ionic currents and base-calling features are generally linked to RNA modifications. In C-to-U RNA editing (a non-transient modification), C deamination involves only canonical nucleotides (Cs and Us) that should be easily detectable through conventional base-calling. Our results, based on the comparison of ONT reads from a real WT and KO sample at known editing sites, indicate an ONT-specific systematic error during the base-calling of Cs with the guppy basecaller. To verify if this type of error was affecting the entire dataset or was limited to selected RNA editing positions, we analysed ONT RNA reads from two biological replicates of four in-vitro transcribed synthetic constructs (about 10kb in total) in which no editing or chemical modifications were present. These synthetic sequences (equal in length), taken from Liu et al. 2019 [Citation26], are designed to include all possible pentamers and to minimize RNA secondary structures through the curlcake software and were sequenced on an R9.4.1 flow cell. Remarkably, we found C-to-U mismatches at positions in which only Cs were expected, proving the presence of a systematic error during the base calling of Cs. In the first replicate (synt1), run on a MinION instrument, 98% of the 2521 reference Cs showed evidence of C-to-U mismatches with an average 0.025 ± 0.036 C-to-U mismatches per site and a maximum of 0.416. In the second replicate (synt2), run on a GridION instrument, the same percentage of Cs was affected by the C-to-U mismatch with average 0.024 ± 0.035 mismatches per site and a maximum of 0.409. These mistaken C-to-U changes showed a significantly reduced base quality at U bases and in the surrounding regions (±3 nt) (Mann-Whitney Pvalue < 0.01) as well as an increased proportion of indels than the unchanged bases containing the C (Chi2 p-value <0.01). Additionally, ionic currents of pentamers carrying the miscalled U were in complete overlap with those from pentamers with the correct C base (), meaning that current patterns of mistaken C-to-U changes were not distinguishable from the patterns of the real bases.
Figure 7. PCA analysis of ionic current features extracted from synthetic constructs dataset. Each dot in PCA graphs represents an aligned C (blue) or a U (orange).
Machine learning models to polish mistaken C-to-U modifications in ONT sequencing
In the last few years, several machine learning approaches have been applied to reliably detect RNA modifications in ONT direct RNA reads. Most models are based on Support Vector Machine (SVM) or Convolutional Neural Network (CNN) algorithms trained on synthetic data sets. Since we are interested in reducing the noise due to wrongly attributed Us to reveal genuine editing events, currently available tools for investigating RNA modifications are not suitable. Therefore, we implemented a novel CNN algorithm based on ionic currents and dwell times collected at specific sites containing only Cs or Us without any C-to-U alterations. This approach was used to train a model to predict the most likely nucleotide at C to U mismatches. For each synthetic and real dataset, 300k observations (ionic currents supporting only Cs or Us) were extracted and divided into training, validation and test sets. The performance of each set was evaluated in terms of global accuracy, precision, recall and F1 score (see Methods). Overall, the metric values exhibited a high degree of similarity, averaging around 0.80 (Supplementary Fig. S6). The training step required about 190 epochs, with a mean time of 186 s/epoch, and took approximately 10 hours for each experiment.
Subsequently, the CNN model was exclusively employed on sites displaying C-to-U mismatches within an independent intra-sample dataset that included synthetic and real data (WT and KO). This evaluation aimed to assess the algorithm’s performance in reducing C-to-U noise. On the synthetic sample synt2, 93% of mistaken C-to-U changes were removed and mismatches per site (frequency of Us per site) dropped down from 0.0224 ± 0.033 to 0.0029 ± 0.007. When the CNN model was used on the ground-truth set of editing sites, global accuracy and precision raised from 0.59 and 0.55, measured on the native uncorrected dataset, to 0.63 and 0.82, calculated after the correction. In addition, the C-to-U editing levels decreased from 0.035 ± 0.035 to 0.0035 ± 0.0096 in the KO sample and from 0.124 ± 0.083 to 0.022 ± 0.0292 in the WT sample. In general, the number of putative editing sites was reduced by about 68% in the WT sample and 92% in the KO sample. Although the CNN model worked as expected, with the great benefit to be trained on subsamples of input data (requiring only currents from Cs and Us), its behaviour appeared too aggressive. This was likely due to the reduced number of real editing sites for the training procedure, along with the minimal differences in current levels when compared to the high levels of noise (Supplementary Figs S4 and S5). Indeed, when we compared the editing levels calculated by the Illumina platforms with those corrected by the CNN model, we found a decreased correlation (Spearman) from 0.74 (p-value: 1.61e-61) to 0.49 (p-value:5.55e-22). Furthermore, the CNN model also discarded most of the known editing sites in the WT sample. Starting from the observation that altered base-calling features are associated with mistaken C-to-U changes, we explored alternative models that are easy to implement, train and apply, while also computationally less intensive. Since C-to-U editing changes are rare events, they can be considered as sequencing anomalies and can be modelled through the isolation forest (iForest). This approach has been successfully employed in several anomaly detection applications but has never been applied to ONT sequencing data. iForest identifies anomalies by isolating them from the dataset, without the need to build a model of normal instances. Moreover, this algorithm is very fast and demands minimal memory resources [Citation30,Citation31]. Indeed, the training of the final iForest model took only 10 seconds (on a 32 CPUs computer cluster), while the prediction of ~70k training instances was completed in about 5 seconds.
To initially test the suitability of the iForest model, we extracted base-calling features from the synthetic dataset synt1 taking into account only C-to-U mismatches. For each position, we included quality of the U, mean quality of the surrounding nucleotides, mismatches and indels. These features were encoded for the iForest model and used in the training process (see Methods for further details about encoding strategies). When the model was applied to the synthetic dataset synt2, it reached an overall accuracy of 0.95 suggesting a great efficiency of the algorithm in mitigating the false-positive rate and reducing the C-to-U noise ().
Figure 8. iForest model for the training, validation, testing, and prediction of C-to-U editing events at the “per-read” level and then, after the aggregation step on the “genome-space” level. On the top, the workflow used for the training of the model, starting from encoded base-calling features. On the bottom, schematization of the encoding strategy used to compress base-calling feature information that is provided to the model.
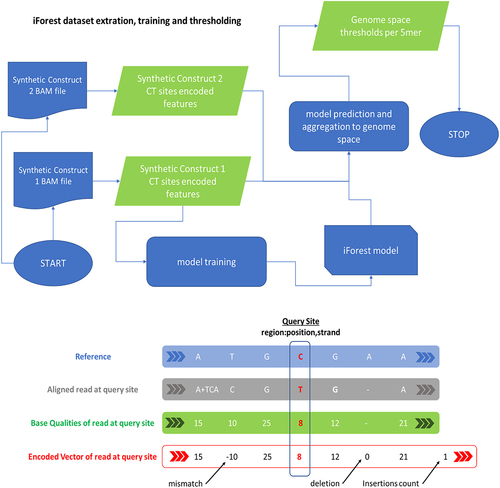
The iForest works only on C-to-U changes and classifies Us at each C position as mistaken or real. This polishing behaviour is independent of the downstream calling of editing events. Indeed, our strategy is based on the removal of false Us affecting the identification of genuine RNA editing sites. For testing purposes, and when not expressly indicated, we assumed as edited a site if supported by at least 50 reads (of which at least two Us) and showing a minimum editing level of 0.01.
When the iForest model was applied to the ground-truth set of editing sites in both WT and KO samples, the global accuracy and precision raised from 0.69 and 0.62, measured on the uncorrected dataset, to 0.88 and 0.95, calculated after the correction, while the specificity increased from 0.40 to 0.96. Additionally, the correlation (Spearman) between Illumina measured editing levels and the corresponding ONT corrected values increased from 0.749 (p-value = 2.57e-67) to 0.824 (p-value = 2.10e-92), while 60% of the ground-truth set of sites in the KO sample were misclassified as edited, after the correction only 4% of them were miscalled.
iForest to detect C-to-U editing in human direct RNA reads
Although the efficiency and superior performance of iForest over CNN, we noticed that the behaviour of the iForest model changed by its contamination parameter, defined as the expected proportion of anomalous instances. Our model was trained on in vitro synthesized data without editing events and, thus, no anomalies were present. To correctly set the contamination value, we retrained the iForest model using sites from synthetic RNA (synt1) as well as real editing sites from the mouse ground-truth set. The novel updated model, iForest+, was initially applied to the synthetic dataset synt2 and to a completely novel dataset from human HEK293T cells. In the dataset obtained from synthetic RNA, iForest+ reached an overall accuracy close to 1 with only two mistaken C-to-U changes. In humans, we tested the iForest+ model on direct RNA reads from wild-type HEK293T cells (WThek) and from cells expressing APOBEC1 and RBM47 (OVhek). Two replicates were prepared for the WThek sample, while four replicates were prepared for the OVhek sample. In both cases, ONT reads were basecalled by guppy, and resulting fastq sequences were aligned onto the hg38 assembly of the human genome by minimap2. In parallel, total RNA from both samples was deep sequenced by an Illumina platform to create a human ground-truth set of editing sites comparing RNA variants obtained by REDItools. We selected only sites supported by at least 50 reads, not showing mismatches in the WThek sample and displaying C-to-U changes in the OVhek sample (with a minimum level of at least 0.05). On the whole, we obtained 17,066 bona fide C-to-U sites. Of these 12,471 resided in 3’UTRs, 3940 in coding exons and the remaining in non-coding regions (ncRNAs, intronic and intergenic regions). Considering the 20-nt sequence region around the editing site, we found that editing events resided in AU-rich regions, which are typical for APOBEC1 editing and already identified in the mouse ground-truth set of editing sites (Supplementary Fig.7).
The denoising capabilities of the iForest+ algorithm were assessed using ONT reads from both sample groups. The model’s performances were calculated against the human ground-truth set of editing sites. Remarkably, we obtained an accuracy of 0.95 and a specificity of 0.99. The precision improved from 0.60, which was calculated using the iForest model trained solely on the synt1 sample, to 0.82 determined by the iForest+. This indicates the remarkable efficiency of our model in reducing C-to-U error noise, making it easier to identify authentic RNA editing sites.
To further demonstrate the capabilities of our iForest+ model, we applied the algorithm to each group of samples independently. After correction, only C-to-U variants covered by at least 50 reads and showing a variation level of 0.04 (at least 2 Us) were retained.
In the parental cell line, comprising a mean of 1,765,249 RNA reads per sample, we obtained 1553 C-to-U corrected variants (out of 1,489,215 uncorrected sites) supported by both replicates. Of these, 943 sites were classified as SNPs. Comparing bases surrounding the remaining positions with the human APOBEC1 sequence motif, we found that 35 out of 610 sites showed RNA editing evidence, and 30 of them appeared edited in at least two of the Illumina sequenced samples overexpressing APOBEC1, possibly due to background editing activity of endogenous APOBECs. Nonetheless, the iForest+ correction dramatically removed most of the erroneous C-to-U variants.
In the OVhek cell lines, including a mean of 425,898 reads per sample, we obtained 657 C-to-U corrected variants. Despite the reduced coverage per site due to the low number of reads per sample, after the removal of known SNPs, we obtained 335 putative C-to-U RNA editing sites. Of these, 249 (74%) appeared edited in Illumina samples and 121 of them showed a sequence motif compliant with the human APOBEC1 sequence motif, proving that the denoising approach through our iForest model improves identification of RNA editing events.
Discussion
Deep transcriptome sequencing by short reads has remarkably improved detection of RNA editing events in eukaryotic genomes [Citation9,Citation38,Citation39]. In humans, short reads have revealed the pervasive nature of RNA editing with more than 15 million events distributed across 55 different body sites [Citation7]. Despite these findings, RNA editing profiling at the genome scale is still challenging. Physiologically rare but biologically relevant events such as C-to-U deamination by APOBEC enzymes are difficult to identify by short reads because masked by the background error noise [Citation19]. In this context, direct RNA sequencing by ONT, the de facto sequencing strategy to unveil RNA modifications, should easily detect C-to-U events just through the conventional base-calling because Us and Cs are canonical RNA bases and basecaller programs like guppy implement specific machine learning models to convert raw RNA signals (ionic currents in fast5 format) to fastq sequences.
Analyzing mouse direct RNA reads from APOBEC1 knockout RAW 264.7 cells, we found many wrongly attributed Us at C positions, occurring at both known editing sites and other sites indicating an ONT systematic error. This was confirmed also on sequencing data generated from in vitro synthesized RNA devoid of RNA modifications. Interestingly, an in-depth characterization of base-calling and ionic current features at known editing sites revealed biases associated with mistaken Us.
To overcome this issue and enable detection of real C-to-U editing events in direct RNA reads, we have developed a novel computational strategy based on the iForest algorithm [Citation30,Citation31] in which C-to-U editing sites are treated as sequencing anomalies. Our model uses base-called features only, comprising the quality of the Us and the mean quality of the surrounding nucleotides. Since raw current signals are not required because the parsing of fast5 files is avoided, the iForest is easy-to-train and fast. It works on aligned reads from fastq converted reads and distinguishes corrected from erroneous Us at each C position. We used Illumina short reads to find known editing sites (so-called ground-truth sets). Comparing wild type and APOBEC1 knockout mouse cells or wild type and APOBEC1 overexpressing human HEK293T cells, we have proven that the iForest is an efficient algorithm to mitigate C-to-U error noise and unveil authentic RNA editing sites.
Since C-to-U deamination involves canonical bases, existing computational tools based on SVM or CNN models for detecting chemical RNA modifications are not applicable in this context. Conversely, bioinformatics pipelines that do not rely on machine learning models and complex training procedures but depend on the direct comparison between modified and unmodified sequences, are susceptible to the influence of systematic errors. Our iForest model overcomes the limitations of existing tools in dealing with C-to-U editing.
Interestingly, once the error correction has been performed by iForest, our methodology allows RNA editing profiling at a single read level.
Although accuracy of the RNA editing identification process depends on the denoising step that, in turn, is related to the training of the model, false positives could originate from other error sources. The quality of the input RNA, the sequencing process, and the choice of base-calling methods are just a few examples of factors that should be considered. The alignment strategy on the reference genome (or transcriptome) and the aligner itself are additional factors to consider for minimizing erroneous editing detections.
Given the low complexity of iForest and the simplicity of its training and updating, we think that it might represent a promising and flexible model to denoise direct RNA reads and improve the quality and accuracy of the variant calling. Since it does not require currents or dwell times, it could also be applied to reads generated by other sequencing platforms, thus enhancing downstream analyses. Nevertheless, a significant innovation introduced by this proposed method is its ability to easily detect C-to-U events using ONT long-read technology. This technology integrally retains positional data across the entire original transcript and this information could also be combined with other types of epitranscriptomic modifications that are potentially detectable using this sequencing technology.
Materials and methods
Cell lines, library preparation and sequencing
Total RNA from WT and APOBEC1 KO cell line RAW 264.7, a murine macrophage cell line, was supplied by the Papavasiliou lab (at the German Cancer Research Centre, Heidelberg, Germany) and prepared as described in Lerner et al. [Citation33].
For the Nanopore libraries, the ONT SQK-RNA001 kit was used for Direct RNA library preparation, starting from 200 ng of input polyA + RNA and following ONT instructions. The libraries were then sequenced on a MinION instrument using R9.4 flow cells with the relevant MinKNOW script (v. 3.1.19) to generate fast5 files.
The Illumina libraries were prepared from 500 ng of total RNA, using Illumina’s TruSeq Stranded Total RNA Sample Preparation Kit (Illumina, San Diego, CA, USA), according to the manufacturer’s protocol. The cDNA libraries were then checked on the Bioanalyzer 2100 and quantified by fluorimetry using the Quant-iTTM PicoGreen® dsDNA Assay Kit (Thermo Fisher Scientific) on NanoDrop™ 3300 Fluorospectrometer (Thermo Fisher Scientific). Sequencing was performed on a NextSeq 500 platform using the paired-end approach (2 × 75 bp) with 180–232 million reads per sample.
HEK293T (Human Embryonic Kidney) cells were maintained in DMEM supplemented with 10% FBS, 2 mM Glutamine and 1 mM penicillin/streptomycin in 5% CO2 at 37°C.
In order to create inducible APOBEC1 and RBM47 expressing cell lines, we employed Tet-inducible APOBEC1 and RBM47 lentiviral expression vectors in HEK-T cell lines expressing rTTA3. The APOBEC1 expression construct bores an EGFP coding sequence downstream the APOBEC1 one, connected through an IRES element. Cells were transduced sequentially with the lentiviral constructs and sorted after induction of the EGFP to obtain single clones. hAPOBEC1 expression was induced by doxycycline (2 ug/ml doxycycline for 48 hours [Sigma-Aldrich #D9891]). Two days post-induction the cells were collected and the RNA was extracted to verify induction (Suplementary Table S2).
The RNA was extracted using the Directzol RNA miniprep kit (Zymo Research), and RNA integrity was assessed by utilizing the Agilent 2100 Bioanalyzer RNA Nano assay (Agilent Technologies, Santa Clara, CA, USA). Following quality and integrity verification, 1 µg of total RNA was used for library preparation with the “TruSeq Stranded Total RNA-Zero Gold” (Illumina, San Diego, CA, USA). The final step involved sequencing the libraries on an Illumina NextSeq 550 with the Nextseq 550 high-throughput kit (v2) (IGA Technology Services, Italy; www.igatechnology.com).
For direct RNA sequencing, RNA samples were processed into libraries using the ONT SQK-RNA002 kit, following the protocols provided by the manufacturer. Each library was subsequently loaded onto an individual R9.4.1 flow cell, and the sequencing runs were carried out using the ONT MinKNOW software (v3.4.12) to monitor and generate the data. The sequencing runs were terminated after 72 hours, and the resulting data was saved in FAST5 format.
Illumina “ground-truth” sets of editing sites
Raw Illumina RNAseq data were quality-checked via FastQC [Citation40] and trimmed to remove adapters by means of fastp [Citation41]. Cleaned reads were aligned to the mm39 or hg38 reference genomes using the ultrafast STAR mapper [Citation42]. Next, aligned reads were deduplicated with Picard, and BAM files were sorted and indexed by SAMtools [Citation43]. The REDItoolDnaRna.py script from the REDItools [Citation32] package was used to detect RNA variants. Reads from murine APOBEC1 KO samples or from human samples overexpressing APOBEC1 were used in place of genomic reads (generally from WGS or WES experiments) to obtain unique and easy-to-traverse output tables. Only positions supported by at least 50 high-quality short reads, displaying a C-to-U editing level of at least 5% in the WT samples and showing no base change in the murine APOBEC1 KO sample or in the human samples overexpressing APOBEC1 were included in the ground-truth sets for downstream analyses. Both mouse and human sets were annotated using ANNOVAR [Citation44].
To identify the APOBEC1 sequence binding motif, consensus sequences at ground-truth sets of editing were retrieved and a 51 nt-long sequence was extracted per each site to calculate base frequencies. In parallel, the same steps were performed on a random set of non-edited sites. The resulting two 4 × 51 frequency matrices were used to compute log-likelihood ratio tests on real data. These tests were performed under the H0 hypothesis that the query site does not resemble the APOBEC1 signature. A chi2 test was performed on the log-likelihood ratio values to assess the significance. Only sites with a p-value <0.01 were selected.
In vitro synthesized RNA sequencing data
Artificial constructs were generated by Liu et al. [Citation26] and sequencing data downloaded in the fast5 format from SRA using the following acciession numbers: SRS4184285 for the synthetic curlcake 1 (sequenced on a MinION instrument) (synt1) and SRS4184287 for the synthetic curlcake 2 (sequenced on a GridION instrument) (synt2). All sequences in a given dataset are equal in length.
Processing of ONT reads
Raw fast5 files from ONT direct-RNA sequencing runs were base-called by Guppy (version 5.0.11) (guppy_basecaller -c rna_r9.4.1_70bps_hac.cfg -i [FAST5_Dir] -s [Save_Path] -r – fast5_out -x ‘cuda:0’) and reads passing the quality control step were merged into a unique fastq file before the mapping. For synthetic data, the reference fasta file was downloaded from the GitHub repository of the curlcake sequences through the public URL https://github.com/novoalab/EpiNano/blob/master/Reference_sequences/cc.fasta. For mouse and human data, the mm19 and hg38 genome assemblies were used, respectively. All high-quality reads were mapped onto the corresponding reference by minimap2 using the options -ax splice -uf -k14 –secondary=no. In the exploratory data analysis, instead, minimap2 was set with -ax map-ont flag. Unmapped reads were filtered out by SAMtools [Citation43]. Custom scripts for downstream analyses are available as Jupiter notebooks (see below).
The current resquiggle was performed by Tombo [Citation35] (version 1.5.1) according to the software documentation. The signal data were aligned to the reference by nanopolish eventalign through the fast f5c [Citation37] (version 0.7) implementation following the software documentation. After the indexing of fast5 and fastq files, the eventalign command was launched with the following parameters: –rna – scale-events – print-read-names – samples –signal-index to produce eventalign tables containing aligned events to reference k-mers. Output tables were parsed by the custom Python script eventalign_splitter.py to recover the mean values of the current intensities and the dwell times. Further custom scripts were created to analyse collected data and are available as jupyter notebooks (see below).
Basecalling features and the iForest model
Base-calling features for the iForest model were extracted from BAM files by Python custom scripts making use of the Pysam (v. 0.18) module. Aligned reads were traversed individually and every time a C-to-U mismatch or a C-to-C and T-to-T (U) match was encountered, base qualities as well as mismatches and indels in the surrounding interval of ±3 bases were collected and encoded using a custom vectorization strategy (consisting of an 8-long vector), as shown in . Only reads in multi-alignments with a depth higher than 50 were used.
Base-calling features at C-to-U mismatches in the synthetic dataset synt1 were treated as background errors and employed to train the iForest model. The training, validation and testing of the iForest models were performed using Python3 and the scikit-learn package by the use of the sklearn.ensemble.IsolationForest class working with the maximum number of available threads (32 for our machine setup, see ‘Basecalling features and the CNN model’ for further information about hardware configuration). The trained iForest model was applied to the synthetic dataset synt2 to detect mistaken C-to-U mismatches. Multiple alignments of uncorrected (native ONT data) and corrected reads were finally traversed position by position to retrieve the frequency of C-to-U mismatches per site. A study of the residual error after the iForest correction was also performed, and the 99th percentile of C-to-U frequencies was selected as the minimum cut-off to classify a site as edited (or, in general, not related to base-calling errors). For the final iForest+ model, basecalling features were further reduced, retaining only the quality of the central base and the average quality. Thus, all the intervals with indels and/or mismatches were discarded and classified as ‘errors’. The iForest+ model was trained on basecalling features extracted from the synt1 dataset in combination with features from known editing sites (the Illumina ground-truth sites) supported by murine reads of both WT and KO samples. This mixed training dataset enabled the fine-tuning of the contamination hyperparameter of the iForest+. Genomic positions with a C-to-U substitution rate above the 0.01 after correction were considered as edited. All the performances and metrics were calculated using the following formulas and computed via the scikit-learn package:
where TP: True Positives, TN: True Negatives, FP: False Positives and FN: False Negatives.
Basecalling features and the CNN model
Currents and dwell time features of reads mapping on T or C bases (G for the reverse strand) of the reference were extracted from the output of the eventalign program (through the f5c implementation) to train the CNNs models by means of custom scripts. Only positions with a coverage higher than 50 were taken into account. For each T or C base, currents and dwell times were collected in an interval of seven surrounding bases and encoded as a 1-d vector (including contig/position/read-name).
Three tables containing currents and dwell times for known reference context of interest (TU, CC and CU contexts) were obtained and used to train the model in an intra-experiment fashion and make predictions on CU context reads. As shown in Supplementary Fig. S6, CC and TU context reads related currents features were encoded in a bivariate time-series where the 1st dimension was composed of mean current intensities and the 2nd dimension of dwell times. These bivariate time series were used to train the CNN model, which was implemented as a Python instance of the sequential model class of the open-source Keras deep-learning library. CNNs were designed by the use of a simplified version of the CNN wavenet architecture with a total of 13,597 parameters (13407 trainable) with the following schematic layer composition:
To avoid overfitting 4 batch normalization layers were interposed to 1D-convolutional and dense layers. In addition, two max pooling layers with a pool-size of 2 were used to scale-back the complexity of the signal throughout the network. A final dropout layer of 0.2 was used after the last batch normalization layer and before propagating the signal to the SoftMax activation output layer. In addition, the whole dataset of CC and TU context reads was split into a training set (300k observations), a validation set used to monitor loss and accuracy metrics over epochs and to stop iterations, and an independent test set. The maximum number of epochs was set to 1000, the batch size to 1024 observations for each backpropagation step, the loss function was the ‘categorical cross entropy’ and the Adam optimizer with a learning rate of 0.08 was used. Training procedures were stopped by the use of an early-stopping strategy with a patience of 100 epochs and a minimum delta of 0.01 on the selected monitored metric (validation accuracy). The best model of the training phase was selected based on the maximum value reached on the validation monitored metric. Evaluation of the best selected model was then performed on the whole training and validation dataset and on the independent test sets composed of TU and CC context reads. Eventually, CU context reads current features were thus classified as ‘C’ or ‘U’ by the use of the trained CNN of the same run, and a probability for the CU context reads to have a C or U central base is retrieved and saved. Analogously to what performed for basecalling features, per-read predictions were aggregated to genome-space level, and computations of CU frequencies for each C site with sufficient coverage were performed before and after the algorithm correction. Also in this case, in order to call a site as edited after the model correction, a study of CU frequency residual errors was done on synthetic curlcake runs, choosing the 95th percentile (about 0.01) of residual errors as basal threshold and selecting a custom cut-off value for each 5-mer in curlcake data with a residual frequency above the basal value. If a site, after the correction, still shows a CU substitution frequency above the custom threshold, then it is probably a site where CU substitutions are not due to basecaller-mapper background noise but to other biological phenomena (i.e. C-to-U editing or genomic variations like SNPs). All computations were performed on a computer cluster equipped with 32 CPUs, 272 GB of RAM and several GPU NVIDIA A100 GPUs (each one with 40 GB of RAM).
Filtering of reliable C-to-U sites
After the application of iForest and CNN models, reliable C-to-U sites, associated with the putative APOBEC1 signature (calculated by Illumina data), were filtered to remove known SNPs and m5C sites. Known mouse and human SNPs were downloaded from UCSC using the following links https://hgdownload.soe.ucsc.edu/goldenPath/mm10/database/snp142.txt.gz, https://hgdownload.soe.ucsc.edu/goldenPath/hg38/database/snp151.txt.gz, respectively. Known m5C positions, instead, were downloaded from the m5C-Atlas database [Citation45] https://www.xjtlu.edu.cn/biologicalsciences/m5c-atlas.
Supplementary Table1.pdf
Download PDF (695.8 KB)Supplementary Table2.pdf
Download PDF (56.8 KB)Supplementary Table captions.docx
Download MS Word (12.3 KB)Supplementary Figures.docx
Download MS Word (1.2 MB)Supplementary Figure Captions.docx
Download MS Word (14.7 KB)Acknowledgments
We thank the Papavasiliou lab at the German Cancer Research Centre, Heidelberg, Germany, for supplying total RNA from WT and APOBEC1 KO cell line RAW 264.7.
The Genotype-Tissue Expression (GTEx) Project was supported by the Common Fund of the Office of the Director of the National Institutes of Health, and by NCI, NHGRI, NHLBI, NIDA, NIMH, and NINDS. Illumina data used for the analyses described in this manuscript were obtained from dbGaP accession number phs000424.
Authors are also grateful to the following National Research Centers: “High Performance Computing, Big Data and Quantum Computing” (Project no. CN_00000013) and “Gene Therapy and Drugs based on RNA Technology” (Project no. CN_00000041); and Extended Partnerships: MNESYS (Project no. PE_0000006) and Age-It (Project no. PE_00000015). This work was also supported by ELIXIR-IT thorugh the empowering project ELIXIRNextGenIT (Grant Code IR0000010) .
Finally, we warmly thank Dr Sharon N. Cox for improving the readability of the manuscript.
Disclosure statement
No potential conflict of interest was reported by the author(s).
Data availability statement
Illumina and Nanopore raw reads from mouse cells have been submitted to the SRA database under the BioProject PRJNA949094. Illumina and Nanopore raw reads from human cells, instead, are available under the accession PRJNA1050198. The Python code implementing the above described methodology, as well as the accessory jupyter notebooks used for data analysis, are available at the GitHub repository: https://github.com/F0nz0/C_to_U_classifier
Supplementary material
Supplemental data for this article can be accessed online at https://doi.org/10.1080/15476286.2023.2290843.
Additional information
Funding
Notes on contributors
Adriano Fonzino
A.F. and E.P. conceived the study. A.F. performed computational analyses and developed ML models. C.M., P.S., U.M. and S.T. carried out Illumina and Nanopore sequencing. A.F. and E.P. wrote the manuscript draft. S.C., E.P. and G.P. contributed to the interpretation of the data and manuscript revision. All authors read and approved the final manuscript.
References
- Boccaletto P, Stefaniak F, Ray A, et al. MODOMICS: a database of RNA modification pathways. 2021 update. Nucleic Acids Res. 2022;50(D1):D231–5. doi: 10.1093/nar/gkab1083
- Gott JM, Emeson RB. Functions and mechanisms of RNA editing. Ann Rev Genet. 2000;34(1):499–531. doi: 10.1146/annurev.genet.34.1.499
- Christofi T, Zaravinos A. RNA editing in the forefront of epitranscriptomics and human health. J Transl Med. 2019;17(1):319. doi: 10.1186/s12967-019-2071-4
- Eisenberg E, Levanon EY. A-to-I RNA editing—immune protector and transcriptome diversifier. Nat Rev Genet. 2018;19(8):473–490. doi: 10.1038/s41576-018-0006-1
- Nishikura K. A-to-I editing of coding and non-coding RNAs by ADARs. Nat Rev Mol Cell Biol. 2016;17(2):83–96. doi: 10.1038/nrm.2015.4
- Picardi E, D’Erchia AM, Lo Giudice C, et al. Rediportal: a comprehensive database of A-to-I RNA editing events in humans. Nucleic Acids Res. 2016;45(D1):D750–D757. doi: 10.1093/nar/gkw767
- Mansi L, Tangaro MA, Lo Giudice C, et al. Rediportal: millions of novel A-to-I RNA editing events from thousands of RNAseq experiments. Nucleic Acids Res. 2021;49(D1):D1012–9. doi: 10.1093/nar/gkaa916
- Lo Giudice C, Tangaro MA, Pesole G, et al. Investigating RNA editing in deep transcriptome datasets with REDItools and REDIportal. Nat Protoc. 2020;15(3):1098–1131. doi: 10.1038/s41596-019-0279-7
- Gabay O, Shoshan Y, Kopel E, et al. Landscape of adenosine-to-inosine RNA recoding across human tissues. Nat Commun. 2022;13(1):1184. doi: 10.1038/s41467-022-28841-4
- Lerner T, Papavasiliou FN, Pecori R. RNA editors, cofactors, and mRNA targets: an overview of the C-to-U RNA editing machinery and its implication in human disease. Genes. 2018;10(1):10. doi: 10.3390/genes10010013
- Pecori R, Di Giorgio S, Paulo Lorenzo J, et al. Functions and consequences of AID/APOBEC-mediated DNA and RNA deamination. Nat Rev Genet. 2022;23(8):505–518. doi: 10.1038/s41576-022-00459-8
- Teng B, Burant CF, Davidson NO. Molecular cloning of an apolipoprotein B messenger RNA editing protein. Science. 1993;260(5115):1816–1819. doi: 10.1126/science.8511591
- Navaratnam N, Morrison JR, Bhattacharya S, et al. The p27 catalytic subunit of the apolipoprotein B mRNA editing enzyme is a cytidine deaminase. J Biol Chem. 1993;268(28):20709–20712. doi: 10.1016/S0021-9258(19)36836-X
- Rosenberg BR, Hamilton CE, Mwangi MM, et al. Transcriptome-wide sequencing reveals numerous APOBEC1 mRNA-editing targets in transcript 3′ UTRs. Nat Struct Mol Biol. 2011;18(2):230–236. doi: 10.1038/nsmb.1975
- Blanc V, Park E, Schaefer S, et al. Genome-wide identification and functional analysis of apobec-1-mediated C-to-U RNA editing in mouse small intestine and liver. Genome Bio. 2014;15(6):R79. doi: 10.1186/gb-2014-15-6-r79
- Sharma S, Patnaik SK, Thomas Taggart R, et al. APOBEC3A cytidine deaminase induces RNA editing in monocytes and macrophages. Nat Commun. 2015;6(1):6881. doi: 10.1038/ncomms7881
- Alqassim EY, Sharma S, ANMNH K, et al. RNA editing enzyme APOBEC3A promotes pro-inflammatory M1 macrophage polarization. Commun Biol. 2021;4(1):102. doi: 10.1038/s42003-020-01620-x
- Sharma S, Patnaik SK, Kemer Z, et al. Transient overexpression of exogenous APOBEC3A causes C-to-U RNA editing of thousands of genes. RNA Biol. 2016;14(5):603–610. doi: 10.1080/15476286.2016.1184387
- Diroma MA, Ciaccia L, Pesole G, et al. Elucidating the editome: bioinformatics approaches for RNA editing detection. Brief Bioinform. 2019;20(2):436–447. doi: 10.1093/bib/bbx129
- Workman RE, Tang AD, Tang PS, et al. Nanopore native RNA sequencing of a human poly(A) transcriptome. Nat Methods. 2019;16(12):1297–1305. doi: 10.1038/s41592-019-0617-2
- Garalde DR, Snell EA, Jachimowicz D, et al. Highly parallel direct RNA sequencing on an array of nanopores. Nat Methods. 2018;15(3):201–206. doi: 10.1038/nmeth.4577
- Wang Y, Zhao Y, Bollas A, et al. Nanopore sequencing technology, bioinformatics and applications. Nat Biotechnol. 2021;39(11):1348–1365. doi: 10.1038/s41587-021-01108-x
- Begik O, Mattick JS, Novoa EM. Exploring the epitranscriptome by native RNA sequencing. RNA. 2022;28(11):1430–1439. doi: 10.1261/rna.079404.122
- Nguyen TA, Heng JWJ, Kaewsapsak P, et al. Direct identification of A-to-I editing sites with nanopore native RNA sequencing. Nat Methods. 2022;19(7):833–844. doi: 10.1038/s41592-022-01513-3
- Begik O, Lucas MC, Pryszcz LP, et al. Quantitative profiling of pseudouridylation dynamics in native RNAs with nanopore sequencing. Nat Biotechnol. 2021;39(10):1278–1291. doi: 10.1038/s41587-021-00915-6
- Liu H, Begik O, Lucas MC, et al. Accurate detection of m6A RNA modifications in native RNA sequences. Nat Commun. 2019;10(1):4079. doi: 10.1038/s41467-019-11713-9
- Jenjaroenpun P, Wongsurawat T, Wadley TD, et al. Decoding the epitranscriptional landscape from native RNA sequences. Nucleic Acids Res. 2021;49(2):e7. doi: 10.1093/nar/gkaa620
- Delahaye C, Nicolas J, Andrés-León E. Sequencing DNA with nanopores: troubles and biases. PLoS One. 2021;16(10):e0257521. doi: 10.1371/journal.pone.0257521
- Sahlin K, Medvedev P. Error correction enables use of Oxford nanopore technology for reference-free transcriptome analysis. Nat Commun. 2021;12(1):2. doi: 10.1038/s41467-020-20340-8
- Liu FT, Ting KM, Zhou Z-H. Isolation Forest. In: 2008 Eighth IEEE International Conference on Data Mining; 2008 Dec 15-19; Pisa, Italy; 2008. p. 413–422. doi:10.1109/ICDM.2008.17
- Liu FT, Ting KM, Zhou Z-H. Isolation-based anomaly detection. ACM Trans Knowl Discov Data. 2012;6(3):1–3:39. doi: 10.1145/2133360.2133363
- Picardi E, Pesole G. Reditools: high-throughput RNA Editing detection made easy. Bioinformatics. 2013;29(14):1813–1814. doi: 10.1093/bioinformatics/btt287
- Lerner T, Kluesner M, Tasakis RN, et al. C-to-U RNA Editing: from computational detection to experimental validation. Methods Mol Biol. 2021;2181:51–67. doi:10.1007/978-1-0716-0787-9_4
- Liu H, Begik O, Novoa EM. EpiNano: detection of m6A RNA modifications using Oxford nanopore direct RNA sequencing. Methods Mol Biol. 2021;2298:31–52. doi:10.1007/978-1-0716-1374-0_3
- Stoiber M, Quick J, Egan R, et al. De Novo identification of DNA modifications enabled by genome-guided nanopore signal Processing. bioRxiv [Internet]. 2017 [cited 2022 Sep 21]. 094672. Available from: https://www.biorxiv.org/content/10.1101/094672v2 doi:10.1101/094672
- Loman NJ, Quick J, Simpson JT. A complete bacterial genome assembled de novo using only nanopore sequencing data. Nat Methods. 2015;12(8):733–735. doi: 10.1038/nmeth.3444
- Gamaarachchi H, Lam CW, Jayatilaka G, et al. GPU accelerated adaptive banded event alignment for rapid comparative nanopore signal analysis. BMC Bioinf. 2020;21(1):343. doi: 10.1186/s12859-020-03697-x
- Picardi E, Manzari C, Mastropasqua F, et al. Profiling RNA editing in human tissues: towards the inosinome atlas. Sci Rep. 2015;5(1):14941. doi: 10.1038/srep14941
- Picardi E, Horner DS, Chiara M, et al. Large-scale detection and analysis of RNA editing in grape mtDNA by RNA deep-sequencing. Nucleic Acids Res. 2010;38(14):4755–4767. doi: 10.1093/nar/gkq202
- Andrews S. FastQC: a quality control tool for high throughput sequence data. Cambridge, United Kingdom: Babraham Bioinformatics, Babraham Institute; 2010.
- Chen S, Z Y, Chen Y. Fastp: an ultra-fast all-in-one FASTQ preprocessor. Bioinformatics. 2018;34(17):i884–i890. doi: 10.1093/bioinformatics/bty560
- Dobin A, Davis CA, Schlesinger F, et al. STAR: ultrafast universal RNA-seq aligner. Bioinformatics. 2013;29(1):15–21. doi: 10.1093/bioinformatics/bts635
- Li H, Handsaker B, Wysoker A, et al. The sequence alignment/Map format and SAMtools. Bioinformatics. 2009;25(16):2078–2079. doi: 10.1093/bioinformatics/btp352
- Wang K, Li M, Hakonarson H. ANNOVAR: functional annotation of genetic variants from high-throughput sequencing data. Nucleic Acids Res. 2010;38(16):e164. doi: 10.1093/nar/gkq603
- Jiongming M, Song B, Wei Z, et al. Kunqi Chen. m5C-Atlas: a comprehensive database for decoding and annotating the 5-methylcytosine (m5C) epitranscriptome. Nucleic Acids Res. 2022;50(D1). doi:10.1093/nar/gkab1075