
 ?Mathematical formulae have been encoded as MathML and are displayed in this HTML version using MathJax in order to improve their display. Uncheck the box to turn MathJax off. This feature requires Javascript. Click on a formula to zoom.
ABSTRACT
RNA degradation is critical for synchronising gene expression with changing conditions in prokaryotic and eukaryotic organisms. In bacteria, the preference of the central ribonucleases RNase E, RNase J and RNase Y for 5’-monophosphorylated RNAs is considered important for RNA degradation. For RNase E, the underlying mechanism is termed 5’ sensing, contrasting to the alternative ‘direct entry’ mode, which is independent of monophosphorylated 5’ ends. Cyanobacteria, such as Synechocystis sp. PCC 6803 (Synechocystis), encode RNase E and RNase J homologues. Here, we constructed a Synechocystis strain lacking the 5’ sensing function of RNase E and mapped on a transcriptome-wide level 283 5’-sensing-dependent cleavage sites. These included so far unknown targets such as mRNAs encoding proteins related to energy metabolism and carbon fixation. The 5’ sensing function of cyanobacterial RNase E is important for the maturation of rRNA and several tRNAs, including tRNAGluUUC. This tRNA activates glutamate for tetrapyrrole biosynthesis in plant chloroplasts and in most prokaryotes. Furthermore, we found that increased RNase activities lead to a higher copy number of the major Synechocystis plasmids pSYSA and pSYSM. These results provide a first step towards understanding the importance of the different target mechanisms of RNase E outside Escherichia coli.
Introduction
RNA degradation in bacteria is thought to be initiated by the removal of 5’-pyrophosphates from 5’-triphosphorylated (5’-PPP) RNA ends and/or by an endonucleolytic cleavage, usually mediated by one or several of the ribonucleases (RNases) RNase III, RNase E, RNase J or RNase Y [Citation1,Citation2]. In both cases, the resulting products are 5’-monophosphorylated (5’-P), which fosters further degradation due to the higher affinity of RNase E, RNase J and RNase Y towards 5’-P rather than 5’-PPP RNA ends [Citation1]. The mechanism of 5′-monophosphate recognition by RNase E is called 5’ sensing. All three RNases play central roles in RNA degradation in different bacteria [Citation1,Citation3]. Most sequenced bacteria encode at least one of the three above mentioned RNases [Citation3]. However, the specific roles of each RNase appear to differ among organisms. RNase E of Escherichia coli (E. coli) is most likely the best investigated RNase E homologue. Inactivation of the enzyme led to a 6-fold increase in the half-life of pulse-labelled mRNA fractions and was ultimately lethal [Citation4]. In addition to its role in RNA turnover, E. coli RNase E is involved in rRNA [Citation5,Citation6], tRNA [Citation7–9], RnpB [Citation10,Citation11], tmRNA [Citation12], 6S RNA [Citation13] and small regulatory RNAs (sRNAs) [Citation14–16] maturation, as well as in the targeting of specific mRNAs by certain regulatory sRNAs [Citation14,Citation17,Citation18].
At the structural level, the higher affinity of E. coli RNase E towards 5’-P than 5’-PPP RNA fragments is based on a shallow pocket on the protein surface within the 5’ sensor domain [Citation17,Citation19] (). Amino acid exchanges R169Q and T170V, which are part of this pocket, reduced the enzyme’s affinity towards 5’-P RNA fragments [Citation6,Citation17,Citation26,Citation27]. In vivo, the substitution R169Q led to a slow growth phenotype, accumulation of 5S rRNA precursors and prolonged half-lives of several transcripts [Citation5,Citation6]. The R169Q and T170V substitutions enabled the dissection of the relevance of different target recognition pathways of E. coli RNase E [Citation5–8,Citation27,Citation28]. Besides its high affinity towards 5’-P RNA, there are further determinants directing cleavage by RNase E. The enzyme cleaves single-stranded RNA in A- and U-rich regions [Citation29]. For many transcripts, secondary structures or multiple single-stranded RNA regions in close proximity to the cleavage site are important for processing [Citation7,Citation8,Citation17,Citation30]. In the absence of secondary structures, a guanine residue two nucleotides (nt) upstream of the cleavage site might be of importance in E. coli [Citation31], while in Salmonella enterica a uracil residue located two nt downstream directs positioning of the cleavage site [Citation16]. However, the interplay among these different cleavage determinants is not yet fully understood and several studies have suggested that different target recognition mechanisms can, to a certain extent, substitute each other [Citation5,Citation17,Citation32]. There are several targets for which the dependence on 5’ sensing was shown in enterobacteria in vivo, e.g. the maturation of the 3’ untranslated region (UTR)-derived sRNA CpxQ [Citation15], sRNA sponge SroC [Citation14] and processing of 9S RNA as well as rpsT mRNA [Citation5,Citation28]. Interestingly, the dependence on 5’-P RNA ends for efficient action of some sRNAs, such as found for instance for MicC-directed in vitro cleavage of ompD mRNA by RNase E [Citation18], was not observed in vivo [Citation33]. However, a transcriptome-wide survey of processing sites depending on 5’ sensing has not yet been performed in any bacterium in vivo.
Figure 1. Comparison of Synechocystis RNase E with phylogenetically distant RNase E homologues. (A) Scheme comparing the domain structure of E. coli RNase E to Synechocystis RNase E. The shown E. coli domain organisation and localisation of the membrane-targeting site as well as PNPase and RNase II binding sites are indicated according to Aït-bara et al. [Citation20]. The localisation of eight amino acids that are dependent on the 5’ bypass target recognition pathway is based on Bandyra et al., 2018 and Clarke et al., 2023 [Citation17,Citation21]. For Synechocystis RNase E, the presence of conserved and variable regions was indicated according to [Citation22]. The Synechocystis RNase E amino acids F64, K98, K494 and K512 bind RNA and were identified by UV-crosslinking to CRISPR3 crRNA [Citation23]. We indicated putative binding sites for enolase, DEAD-box RNA helicase CrhB and RNase II (identified only for Nostoc sp. PCC 7120 (Nostoc) RNase E so far [Citation24,Citation25]). In Nostoc, enolase and CrhB bind to the RNase H-like and DNase I-like domains of RNase E (yellow, dark blue) [Citation24] and RNase II interacts with the N-terminal half of RNase E (N-terminal of V1) [Citation25]. (B) Alignment of Synechocystis RNase E residues 115 to 162 with the respective section in homologues from Arabidopsis thaliana, Nostoc, Gloeobacter violaceus PCC 7412, E. coli (K12), Caulobacter crescentus (CB15), Rhodobacter sphaeroides 2.4.1 and E. coli (K12) RNase G. Arrows point at key amino acids forming the 5’ sensor pocket in E. coli RNase E [Citation17,Citation19]. Shades of blue indicate different degrees of identity between the compared protein sequences.
![Figure 1. Comparison of Synechocystis RNase E with phylogenetically distant RNase E homologues. (A) Scheme comparing the domain structure of E. coli RNase E to Synechocystis RNase E. The shown E. coli domain organisation and localisation of the membrane-targeting site as well as PNPase and RNase II binding sites are indicated according to Aït-bara et al. [Citation20]. The localisation of eight amino acids that are dependent on the 5’ bypass target recognition pathway is based on Bandyra et al., 2018 and Clarke et al., 2023 [Citation17,Citation21]. For Synechocystis RNase E, the presence of conserved and variable regions was indicated according to [Citation22]. The Synechocystis RNase E amino acids F64, K98, K494 and K512 bind RNA and were identified by UV-crosslinking to CRISPR3 crRNA [Citation23]. We indicated putative binding sites for enolase, DEAD-box RNA helicase CrhB and RNase II (identified only for Nostoc sp. PCC 7120 (Nostoc) RNase E so far [Citation24,Citation25]). In Nostoc, enolase and CrhB bind to the RNase H-like and DNase I-like domains of RNase E (yellow, dark blue) [Citation24] and RNase II interacts with the N-terminal half of RNase E (N-terminal of V1) [Citation25]. (B) Alignment of Synechocystis RNase E residues 115 to 162 with the respective section in homologues from Arabidopsis thaliana, Nostoc, Gloeobacter violaceus PCC 7412, E. coli (K12), Caulobacter crescentus (CB15), Rhodobacter sphaeroides 2.4.1 and E. coli (K12) RNase G. Arrows point at key amino acids forming the 5’ sensor pocket in E. coli RNase E [Citation17,Citation19]. Shades of blue indicate different degrees of identity between the compared protein sequences.](/cms/asset/fcb9d01f-86be-4df4-925b-3115fc1a6dd0/krnb_a_2328438_f0001_oc.jpg)
Cyanobacteria are the only bacteria capable of performing oxygenic photosynthesis and are therefore of immense ecological relevance as well as of interest for the phototrophic production of valuable compounds from CO2. Cyanobacterial RNA decay is far from being fully understood and potentially important players remain to be characterised experimentally [Citation34]. Several studies demonstrated the regulation of photosynthetic transcript accumulation by cyanobacterial RNase E [Citation35–37]. In the unicellular model cyanobacterium Synechocystis sp. PCC 6803 (Synechocystis), RNase E was identified as the major maturation enzyme of CRISPR RNAs (crRNAs) from a subtype III-Bv CRISPR array [Citation23]. The RNase E of cyanobacteria represents a compact version of the enzyme, lacking both the long N-terminal extensions typical for chloroplast RNase E [Citation38], as well as the region homologous to the C-terminal half of enterobacterial RNase E [Citation39] (). Findings for E. coli RNase E imply that the C-terminal half of E. coli RNase E is involved in target recognition mechanisms that are independent of 5’ sensing [Citation5,Citation17,Citation21,Citation32]. Hence, the lack of apparent homology in this region might indicate that cyanobacterial RNase E is more dependent on 5’ sensing than its enterobacterial counterpart. Interestingly, cyanobacteria not only encode RNase E, but also RNase J, which also shows a higher affinity towards 5’-P than to 5’-PPP RNA ends and a cleavage affinity similar to that of RNase E in vitro [Citation40]. Recently, we found that a transient inactivation of Synechocystis RNase E did not increase the ratio of 5’-P to 5’-PPP RNA ends at transcriptional start site (TSS) positions or the ratio of 5’-P to 5’-PPP RNA fragments [Citation41]. Hence, RNase E activity does not seem to be rate-limiting for 5’-dependent RNA degradation in vivo [Citation41]. Therefore, cyanobacteria provide a well-suited model to study the impact of 5’ sensing on cleavage positioning without affecting general 5’-end dependent bulk RNA degradation in vivo.
To elucidate the possible impact of 5’ sensing in cyanobacterial RNase E, we constructed a Synechocystis strain with a T161V amino acid exchange, homologous to T170V, which was successfully used in E. coli to decrease 5’ sensing activity [Citation8,Citation27]. The resulting strain, rne(5p), displayed clear and specific deficiencies in rRNA and tRNA maturation. Furthermore, we identified potential cases of post-transcriptional regulation conveyed by 5’ sensing. Interestingly, many instances of RNase-E-dependent processing were not affected by the decreased 5’ sensing activity, indicating that the Synechocystis enzyme also employs further RNA target recognition pathways, despite its shorter C-terminal segment lacking sequence similarity to the E. coli enzyme [Citation22].
Material and methods
Heterologous overexpression and purification of cyanobacterial RNase E
A pQE70-based vector containing a codon-optimised version of the Synechocystis gene slr1129, which encodes RNase E, fused to a C-terminal TEV split site and 6×His-tag was kindly provided by J. Behler [Citation23]. This gene was amplified using the primer pair C01/C02 (see Supp. Table S1 for all primer sequences) and subcloned into pJET1.2/blunt (Thermo Fisher Scientific). Primer pairs M01/M02 and M03/M04 were used with the Q5 site-directed mutagenesis kit (NEB) to introduce point mutations for the T161V and D296N substitutions. Constructs encoding wild-type, T161V or D296N RNase E and vector pCDFDuet were cut with the FastDigest restriction enzymes NcoI and SalI (Thermo Fisher Scientific). Insert and vector were ligated using T4 DNA ligase (Thermo Fisher Scientific) and transferred to E. coli DH5α. E. coli BL21(DE3) was transformed with the resulting plasmids and recombinant Synechocystis RNase E was expressed and purified as described previously [Citation42]. Briefly, 50 ml LB medium containing appropriate antibiotics was inoculated with the transformed E. coli cells and incubated overnight at 37°C. The next day, this pre-culture was diluted 1:50 in 1.5 l of LB medium containing appropriate antibiotics. This culture was grown to OD600 nm of 0.6 to 0.8, as measured using a BioSpectrometer basis (Eppendorf). Protein expression was induced by addition of 1 mM isopropyl-ß-D-thiogalactopyranosid (IPTG) and cultures were further incubated for 16 h at 22°C. Cells were harvested by centrifugation (6,000 g, 10 min, 4°C) and lysed using a French press (Constant Systems) at 36,000 psi. Cell debris was removed by centrifugation (13,000 g, 30 min, 4°C) followed by filtration through 0.45 µm and 0.22 µm pore sized polyethersulfone membranes (ROTILABO). RNase E was then purified using TALON Metal Affinity Resin (Takara Bio). Protein purity was confirmed by sodium dodecyl sulphate-polyacrylamide gel electrophoresis (SDS-PAGE), followed by Coomassie staining. The enzymatic activity of RNase E was analysed by in vitro cleavage assays using 5’-PPP and 5’-P psbA2 transcripts [Citation42].
Generation of transcripts with different 5’ modifications for in vitro cleavage assays
PCR products for the generation of different potential RNase E targets were amplified with MyTaq™ Red Mix 2X (Bioline), and Synechocystis genomic DNA as template (primers T01 to T12, see Supp. Table S1). Substrates were transcribed in vitro from purified PCR products using the HiScribe™ T7 Quick High Yield RNA Synthesis Kit (NEB) according to manufacturer’s instructions. This yields 5’-PPP RNA transcripts. For the 53 nt atpT substrate, oligonucleotides T11 and T12 were annealed by mixing 400 pmol of each in 8 µl deionised nuclease-free water. This mixture was heated to 95°C for 5 min and then cooled to 20°C with a step-wise decrease of 0.1°C per second. The annealed oligonucleotides were used as in vitro transcription templates. To remove DNA templates, transcripts were treated with 4 U DNase I (NEB) for 30 min at 37°C and subsequently separated on a 10% polyacrylamide (PAA) gel containing 8.3 M urea. Correctly sized transcripts were excised and purified using the ZR small-RNA™ PAGE Recovery Kit (Zymo Research). Buffers were exchanged using the RNA Clean & Concentrator-25 kit (Zymo Research), eluting RNA in RNase-free H2O. For differently modified 5’ termini, various treatments were performed. To obtain 5’-P RNA, 2 µg of 5’-PPP transcripts was incubated with 10 U 5’ pyrophosphohydrolase (RppH, NEB) and 20 U RiboLock (Thermo Fisher Scientific) in NEBuffer 2 (NEB) for 2 h at 37°C. Successful RppH treatment was verified by incubating 100 ng of 5’-P or 5’-PPP transcripts with 20 U RiboLock and 1 U Terminator™ 5’-Phosphate-Dependent Exonuclease (Lucigen) in 1X TEX Buffer B for 30 min at 42°C. Exemplary results for four transcripts are shown in Supplementary Figure S1. To obtain 5’-hydroxylated termini, transcripts were treated with Shrimp Alkaline Phosphatase (SAP; NEB). Briefly, 2 µg of RNA was mixed with 10 U RiboLock, 3 U SAP in 1X SAP buffer and incubated for 2 h at 37°C. After these treatments, enzymes were removed and buffers were exchanged using the RNA Clean & Concentrator-25 kit (Zymo Research). Modified transcripts were eluted in 15 µl H2O.
RNase E in vitro cleavage assays
In vitro cleavage assays were performed according to [Citation23,Citation42]. Briefly, 80 ng of RNA substrates (5’-PPP, 5’-P, 5’-OH) were treated in 5 µl or 10 µl reaction volume containing RNase E cleavage buffer (25 mM Tris-HCl, 60 mM KCl, 5 mM MgCl2, 100 mM NH4Cl, 0.1 mM DTT, pH 8.0) and 1 µl or 2 µl RNase E eluates (wild type, T161V, D296N), respectively. The typical protein concentration range for the eluates was between 600 and 800 ng/µl as measured using a Direct Detect® Infrared Spectrometer (Millipore, USA) and Direct Detect® Assay-free Cards (Millipore, USA). The reactions were performed at 30°C for 30 min and stopped by adding 2X loading dye (0.025% xylene cyanol, 0.025% bromophenol blue, 0.5 mM EDTA, 0.025% SDS, and 95% formamide). Transcripts were denatured for 10 min at 65°C and, depending on their size, loaded onto 6%, 8% or 15% PAA gels containing 8.3 M urea. Gels were stained by incubation in 1X SYBR Gold Nucleic Acid Gel Stain (Invitrogen) in 0.5X Tris-borate-EDTA buffer for 15 min. Signals were detected using a Typhoon™ FLA 9500 (Cytiva) imager, with following settings: excitation light wavelength: 495 nm; emission light wavelength: 537 nm; emission filter: long pass blue (LPB); photomultiplier value: 450–600 V.
Bacterial strains and culture conditions
We used a motile wild type of Synechocystis, that is capable of photoautotrophic, mixotrophic and chemoheterotrophic growth on glucose. Originally, it was obtained from S. Shestakov (Moscow State University, Russia) in 1993 and re-sequenced in 2012 [Citation43]. BG-11 medium [Citation44] supplemented with 0.3% (w/v) sodium thiosulphate and 10 mM N-[Tris-(hydroxy-methyl)-methyl]-2-aminoethanesulfonic acid (TES) buffer (pH 8.0) was used for cultivation. Liquid cultures were grown in Erlenmeyer flasks with constant shaking (135 rpm) at 30°C and under continuous white light (30 µmol photons m−2 s−1). Plate cultures were grown on 0.75% bacto-agar BG-11 plates. Kanamycin (40 µg ml−1) and chloramphenicol (10 µg ml−1) were added to plate cultures for strain maintenance, but omitted during experiments. Spot assays were performed as previously described [Citation45]. Plates were incubated under continuous neutral white light (50 µmol photons m−2 s−1) or in a 12/12 h light-dark cycle.
Construction of mutant strains
Information on all used strains is summarised in Supplementary Table S2. The strain rne(5p) was constructed analogously to rne(WT) as described [Citation41] (Supp. Figure S2A). Primers M03/M04 (Supp. Table S1) were used to introduce the T161V mutation into the pJET 1.2 vector harbouring the rne-rnhB operon including N-terminal 3×FLAG tag, promoter and terminator sequences [Citation41].
Spectroscopy
Whole-cell absorption spectra were measured using a Specord 250 Plus (Analytik Jena) spectrophotometer at room temperature and normalised to absorption values at 750 nm which were measured with a BioSpectrometer basic (Eppendorf).
DNA extraction
To extract DNA for homozygosity testing, 0.2% glucose was added 12 h prior to harvesting 50 ml cultures by centrifugation (6000 g, 10 min, 4°C). To test relative replicon abundance, DNA was extracted from 50 ml culture at OD750 nm 0.6 to 0.7, without prior glucose addition. After centrifugation, cell pellets were washed twice using 10 mM Tris/HCl, 1 mM EDTA buffer (pH 8.0), resuspended in 1 ml TES-buffer (25% (w/v) sucrose, 100 mM EDTA, 50 mM Tris/HCl pH 8.0) and snap-frozen in liquid nitrogen. Samples were thawed at 60°C and again snap-frozen in liquid nitrogen. After thawing, lysozyme (5 mg ml−1) and RNase A (0.1 µg ml−1) were added and samples were incubated at 37°C for 1 h. Proteinase K (40 µg ml−1) and SDS (2%) were added and samples were incubated for at least 4 h at 60°C. This was followed by two extractions using phenol-chloroform-isoamyl alcohol (25:24:1 (v/v)) and one extraction using chloroform. DNA was precipitated from the aqueous phase with 0.7 volumes isopropanol overnight. After centrifugation, pellets were washed with ethanol (70%). After residual traces of ethanol had evaporated, pellets were resuspended in water.
Southern blot analysis
To test complete segregation of rne(WT) and rne(5p), restriction digests of 5 µg of DNA extracted from three independent clones were performed with HincII or Bsu15I (Thermo Fisher Scientific). Duplicates of wild-type Synechocystis (WT) DNA were included as control. To test copy numbers of different replicons, 5 µg of DNA extracted from three independent liquid cultures of WT, pVZΔKmR and rne(5p) and four rne(WT) cultures was cleaved with HindIII (Thermo Fisher Scientific). Samples were mixed with DNA loading dye (4.5% (v/v) glycerol, 0.05% bromophenol blue, 0.05% xylene cyanol, 0.05% orange G, Midori Green) and separated by gel electrophoresis on 0.8% (w/v) agarose gels in Tris-acetate-EDTA buffer (40 mM Tris, 1 mM EDTA pH 8.0, 20 mM acetic acid). Subsequently, gels were incubated in 0.25 M HCl until 15 min after the bromophenol blue band in the gel turned green. After washing with deionised water, gels were incubated in 1.5 M NaCl, 0.5 M NaOH until 15 min after the bromophenol blue band turned blue again. Gels were washed with deionised water and incubated in 1.5 M NaCl, 0.5 M Tris/HCl pH 7.5 for 20 min. DNA was transferred onto Roti-Nylon plus membranes (Carl Roth) by capillary blotting. To test full segregation of strains by Southern blot hybridisation, a probe was labelled using the Amersham Gene Images AlkPhos Direct Labelling and Detection System (GE Healthcare) according to the manufacturer’s protocol with a DNA fragment generated by PCR using primer pair S01/S02 (Supp. Figure S2A). The luminescence signal was detected with the Fusion SL4 advanced (Vilber Lourmat) apparatus. To test replicon abundance, membranes were hybridised with radioactively labelled RNA probes and signals were detected as described for northern blot analysis [Citation41]. Primer pairs S03/S04 (chromosome), N03/N04 (pSYSA) and S05/S06 (pSYSM) were used to generate DNA templates for probe transcription. Signal intensity was quantified with Fiji (v2.0.0-rc-69/1.52p) [Citation46], followed by analysis using an R (v4.0.4) script. For statistical analysis, one-way ANOVA followed by post-hoc Tukey’s honest significant difference tests were performed.
Northern blot hybridisation
For RNA extraction from Synechocystis, liquid cultures were grown to OD750 nm of 0.6 to 0.8. Sampling of 20 ml or 30 ml aliquots and RNA extraction and northern blot hybridisation were performed as described [Citation41]. Primer pairs N01/N02, N03/N04 and N05/N06 were used to generate DNA templates for in vitro transcription and hybridisation as described [Citation41]. To create the probe complementary to the 5’ end of tRNAGluUUC, oligonucleotides N07 and N08 were annealed by mixing 400 pmol of each in 8 µl deionised nuclease-free water. This mixture was heated to 95°C for 5 min and then cooled to 20°C with a step-wise decrease of 0.1°C per second. The annealed oligonucleotides were used for in vitro transcription. When transcript probes were used, membranes were pre-incubated at 65°C in formamide-containing hybridisation buffer (50% deionised formamide, 7% SDS, 250 mM NaCl, 120 mM NaPO4 buffer pH 7.2) for 1 h. The radioactively labelled probe was added and hybridisation was carried out overnight at 65°C for all probes except the probe complementary to tRNAGluUUC, for which a temperature of 55°C was chosen. The next day, membranes were washed twice with buffer I (2X SSC (1X SSC: 0.15 M NaCl, 15 mM sodium citrate, pH 7.0), 0.5% SDS) for 10 min at room temperature and then for 10 min at 65°C. After washing membranes with buffer II (0.1X SSC, 0.1% SDS) for 10 min at 65°C, signal detection was performed as described [Citation41]. Primers 16S_fw and 16S_rev were used to create a PCR product using chromosomal Synechocystis DNA as a template. This PCR product was labelled with [α-32P]-CTP using the Rediprime II DNA Labelling System (GE Healthcare). Oligonucleotide 5S-rRNA-oligo was labelled using T4 polynucleotide kinase (NEB) and [γ-32-P]-ATP (Hartmann Analytics, Germany). Hybridisations with the labelled oligo and PCR products were carried out as described above for transcript probes with the following changes: formamide was omitted from the hybridisation buffer and pre-hybridisation as well as hybridisation were performed at 45°C. Membranes were washed twice with buffer III (2X SSC, 1% SDS) for 10 min each, once at room temperature and once at 40°C. After washing membranes with buffer IV (1X SSC, 0.5% SDS) for 10 min at 40°C, signal was detected as described [Citation41].
RNA sampling, extraction and sequencing
For RNA sequencing, three independent 50 ml liquid cultures of WT, rne(WT) and rne(5p) were grown to an OD750 nm of 0.7 to 0.8. Aliquots of 30 ml were sampled. Small culture aliquots were tested by PCR for full segregation of mutant strains as previously described [Citation41]. One replicate of rne(5p) was not fully segregated and was, therefore, excluded. After RNA extraction, DNase treatment, RNA recovery and RNA integrity control were performed as described [Citation41]. cDNA libraries were constructed and sequenced as a service provided by Vertis Biotechnologie AG (Germany) according to the tagRNA-Seq protocol [Citation47]. Library preparation was performed as described previously [Citation41] with the following modifications: after ligation of processing site (PSS)-specific sequencing adaptors, unligated 5’-P RNA fragments were removed using terminator exonuclease (TEX, Lucigen). Pyrophosphates were removed from 5’-PPP ends using 5’ polyphosphatase (5PP, Epicenter), followed by ligation of TSS-specific adaptors.
Bioinformatic analyses
RNA-Seq analysis was performed as described [Citation41] with several modifications detailed below. Fastq files are available in the GEO Data bank under accession number GSE184824. Reads were uploaded to the public usegalaxy.eu server and analysed utilizing the Galaxy web platform [Citation48] after preliminary processing, i.e. after demultiplexing using TSS- and PSS-specific adaptor sequences and trimming the two subsequent bases. Reads without TSS- or PSS-specific adaptor sequences were considered as transcript reads. We used the Synechocystis genome annotation as introduced by Kaneko et al. [Citation49] with sll/slr and ssl/ssr gene identifiers for longer and shorter protein-coding genes and ncl/ncr identifiers for non-coding RNAs according to Kopf et al. [Citation50]. If gene functions were assigned, we use the respective specific gene names. Several workflows were created to process the data further. As a first step, we performed quality control, adaptor trimming, mapping as well as filtering into data sets with or without multi-mapping reads (https://usegalaxy.eu/u/ute-hoffmann/w/5sens-seq-preprocessing). Subsequently, the 5’ ends of reads associated with PSS- and TSS-adaptors were extracted and prepared for further analyses (PSS/TSS-5’ end files, https://usegalaxy.eu/u/ute-hoffmann/w/5sensing-pss-tss). We created coverage tracks of transcript reads for data visualisation (transcript coverage files, https://usegalaxy.eu/u/ute-hoffmann/w/5sensing-transcript-coverage) and assigned transcript reads to different transcript types and segments using htseq-count (https://usegalaxy.eu/u/ute-hoffmann/w/5sensing-transcript). Subsequently, htseq-count files, PSS/TSS-5’ end files and transcript coverage files were downloaded and analysed using Python (v3.7.4) and R (v4.0.4) scripts available online (https://github.com/ute-hoffmann/5sensing_Synechocystis, https://doi.org/10.5281/zenodo.7509657). Transcript htseq-count files were used as inputs for DESeq2 [Citation51] differential expression analysis and subsequent gene set enrichment analyses (GSEA) using clusterProfiler [Citation52,Citation53]. For classification of genomic positions as TSS or PSS, DESeq2 [Citation51] was used as described [Citation41]. After comparing the data with previously annotated TSS by dRNA-seq [Citation50], only TSS with a maximum distance of 20 nt to these published TSS were kept for further analyses. PSS positions identified previously [Citation41] were included in subsequent analyses. The resulting set of PSS and TSS positions was used for differential expression analysis with DESeq2 (|log2FC| > 1.0 and p.adj < 0.05). Reads with a mapping quality of exactly one, which correspond to multi-mapping reads, were included for the analysis of rRNA loci. Sequence logos were created using WebLogo (v3.7.8) [Citation54] with a GC content of 47.4%. RNAfold (v2.4.17) [Citation55] was used to calculate the minimal folding energy (ΔG) at 30°C and using a sliding window approach with a 1 nt step size. The data were averaged among replicates using an R script and visualised with Artemis [Citation56]. Figures were created using Inkscape (v1.0.2). The sequence alignment was conducted with MUSCLE [Citation57,Citation58] and analysed using Jalview (v2.11.0) [Citation59].
Results
Amino acid exchange T161V abolishes 5’ sensing of Synechocystis RNase E in vitro
Previously, we did not find that Synechocystis RNase E activity seemed to be a bottleneck in 5’-dependent RNA degradation, unlike its function in E. coli [Citation41]. In particular, we observed that a transient inactivation of Synechocystis RNase E led to neither a general nor a TSS-specific higher ratio of 5’-P to 5’-PPP RNA fragments [Citation41]. This was somewhat surprising to us since amino acids which were shown to be important for 5’ sensing in E. coli are highly conserved among RNase E homologues (). At the same time, compared to E. coli RNase E, the Synechocystis enzyme lacks the extensive C-terminal domain, which seems to be important for target recognition pathways alternative to 5’ sensing in E. coli [Citation5,Citation17,Citation32]. Hence, we sought to determine the role and importance of RNase E 5’ sensing in Synechocystis. To answer this question, we introduced the amino acid exchange T161V, which is homologous to T170V used in E. coli to abolish 5’ sensing () [Citation8,Citation27]. In vitro cleavage assays on a well-established target of Synechocystis RNase E, the 5’ UTR of psbA2, illustrated that this exchange did indeed abolish the enzyme’s capability to distinguish between different 5’ phosphorylation states (). Wild-type RNase E exerted much stronger activity on 5’-P psbA2 than on the 5’-PPP or 5’-hydroxylated (5’-OH) counterparts and produced different cleavage products for the 5’-P psbA2 substrate than for the 5’-PPP or 5’-OH variants. This was not the case for the T161V mutant enzyme, which processed all three variants to the same band pattern, regardless of phosphorylation status, indicating that 5’ sensing is important for positioning cleavage sites in vitro. Incubation with the catalytically inactive D296N RNase E mutant enzyme served as a negative control and to test for contaminating RNases in the enzyme purifications, but relevant degradation was not observed.
Figure 2. Impact of amino acid exchange T161V and characterisation of Synechocystis strains rne(WT) and rne(5p). (A) In vitro assay comparing the cleavage activity of Synechocystis wild-type RNase E (WT), RNase E with amino acid exchange T161V (5p) and catalytically inactive RNase E [Citation23] harbouring the amino acid exchange D296N on a 113 nt long transcript derived from the 5’ UTR and the first 20 codons of psbA2. The 5’ termini were either triphosphorylated (5’PPP), monophosphorylated (5’P) or hydroxylated (5’OH). A prominent band appearing only for the 5’P substrate incubated with wild-type RNase E, but not for the other enzyme variants, is indicated by an asterisk. One representative SYBR-gold-stained urea-containing 8% polyacrylamide gel is shown (n = 5). M: marker. (B) Absorption spectra of wild-type Synechocystis (WT), rne(WT) and rne(5p). Shaded areas indicate standard deviations of three replicates. (C) Spot assays testing the growth of WT, rne(WT) and rne(5p) under photoautotrophic and photomixotrophic (5 µM glucose) conditions under continuous and 12 h light/12 h dark cycles (n > 4). (D) Urea-containing polyacrylamide gel of total RNA from WT, rne(WT), rne(5p) and empty-vector control strain pVZΔKmR (pVZ) stained with ethidium bromide. (E) The same gel after northern blotting and hybridisation with a radioactively labelled probe for 5S rRNA. One representative analysis is shown (n = 4). # indicates mature 5S rRNA, * 5S rRNA precursors. A control hybridisation with RnpB is shown (lower panel).
![Figure 2. Impact of amino acid exchange T161V and characterisation of Synechocystis strains rne(WT) and rne(5p). (A) In vitro assay comparing the cleavage activity of Synechocystis wild-type RNase E (WT), RNase E with amino acid exchange T161V (5p) and catalytically inactive RNase E [Citation23] harbouring the amino acid exchange D296N on a 113 nt long transcript derived from the 5’ UTR and the first 20 codons of psbA2. The 5’ termini were either triphosphorylated (5’PPP), monophosphorylated (5’P) or hydroxylated (5’OH). A prominent band appearing only for the 5’P substrate incubated with wild-type RNase E, but not for the other enzyme variants, is indicated by an asterisk. One representative SYBR-gold-stained urea-containing 8% polyacrylamide gel is shown (n = 5). M: marker. (B) Absorption spectra of wild-type Synechocystis (WT), rne(WT) and rne(5p). Shaded areas indicate standard deviations of three replicates. (C) Spot assays testing the growth of WT, rne(WT) and rne(5p) under photoautotrophic and photomixotrophic (5 µM glucose) conditions under continuous and 12 h light/12 h dark cycles (n > 4). (D) Urea-containing polyacrylamide gel of total RNA from WT, rne(WT), rne(5p) and empty-vector control strain pVZΔKmR (pVZ) stained with ethidium bromide. (E) The same gel after northern blotting and hybridisation with a radioactively labelled probe for 5S rRNA. One representative analysis is shown (n = 4). # indicates mature 5S rRNA, * 5S rRNA precursors. A control hybridisation with RnpB is shown (lower panel).](/cms/asset/e29a17f7-4518-4b49-bcfc-5f7c324d6460/krnb_a_2328438_f0002_oc.jpg)
5’ sensing leads to growth deficiencies under light-dark cycles in vivo
Based on these in vitro results, we set out to engineer Synechocystis mutant strains encoding RNase E without the 5’ sensing functionality to test the impact of abolishing 5’ sensing in vivo. However, manipulation of RNase E in Synechocystis poses several challenges. RNase E is encoded by the essential gene rne in a dicistronic operon together with rnhB, which encodes RNase HII [Citation41]. Evidence is accumulating that transcription of this operon is autoregulated by RNase E [Citation40,Citation41,Citation60]. Furthermore, Synechocystis is polyploid. Since RNase E likely also forms a homotetramer in Synechocystis, as in E. coli, it is crucial to obtain fully segregated clones since wild-type monomers can rescue mutations in other monomers of a tetramer [Citation61]. We aimed to compare strains encoding either wild-type RNase E or RNase E with the amino acid substitution T161V. To construct the strains, we introduced the rne-rnhB operon, promoter and terminator sequences either at a putative neutral site located in the intergenic region between slr0309 and sll0282 on the chromosome [Citation62] or on a conjugative, self-replicating plasmid. In all strains, the rne gene was modified to produce a protein with an N-terminal 3×FLAG tag. In a second step, we attempted to delete the original rne-rnhB locus (Supp. Figure S2A). In the following, strains for which the plasmid-based strategy was used will be referred to as rne(WT) and rne(5p). The rne(WT) strain harbours the wild-type copy of rne on the plasmid whereas in rne(5p), rne carries the T161V mutation. The full deletion of the endogenous rne-rnhB locus, i.e. full segregation (homozygosity), was achieved once the respective plasmids were introduced (Supp. Figure S2B). As a control for rne(WT) and rne(5p), an empty vector control strain pVZΔKmR was used in which the same plasmid backbone without the rne-rnhB operon was introduced. In a second step, a kanamycin resistance cassette and an N-terminal 3×FLAG sequence were introduced chromosomally upstream of rne in pVZΔKmR [Citation41].
Introducing the operon on the RSF1010-based plasmid pVZ probably led to a higher gene dosage [Citation63], which, in turn, led to an elevated rne-rnhB transcript level and increased RNase E expression (Supp. Figure S2C-E, compare [Citation41]). Consistent with prior findings comparing an RNase E overexpression strain to WT [Citation23], mature crRNAs of the CRISPR3 array accumulated more strongly in rne(WT) and rne(5p) than in WT and the empty-vector control strain pVZΔKmR (Supp. Figure S3). This supports our conclusion that RNase E was overexpressed in the constructed plasmid-based mutant strains.
When grown under constant moderate light, the different strains did not show obvious changes in pigment composition (). As the mutant strains tended to form aggregates when cultivated in liquid cultures, we compared WT, rne(WT) and rne(5p) strains under different growth conditions using spot assays (). Under photoautotrophic and photomixotrophic conditions, rne(WT) and rne(5p) showed attenuated growth compared to WT (). This phenotype was aggravated during light-dark cycles and for rne(5p), when glucose was added for photomixotrophic growth. At the RNA level, an aberrant accumulation of 5S rRNA precursors was observed in rne(5p) ().
Inactivating 5’ sensing impacts RNA processing and thereby enables identification of unknown targets of cyanobacterial RNase E
To investigate further effects on RNA processing, we performed RNA sequencing of triplicates of WT, rne(WT) and duplicates of rne(5p) under photoautotrophic growth conditions (). cDNA libraries were prepared according to the tagRNA-seq protocol [Citation47] (). tagRNA-seq enables to distinguish 5’-P RNA species, which originate from processing and are thus PSS, and 5’-PPP RNA species, which are typical TSS. In total, we obtained 95.5 million reads for the eight samples. Of these, we mapped 82.2% with high quality to the Synechocystis genome. This corresponded to, on average, 9.8 million reads per sample, of which 3.8% were classified as being associated with PSS, 19.1% with TSS, while 77.1% were tagged neither as PSS nor TSS and represented general transcript coverage (Supp. Figure S4A).
Figure 3. Overview of the RNA-seq experiment. (A) Experimental setup. RNA was sampled from triplicates of wild-type Synechocystis (WT), rne(WT) and duplicates of rne(5p). (B) RNA was extracted and used for cDNA library preparation distinguishing between processing sites (PSS), transcriptional start sites (TSS) and other (unspecified) transcript positions. PSS- and TSS-tags, which are sequencing adaptors containing PSS- and TSS-specific nucleotide combinations, were ligated to the respective RNA 5’ ends before or after terminator exonuclease treatment and 5’ pyrophosphate removal. (C) Principal component analyses comparing replicates of the different strains using normalised count matrices for PSS, TSS and other transcript reads separately. The latter was analysed at the transcript type/segment level. Transcript types and segments include coding sequences (CDS), known sRNAs and asRNAs [Citation49,Citation64,Citation65] as well as 5’ untranslated regions (UTRs) and 3’ UTRs based on the total of 4,091 transcriptional units (TUs) defined by Kopf et al. [Citation50].
![Figure 3. Overview of the RNA-seq experiment. (A) Experimental setup. RNA was sampled from triplicates of wild-type Synechocystis (WT), rne(WT) and duplicates of rne(5p). (B) RNA was extracted and used for cDNA library preparation distinguishing between processing sites (PSS), transcriptional start sites (TSS) and other (unspecified) transcript positions. PSS- and TSS-tags, which are sequencing adaptors containing PSS- and TSS-specific nucleotide combinations, were ligated to the respective RNA 5’ ends before or after terminator exonuclease treatment and 5’ pyrophosphate removal. (C) Principal component analyses comparing replicates of the different strains using normalised count matrices for PSS, TSS and other transcript reads separately. The latter was analysed at the transcript type/segment level. Transcript types and segments include coding sequences (CDS), known sRNAs and asRNAs [Citation49,Citation64,Citation65] as well as 5’ untranslated regions (UTRs) and 3’ UTRs based on the total of 4,091 transcriptional units (TUs) defined by Kopf et al. [Citation50].](/cms/asset/f38edc8e-168b-45e9-aa50-b8e04b22902a/krnb_a_2328438_f0003_oc.jpg)
As already observed upon transient inactivation of RNase E followed by RNA-sequencing (TIER-seq) [Citation41], neither the ratio of the number of PSS to TSS reads in separate samples nor the ratio of PSS to TSS reads mapping to TSS positions were affected by rne-rnhB overexpression or decreased 5’ sensing activity (Supp. Figure S4). Thus, inactivation of 5’ sensing did not result in a global increase in the relative amount of 5’-P RNA fragments. Transcript reads were mapped to different transcript types and segments which included coding sequences (CDS), 5’ and 3’ UTRs and various non-coding RNA species such as antisense RNAs (asRNAs) or tRNAs (). Normalised count matrices for PSS, TSS and transcript reads were used separately for principal component analysis (PCA). For the transcript reads and the TSS PCA, but not the PSS PCA, the three strains were well separated on principal component 1 (PC1) (). This was also the case for PSS on principal component 2 (PC2), while there was less consistency for TSS and transcript segments on PC2. The PSS PCA separated rne(WT) and WT from rne(5p) on PC1, indicating that most variance present in the data set regarding PSS might be explained by the presence or absence of the T161V mutation.
Table 1. Pair-wise comparison of the number of transcriptional units (TU), processing sites (PSS), transcriptional start sites (TSS) and various transcript types and segments differentially expressed (|log2FC| > 1.0 and p.adj < 0.05) between rne(WT), rne(5p) and wild-type Synechocystis (WT). Transcript types and segments include coding sequences (CDS), known sRNAs and antisense RNAs (asRNAs) [46,107,108] as well as 5’ untranslated regions (UTRs) and 3’ UTRs based on the total of 4,091 TUs defined by Kopf et al. [47]. PSS and TSS include previously identified positions [37]. Numbers in parentheses give percentages relative to all representatives of the respective type.
Table 2. Pair-wise comparison of the number of transcript types and segments differentially expressed (|log2FC| > 1.0 and p.adj < 0.05) between rne(WT), rne(5p) and WT. Transcript types and segments include coding sequences (CDS), annotated sRNAs and antisense RNAs (asRNAs) [46,107,108] as well as 5’ untranslated regions (UTRs) and 3’ UTRs based on a total of 4,091 transcriptional units (TU) defined by Kopf et al. [47]. Numbers in parentheses give percentages relative to all regions of the respective type. ‘Total’ gives the total number of representatives of the respective type.
In total, we found 283 5’-sensing-dependent PSS (|log2FC| > 1 and p.adj < 0.05, subsets of most strongly affected PSS and transcripts in Supp. Tables S3 and S4 and the full list of differentially expressed transcripts and PSS in Supp. Tables S5 to S12). Many of these PSS overlapped with general RNase-E-dependent PSS previously identified by TIER-seq (Supp. Figure S5, Supp. Results S1) [Citation41]. We also identified so far unknown targets of RNase E, and 5’-sensing-dependent PSS, such as in mRNAs encoding thioredoxin (trxA), a phycobilisome core-membrane linker (apcE), the ATP synthase A chain of CF(0) (atpI), the PII-like signalling protein SbtB (sbtB), and the polycistronic mRNA encoding Rubisco large and small subunits as well as Rubisco chaperone RbcX (rbcLXS). All these transcripts encode proteins with central functions in the cyanobacterial light and dark metabolism.
Both sets of PSS with higher counts in rne(WT) or rne(5p) resembled the sequence logo identified for Synechocystis RNase E previously [Citation41] (Supp. Figure S6A, B). PSS enriched in rne(WT) showed a preference for single-stranded regions (Supp. Figure S6C).
Due to the low number of replicates for rne(5p), it is likely that the RNA-seq analysis lacks statistical power and therefore only identifies the 5’-sensing-dependent PSS with the strongest effect size. Therefore, the actual number of 5’-sensing-dependent PSS might be higher.
Overexpression of the rne-rnhB operon led to increased copy numbers of pSYSA and pSYSM plasmids
The rne-rnhB operon appeared to be overexpressed in the plasmid-based rne(WT) and rne(5p) strains compared to WT on RNA level (Figure S2C and S2D) and at the protein level compared to the strain in which the rne gene on the chromosome was modified to produce 3×FLAG tagged protein (Figure S2E). RNase E and most likely also RNase HII were overexpressed to a similar extent in rne(WT) and rne(5p), as judged by their similar signal intensities.
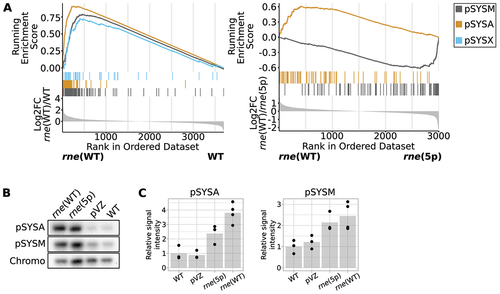
The Synechocystis genome consists of a chromosome and seven plasmids [Citation43]. In our RNA-seq analysis, we mapped reads to the chromosome and the four major plasmids pSYSA, pSYSM, pSYSG and pSYSX. We observed a general upregulation of transcripts derived from plasmids pSYSA, pSYSM and pSYSX in rne(WT) compared to WT (, left side). This effect was more pronounced in rne(5p) for pSYSM and in rne(WT) for pSYSA (, right side; Supp. Tables S13 and S14). pSYSX transcript levels were not significantly influenced by the inactivation of 5’ sensing. Transcript level differences between different strains were not reflected by the distribution of PSS on the chromosome compared to the four analysed plasmids (Supp. Figure S7, Supp. Table S15). Hence, we assumed that these differences were not based on a general preference of RNase E to process plasmid- or chromosome-derived transcripts alone, but that increased plasmid copy numbers contributed to a generally higher level of these plasmid-derived transcripts. To test this, we performed Southern blot and qPCR analyses ( and Supp. Figure S8). Indeed, pSYSA and pSYSM levels were elevated in rne(WT) and rne(5p) compared to WT and the empty-vector control strain pVZΔKmR.
Figure 4. Effect of overexpression of the rne-rnhB operon on the transcriptome and copy number of plasmids pSYSA and pSYSM. (A) Gene set enrichment analysis (GSEA) comparing enrichment of transcripts derived from different replicons. Transcript reads were assigned to transcriptional units (TUs). Those were ranked by log2FC values, as depicted in the lowest part of the diagram. The middle part shows which TUs are encoded by which replicon and the top part shows the running enrichment score associated with a replicon. This was calculated by testing the overrepresentation of a term compared to a random background distribution. Data are only shown for replicons with significant differences between strains (compare Supp. Tables S13 and S14). (B) Southern blot comparing relative amounts of pSYSA, pSYSM and chromosomal DNA in different strains. DNA was digested with HindIII restriction enzyme. One representative analysis is shown (n = 3). Chromo: hybridisation signal corresponding to chromosomal DNA. (C) Quantification of hybridisation signals for pSYSA and pSYSM, normalised by chromosomal hybridisation signal. Dots represent biological replicates, gray bars the means of replicates, normalised to the WT values. pSYSA signal detected in rne(5p) and rne(WT) was significantly higher than in WT or the empty-vector control (p.adj < 0.05) as well as pSYSM signal detected in rne(WT) compared to WT (p.adj < 0.05). pVZ: empty vector control strain pVZΔKmR.
rRNA and tRNA maturation as well as levels of transcripts encoding several ribosomal proteins are dependent on RNase E 5’ sensing
Several tRNAs have been identified as putative targets of RNase E 5’ sensing (). Peaks included positions both with a higher and with a lower read count in rne(5p) compared to rne(WT) (). These PSS mapped both 5’ and 3’ of the mature tRNAs and in two instances (tRNASerUGA and tRNAAspGUC), exactly one nt downstream of the mature 3’ end (, Supp. Figure S9A). Several of these RNase-E-dependent PSS were located precisely at the 5’ ends of mature tRNAs (, ). We mapped a 5’-sensing-dependent PSS to the 6803t14 locus, which encodes the tRNAGluUUC (). This glutamyl-tRNA is of interest beyond its role in translation, because it activates glutamate as the first committed precursor for tetrapyrrole biosynthesis in plants, cyanobacteria and many other bacteria as well as Archaea [Citation66–68]. The PSS peak, which is located at the 5’ end of mature tRNA, was clearly reduced in rne(5p) compared to rne(WT) (, ). A similar reduction was observed when RNase E activity was lowered in the strain with the temperature-sensitive RNase E (Supp. Figure S9B). Additionally, we tested the effect in strain rne(WT) compared to WT by northern blot hybridisation using a probe against the 5’ region of the tRNA precursor. We detected signals with similar intensities for the expected sizes of full-length precursor molecules in both WT and rne(WT) (Supp. Figure S9C), indicating that the transcription of the precursors was not affected by RNase E overexpression. However, a processing intermediate accumulated in rne(WT) compared with WT (Supp. Figure S9C).
Figure 5. Impact of RNase E on rRNA and tRNA maturation. (A) RNA-seq data for tRNAGluUUC (6803t14). The PSS peak, which is located at the 5’ end of mature tRNA, was reduced in rne(5p) compared to rne(WT) (log2FC(rne(WT)/rne(5p) = 1.6, p.adj = 0.015). (B) RNA-seq data for 5S rRNA (rrn5Sb). Dashed vertical lines indicate the 5S rRNA 5’ end detected in WT and rne(WT). Solid vertical lines indicate the 3’ ends of 5S rRNA detected in WT and rne(WT) (left) or rne(5p) (right). Stars (*) indicate the transcript boundaries used for in vitro cleavage assays (see 5C). Cleavage sites P1, P2 and P3 are displayed in the diagrams underneath by black, blue and orange peaks, respectively, representing 5’-P (PSS) RNA ends. Transcriptome coverage is given on top for the three indicated strains. Transcriptome coverage and PSS represent the average of normalised read counts of the investigated replicates for the indicated strains. Small grey arrows indicate strand orientation. Further details are provided in Supp. Results S2. (C) In vitro cleavage assay of a 209 nt 5S rRNA precursor equivalent to the E. coli 9S RNA. Transcript boundaries were determined according to the RNA-seq transcript coverage (). Assays were conducted on transcripts with either 5’-triphosphorylated (5’PPP) or 5’-monophosphorylated (5’P) ends with Synechocystis wild-type RNase E (WT), or enzymes harbouring the amino acid exchanges T161V (5p) or D296N (inactive enzyme). One representative urea-containing polyacrylamide gel is shown (n = 3). M: marker. (D) Gene set enrichment analysis (GSEA) using KEGG terms and unspecified transcript reads mapped to CDS. Detected CDS were ranked by their log2FC values (lowest part of the diagram). KEGG pathways are colour-coded and the middle part of the diagram illustrates where CDS belonging to a specific KEGG pathway are located within the ranked list. The upper most part shows the running enrichment score, i.e. the enrichment of a KEGG pathway compared to a random distribution over the whole ranked list. The non-redundant KEGG pathway ‘ribosome’ with a significant enrichment score is shown (compare Supp. Tables S13 and S14).
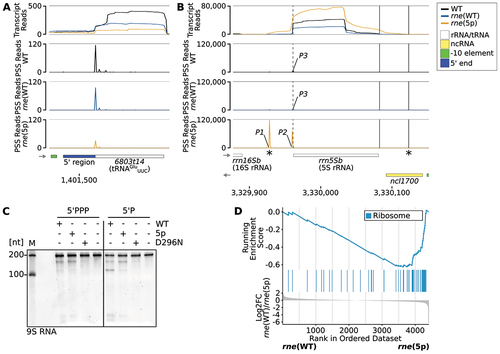
Table 3. Processing sites (PSS) in tRNAs differentially regulated between rne(WT) and rne(5p) with |log2FC|>1.5 and adjusted p.adj values < 0.05. The corresponding transcriptional units (TU) are indicated according to Kopf et al. [Citation50].
Several 5’-sensing-dependent PSS mapped to the precursor transcript from which 16S rRNA, the tRNAIleGAU, 23S rRNA and 5S rRNA are matured (, Supp. Results S2). We observed 5S rRNA precursors accumulating in the 5’ sensing mutant, both in a urea-containing PAA gel of total RNA stained with ethidium bromide and by northern blot hybridisation (). We performed sequence and structure comparisons between E. coli and Synechocystis 5S rRNA precursors (Supp. Results S2, Supp. Figure S10). Based on these and the RNA-seq data presented above, RNase E seems to act on a 5S rRNA precursor beginning 34 nt upstream of mature 5S rRNA (PSS P1), leading to a precursor that is one nt longer (P2) than the mature molecule (P3). The respective cleavage corresponds to the E. coli cleavage site a within the 9S RNA, one of the 5S rRNA precursors (Supp. Figure S10) [Citation69,Citation70]. This analysis also indicated an RNase E cleavage event downstream of the mature 5S rRNA, reminiscent of the E. coli 9S RNA cleavage site b (Supp. Figure S10) [Citation69,Citation70]. The sequencing protocol we used, tagRNA-seq, can only detect stable 5’ ends derived from processing events, but not 3’ ends. This is most likely the reason why no PSS corresponding to E. coli cleavage site b was detected. However, there seems to be a drop of transcript read 3’ ends at the expected position. This might indicate that this cleavage is conserved in Synechocystis. Through in vitro cleavage assays, we verified the direct action of RNase E on the Synechocystis 5S rRNA precursor, which corresponds to the E. coli 9S RNA (). Notably, we also observed 5’-sensing-dependent PSS within several mRNAs encoding ribosomal proteins (Supp. Table S12). Additionally, we evaluated how the introduction of the T161V exchange affected the transcriptome in comparison to WT using gene set enrichment analyses (GSEA) [Citation52]. For GSEA, the detected transcripts were ranked according to the log2FC comparing two different strains. In a second step, it was tested if transcripts associated with a certain category, e.g. KEGG pathways or GO terms, were enriched in a specific part of this ranked list compared to an assumed random background distribution. Transcripts encoding ribosomal proteins were downregulated in rne(5p) compared to rne(WT) (, Supp. Table S16).
RNA processing events highlight the role of 5’ sensing
Several studies have strongly suggested an autoregulatory function of cyanobacterial RNase E on its own mRNA [Citation40,Citation41,Citation60,Citation71], similar to E. coli [Citation72]. We observed a 5’-sensing-dependent PSS in the 5’ UTR of rne (). The accumulation of PSS in rne(5p) relative to rne(WT) suggests that 5’ sensing plays an important role in further processing of the respective RNA fragment. A recent study mapped RNase E cleavage sites to the same positions within an A/U-rich region by combining 3’ RACE and in vitro cleavage assays [Citation60]. Furthermore, we mapped four RNase-E-dependent cleavage sites between 9 and 39 nt downstream of the described positions using TIER-seq [Citation41]. Although the PSS exhibited a higher read count in rne(5p) compared to rne(WT), there was no discernible impact on the subsequent transcript levels of the rne and rnhB coding sequences ().
Figure 6. Examples of 5’-sensing-dependent cleavage events. RNA-seq data for: (A) The 5’ UTR of rne. Low transcript read counts in the immediate vicinity of the 5’ end of the rne coding sequence are an artefact due to the introduced 3×FLAG sequence in rne(WT) and rne(5p), which is missing in the sequence to which the reads were mapped. The prominent 5’-sensing-dependent PSS, which is marked by an asterisk, is located at position 92,762. (B) The gene atpT including its 5’ and 3’ UTR and verification by in vitro cleavage assay. (C) The pmgR1 gene and in vitro cleavage assay with the encoded sRNA PmgR1. (D) The gifB gene including its 5’ UTR and the asRNA located downstream, slr1596-as; below in vitro cleavage assay with the 5’ UTR of gifB. (E) The 5’ UTR of lsiR, including the sRNA CsiR; below in vitro cleavage assay with the CsiR1-lsiR transcript. (a-e) Transcriptome coverage is given on top for the three indicated strains. Cleavage sites are displayed in diagrams below by black, blue and orange peaks, representing 5’-P (PSS) detected in the three different strains. 5’-PPP (TSS) may be converted to 5’-P RNA ends in vivo or during RNA-seq library preparation. Thus, TSS are partially detected in the PSS signal. Positions that were classified as TSS are indicated by ‘TSS’ next to the respective peaks. Transcriptome coverage and cleavage sites (PSS) represent the average of normalised read counts of the investigated replicates. Small grey arrows indicate strand orientation. CDS: coding sequences, UTR: untranslated region, ncRNA: sRNAs and asRNAs. In vitro cleavage assays comparing the processing of several transcripts (either 5’-triphosphorylated (5’PPP), 5’-monophosphorylated (5’P) or 5’-hydroxylated (5’OH)) by Synechocystis wild-type RNase E (WT), or enzymes harbouring the amino acid exchanges T161V (5p) or D296N. Cleavage assays are representative results of 3 to 4 replicates. M: marker.
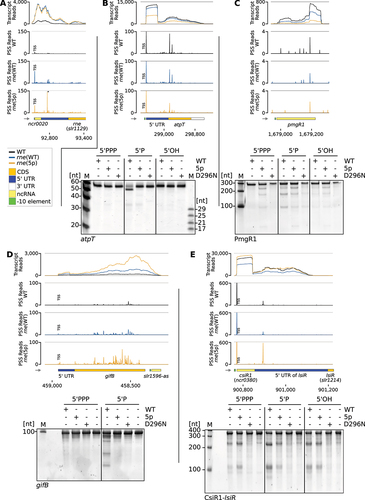
Potential targets of RNase E included the atpT transcript, the sRNA PmgR1 and the 5’ UTR of gifB (), which substantiates previously published results [Citation41]. The atpT transcript encodes the cyanobacterial ATP synthase inhibitory factor AtpΘ [Citation73]. For the atpT transcript, post-transcriptional regulation was identified as the main level of control [Citation74]. The observed 5’-P-dependent cleavage occurs 25 nt downstream of the start codon (Supp. Tables S10 and S12), effectively inactivating the mRNA. PmgR1 is an sRNA required for photomixotrophic growth [Citation75]. The gene gifB encodes the glutamine synthetase inactivating factor IF17. Notably, its 5’ UTR contains a glutamine riboswitch [Citation76]. When tested in vitro, all three transcripts were cleaved by RNase E in a 5’ phosphorylation dependent manner and cleavage patterns differed between wild-type RNase E and RNase E with the amino acid exchange T161V (). Furthermore, we observed a 5’-sensing-dependent PSS in the 5’ UTR of pirA (Supp. Table S10). Both gifB and pirA encode small protein regulators of nitrogen assimilation [Citation77,Citation78]; therefore, their identification as RNase E targets (Supp. Table S10) adds this RNase to the elements that control this important part of primary metabolism.
The CsiR1-lsiR transcript comprises the sRNA CsiR1 (SyR14, ncr0380) and mRNA lsiR (slr1214), encoding the CheY-like PATAN domain response regulator LsiR. The transcript level responds to the availability of inorganic carbon, UV-A illumination and ethylene [Citation79–82]. LsiR plays a role in the control of negative phototaxis [Citation80–82]. Under certain growth conditions, CsiR1 accumulates differentially to the downstream mRNA encoding lsiR [Citation50]. A 5’-sensing- dependent PSS located in the region between CsiR1 and lsiR indicated that RNase E might play a role in the differential accumulation of both parts of the transcript (). Indeed, the 5’ UTR of lsiR, including CsiR, was also an in vitro target of RNase E and showed a changed processing pattern dependent on its 5’ phosphorylation status ().
Discussion
5’ sensing as an important factor for RNA target recognition for Synechocystis RNase E
Systematic studies on the prevalence and relevance of the 5’ sensing function of RNase E have rarely been performed. To the best of our knowledge, the only transcriptome-wide study exploring the impact of 5’ sensing was performed by Clarke et al. [Citation8]. They incubated total E. coli RNA with the N-terminal half of E. coli RNase E harbouring the amino acid exchange T170V in vitro. They identified 5’-sensing-dependent RNase E cleavage sites by performing RNA-seq on samples collected before and after the incubation.
Here, engineering of a 5’ sensing deficient RNase E mutant in Synechocystis enabled us to investigate the role of 5’ sensing in cyanobacteria in vivo. Homozygous clones carrying the mutation leading to T161V were only obtained when the rne-rnhB operon was expressed from a plasmid vector, but not following integration into a neutral site in the chromosome. Hence, a higher level of mutated RNase E due to expression from a plasmid was required to establish a viable mutant strain, pointing at an important role of 5’ sensing for enzyme function. Moreover, all transcripts selected for in vitro analysis showed a changed processing pattern between the wild-type and the 5’-sensing-deficient enzyme and depending on the 5’ phosphorylation status (). This underlines the role of 5’ sensing for enzyme function and cleavage site positioning, i.e. the choice of the exact nucleotide position where the enzyme cuts.
However, compared to the impact of transient RNase E inactivation [Citation41], only a small number of PSS changed when comparing rne(5p) and control strain rne(WT) (Supp. Results S1, Supp. Figure S5). This is in line with findings in E. coli that many transcripts can be cleaved by RNase E irrespective of their 5’-phosphorylation status [Citation8]. Notably, PSS associated with the maturation of crRNAs from the CRISPR3 array were not affected by the introduced point mutation (Supp. Figure S3), albeit responding strongly to RNase E overexpression in both rne(WT) and rne(5p) compared to WT, as well as to transient RNase E inactivation [Citation41]. The enhanced levels of these mature crRNA species are consistent with RNase E being an important limiting factor for their accumulation [Citation23].
Conversely, the action of RNase E on certain other substrates, such as the rne 5’ UTR, was specifically impeded by the mutation present in rne(5p) (). Thus, alternative target recognition determinants also seem to exist for Synechocystis RNase E, despite the lack of the long C-terminal half typical of E. coli RNase E, which was speculated to be involved in the respective recognition mechanisms [Citation5,Citation17,Citation32] (). Notably, protein-protein interaction sites for DEAD-box helicase CrhB and RNase II were mapped to the N-terminal, catalytic domain of RNase E of the cyanobacterium Anabaena (Nostoc) sp. PCC 7120 [Citation24,Citation25]. In E. coli, the analogous binding site for helicase RhlB is located within the C-terminal domain [Citation39]. Hence, despite the compact character of the cyanobacterial RNase E, many aspects of E. coli RNase E seem to be conserved in the cyanobacterial enzyme homologues and are fulfilled by regions within the N-terminal half of the enzyme.
Evidence for plasmid copy number control by RNase E and/or RNase HII
We observed a general upregulation of plasmid-derived transcripts in rne(WT) and in rne(5p) compared to WT (). This was most pronounced for pSYSA and pSYSM, which together harbour a total of 232 protein-coding genes [Citation83] that are transcribed in 229 discernible transcriptional units [Citation50]. In each case, we detected an increased copy number of these two plasmids relative to the chromosome, with up to a ~ 2.4 higher copy number for pSYSM and ~ 3.8 fold higher copy number for pSYSA (in both cases comparing rne(WT) to WT and pVZΔKmR) (, Supp. Figure S8). Somewhat lower, but also clearly increased copy numbers were observed when comparing rne(5p) to WT and the empty vector control pVZΔKmR. We conclude that overexpression of RNase E and/or RNase HII from the introduced rne-rnhB operon leads to increased pSYSA and pSYSM copy numbers. E. coli homologues of both enzymes play a decisive role in the copy number regulation of ColE1 and ColE2-type plasmids by processing pairs of overlapping non-coding RNAs, of which one can then prime replication [Citation84–86]. Indeed, ssr7036 mRNA and asRNA1, a similar pair of abundant overlapping transcripts were identified on pSYSA and verified as substrates for RNase E [Citation87]. Furthermore, their manipulation led to divergent pSYSA copy numbers [Citation87], consistent with our observations.
Inactivating 5’ sensing in vivo identifies RNase E targets and elucidates functions of RNase E in cyanobacteria
Analysing the impact of decreased 5’ sensing, we identified previously unknown targets of and processing events dependent on RNase E in Synechocystis (Supp. Tables S3 and S10, ). Changes in rRNA and tRNA maturation in the 5’ sensing RNase E mutant demonstrate that these functions of RNase E, known from analyses in E. coli [Citation5,Citation7,Citation9,Citation88], are conserved in cyanobacteria (, Supp. Results S2, Supp. Figure S9 and S10). Moreover, the identification of 5’-sensing-dependent PSS in ribosomal protein coding sequences and the overall effect on ribosomal protein transcript abundance suggests that Synechocystis RNase E plays a direct role in regulating the expression of ribosomal proteins (Supp. Table S10, ). This is consistent with the fact that E. coli RNase E acts on rpsO and rpsT mRNAs, which encode the 30S ribosomal proteins S15 and S20 [Citation5,Citation89]. Also in Arabidopsis thaliana chloroplasts, RNase E was found to have an important function in processing of ribosomal protein mRNAs [Citation90]. Additionally, Synechocystis RNase E co-fractionated with ribosome subunits and ribosomal proteins during the separation of native ribonucleoprotein complexes by sucrose density gradient ultracentrifugation [Citation91]. The multiple functions of RNase E in rRNA maturation, tRNA processing, as well as acting on mRNAs encoding ribosomal proteins might hint towards RNase E being a factor for coordinating ribosome assembly, correct stoichiometry of different ribosomal subunits, and/or controlling translational activity.
In addition, we found that the transient inactivation of RNase E affected the expression of sigA, which encodes the housekeeping sigma factor in Synechocystis [Citation41]. This might be mediated by a highly transcribed asRNA complementary to the 3’ end of the sigA transcript [Citation41]. Combined with the potential regulatory role of RNase E in ribosome assembly and hence of translational activity, this might indicate that RNase E intertwines RNA metabolism and translation.
Recently, Mohanty and Kushner [Citation9] found that E. coli RNase E plays an important role in the processing of the alaW alaX operon. Interestingly, this processing was not abolished in a mutant strain encoding thermosensitive RNase E. Since transcriptome-wide studies identifying RNase-E-dependent processing sites commonly use thermosensitive strains, this implies that these miss a subset of RNase-E-dependent processing events [Citation8,Citation16,Citation41,Citation92]. Employing a 5’-sensing-deficient RNase E mutant strain might help to provide a more complete picture of processing sites.
Neither decreased 5’ sensing nor RNase E overexpression affected PSS abundance or PSS/TSS ratios at TSS positions (Supp. Figure S4). This is consistent with our prior finding that RNase E does not seem to be rate-limiting for 5’-end-dependent RNA degradation and further hints at a central role of RNase J in general RNA degradation, or a redundant action of RNase E and RNase J therein [Citation41]. Notably, RNase J shares a high affinity towards 5’-P RNA with RNase E and has been shown to process some RNAs similar to RNase E in vitro [Citation40]. Hence, it is conceivable that RNase J and RNase E might partially act on the same substrates. In the absence of RNase E 5’ sensing, an RNA fragment that depends on this activity does not accumulate if there is sufficient RNase J activity. In this case, we would not detect this substrate in the described data set.
A notable proportion of transcript types and segments most strongly affected by decreased 5’ sensing are non-coding, potentially regulatory elements, e.g. asRNAs, sRNAs or 5’ UTRs (Supp. Table S4). These might be directly regulated by RNase E, consistent with known functions of Synechocystis RNase E [Citation35,Citation37]. The analysed data set identified many interesting RNase-E-dependent cleavage sites, which await further characterisation, such as sites located within the allophycocyanin (apcABCZ) operon upstream of the sRNA ApcZ [Citation93] and within the grpE gene (Supp. Results S3, Supp. Figure S11). Although the exact mechanisms and physiological impacts of these cleavage events remain to be elucidated, our findings hint strongly at a general regulatory role of RNase E in cyanobacteria. Compared to the significant impact on transcripts and their processing observed when the 5’ sensing function of RNase E is diminished, the physiological effects were relatively less noticeable. The mutants exhibited mild phenotypic effects under moderate continuous light conditions (). However, when the cells were subjected to changing conditions, such as light-dark cycles, the function of RNase E seems to become more important for the growth of cells (). This observation is consistent with the idea that changes in environmental conditions require transcriptome remodelling in which RNase E is crucially involved by facilitating the initial steps in RNA degradation [Citation94]. The transcriptome shifts especially dramatic in light-dark cycles, when up to 40% of all Synechocystis genes show a robust diurnal expression rhythm [Citation95]. Notably, rne transcription was also affected in Synechocystis in clock mutants [Citation45]. Comparison of the growth under different conditions of mutant strains to the WT, revealed that the application of glucose in light-dark cycles had the strongest effect on the growth of rne(5p). A similar phenotype has been described for Synechocystis mutants lacking genes encoding components of the circadian clock [Citation96], the sRNA Ncr0700/PmgR1 [Citation75]; or alternative sigma factors [Citation97], regulatory factors which all target a large number of genes. However, due to the large variety of transcript types and segments affected by RNase E, we are not able to relate growth defects with any specific targets.
We show that RNase E is involved in the maturation of several tRNAs in vivo (, ). The involvement of RNase E in the initial processing of tRNA precursors has been reported in E. coli, where RNase E activity provides the substrates for further maturation by RNase P and the 3′ exoribonucleases [Citation98]. The most striking example of RNase E involvement in the maturation of tRNA precursors is the one-step endonucleolytic cleavage immediately after the CCA determinant yielding mature tRNAs for three different proline tRNA species in E. coli [Citation99,Citation100]. Here, we present evidence for the involvement of RNase E in the accurate 5’ maturation of the glutamyl-tRNA tRNAGluUUC by RNase E (). This particular tRNA is of great interest because it has a two-fold role: in addition to its function in translation, it activates the amino acid glutamate as the precursor of tetrapyrrole synthesis. Hence, all cytochromes, tetrapyrroles, and especially haem and chlorophylls are derived from glutamate activated via binding to this tRNA [Citation67,Citation101,Citation102]. This pathway is present in cyanobacteria, plants, many bacteria and Archaea. In Synechocystis, this pathway was demonstrated to be the sole biosynthetic pathway for tetrapyrrole biogenesis, and only one corresponding glutamyl-tRNA gene is present in the genome [Citation68,Citation103,Citation104]. It is very well established that mature tRNA 5’ ends are generated by RNase P [Citation105]. Why did RNase E evolve in certain cyanobacteria to participate in the maturation of this tRNA? Previously, a deviant consensus was described for the maturation of the tRNAGluUUC 5’ end generated by RNase P in cyanobacteria and chloroplasts. This tRNA differs in cyanobacteria and chloroplasts from the eubacterial tRNA consensus in the presence of a unique A53:U61 instead of the otherwise canonical G53:C61 base pair at the distal end of the T stem [Citation67,Citation68]. The participation of the T stem in substrate binding to the RNase P ribozyme has been established for RNase P RNA from various structural classes [Citation106,Citation107]. It was demonstrated that this difference makes cyanobacterial and chloroplast tRNAs less suitable substrates for RNase P from these organisms and that the experimental replacement of A53:U61 by G53:C61 improved product formation [Citation108,Citation109]. Under standard growth conditions, there appeared to be no effect of the absence of RNase E 5’ sensing on the chlorophyll content of the cell (). Nevertheless, it is evident that in an environment with rapidly changing conditions cells may struggle to adapt their tetrapyrrole synthesis rapidly enough and therefore exhibit reduced growth compared to the WT. Because of the pleiotropic characteristics of the 5’ sensing mutation, it is currently challenging to distinguish between the specific and non-specific consequences of changes in RNA metabolism and the resulting phenotypes.
Plant chloroplasts harbour a close homologue of cyanobacterial glutamyl-tRNA as well as RNase E [Citation38]. Therefore, the investigation of this relation and its physiological relevance beyond Synechocystis or cyanobacteria is an interesting topic for future research. Generally, RNase E from Synechocystis is a well-suited model to study RNA maturation and degradation in bacteria as it can be efficiently produced as an enzymatically active recombinant protein and appears to share substantial substrate preferences with its enterobacterial homologues despite its more compact nature. Exploring the phylogenetic diversity of different RNase E homologues and specifically inactivating 5’ sensing will help to elucidate how this multi-faceted enzyme recognises its target molecules.
Abbreviations
| 5’-OH | = | 5’-hydroxylated |
| 5’-P | = | 5’-monophosphorylated |
| 5’-PPP | = | 5’-triphosphorylated |
| asRNAs | = | antisense RNAs |
| CDS | = | coding sequences |
| crRNA | = | CRISPR crRNAs |
| E. coli | = | Escherichia coli |
| nt | = | nucleotides |
| PC1 | = | principal component 1 |
| PC2 | = | principal component 2 |
| PCA | = | principal component analysis |
| PSS | = | processing site |
| RNase | = | ribonuclease |
| sRNA | = | small regulatory RNA |
| Synechocystis | = | Synechocystis sp. PCC 6803 |
| TIER-seq | = | transient inactivation of an essential ribonuclease followed by sequencing |
| TSS | = | transcriptional start site |
| UTR | = | untranslated region |
| WT | = | wild-type Synechocystis |
Supplemental file.pdf
Download PDF (18.3 MB)Acknowledgments
We thank J. Behler, T. Wallner, P. Schwenk, M. Treppner and N. Schuergers for fruitful discussions. We are grateful to W. Bigott for technical assistance. The authors acknowledge the support of the Freiburg Galaxy Team: Björn Grüning, Bioinformatics, University of Freiburg (Germany) funded by the Collaborative Research Centre 992 Medical Epigenetics (Deutsche Forschungsgemeinschaft [SFB 992/1 2012]) and Bundesministerium für Bildung und Forschung BMBF grant 031 A538A de.NBI-RBC.
Disclosure statement
No potential conflict of interest was reported by the author(s).
Data availability statement
FastQ files from RNA sequencing were deposited in the Gene Expression Omnibus (GEO) Data bank under accession number GSE184824. Galaxy workflows used for raw read processing and several downstream analysis steps are available online: https://usegalaxy.eu/u/ute-hoffmann/w/5sens-seq-preprocessing, https://usegalaxy.eu/u/ute-hoffmann/w/5sensing-pss-tss, https://usegalaxy.eu/u/ute-hoffmann/w/5sensing-transcript, https://usegalaxy.eu/u/ute-hoffmann/w/5sensing-transcript-coverage
All further codes used for data processing and analysis are available online in the GitHub and Zenodo repositories (https://github.com/ute-hoffmann/5sensing_Synechocystis, https://doi.org/10.5281/zenodo.7509657).
Supplemental data
Supplemental data for this article can be accessed online at https://doi.org/10.1080/15476286.2024.2328438.
Additional information
Funding
References
- Laalami S, Zig L, Putzer H. Initiation of mRNA decay in bacteria. Cell Mol Life Sci. 2014;71(10):1799–1828. doi: 10.1007/s00018-013-1472-4
- Hui MP, Foley PL, Belasco JG. Messenger RNA degradation in bacterial cells. Ann Rev Genet. 2014;48(1):537–559. doi: 10.1146/annurev-genet-120213-092340
- Tejada-Arranz A, de Crécy-Lagard V, de Reuse H. Bacterial RNA degradosomes: molecular machines under tight control. Trends Biochem Sci. 2020;45(1):42–57. doi: 10.1016/j.tibs.2019.10.002
- Ono M, Kuwano M. A conditional lethal mutation in an Escherichia coli strain with a longer chemical lifetime of messenger RNA. J Mol Biol. 1979;129(3):343–357. doi: 10.1016/0022-2836(79)90500-X
- Garrey SM, Mackie GA Roles of the 5’-phosphate sensor domain in RNase E. Mol Microbiol. 2011;80(6):1613–1624. doi: 10.1111/j.1365-2958.2011.07670.x
- Garrey SM, Blech M, Riffell JL, et al. Substrate binding and active site residues in RNases E and G. J Biol Chem. 2009;284(46):31843–31850. doi: 10.1074/jbc.M109.063263
- Kime L, Clarke JE, Romero AD, et al. Adjacent single-stranded regions mediate processing of tRNA precursors by RNase E direct entry. Nucleic Acids Res. 2014;42(7):4577–4589. doi: 10.1093/nar/gkt1403
- Clarke JE, Kime L, Romero AD, et al. Direct entry by RNase E is a major pathway for the degradation and processing of RNA in Escherichia coli. Nucleic Acids Res. 2014;42(18):11733–11751. doi: 10.1093/nar/gku808
- Mohanty BK, Kushner SR. Processing of the alaW alaX operon encoding the Ala2 tRNAs in Escherichia coli requires both RNase E and RNase P. Mol Microbiol. 2022;118(6):698–715. doi: 10.1111/mmi.14991
- Gurevitz M, Jain SK, Apirion D. Identification of a precursor molecule for the RNA moiety of the processing enzyme RNase P. Proc Natl Acad Sci. 1983;80(14):4450. doi: 10.1073/pnas.80.14.4450
- Lundberg U, Altman S Processing of the precursor to the catalytic RNA subunit of RNase P from Escherichia coli. RNA. 1995;1(3):327–334.
- Lin-Chao S, Wei C-L, Lin Y-T. RNase E is required for the maturation of ssrA RNA and normal ssrA RNA peptide-tagging activity. Proc Natl Acad Sci. 1999;96(22):12406–12411. doi: 10.1073/pnas.96.22.12406
- Kim K-S, Lee Y Regulation of 6S RNA biogenesis by switching utilization of both sigma factors and endoribonucleases. Nucleic Acids Res. 2004;32(20):6057–6068. doi: 10.1093/nar/gkh939.
- Miyakoshi M, Chao Y, Vogel J. Cross talk between ABC transporter mRNAs via a target mRNA-derived sponge of the GcvB small RNA. EMBO J. 2015;34(11):1478–1492. doi: 10.15252/embj.201490546
- Chao Y, Vogel J A 3’ UTR-Derived small RNA provides the regulatory noncoding arm of the inner membrane stress response. Mol Cell. 2016;61(3):352–363. doi: 10.1016/j.molcel.2015.12.023.
- Chao Y, Li L, Girodat D, et al. In vivo cleavage map illuminates the central role of RNase E in coding and non-coding RNA pathways. Mol Cell. 2017;65(1):39–51. doi: 10.1016/j.molcel.2016.11.002
- Bandyra KJ, Wandzik JM, Luisi BF Substrate recognition and autoinhibition in the central ribonuclease RNase E. Mol Cell. 2018;72(2):275–285.e4. doi: 10.1016/j.molcel.2018.08.039.
- Bandyra KJ, Said N, Pfeiffer V, et al. The seed region of a small RNA drives the controlled destruction of the target mRNA by the endoribonuclease RNase E. Mol Cell. 2012;47(6):943–953. doi: 10.1016/j.molcel.2012.07.015
- Callaghan AJ, Marcaida MJ, Stead JA, et al. Structure of Escherichia coli RNase E catalytic domain and implications for RNA turnover. Nature. 2005;437(7062):1187–1191. doi: 10.1038/nature04084.
- Aït-Bara S, Carpousis AJ. RNA degradosomes in bacteria and chloroplasts: classification, distribution and evolution of RNase E homologs. Mol Microbiol. 2015;97(6):1021–1135. doi: 10.1111/mmi.13095
- Clarke JE, Sabharwal K, Kime L, et al. The recognition of structured elements by a conserved groove distant from domains associated with catalysis is an essential determinant of RNase E. Nucleic Acids Res. 2023;51(1):365–379. doi: 10.1093/nar/gkac1228
- Zhang J-Y, Deng X-M, Li F-P, et al. RNase E forms a complex with polynucleotide phosphorylase in cyanobacteria via a cyanobacterial-specific nonapeptide in the noncatalytic region. RNA. 2014;20(4):568–579. doi: 10.1261/rna.043513.113
- Behler J, Sharma K, Reimann V, et al. The host-encoded RNase E endonuclease as the crRNA maturation enzyme in a CRISPR–cas subtype III-Bv system. Nat Microbiol. 2018;3(3):367–377. doi: 10.1038/s41564-017-0103-5
- Yan H, Qin X, Wang L, et al. Both enolase and the DEAD-Box RNA helicase CrhB can form complexes with RNase E in Anabaena sp. Strain PCC 7120. Appl Environ Microbiol. 2020;86(13):e00425–20. doi: 10.1128/AEM.00425-20
- Zhou C, Zhang J, Hu X, et al. RNase II binds to RNase E and modulates its endoribonucleolytic activity in the cyanobacterium Anabaena PCC 7120. Nucleic Acids Res. 2020;48(7):3922–3934. doi: 10.1093/nar/gkaa092
- Jourdan SS, McDowall KJ Sensing of 5’ monophosphate by Escherichia coli RNase G can significantly enhance association with RNA and stimulate the decay of functional mRNA transcripts in vivo. Mol Microbiol. 2008;67(1):102–115. doi: 10.1111/j.1365-2958.2007.06028.x
- Kime L, Jourdan SS, Stead JA, et al. Rapid cleavage of RNA by RNase E in the absence of 5’ monophosphate stimulation. Mol Microbiol. 2010;76(3):590–604. doi: 10.1111/j.1365-2958.2009.06935.x
- Mackie GA Determinants in the rpsT mRNAs recognized by the 5’-sensor domain of RNase E. Mol Microbiol. 2013;89(2):388–402. doi: 10.1111/mmi.12283
- Babitzke P, Kushner SR. The Ams (altered mRNA stability) protein and ribonuclease E are encoded by the same structural gene of Escherichia coli. Proc Natl Acad Sci. 1991;88(1):1–5. doi: 10.1073/pnas.88.1.1
- Kaberdin VR, Walsh AP, Jakobsen T, et al. Enhanced cleavage of RNA mediated by an interaction between substrates and the arginine-rich domain of E. coli ribonuclease E. J Mol Biol. 2000;301(2):257–264. doi: 10.1006/jmbi.2000.3962
- Redko Y, Tock MR, Adams CJ, et al. Determination of the catalytic parameters of the N-terminal half of Escherichia coli ribonuclease E and the identification of critical functional groups in RNA substrates. J Biol Chem. 2003;278(45):44001–44008. doi: 10.1074/jbc.M306760200
- Anupama K, Leela JK, Gowrishankar J. Two pathways for RNase E action in Escherichia coli in vivo and bypass of its essentiality in mutants defective for Rho-dependent transcription termination. Mol Microbiol. 2011;82(6):1330–1348. doi: 10.1111/j.1365-2958.2011.07895.x
- Schilder A, Görke B. Role of the 5′ end phosphorylation state for small RNA stability and target RNA regulation in bacteria. Nucleic Acids Res. 2023;51(10):5125–5143. doi: 10.1093/nar/gkad226
- Zhang J-Y, Hess WR, Zhang C-C. “Life is short, and art is long”: RNA degradation in cyanobacteria and model bacteria. mLife. 2022;1(1):21–39. doi: 10.1002/mlf2.12015
- Horie Y, Ito Y, Ono M, et al. Dark-induced mRNA instability involves RNase E/G-type endoribonuclease cleavage at the AU-box and SD sequences in cyanobacteria. Mol Genet Genomics. 2007;278(3):331–346. doi: 10.1007/s00438-007-0254-9
- Sakurai I, Stazic D, Eisenhut M, et al. Positive regulation of psbA gene expression by cis-encoded antisense RNAs in Synechocystis sp. PCC 6803. Plant Physiol. 2012;160(2):1000–1010. doi: 10.1104/pp.112.202127
- Georg J, Dienst D, Schürgers N, et al. The small regulatory RNA SyR1/PsrR1 controls photosynthetic functions in cyanobacteria. Plant Cell. 2014;26(9):3661–3679. doi: 10.1105/tpc.114.129767
- Schein A, Sheffy-Levin S, Glaser F, et al. The RNase E/G-type endoribonuclease of higher plants is located in the chloroplast and cleaves RNA similarly to the E. coli enzyme. RNA. 2008;14(6):1057–1068. doi: 10.1261/rna.907608
- Kaberdin VR, Miczak A, Jakobsen JS, et al. The endoribonucleolytic N-terminal half of Escherichia coli RNase E is evolutionarily conserved in Synechocystis sp. and other bacteria but not the C-terminal half, which is sufficient for degradosome assembly. Proc Natl Acad Sci. 1998;95(20):11637–11642. doi: 10.1073/pnas.95.20.11637
- Cavaiuolo M, Chagneau C, Laalami S, et al. Impact of RNase E and RNase J on global mRNA metabolism in the cyanobacterium Synechocystis PCC6803. Front Microbiol. 2020;11:1055. doi: 10.3389/fmicb.2020.01055
- Hoffmann UA, Heyl F, Rogh SN, et al. Transcriptome-wide in vivo mapping of cleavage sites for the compact cyanobacterial ribonuclease E reveals insights into its function and substrate recognition. Nucleic Acids Res. 2021;49(22):13075–13091. doi: 10.1093/nar/gkab1161
- Stazic D, Lindell D, Steglich C. Antisense RNA protects mRNA from RNase E degradation by RNA–RNA duplex formation during phage infection. Nucleic Acids Res. 2011;39(11):4890–4899. doi: 10.1093/nar/gkr037
- Trautmann D, Voss B, Wilde A, et al. Microevolution in Cyanobacteria: Re-sequencing a motile substrain of Synechocystis sp. PCC 6803. DNA Res. 2012;19(6):435–448. doi: 10.1093/dnares/dss024
- Rippka R, Deruelles J, Waterbury JB, et al. Generic assignments, strain histories and properties of pure cultures of cyanobacteria. Microbiology. 1979;111(1):1–61. doi: 10.1099/00221287-111-1-1
- Köbler C, Schultz S-J, Kopp D, et al. The role of the Synechocystis sp. PCC 6803 homolog of the circadian clock output regulator RpaA in day–night transitions. Mol Microbiol. 2018;110(5):847–861. doi: 10.1111/mmi.14129
- Schindelin J, Arganda-Carreras I, Frise E, et al. Fiji: an open-source platform for biological-image analysis. Nat Methods. 2012;9(7):676–682. doi: 10.1038/nmeth.2019
- Innocenti N, Golumbeanu M, Fouquier d’Hérouël A, et al. Whole-genome mapping of 5′ RNA ends in bacteria by tagged sequencing: a comprehensive view in Enterococcus faecalis. RNA. 2015;21(5):1018–1030. doi: 10.1261/rna.048470.114
- Afgan E, Baker D, Batut B, et al. The galaxy platform for accessible, reproducible and collaborative biomedical analyses: 2018 update. Nucleic Acids Res. 2018;46(W1):W537–W544. doi: 10.1093/nar/gky379
- Kaneko T, Sato S, Kotani H, et al. Sequence analysis of the genome of the unicellular cyanobacterium Synechocystis sp. Strain PCC6803. II. Sequence determination of the entire genome and assignment of potential protein-coding regions. DNA Res. 1996;3(3):109–136. doi: 10.1093/dnares/3.3.109
- Kopf M, Klähn S, Scholz I, et al. Comparative analysis of the primary transcriptome of Synechocystis sp. PCC 6803. DNA Res. 2014;21(5):527–539. doi: 10.1093/dnares/dsu018.
- Love MI, Huber W, Anders S. Moderated estimation of fold change and dispersion for RNA-seq data with DESeq2. Genome Biol. 2014;15(12):550. doi: 10.1186/s13059-014-0550-8
- Subramanian A, Tamayo P, Mootha VK, et al. Gene set enrichment analysis: a knowledge-based approach for interpreting genome-wide expression profiles. Proc Natl Acad Sci. 2005;102(43):15545–15550. doi: 10.1073/pnas.0506580102
- Yu G, Wang L-G, Han Y, et al. clusterProfiler: an R package for comparing biological themes among gene clusters. Omics J Integr Biol. 2012;16(5):284–287. doi: 10.1089/omi.2011.0118
- Crooks GE, Hon G, Chandonia J-M, et al. WebLogo: A Sequence Logo Generator. Genome Res. 2004;14(6):1188–1190. doi: 10.1101/gr.849004
- Lorenz R, Bernhart SH, Höner Zu Siederdissen C, et al. ViennaRNA package 2.0. Algorithms Mol Biol. 2011;6(1):26. doi: 10.1186/1748-7188-6-26
- Carver T, Harris SR, Berriman M, et al. Artemis: an integrated platform for visualization and analysis of high-throughput sequence-based experimental data. Bioinf. 2012;28(4):464–469. doi: 10.1093/bioinformatics/btr703
- Madeira F, Park YM, Lee J, et al. The EMBL-EBI search and sequence analysis tools APIs in 2019. Nucleic Acids Res. 2019;47(W1):W636–W641. doi: 10.1093/nar/gkz268
- Edgar RC. MUSCLE: a multiple sequence alignment method with reduced time and space complexity. BMC Bioinf. 2004;5(1):Article 113. doi: 10.1186/1471-2105-5-113
- Waterhouse AM, Procter JB, Martin DMA, et al. Jalview version 2 - a multiple sequence alignment editor and analysis workbench. Bioinf. 2009;25(9):1189–1191. doi: 10.1093/bioinformatics/btp033.
- Watanabe S, Stazic D, Georg J, et al. Regulation of RNase E during the UV-stress response in the cyanobacterium Synechocystis sp. PCC 6803. mLife. 2023;2(1) :43–57. doi: 10.1002/mlf2.12056
- Ali N, Gowrishankar J. Cross-subunit catalysis and a new phenomenon of recessive resurrection in Escherichia coli RNase E. Nucleic Acids Res. 2020;48(2):847–861. doi: 10.1093/nar/gkz1152
- Tsunekawa K, Shijuku T, Hayashimoto M, et al. Identification and characterization of the Na+/H+ antiporter NhaS3 from the thylakoid membrane of Synechocystis sp. PCC 6803. J Biol Chem. 2009;284(24):16513–16521. doi: 10.1074/jbc.M109.001875
- Nagy C, Thiel K, Mulaku E, et al. Comparison of alternative integration sites in the chromosome and the native plasmids of the cyanobacterium Synechocystis sp. PCC 6803 in respect to expression efficiency and copy number. Microb Cell Factories. 2021;20(1):130. doi: 10.1186/s12934-021-01622-2
- Mitschke J, Georg J, Scholz I, et al. An experimentally anchored map of transcriptional start sites in the model cyanobacterium Synechocystis sp. PCC6803. Proc Natl Acad Sci. 2011;108(5):2124–2129. doi: 10.1073/pnas.1015154108
- Baumgartner D, Kopf M, Klähn S, et al. Small proteins in cyanobacteria provide a paradigm for the functional analysis of the bacterial micro-proteome. BMC Microbiol. 2016;16(1):Article 285. doi: 10.1186/s12866-016-0896-z
- Huang D-D, Wang W-Y, Gough SP, et al. δ-aminolevulinic acid-synthesizing enzymes need an RNA moiety for activity. Sci. 1984;225(4669):1482–1484. doi: 10.1126/science.6206568
- Schön A, Krupp G, Gough S, et al. The RNA required in the first step of chlorophyll biosynthesis is a chloroplast glutamate tRNA. Nat. 1986;322(6076):281–284. doi: 10.1038/322281a0
- O’Neill GP, Peterson DM, Schön A, et al. Formation of the chlorophyll precursor delta-aminolevulinic acid in cyanobacteria requires aminoacylation of a tRNAGlu species. J Bacteriol. 1988;170(9):3810–3816. doi: 10.1128/jb.170.9.3810-3816.1988
- Ghora BK, Apirion D. Structural analysis and in vitro processing to p5 rRNA of a 9S RNA molecule isolated from an rne mutant of E. coli. Cell. 1978;15(3):1055–1066. doi: 10.1016/0092-8674(78)90289-1
- Cormack RS, Mackie GA. Structural requirements for the processing of Escherichia coli 5 S ribosomal RNA by RNase E in vitro. J Mol Biol. 1992;228(4):1078–1090. doi: 10.1016/0022-2836(92)90316-C
- Stazic D, Pekarski I, Kopf M, et al. A novel strategy for exploitation of host RNase E activity by a marine cyanophage. Genetics. 2016;203(3):1149–1159. doi: 10.1534/genetics.115.183475
- Jain C, Belasco JG. RNase E autoregulates its synthesis by controlling the degradation rate of its own mRNA in Escherichia coli: unusual sensitivity of the rne transcript to RNase E activity. Genes Dev. 1995;9(1):84–96. doi: 10.1101/gad.9.1.84
- Song K, Baumgartner D, Hagemann M, et al. Atpθ is an inhibitor of F0F1 ATP synthase to arrest ATP hydrolysis during low-energy conditions in cyanobacteria. Curr Biol. 2022;32(1):136–148.e5. doi: 10.1016/j.cub.2021.10.051
- Song K, Hagemann M, Georg J, et al. Expression of the cyanobacterial F0F1 ATP synthase regulator AtpΘ depends on small DNA-binding proteins and differential mRNA stability. Microbiol Spectr. 2022;10(3):e02562–21. doi: 10.1128/spectrum.02562-21
- de Porcellinis AJ, Klähn S, Rosgaard L, et al. The non-coding RNA Ncr0700/PmgR1 is required for photomixotrophic growth and the regulation of glycogen accumulation in the cyanobacterium Synechocystis sp. PCC 6803. Plant Cell Physiol. 2016;57(10):2091–2103. doi: 10.1093/pcp/pcw128
- Klähn S, Bolay P, Wright PR, et al. A glutamine riboswitch is a key element for the regulation of glutamine synthetase in cyanobacteria. Nucleic Acids Res. 2018;46(19):10082–10094. doi: 10.1093/nar/gky709
- Bolay P, Rokhsareh R, Muro-Pastor MI, et al. The novel PII-interacting protein PirA controls flux into the cyanobacterial ornithine-ammonia cycle. MBio. 2021;12(2):e00229–21. doi: 10.1128/mBio.00229-21
- García-Domínguez M, Reyes JC, Florencio FJ. NtcA represses transcription of gifA and gifB, genes that encode inhibitors of glutamine synthetase type I from Synechocystis sp. PCC 6803. Mol Microbiol. 2000;35(5):1192–1201. doi: 10.1046/j.1365-2958.2000.01789.x
- Klähn S, Orf I, Schwarz D, et al. Integrated transcriptomic and metabolomic characterization of the low-carbon response using an ndhR mutant of Synechocystis sp. PCC 6803. Plant Physiol. 2015;169(3):1540–1556. doi: 10.1104/pp.114.254045
- Song J-Y, Cho HS, Cho J-I, et al. Near-UV cyanobacteriochrome signaling system elicits negative phototaxis in the cyanobacterium Synechocystis sp. PCC 6803. Proc Natl Acad Sci. 2011;108(26):10780. doi: 10.1073/pnas.1104242108
- Lacey RF, Binder BM. Ethylene regulates the physiology of the cyanobacterium Synechocystis sp. PCC 6803 via an ethylene receptor. Plant Physiol. 2016;171(4):2798–2809. doi: 10.1104/pp.16.00602
- Kuchmina E, Klähn S, Jakob A, et al. Ethylene production in Synechocystis sp. PCC 6803 promotes phototactic movement. Microbiology. 2017;163(12):1937–1945. doi: 10.1099/mic.0.000564
- Kaneko T, Nakamura Y, Sasamoto S, et al. Structural analysis of four large plasmids harboring in a unicellular cyanobacterium, Synechocystis sp. PCC 6803. DNA Res. 2003;10(5):221–228. do i:
- Lin-Chao S, Cohen SN. The rate of processing and degradation of antisense RNAI regulates the replication of ColE1-type plasmids in vivo. Cell. 1991;65(7):1233–1242. doi: 10.1016/0092-8674(91)90018-T
- Nishio S, Itoh T. Arginine-rich RNA binding domain and protein scaffold domain of RNase E are important for degradation of RNAI but not for that of the Rep mRNA of the ColE2 plasmid. Plasmid. 2009;62(2):83–87. doi: 10.1016/j.plasmid.2009.04.002
- Tomcsányi T, Apirion D. Processing enzyme ribonuclease E specifically cleaves RNA I: An inhibitor of primer formation in plasmid DNA synthesis. J Mol Biol. 1985;185(4):713–720. doi: 10.1016/0022-2836(85)90056-7
- Kaltenbrunner A, Reimann V, Hoffmann UA, et al. Regulation of pSYSA defense plasmid copy number in Synechocystis through RNase E and a highly transcribed asRNA. Front Microbiol. 2023;14. doi: 10.3389/fmicb.2023.1112307
- Ghora BK, Apirion D. Identification of a novel RNA molecule in a new RNA processing mutant of Escherichia coli which contains 5 S rRNA sequences. J Biol Chem. 1979;254(6):1951–1956. doi: 10.1016/S0021-9258(17)37749-9
- Régnier P, Hajnsdorf E Decay of mRNA encoding ribosomal protein S15 of Escherichia coli is initiated by an RNase E-dependent endonucleolytic cleavage that removes the 3’ stabilizing stem and loop structure. J Mol Biol. 1991;217(2):283–292. doi: 10.1016/0022-2836(91)90542-E
- Walter M, Piepenburg K, Schöttler MA, et al. Knockout of the plastid RNase E leads to defective RNA processing and chloroplast ribosome deficiency. Plant J. 2010;64(5):851–863. doi: 10.1111/j.1365-313X.2010.04377.x
- Riediger M, Spät P, Bilger R, et al. Analysis of a photosynthetic cyanobacterium rich in internal membrane systems via gradient profiling by sequencing (Grad-seq). Plant Cell. 2021;33(2):248–269. doi: 10.1093/plcell/koaa017
- Hoyos M, Huber M, Förstner KU, et al. Gene autoregulation by 3’ UTR-derived bacterial small RNAs. Elife. 2020;9:e58836. doi: 10.7554/eLife.58836
- Zhan J, Steglich C, Scholz I, et al. Inverse regulation of light harvesting and photoprotection is mediated by a 3’-end-derived sRNA in cyanobacteria. Plant Cell. 2021;33(2):358–380. doi: 10.1093/plcell/koaa030
- Börner J, Friedrich T, Bartkuhn M, et al. Ribonuclease E strongly impacts bacterial adaptation to different growth conditions. RNA Biol. 2023;20(1):120–135. doi: 10.1080/15476286.2023.2195733
- Rajib S, Deng L, Allison H-O, et al. Diurnal regulation of cellular processes in the cyanobacterium Synechocystis sp. strain PCC 6803: Insights from transcriptomic, fluxomic, and physiological analyses. MBio. 2016;7(3). doi: 10.1128/mbio.00464-16
- Scheurer NM, Rajarathinam Y, Timm S, et al. Homologs of circadian clock proteins impact the metabolic switch between light and dark growth in the cyanobacterium Synechocystis sp. PCC 6803. Front Plant Sci. 2021;12:12. doi: 10.3389/fpls.2021.675227
- Summerfield Tina C, Sherman Louis A. Role of sigma factors in controlling global gene expression in light/dark transitions in the cyanobacterium Synechocystis sp. Strain PCC 6803. J Bacteriol. 2007;189(21):7829–7840. doi: 10.1128/jb.01036-07
- Li Z, Deutscher MP. RNase E plays an essential role in the maturation of Escherichia coli tRNA precursors. RNA. 2002;8(1):97–109. doi: 10.1017/S1355838202014929
- Mohanty BK, Petree JR, Kushner SR. Endonucleolytic cleavages by RNase E generate the mature 3′ termini of the three proline tRNAs in Escherichia coli. Nucleic Acids Res. 2016;44(13):6350–6362. doi: 10.1093/nar/gkw517
- Mohanty BK, Maples V, Kushner SR The C nucleotide at the mature 5’ end of the Escherichia coli proline tRNAs is required for the RNase E cleavage specificity at the 3’ terminus as well as functionality. Nucleic Acids Res. 2022;50(3):1639–1649. doi: 10.1093/nar/gkab1260
- Kannangara CG, Gough SP, Oliver RP, et al. Biosynthesis of δ-aminolevulinate in greening barley leaves VI. Activation of glutamate by ligation to RNA. Carlsberg Res Commun. 1984;49(3):417. doi: 10.1007/BF02907783
- Wang W-Y, Gough SP, Kannangara CG Biosynthesis of δ-aminolevulinate in greening barley leaves IV. Isolation of three soluble enzymes required for the conversion of glutamate to δ-aminolevulinate. Carlsberg Res Commun. 1981;46(4):243. doi: 10.1007/BF02906501
- O’Neill GP, Söll D. Expression of the Synechocystis sp. strain PCC 6803 tRNA(Glu) gene provides tRNA for protein and chlorophyll biosynthesis. J Bacteriol. 1990;172(11):6363–6371. doi: 10.1128/jb.172.11.6363-6371.1990
- Rieble S, Beale SI. Transformation of glutamate to delta-aminolevulinic acid by soluble extracts of Synechocystis sp. PCC 6803 and other oxygenic prokaryotes. J Biol Chem. 1988;263(18):8864–8871. doi: 10.1016/S0021-9258(18)68388-7
- Hartmann RK, Gößringer M, Späth B, et al. The making of tRNAs and more – RNase P and tRNase Z. In: Condon C, editor. Progress in Molecular Biology and Translational Science. Cambridge, United States: Academic Press; 2009. p. 319–368.
- Kirsebom LA, Svärd SG. Base pairing between Escherichia coli RNase P RNA and its substrate. EMBO J. 1994;13(20):4870–4876. doi: 10.1002/j.1460-2075.1994.tb06814.x
- LaGrandeur TE, Hüttenhofer A, Noller HF, et al. Phylogenetic comparative chemical footprint analysis of the interaction between ribonuclease P RNA and tRNA. EMBO J. 1994;13(17):3945–3952. doi: 10.1002/j.1460-2075.1994.tb06710.x
- Fingerhut C, Schön A Sequence and functional characterization of RNase P RNA from the chl a/b containing cyanobacterium Prochlorothrix hollandica. FEBS Lett. 1998;428(3):161–164. doi: 10.1016/s0014-5793(98)00519-5
- Hess WR, Fingerhut C, Schön A. RNase P RNA from Prochlorococcus marinus: contribution of substrate domains to recognition by a cyanobacterial ribozyme. FEBS Lett. 1998;431(2):138–142. doi: 10.1016/s0014-5793(98)00729-7