
ABSTRACT
This study is to elucidate the effect of the LINC00663/EBF1/NR2F1 axis on inflammation and angiogenesis in bladder cancer (BC) and related molecular mechanisms. After transfection, functional experiments were conducted to test cell proliferation and invasion, tube formation ability, and content of inflammatory factors, Snail, E-cadherin, and VEGFA. Meanwhile, the relationships among LINC00663, EBF1, and NR2F1 were predicted and verified. In addition, xenograft experiments in nude mice were performed to observe the oncogenicity of 5637 BC cells in vivo. In BC tissues and cells, LINC00663 and NR2F1 were upregulated. Silencing NR2F1 or LINC00663 repressed cell proliferation and invasion, weakened vascular mimicry in vitro, decreased inflammatory factor, Snail, and VEGFA levels, and increased expression of E-cadherin. LINC00663 positively regulated NR2F1 expression through EBF1. Additionally, in vivo experiments showed that NR2F1 upregulation reversed the suppression effects of LINC00663 silencing on tumour growth, inflammation, and angiogenesis. Silencing LINC00663 decreased NR2F1 expression by mediating EBF1, thereby inhibiting BC inflammation and angiogenesis.
1. Introduction
Bladder cancer (BC), among the most ordinarily diagnosed malignancies, could be a major contributor to cancer-associated deaths among males, with about 549,000 newly diagnosed patients and 200,000 patients dying in 2018 [Citation1]. Generally, BC is classified into non-muscle and muscle invasive types, whereas the former occurs in 75% of BC patients [Citation2]. Importantly, smoking, occupational exposure, and Schistosoma haematobium infection are all regarded as risk factors for BC [Citation3,Citation4]. Moreover, inflammation has been shown to activate the angiogenesis and tumour progression in BC patients [Citation5]. Surgery and chemotherapy are the predominant treatment choices for BC; however, the treatment efficacy is far from satisfactory [Citation6]. Therefore, searching for effective targets such as tumour biomarkers is essential for predicting prognosis and guiding treatment.
Nuclear Receptor subfamily 2 group F member 1 (NR2F1) is mainly associated with tumour cell dormancy, invasion, and metastasis during cancer development and growth [Citation7]. Reportedly, upregulated NR2F1 expression was significantly linked with the recurrence and metastasis of salivary adenoid cystic carcinoma [Citation8]. NR2F1 was identified to be a differentially expressed gene (DEG) in BC patients associated with prognosis [Citation9]. Nevertheless, the role and regulatory mechanism of NR2F1 in BC have not been unveiled. From LncMAP website, we found that LINC00663 may participate in BC development by binding the transcription factor EBF1 to regulate NR2F1 expression.
LncRNAs have over 200 nucleotides [Citation10] and regulate many cellular processes (like proliferation, differentiation, invasion, metastasis, and apoptosis) through the regulation of gene expression [Citation11]. Increasing studies showed that some lncRNAs can facilitate BC cell dissemination. For example, in patients with early-stage BC, upregulated lncRNA CASC11 expression was detected and was found to promote cancer cell proliferation by modulating its downstream gene in BC [Citation12]. Another study displayed that exosomal lncRNA LNMAT2 was overexpressed in BC tissues and promoted lymphangiogenesis and lymphatic metastasis in BC [Citation13]. More importantly, LINC00663 was highly expressed in pancreatic cancer and served as a prognostic biomarker of pancreatic cancer [Citation14]. However, there is no data investigating the biological role of LINC00663 in BC. JASPAR predicted three binding sites between EBF1 and NR2F1. EBF1, a transcription factor, was verified to be involved in the transcriptional regulation of several survival-associated hub immune genes in BC [Citation15]. Accordingly, we assumed that LINC00663 may facilitate the inflammation and angiogenesis of BC by regulating NR2F1 via EBF1, hoping to provide valuable references for developing new molecular targets for the treatment of BC.
2. Materials and methods
2.1. Bioinformatics analysis
First, the HTSeq-FPKM and survival data of BC were obtained from the University of California Santa Cruz (UCSC) database (http://xena.ucsc.edu/), and DEGs in the commencement and development of BC were preliminarily analysed by R package. The univariate Cox analysis of survival data was performed to screen out the genes associated with BC prognosis. Next, a unified and standardized pan-cancer dataset TCGA-TARGET-GTEx (PANCAN, N = 19131, G = 60499) was downloaded from the UCSC database (https://xenabrowser.net/). Subsequently, we obtained the expression pattern of ENSG00000175745 (NR2F1) in samples from different sources, such as primary tumour, the primary blood derived cancer-peripheral blood cohort (TCGA-LAML), and metastatic, primary blood derived cancer-bone marrow, primary solid tumour, and recurrent blood derived cancer-bone marrow cohorts of TCGA-SKCM. Additionally, we obtained a high-quality prognosis dataset from the Cancer Genome Atlas (TCGA) prognostic study [Citation16]. Also, TARGET follow-up data were downloaded from the UCSC database (https://xenabrowser.net/datapages/). Furthermore, log2(x + 0.001) transformation was conducted for each expression value. Finally, cancer types with <10 samples in one cancer type were excluded, and the expression profiles of 44 cancer types and the overall survival data were collected. Next, the coxph function of R survival package 3.2-7 was used to establish the Cox proportional hazards regression model and analyse the relationship between gene expression and prognosis. Statistical tests were performed to obtain prognostic significance using the Logrank test.
2.2. Sample collection
BC tissues and normal para-cancer tissues were excised from 30 BC patients in the Urology Department of Affiliated Hospital of Qingdao University from February 2019 to February 2021. Their pathological features are summarized in . The collected cancer tissues were reconfirmed by two experienced pathologists. Each participant was pathologically diagnosed with BC, and none received chemotherapy, radiotherapy, or other tumour-related treatments before the operation or suffered from other malignant tumours or bladder diseases. The collected tissue samples were immediately frozen in liquid nitrogen and then preserved at −80°C for subsequent experiments.
Table 1. The clinical data of patients with bladder cancer.
This study was approved by the Ethics Committee of Affiliated Hospital of Qingdao University (approval number: QYFY WZLL 28,112) and complied with the Declaration of Helsinki, and all patients had signed written informed consent.
2.3. Cell culture
BC cell lines (HT-1376 [iCell-h077], 5637 [iCell-h232], J82 [iCell-h115], and T24 [iCell-h208]), human normal bladder epithelial cells (SV-HUC-1; iCell-h199), and human umbilical vein endothelial cells (HUVECs; iCell-h110) were provided and validated by iCell Bioscience Inc. (Shanghai, China). Cells were cultivated in Roswell Park Memorial Institute (RPMI)-1640 medium (Gibco, Grand Island, NY, USA), which contained 10% foetal bovine serum (FBS; Thermo Fisher Scientific, Wilmington, DE, USA) and penicillin–streptomycin (Gibco) at 37°C with 5% CO2.
2.4. Cell transfection
NR2F1 knockdown vector (sh-NR2F1) (sequence: GGCAGCGATCTCCATAGAAAC), LINC00663 knockdown vector (sh-LINC00663) (sequence: CCTGACATCATAATGGTAGAT), EBF1 overexpression vector (oe-EBF1), NR2F1 overexpression vector (oe-NR2F1), and their negative controls (NCs) were procured from Hanbio Biotechnology (Shanghai, China). The transfection titre of lentiviral vector was 1 × 10⁸ TU/mL. Follow-up assays were performed after 48-h transfection.
2.5. Quantitative reverse transcription polymerase chain reaction (qRT-PCR)
The total RNA was extracted and reverse-transcribed with TRIZOL (Invitrogen, Carlsbad, CA, USA) and the RT kit (Takara, Tokyo, Japan). Gene expression was measured using SYBR Green Mix (Takara) on a Biosystems 7300 system (ABI, Foster City, CA, USA). Three replicates were set for each reaction. Data were analysed using the 2−ΔΔCt method [Citation17] (internal reference: glyceraldehyde-3-phosphate dehydrogenase [GAPDH]). Related primers are listed as follows: LINC00663 (F: 5′-GCTTGTAGCCCCTTTCTTTTGG-3′, R: 5′-AGTCCCTTCTGCCTATGACCCT-3′), EBF1 (F: 5′-TGCAGATCTGGTTGAAGCCCTGTA-3′, R: 5′-ATCCCTGCATGGACCGAAGTGTT-3′), NR2F1 (F: 5′-ATCCGAGCTACAAAGCATGG-3′, R: 5′-TCCACAT CCGTCCACAATAA-3′), and GAPDH (F: 5′-CACCCACTCCTCCACCTTTG-3′, R: 5′-CCACCACCCTGTTGCTGTAG-3′).
2.6. Western blot
Cells or tissues were lysed by radio-immunoprecipitation assay (RIPA) lysis (Beyotime, Shanghai, China) on ice for 15 min and centrifuged (13000 g, 5 min), and then protein concentration was assessed on a bicinchoninic acid (BCA) kit (Beyotime). The protein was denatured in boiling water for 10 min after the loading buffer was added and the loading volume was calculated based on protein loaded. After that, the protein underwent electrophoresis (30 min at 80 V, 90 min at 120 V) and then transferred onto a polyvinylidene fluoride (PVDF) membrane at 250 mA for 100 min, followed by thrice of membrane rinsing, each for 1–2 min. Afterwards, the membrane was treated with a blocking buffer for 2 h and incubated overnight (4°C) with primary antibodies of NR2F1 (1:1000, ab181137, Abcam, Cambridge, UK), EBF1 (1:1000, sc -137,065, Santa Cruz, CA, USA), VEGFA (1:1000, ab1316, Abcam), Snail (1:1000, ab216347, Abcam), E-cadherin (1:1000, ab1416, Abcam), and GAPDH (1:2000, ab9485, Abcam). Subsequently, the membrane was washed thrice using Tris-buffered saline-tween (TBST) and probed with goat anti-rabbit immunoglobulin G (IgG) (A0208, 1:1000, Beyotime) for 2 h. Following the addition of enhanced chemiluminescence developing solution (ECL, P0018FS, Beyotime), the membrane was imaged on a chemiluminescence imaging system (Bio-Rad, Hercules, CA, USA) and analysed using Quantity One v4.6.2 software.
2.7. RNA-FISH
FISH assay was conducted to identify the subcellular localization of LINC00663 in BC cells. Briefly, the cells seeded in 24-well plates (6 × 10⁴ cells/well) were incubated overnight with 250 μL buffer and 250 μL FISH probes (300 ng/mL; Biosense, Guangzhou, China) in a hybridization buffer at 42°C. Air-dried slides were mounted with 4,6-diamidino-2-phenylindole. Finally, images in five different fields were obtained and examined with a fluorescence microscope (Olympus IX51, Japan).
2.8. Cell counting kit-8 (CCK-8) assay
After transfection, the cells were seeded onto 96-well plates. Then 10 µL of CCK-8 reagent was added to each well for 0, 24, 48, and 72 h, respectively. On a microplate reader (model 680; Bio-Rad), cell absorbance was tested at 450 nm from three independent tests.
2.9. Colony-forming assay
Transfected cells were digested by trypsin, centrifuged (25°C, 1500 rpm) for 5 min, and then resuspended in a complete medium. A 6-well plate was covered with 2 mL complete medium (37°C), and 500 cells were seeded onto each well for 2–3 weeks (37°C, 5% CO2). When cell colonies were visible to naked eyes, the cell culture was terminated. After the culture medium was absorbed, the plate was washed twice with PBS before methanol (1.5 mL) was added to fix cells for 15 min. After methanol removal, Giemsa (1 mL) was added for 20-min staining in darkness. Later, the Giemsa was washed away, and the 6-well plate was inverted on clean absorbent paper. The plate was dried, and cloned cells were counted.
2.10. Tube formation experiment
Matrigel (Corning, Tewksbury, MA, USA) was dissolved at 4°C, and a 96-well plate (Millipore, Billerica, MA, USA) and a pipette were pre-chilled. The plate added with 100 μL Matrigel was put in an incubator (37°C, 30 min) to solidify the Matrigel. HUVECs were re-suspended in a conditioned medium of 5637 cells and seeded onto the 96-well plate (2 × 10⁴ cells/well) with three replicate wells, followed by 5-h incubation (37°C, 5% CO2). Under three fields, the image was collected through the microscope with the number and length of the branches measured and recorded.
2.11. Transwell assay
Following cells (1 × 10⁵) were suspended in a serum-free DMEM, the upper chamber (coated with Matrigel) was added with the cell suspension, and the lower chamber was filled with 600 µL medium (containing 10% FBS). After 48 h, the cells attached to the membrane underwent fixation by 100% methanol and staining by 0.1% crystal violet, while the non-invaded cells were removed with cotton swabs. The invaded cell numbers were counted under a microscope (200 ×).
2.12. Enzyme-linked immunosorbent assay (ELISA)
The samples were added to the 96-well ELISA plate of the ELISA kits (R&D, Systems, UK) for overnight, followed by PBS washing (3 × 5 min) after culture solution was discarded. Later, the plate was added with 5% BSA blocking liquid (100 μL/well) for 1 h and then PBS (containing 5% BSA)-diluted primary antibody for 3 h. After PBS washing, the plate was appended with HRP-labelled secondary antibody (diluted by PBS). Finally, 10 μL of substrate was added to the supernatant or serum (37°C, 10–15 min), and the absorbance value at 450 nm was assessed.
2.13. Dual-luciferase assay
Target genes were screened through bioinformatics prediction. Based on the predicted results, wild and mutated promoter sequences (wt-NR2F1 and mut-NR2F1) were designed, synthesized, and inserted into pGL3-Basic vectors, followed by co-transfection into BC cells with sh-LINC00663 and sh-NC or oe-EBF1 and oe-NC (transfection titre of lentiviral vector: 1 × 10⁸ TU/mL). After 48 h, cells were lysed for the measurement of luciferase activity with a luciferase detection kit (K801–200, Biovision, Mountain View, CA, USA) and luciferase analysis system (Promega, Madison, WI, USA) (internal reference: Renilla luciferase).
2.14. RNA immunoprecipitation (RIP) assay
Subsequent to PBS washing and centrifugation (1500 rpm, 5 min), cells were completely mixed with RIP lysis (an equal volume). The magnetic beads were resuspended in 100 μL RIP wash buffer and added with 5 µg anti-EBF1 (sc -137,065, 1:100, Santa Cruz) for 30 min (IgG as control). Next, RIP wash buffer (500 µL) was used to wash the bead–antibody complex twice. After supernatant removal, the complex was mixed with 500 µL wash buffer. Then the tube was put on the magnetic rack, the supernatant was removed, and RIP buffer (900 µL) was appended. Subsequently, the prepared cell lysate was rapidly thawed and centrifuged (14000 rpm, 10 min, 4°C) to obtain 100 µL supernatant, which was incubated with the bead–antibody complex (4°C, overnight). Subsequent to transient centrifugation and supernatant removal, the complex was treated with RIP wash buffer (500 µL) six times. After that, Proteinase K buffer (150 µL) was used to purify the RNA by incubating (55°C, 30 min) with the bead–antibody–RNA complex. After RNA extraction, LINC00663 expression was assessed by qRT-PCR.
2.15. Chromatin immunoprecipitation (ChIP)
Cells were fixed with formaldehyde for 10 min and then treated with an ultrasonic cell disruptor (15 cycles for 10 s each time with intervals of 10 s) to break chromatin into fragments. After that, centrifugation was performed at 12,000 g for 10 min at 4°C to collect the supernatant, which was packaged into two tubes. Next, IgG antibody (ab172730, 1:100, Abcam) and EBF1 antibody (sc -137,065, 1:100, Santa Cruz) were added to the supernatant for overnight incubation at 4°C. The DNA–protein complex was precipitated by Protein Agarose/Sepharose, followed by 5-min centrifugation at 12,000 g and removal of supernatant. The non-specific complex was rinsed, and the bead–DNA–protein complexes were de-crosslinked (65°C, overnight). The purified DNA products were measured by qPCR to detect the binding of EBF1 to NR2F1 using NR2F1-specific primers. Each experiment was run in triplicate.
2.16. Animal experiment
Animal experiments were approved by the Ethics Committee of Affiliated Hospital of Qingdao University. Male BALB/c nude mice (n = 24, 4–6 weeks, 19 ± 2 g) from Shanghai Laboratory Animal Center were reared in specific pathogen-free animal rooms at 25–27°C and 45–50% humidity. These nude mice were randomized into four groups with six mice per group (Control, sh-NC + oe-NC, sh-LINC00663 + oe-NC, and sh-LINC00663 + oe-NR2F1 groups). According to grouping, transfected 5637 cells were collected into centrifuge tubes (10 mL) for centrifugation with the supernatant discarded. After normal saline washing, the cells were digested by 0.5% trypsin (1 mL) in a 37°C incubator, followed by preparation of single-cell suspension by blowing evenly. Later, the cells were transferred to centrifuge tubes (15 mL) and centrifuged (5 min, 300 g) with the supernatant removed, followed by twice washing in PBS. After an appropriate amount of PBS was added, the cells were counted. Next, cells (5 × 10⁶) were resuspended in 50 µL normal saline and then mixed with 50 µL Matrigel. Nude mice were anesthetized by 60 mg/kg sodium pentobarbital (i.p.). After that, the left inguinal skin was sterilized and subcutaneously inoculated with 5637 cells. Afterwards, tumour volume was recorded every 7 days based on the formula: V (mm3) = (A2 × B)/2 (A: the long diameter. B: the short diameter). Five weeks later, all mice were euthanized by cervical dislocation, and subcutaneous tumours were isolated and weighted for follow-up experiments.
2.17. Immunohistochemistry (IHC)
Tumours isolated from mice were immersed in 4% paraformaldehyde for 48 h of fixation and prepared into paraffin sections (4 μm thick). The sections were baked for 20 min, deparaffined with conventional xylene, dehydrated, and washed once with distilled water and thrice with PBS. After blocked with 3% H2O2 for 10 min and PBS washing, sections were subjected to heat-induced antigen retrieval. After PBS washing again, the sections were soaked in a normal goat serum blocking buffer for 20 min. Later, the sections were incubated with the primary antibodies against Ki67 (ab15580, Abcam) and CD34 (ab81289, Abcam) at 4°C overnight and then the secondary antibody for 1 h. Following washing, the sections were stained with diaminobenzidine for 1–3 min, followed by 3 min of haematoxylin staining, dehydration, clearing, and sealing. Three fields were selected for observation under a microscope (×200) and analysed using the Image J software. Next, two experienced pathologists scored the percentage of positive cells (0, <5%; 1, 5~25%; 2, 26~50%; 3, 51~75%; and 4, 76~100%) and staining intensity (0, colourless; 1, light yellow; 2, brown-yellow; and 3, dark brown) in a double-blind fashion using semi-quantitative results. The product of the two scores was the positive grade: 0, negative; 1 ~ 4, weakly positive; 5 ~ 8, positive; and 9 ~ 12, strongly positive. Finally, the microvessel density (MVD) was calculated. The MVD count was calculated based on the CD34 positive cells, clusters or individual endothelial cells, or cells with clear boundaries with adjacent tumour cells, microtubules and their surrounding connective tissues. If the structure was not connected, it was regarded as a tube [Citation18].
2.18. Statistical analysis
Data were analysed using GraphPad Prism 7.0 and depicted as mean ± standard deviation. The t-test was employed for comparisons between two groups and one-way analysis of variance for those among multiple groups. Post hoc analysis was done with Tukey′s multiple comparison test. p < 0.05 was indicative of statistical significance.
3. Results
3.1. NR2F1 was overexpressed in BC tissues
First, we found 80 DEGs involved in the progression of BC through bioinformatics prediction (). Through the analysis of survival data by univariate Cox analysis, it was found that 28 DEGs were related to BC prognosis (). Nevertheless, through multivariate Cox analysis on the 28 DEGs, 10 genes were found to be linked with BC poor prognosis (, Supplementary table S1). Combining the results from univariate and multivariate Cox analyses, we focused on NR2F1, a gene associated with poor prognosis of BC. Subsequently, we analysed the relationship between NR2F1 and BC prognosis using pan-cancer dataset downloaded from the UCSC database and prognostic dataset from the TCGA dataset in a previous study [Citation16]. The results demonstrated that the elevated NR2F1 in BC predicted poor prognosis, indicating that NR2F1 was closely related to BC progression (, Supplementary table S2).
Figure 1. NR2F1 expressed at a high level in BC tissues.
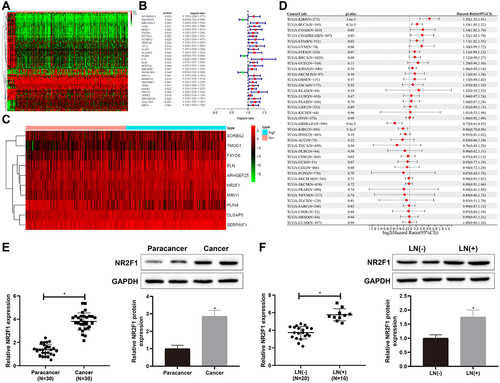
Next, qRT-PCR and western blot revealed that NR2F1 was increased in BC tissues versus normal para-cancer tissues (, *p < 0.05). Meanwhile, compared with BC patients without lymph node metastasis, NR2F1 was signally upregulated in BC patients with lymph node metastasis (, *p < 0.05). Overall, NR2F1 was upregulated in BC tissues.
3.2. Knockdown of NR2F1 inhibited inflammation and vascular mimicry in BC cells
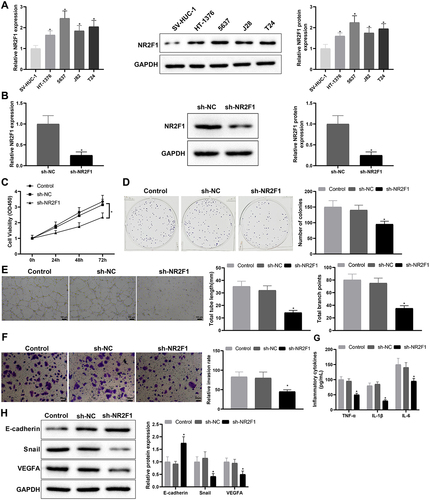
Compared with SV-HUC-1 cells, NR2F1 was conspicuously elevated in HT-1376, 5637, J82, and T24 cells, and the elevation was relatively significant in 5637 cells (, *p < 0.05). Subsequently, we constructed the NR2F1 knockdown vector, and screened and verified the transfection efficiency of the NR2F1 knockdown vector by qRT-PCR, which manifested that the knockdown efficiency of sh-NR2F1-1 was the most significant (Supplementary Figure S1A). Hence, the subsequent experiments used sh-NR2F1-1 (hereinafter referred to as sh-NR2F1) for functional experiments. Following sh-NR2F1 or sh-NC transfection, qRT-PCR and western blot measurements of transfection efficiency showed that the sh-NR2F1 group had obviously lower NR2F1 expression than the sh-NC group (, *p < 0.05). As suggested by CCK-8 and colony-forming assays, the sh-NR2F1 group had decreased cell proliferation (, *p < 0.05). Tube formation experiments suggested that the sh-NR2F1 group had shorter length of newly formed pseudo-tubules and decreased number of newly formed nodes (, *p < 0.05), demonstrating a weakened ability of vascular mimicry in response to NR2F1 suppression. Results from the transwell assay showed that the transfection of sh-NR2F1 markedly repressed cell invasion ability (, *p < 0.05). ELISA showed that TNF-α, IL-6, and IL-1β levels were reduced in the sh-NR2F1 group (, *p < 0.05). Western blot analysis reflected that the sh-NR2F1 group had increased E-cadherin expression but decreased expression of Snail and VEGFA (, *p < 0.05). Conclusively, silencing NR2F1 may suppress inflammation and angiogenesis in BC.
Figure 2. Low expression of NR2F1 suppressed inflammation and vascular mimicry in BC cells.
3.3. LINC00663 positively regulated NR2F1 expression
Based on the above findings, we further explore the relevant regulatory axis of NR2F1 through the website LncMAP (http://bio-bigdata.hrbmu.edu.cn/LncMAP/index.jsp). Results manifested that LINC00663 may be involved in BC process by binding to transcription factor EBF1 to regulate NR2F1 expression (Supplementary table S3). Furthermore, there is no evidence reporting the implication of LINC00663 in BC. Afterwards, qRT-PCR revealed that LINC00663 was strikingly increased in BC tissues and 5637 cells versus normal para-cancer tissues and SV-HUC-1 cells, respectively (, *p < 0.05). With respect to FISH assay results, LINC00663 was predominantly localized in the nuclei of BC cells ().
Figure 3. LINC00663 positively modulated NR2F1.
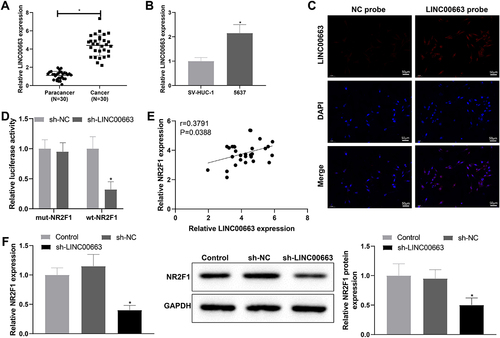
To dissect whether there is an interaction between LINC00663 and NR2F1, we constructed three knockdown vector sequences for LINC00663, followed by qRT-PCR. As evidenced in Supplementary figure S1B, the knockdown efficiency of LINC00663-2 (hereinafter noted as sh-LINC00663) was the most significant, which was used for functional experiments in follow-up assays. Dual-luciferase assay illustrated that sh-LINC00663 downregulated the luciferase activity of wt-NR2F1 but had no effect on that of mut-NR2F1 (, *p < 0.05), which indicated that LINC00663 might regulate its promoter activity. In addition, through Pearson correlation analysis, NR2F1 was positively correlated with LINC00663 (). To further confirm the effect of LINC00663 on NR2F1 expression, we transfected 5673 cells with sh-LINC00663, in which the NR2F1 expression was detected. In comparison with the sh-NC group, NR2F1 was obviously reduced in sh-LINC00663 group (, *p < 0.05). Overall, LINC00663 could positively modulate the NR2F1 expression.
3.4. Silencing LINC00663 repressed inflammation and vascular mimicry in BC cells by regulating NR2F1 expression
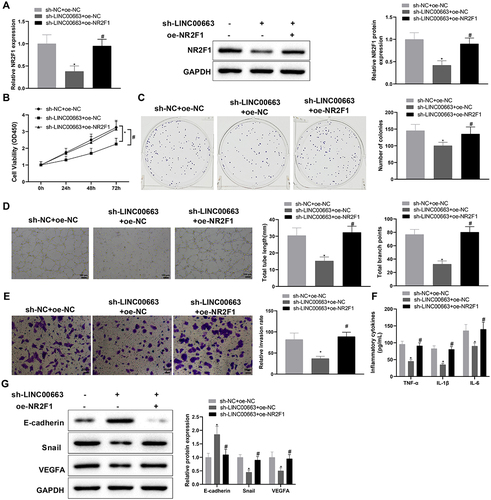
Next, 5673 cells were co-transfected with sh-LINC00663 and oe-NR2F1 to determine whether LINC00663 affects BC inflammation and angiogenesis by regulating NR2F1 expression. qRT-PCR and western blot manifested that NR2F1 expression was reduced in the sh-LINC00663 + oe-NC group (vs. sh-NC + oe-NC group) but elevated in the sh-LINC00663 + oe-NR2F1 group (vs. sh-LINC00663 + oe-NC group) (, *p < 0.05). Later, we conducted functional experiments to explore the effect of the LINC00663/NR2F1 regulatory axis on inflammation and vascular mimicry in BC cells. In comparison with the sh-NC + oe-NC group, the sh-LINC00663 + oe-NC group had decreased cell proliferation and invasion, reduced TNF-α, IL-6, and IL-1β levels, and weakened the ability of vascular mimicry (, *p < 0.05). Also, as reflected in (*p < 0.05), E-cadherin expression was increased, and Snail and VEGFA were visibly decreased in the sh-LINC00663 + oe-NC group (vs. sh-NC + oe-NC group). However, after the co-transfection of sh-LINC00663 and oe-NR2F1, upregulation of NR2F1 reversed the repressive effect of LINC00663 deficiency to promote inflammation and vascular mimicry in BC cells (, *p < 0.05). Altogether, LINC00663 knockdown may inhibit inflammation and vascular mimicry in BC cells by decreasing NR2F1 expression.
Figure 4. Knockdown of LINC00663 inhibited inflammation and vascular mimicry in BC cells by decreasing NR2F1 expression.
3.5. LINC00663 upregulated NR2F1 expression by binding EBF1 to facilitate inflammation and vascular mimicry in BC cells
According to the above experimental results and LncMAP analysis, we speculated that LINC00663 might mediate BC inflammation and angiogenesis by binding EBF1 to modulate NR2F1 expression. RIP assay revealed that the EBF1 group had a higher enrichment of LINC00663 (vs. IgG group) (, *p < 0.05), suggesting that the EBF1 protein could specifically bind to LINC00663. Subsequently, we predicted the binding sites between EBF1 and NR2F1 through the JASPAR website (http://jaspar.genereg.net/), and the results showed that there were three binding sites between them (). In addition, dual-luciferase assay demonstrated that site 3 (557–567 nt) was a specific site for EBF1 binding to NR2F1 promoter region (ATCTCCAGGGT) (, *p < 0.05). Next, ChIP assay displayed that, compared with the IgG group, the amplification product obtained by site 3 primer in EBF1 group was more than that obtained by Distal primer (, *p < 0.05), further suggesting that EBF1 bound NR2F1 DNA at site 3. Moreover, the ChIP assay unveiled that the NR2F1 promoter in sh-LINC00663 group was markedly reduced versus sh-NC group (, #p < 0.05). The above findings indicated that LINC00663 regulated NR2F1 expression through EBF1.
Figure 5. LINC00663 modulated NR2F1 expression through EBF1 and affected inflammation and vascular mimicry in BC cells.
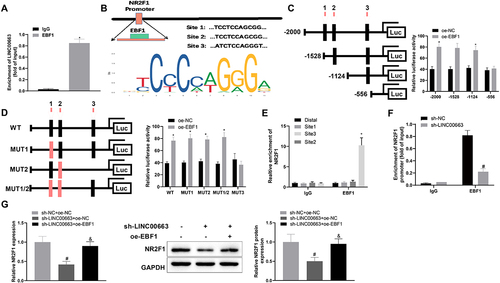
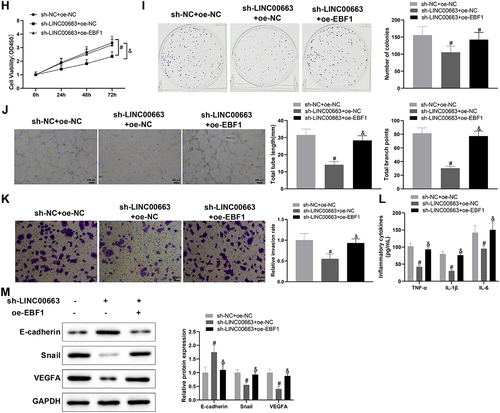
Subsequently, BC cells were co-transfected with sh-LINC00663 and oe-EBF1. Results manifested that overexpressed EBF1 promoted NR2F1 expression (, &p < 0.05). As expected, overexpressed EBF1 could facilitate inflammation and vascular mimicry in BC cells by reversing the inhibitory effect of sh-LINC00663 (, &p < 0.05). All results suggested that LINC00663 may modulate NR2F1 expression by binding EBF1, thereby affecting BC inflammation and angiogenesis.
Figure 5. (Continued). (A) RIP assay was used to verify the binding between LINC00663 and EBF1. (B) the binding sites between EBF1 and NR2F1 were predicted by the JASPAR website. (C-E) the binding relationship between EBF1 and NR2F1 was verified by dual-luciferase reporter gene assay and ChIP assay (groups of site 1/2/3 referred to qPCR primers designed according to sequences of site 1/2/3 of NR2F1). (F) the binding between LINC00663 and NR2F1 was verified by ChIP assay. After BC cells were transfected with sh-LINC00663 and oe-EBF1, (G) the expression of NR2F1 was measured by qRT-PCR and western blot. (HI) cell proliferation was tested by CCK-8 and colony-forming assays. (J) the ability of vascular mimicry was examined by tube formation experiments. (K) cell invasion was measured by transwell assay. (L) the levels of TNF-α, IL-6, and IL-1β were measured by ELISA. (M) the expression of Snail, E-cadherin, and VEGFA was examined by western blot. Data were exhibited as mean ± standard deviation, and each experiment was run in triplicate. *p < 0.05, compared with IgG, oe-NC, or Distal group; #p < 0.05, compared with sh-NC or sh-NC + oe-NC group; &p < 0.05, compared with the sh-LINC00663 + oe-NC group. BC, bladder cancer.
3.6. Knockdown of LINC00663 inhibited tumor growth by reducing NR2F1 expression
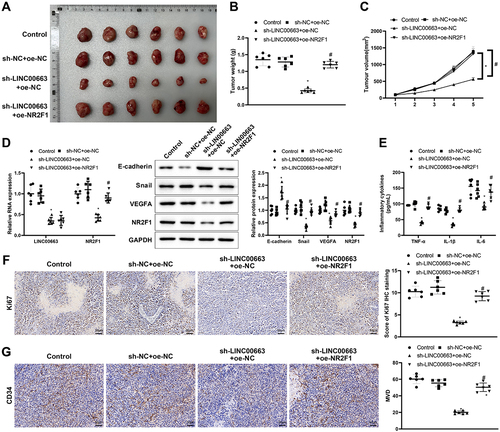
Finally, we transplanted cancer cells into nude mice to explore their manifestations in vivo. In comparison with the sh-NC+ oe-NC group, the tumour weight and volume were visibly decreased in the sh-LINC00663 + oe-NC group (, *p < 0.05), showing that inhibition of LINC00663 markedly repressed the tumour growth. The sh-LINC00663 + oe-NC group had decreased expression of LINC00663, NR2F1, Snail, and VEGFA, and increased expression of E-cadherin (, *p < 0.05). TNF-α, IL-6, and IL-1β levels were obviously reduced in the sh-LINC00663 + oe-NC group (, *p < 0.05). Ki67 expression and MVD were decreased in the sh-LINC00663 + oe-NC group (, *p < 0.05). However, overexpression of NR2F1 nullified the inhibitory effect of LINC00663 knockdown on tumour growth (, #p < 0.05). In summary, silencing LINC00663 repressed tumour growth by reducing NR2F1 expression.
Figure 6. Silencing LINC00663 repressed tumour growth by reducing NR2F1 expression.
4. Discussion
BC is a malignancy of the urinary system with a high recurrence rate [Citation19]. Therefore, finding effective biomarkers for BC is imperative for early diagnosis of this disease. Nowadays, the function of lncRNAs in BC pathogenesis has been emphasized by numerous studies [Citation20]. In the present study, we first identified NR2F1 was closely related to BC prognosis through bioinformatics analysis, and then found the regulatory axis related to NR2F1 in BC. Additionally, a string of assays both in vivo and in vitro were performed to verify the role of the LINC00663/EBF1/NR2F1 axis in BC progression, and results showed that silencing LINC00663 inhibited inflammation and angiogenesis in BC partially by decreasing NR2F1 expression via binding EBF1.
Based on the bioinformatics analysis, upregulated expression of NR2F1 was associated with BC poor prognosis. Furthermore, NR2F1 expression was detected to be significantly increased in BC tissues, especially in patients with lymph node metastasis. Knockdown of NR2F1 repressed inflammation and vascular mimicry in BC cells, shown by reduced TNF-α, IL-6, IL-1β, Snail, and VEGFA levels and increased E-cadherin levels. Snail has been reported to be abnormally expressed in colorectal cancer, gastric cancer, liver cancer, lung adenocarcinoma, and other tumours; moreover, Snail up-regulation is associated with tumour invasion, metastasis, and poor prognosis [Citation21–24]. The activation of VEGFA could promote tumour growth [Citation25]. Down-regulated expression of E-cadherin has been found in many tumours, and the absence of E-cadherin is often associated with poor patient outcomes [Citation26]. The inhibition of inflammatory factor levels helped to shape a non-inflamed tumour microenvironment in BC [Citation27]. NR2F1 also assumed an important role in shaping the tumour microenvironment of BC [Citation28], which indicated that NR2F1 is a potential biomarker for predicting the efficacy of immunotherapy for BC. In a previous study, NR2F1 was found to be involved in DNA base-pair repair, inflammation, and oncogenic pathways [Citation29]. NR2F1 was verified to be a key modulator of neuro-inflammation in the adult hippocampus [Citation30]. Moreover, a prior study demonstrated that NR2F2 could play an important role in tumorigenesis by regulating multiple signalling pathways and controlling tumour cell growth and angiogenesis [Citation31]. In pancreatic cancer, increased NR2F1 resulted in promoted cancer cell biological behaviours, including proliferation, migration, and invasion [Citation32]. Notably, NR2F1 was markedly reduced in several cancers, such as head and neck squamous cell carcinoma and breast carcinoma [Citation33]. The discrepancy suggests that NR2F1 may have different functions depending on cancer types. Owing to the controversial role of NR2F1 in different cancers, we will further explore the related molecular mechanisms in future studies.
Next, we searched its related regulatory axis on the LncMAP website and found the axis of LINC00663/EBF1/NR2F1. LINC00663 was detected to be overexpressed, and silencing LINC00663 resulted in inhibited inflammation and angiogenesis in xenograft tumours formed by 5637 BC cells. In pancreatic cancer samples, LINC00663 expression was measured to be higher as compared to normal pancreatic samples [Citation14]. Also, LINC00663 was reported to be highly expressed in glioma, and LINC00663 knockdown could restrain cell viability by modulating AKT/mTOR pathway [Citation34]. The above data suggested that LINC00663 may be an oncogene in the occurrence and development of cancers. Previous researchers have emphasized the crucial roles of lncRNAs in inflammatory responses and angiogenesis of different cancers. For example, LINC00665 exerted an important pro-inflammatory role by activating the NF-κB pathway in hepatocellular carcinoma [Citation35]. Another study showed that the knockdown of Linc-OIP5 suppressed the angiogenesis of the HUVECs through YAP1/Notch/NRP1 signalling in breast cancer [Citation36]. In addition, we found that LINC00663 could positively regulate NR2F1 expression, and further experiments revealed that silencing LINC00663 repressed inflammation and vascular mimicry in BC cells by downregulating NR2F1. Moreover, RIP assay showed that EBF1 could bind LINC00663, and dual-luciferase assay and ChIP assay confirmed the binding site between EBF1 and NR2F1. Previously, overexpressed EBF1 rescued the inhibitive effect of upregulated TMPO-AS1 on BC development [Citation37]. EBF1 was proved to be a target of LINC00261, and EBF1 overexpression could reverse the inhibition of LINC00261 on the proliferative and migration of thyroid cancer cells [Citation38]. Consistently, our data also displayed that EBF1 overexpression reversed inhibitory effects of sh-LINC00663 on inflammation and vascular mimicry in BC cells, and further animal experiments showed that silencing LINC00663 decreased NR2F1 expression by binding EBF1, thereby repressing BC inflammation and angiogenesis.
In summary, our findings indicate that LINC00663 overexpression promotes inflammation and angiogenesis by binding EBF1 to increase NR2F1 expression, serving as a promising molecule for BC progression. Of course, there are still some shortcomings in this study. First, there is a relatively simple way to examine inflammation response in our cell and animal experiments, and multi-level in vitro and in vivo validations are needed in the follow-up study to strengthen the reliability of this conclusion. Second, there will be inevitable errors in our experimental process or data analysis, and more experiments and data will be needed to verify our results in the future. In any case, these findings offer a scientific basis for finding efficient immunotherapy targets for BC.
Supplementary Table 2.pdf
Download PDF (49.5 KB)Supplementary Table 1.pdf
Download PDF (39.8 KB)Supplementary Table 3.pdf
Download PDF (10.7 KB)Disclosure statement
No potential conflict of interest was reported by the author(s).
Data availability statement
The datasets used or analysed during the current study are available from the corresponding author on reasonable request.
Supplementary material
Supplemental data for this article can be accessed online at https://doi.org/10.1080/15476286.2024.2368304
Additional information
Funding
References
- Bray F, Ferlay J, Soerjomataram I, et al. Global cancer statistics 2018: GLOBOCAN estimates of incidence and mortality worldwide for 36 cancers in 185 countries. CA Cancer J Clin. 2018;68(6):394–424. doi: 10.3322/caac.21492
- Kamat AM, Hahn NM, Efstathiou JA, et al. Bladder cancer. Lancet. 2016;388(10061):2796–2810. doi: 10.1016/S0140-6736(16)30512-8
- Cumberbatch MGK, Jubber I, Black PC, et al. Epidemiology of bladder cancer: a systematic review and contemporary update of risk factors in 2018. Eur Urol. 2018;74(6):784–795. doi: 10.1016/j.eururo.2018.09.001
- Murata M. Inflammation and cancer. Environ Health Prev Med. 2018;23(1):50. doi: 10.1186/s12199-018-0740-1
- Wigner P, Grebowski R, Bijak M, et al. The Interplay between oxidative stress, inflammation and angiogenesis in bladder cancer development. Int J Mol Sci. 2021;22(9):22. doi: 10.3390/ijms22094483
- Gouin KH 3rd, Ing N, Plummer JT, et al. An N-Cadherin 2 expressing epithelial cell subpopulation predicts response to surgery, chemotherapy and immunotherapy in bladder cancer. Nat Commun. 2021;12(1):4906. doi: 10.1038/s41467-021-25103-7
- Meng J, Liu X, Tang S, et al. METTL3 inhibits inflammation of retinal pigment epithelium cells by regulating NR2F1 in an m(6)A-dependent manner. Front Immunol. 2022;13:905211. doi: 10.3389/fimmu.2022.905211
- Gao XL, Zheng M, Wang HF, et al. NR2F1 contributes to cancer cell dormancy, invasion and metastasis of salivary adenoid cystic carcinoma by activating CXCL12/CXCR4 pathway. BMC Cancer. 2019;19(1):743. doi: 10.1186/s12885-019-5925-5
- Tang F, Li Z, Lai Y, et al. A 7-gene signature predicts the prognosis of patients with bladder cancer. BMC Urol. 2022;22(1):8. doi: 10.1186/s12894-022-00955-3
- Simion V, Haemmig S, Feinberg MW. LncRNAs in vascular biology and disease. Vasc Pharmacol. 2019;114:145–156. doi: 10.1016/j.vph.2018.01.003
- Braga EA, Fridman MV, Moscovtsev AA, et al. LncRNAs in ovarian cancer progression, metastasis, and main pathways: ceRNA and alternative mechanisms. Int J Mol Sci. 2020;21(22):21. doi: 10.3390/ijms21228855
- Luo H, Xu C, Le W, et al. lncRNA CASC11 promotes cancer cell proliferation in bladder cancer through miRNA-150. J Cell Biochem. 2019;120(8):13487–13493. doi: 10.1002/jcb.28622
- Chen C, Luo Y, He W, et al. Exosomal long noncoding RNA LNMAT2 promotes lymphatic metastasis in bladder cancer. J Clin Invest. 2020;130(1):404–421. doi: 10.1172/JCI130892
- Ke M. Identification and validation of apparent imbalanced Epi-lncRnas prognostic model based on multi-omics data in pancreatic cancer. Front Mol Biosci. 2022;9:860323. doi: 10.3389/fmolb.2022.860323
- Zhu J, Wang H, Ma T, et al. Identification of immune-related genes as prognostic factors in bladder cancer. Sci Rep. 2020;10(1):19695. doi: 10.1038/s41598-020-76688-w
- Liu J, Lichtenberg T, Hoadley KA, et al. An integrated TCGA pan-cancer clinical data resource to drive high-quality survival outcome analytics. Cell. 2018;173(2):400–416.e11. doi: 10.1016/j.cell.2018.02.052
- Soejima M, Koda Y. TaqMan-based real-time PCR for genotyping common polymorphisms of haptoglobin (HP1 and HP2). Clin Chem. 2008;54(11):1908–1913. doi: 10.1373/clinchem.2008.113126
- Sun D, Chen C, Hu W, et al. Low expression level of ASK1-interacting protein-1 correlated with tumor angiogenesis and poor survival in patients with esophageal squamous cell cancer. Onco Targets Ther. 2018;11:7699–7707. doi: 10.2147/OTT.S178131
- Zhu CZ, Ting HN, Ng KH, et al. A review on the accuracy of bladder cancer detection methods. J Cancer. 2019;10(17):4038–4044. doi: 10.7150/jca.28989
- Li Y, Li G, Guo X, et al. Non-coding RNA in bladder cancer. Cancer Lett. 2020;485:38–44. doi: 10.1016/j.canlet.2020.04.023
- Liu J, Wu Z, Han D, et al. Mesencephalic astrocyte-derived neurotrophic factor inhibits liver cancer through small ubiquitin-related modifier (Sumo)ylation-related suppression of NF-κB/Snail signaling pathway and epithelial-mesenchymal transition. Hepatology. 2020;71(4):1262–1278. doi: 10.1002/hep.30917
- Bao Z, Zeng W, Zhang D, et al. SNAIL Induces EMT and lung metastasis of tumours secreting CXCL2 to promote the invasion of M2-type immunosuppressed macrophages in colorectal cancer. Int J Biol Sci. 2022;18(7):2867–2881. doi: 10.7150/ijbs.66854
- Ma X, Qi W, Yang F, et al. Deubiquitinase JOSD1 promotes tumor progression via stabilizing Snail in lung adenocarcinoma. Am J Cancer Res. 2022;12(5):2323–2336.
- Zhan T, Chen M, Liu W, et al. MiR-455-3p inhibits gastric cancer progression by repressing Wnt/β-catenin signaling through binding to ARMC8. BMC Med Genomics. 2023;16(1):155. doi: 10.1186/s12920-023-01583-y
- Chen L, Xie X, Wang T, et al. ARL13B promotes angiogenesis and glioma growth by activating VEGFA-VEGFR2 signaling. Neuro Oncol. 2023;25(5):871–885. doi: 10.1093/neuonc/noac245
- Rubtsova SN, Zhitnyak IY, Gloushankova NA. Dual role of E-cadherin in cancer cells. Tissue Barriers. 2022;10(4):2005420. doi: 10.1080/21688370.2021.2005420
- Li H, Chen J, Li Z, et al. S100A5 attenuates efficiency of anti-PD-L1/PD-1 immunotherapy by inhibiting CD8+T cell-mediated anti-cancer immunity in bladder carcinoma. Adv Sci (Weinh). 2023;10(25):e2300110. doi: 10.1002/advs.202300110
- Feng L, Yang J, Zhang W, et al. Prognostic significance and identification of basement membrane-associated lncRNA in bladder cancer. Front Oncol. 2022;12:994703. doi: 10.3389/fonc.2022.994703
- Wang X, Shojaie A, Zhang Y, et al. Exploratory plasma proteomic analysis in a randomized crossover trial of aspirin among healthy men and women. PLOS ONE. 2017;12(5):e0178444. doi: 10.1371/journal.pone.0178444
- Bonzano S, Crisci I, Podlesny-Drabiniok A, et al. Neuron-astroglia cell fate decision in the adult mouse hippocampal neurogenic niche is cell-intrinsically controlled by COUP-TFI in vivo. Cell Rep. 2018;24(2):329–341. doi: 10.1016/j.celrep.2018.06.044
- Xu M, Qin J, Tsai SY, et al. The role of the orphan nuclear receptor COUP-TFII in tumorigenesis. Acta Pharmacol Sin. 2015;36(1):32–36. doi: 10.1038/aps.2014.86
- Liu Y, Chen S, Cai K, et al. Hypoxia-induced long noncoding RNA NR2F1-AS1 maintains pancreatic cancer proliferation, migration, and invasion by activating the NR2F1/AKT/mTOR axis. Cell Death Dis. 2022;13(3):232. doi: 10.1038/s41419-022-04669-0
- Sosa MS, Parikh F, Maia AG, et al. NR2F1 controls tumour cell dormancy via SOX9- and RARβ-driven quiescence programmes. Nat Commun. 2015;6(1):6170. doi: 10.1038/ncomms7170
- Pan M, Shi J, Yin S, et al. The effect and mechanism of LINC00663 on the biological behavior of glioma. Neurochem Res. 2021;46(7):1737–1746. doi: 10.1007/s11064-021-03311-3
- Ding J, Zhao J, Huan L, et al. Inflammation-induced long intergenic noncoding RNA (LINC00665) increases malignancy through activating the double-stranded RNA–activated protein kinase/nuclear factor Kappa B pathway in hepatocellular carcinoma. Hepatology. 2020;72(5):1666–1681. doi: 10.1002/hep.31195
- Zhu Q, Li J, Wu Q, et al. Linc-OIP5 in the breast cancer cells regulates angiogenesis of human umbilical vein endothelial cells through YAP1/Notch/NRP1 signaling circuit at a tumor microenvironment. Biol Res. 2020;53(1):5. doi: 10.1186/s40659-020-0273-0
- Luo H, Yang L, Liu C, et al. TMPO-AS1/miR-98-5p/EBF1 feedback loop contributes to the progression of bladder cancer. Int J Biochem Cell Biol. 2020;122:105702. doi: 10.1016/j.biocel.2020.105702
- Fu XD, Liu CY, Liu YL, et al. LINC00261 regulates EBF1 to suppress malignant progression of thyroid cancer. Eur Rev Med Pharmacol Sci. 2021;25(24):7626–7634. doi: 10.26355/eurrev_202112_27609