
ABSTRACT
The TATA-box binding protein (TBP) is the sole transcription factor common in the initiation complexes of the three major eukaryotic RNA Polymerases (Pol I, II and III). Although TBP is central to transcription by the three RNA Pols in various species, the emergence of TBP paralogs throughout evolution has expanded the complexity in transcription initiation. Furthermore, recent studies have emerged that questioned the centrality of TBP in mammalian cells, particularly in Pol II transcription, but the role of TBP and its paralogs in Pol I transcription remains to be re-evaluated. In this report, we show that in murine embryonic stem cells TBP localizes onto Pol I promoters, whereas the TBP paralog TRF2 only weakly associates to the Spacer Promoter of rDNA, suggesting that it may not be able to replace TBP for Pol I transcription. Importantly, acute TBP depletion does not fully disrupt Pol I occupancy or activity on ribosomal RNA genes, but TBP binding in mitosis leads to efficient Pol I reactivation following cell division. These findings provide a more nuanced role for TBP in Pol I transcription in murine embryonic stem cells.
Classification:
Introduction
Eukaryotic RNA transcription is mainly directed by three distinct complexes: RNA Polymerase I, II and III (Pol I, II and III). Pol I is dedicated to transcribing the precursor gene for the three large ribosomal RNAs (rRNAs), whereas Pol II largely directs the transcription of protein coding mRNAs, and Pol III is responsible for transcribing transfer RNAs (tRNAs) and 5S rRNAs [Citation1]. Although initiation by each RNA Pol requires different sets of general transcription factors, the TATA-box binding protein (TBP) is uniquely common to all three initiation complexes [Citation2,Citation3]. In general, TBP binds onto DNA promoters to recruit Pol-specific general transcription factors and ensure proper polymerase loading. However, the role of TBP in each initiation complex has become more nuanced throughout evolution. In budding yeast, inactivation or nuclear depletion of TBP has been shown to decrease the transcription activity of all three RNA Pols [Citation4–7]. However, in mammalian cells such as mouse embryonic stem cells (mESCs) and human HAP1 cells, acute depletion of TBP resulted in little to no changes in Pol II occupancy and transcription, whereas Pol III-mediated occupancy and transcription of tRNAs was severely impacted [Citation8,Citation9]. TBP has also been shown to facilitate reactivation of Pol II transcription following mitosis in mESCs [Citation10], though such mitotic bookmarking function remains unclear for Pol I or III transcription. Moreover, TBP paralogs have further increased the complexity of TBP-mediated RNA Pol initiation throughout evolution [Citation11–15]. In mESCs, the TBP paralog TRF2 localizes on to the promoter of Pol II genes, but does not functionally replace TBP for Pol II-mediated transcription [Citation8]. The role of TBP paralogs in Pol I or III transcription in mammalian cells remains unclear.
Pol I-transcribed rRNA comprises the largest fraction of RNAs, composing up to 80–90% of the RNA molecules in eukaryotic cells [Citation16], and are central components of the ribosome machinery that carry out protein synthesis. In mammals, Pol I initiation begins with the binding of the upstream binding factor (UBF) onto the promoters of rRNA genes (rDNA), organized as hundreds of tandem repeats in multiple chromosomes [Citation17,Citation18]. DNA-bound UBF then recruits the selective factor 1 (SL-1, also known as transcription initiation factor IB, TIF-IB), which is a complex composed of TBP, TAF12, TAF1A, TAF1B, TAF1C, and TAF1D [Citation19–21]. Binding of SL-1 then leads to the recruitment of Pol I in complex with Rrn3 to the rDNA promoter to begin transcription [Citation22–24]. In vitro experiments with yeast extracts have shown that basal levels of Pol I transcription can be achieved in the absence of TBP, but full activation of rRNA transcription still requires TBP [Citation7]. However, overexpression of TBP in yeast cells can overcome depletion of upstream transcription factors to support rRNA transcription, highlighting a nuanced role for TBP in Pol I-mediated transcription in vivo [Citation25].
In this study, we revisit the role of TBP in the transcription initiation of rRNAs in mESCs. We report that the TBP paralog TRF2 only weakly associates to rDNA promoters and does not functionally replace TBP for Pol I transcription. Furthermore, rapid depletion of TBP in mESCs results in minor effects in nascent rDNA transcription, despite a ~30% decrease in Pol I occupancy. Surprisingly, TBP binds more strongly on rDNA promoters during mitosis compared to interphase, and depletion during mitosis affects the efficacy of Pol I reactivation following cell division. Taken together, our data suggests that TBP promotes efficient Pol I reactivation from a mitotic state, but is not strictly required for reaching full Pol I transcription.
Results
TBP interacts strongly with rDNA promoters, while TRF2 only weakly associates with the spacer promoter
The mouse genome contains two TBP paralogs, the Tbpl1 and Tbpl2 genes that encode for TRF2 and TRF3, respectively [Citation26–28]. In mESCs, only TRF2 is expressed [Citation8]. Although TRF2 has been shown to bind to a subset of Pol II genes in Drosophila cells and mouse testis [Citation27,Citation29], in mESCs, TRF2 binds to all active Pol II genes but cannot functionally replace TBP [Citation8]. We therefore questioned whether TRF2 can bind onto Pol I promoters and act redundantly to TBP in mESCs by reanalysing previously published chromatin profiling data for TBP (C64 mESCs, see Key Resources Table) and TRF2 (B8HA mESCs) in a homozygous mAID-TBP cell line [Citation8,Citation10], which allows for rapid depletion of TBP upon indole-3-acetic acid (IAA) treatment [Citation30]. In this previous study, TBP depletion was confirmed by performing Cleavage Under Targets and Tagmentation (CUT&Tag), a high resolution chromatin profiling technique [Citation31]. However, the commonly used mm10 genome contains highly repetitive rDNA sequences, which consists of repeated arrays of tandem rDNA repeats, making alignment using standard aligners difficult. Each transcription unit is separated by the Intergenic Spacer (IGS) and is composed of Promoters, Enhancer repeats, External and Internal Transcribed Spacers (ETS and ITS respectively), ribosomal RNAs (18S, 5.8S and 28S), and the Transcription Termination Factor binding sites (TTF1 sites) [Citation32,Citation33]. To enable genomic analysis of this repetitive genome, previous work has generated a customized human and mouse genome where the rDNA locations and reads were masked and collapsed onto a single custom annotated rDNA locus (chrR) [Citation32]. We therefore realigned the C64 cell line TBP CUT&Tag data to the recently established mm10-rDNA genome [Citation32] and normalized the signal by reads per kilobase millions (RPKM). We observed strong binding of the cumulative TBP reads under control conditions at the rDNA spacer and 47S promoter with high reproducibility (, Figure S1A). Additionally, treatment of homozygous mAID-TBP cell line (C64) cells with 6 hours of IAA show a strong depletion of bound TBP on the rDNA promoter, demonstrating the efficiency of TBP depletion and accurate alignment of our TBP data to the custom mm10-rDNA genome ().
Figure 1. TBP strongly binds onto the promoters of rDNA, while TRF2 only weakly associates with rDNA promoters.
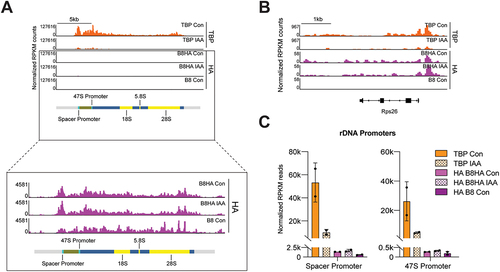
We next examined the TBP paralog TRF2. We had previously generated an HA-tagged TRF2 stable over-expressing mESCs (B8HA) in a parental cell line with the endogenous TRF2 gene knockout (B8). CUT&Tag was performed on both cell lines using the HA antibody [Citation8]. Aligning the RPKM normalized data to the rDNA genome showed weak TRF2 signal (2.4-fold above background levels) at the Spacer Promoter, but not at the 47S Promoter ( B8HA versus B8, Figure S1B,D). This weaker binding at the Spacer Promoter contrasts strikingly with the previously shown ability of TRF2 to bind onto Pol II gene promoters [Citation8], such as the Rps26 promoter, which showed a pronounced peak (60-fold above background levels) at the promoter (). Furthermore, we found that depletion of TBP in the B8HA cell line had no significant effects in the binding occupancy of TRF2 at Pol I promoters (, Figure S1D), suggesting that TRF2 binding was not induced by lack of TBP. To further quantify the CUT&Tag data, we plotted the average TBP and TRF2 signal in the rDNA promoter and gene regions separately, measured by averaging the RPKM normalized reads in 10 bp bins for each region. We observed that TBP occupancy was 10-fold higher at the promoters compared to genic regions, and that IAA-treatment reduced TBP occupancy by 80% (90% for replicate 1 and 70% for replicate 2) at both the Spacer Promoter and 47S Promoter (, Figure S1C). The levels for HA-tagged TRF2 and the negative control B8 sample remained less than ~ 7% of TBP levels throughout all regions (, Figure S1C). Additionally, TRF2 knockout cells did not show any growth defects, suggesting that TRF2 does not play a major role in RNA Pol I transcription or perhaps any of the RNA Polymerases [Citation8]. Taken together, these results suggest that the mAID-TBP mESCs enables rapid TBP depletion in the rDNA genome, and that unlike in mRNA promoters, the TRF2 binding at rDNA promoters is much weaker and may not play a significant role in RNA Pol I transcription.
Effects of TBP depletion on Pol I occupancy and activity
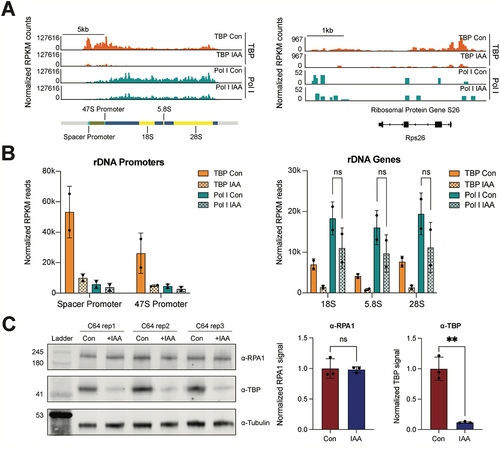
To investigate the effects of TBP on Pol I occupancy, we performed Pol I CUT&Tag on control and IAA-treated C64 cells in two biological replicates, aligned the data to the custom mm10-rDNA genome and normalized the signal by RPKM. Pol I binds to the rDNA loci with high reproducibility across replicates ( left panel, Figure S1A), but not at Pol II coding genes such as Rps26 ( right panel), suggesting strong specificity. We next quantified the Pol I averaged RPKM read counts mapped at the annotated rDNA promoters and gene bodies, and observed the converse profile to TBP with high levels of Pol I in rDNA gene bodies and low levels at the promoters (). Upon TBP depletion with 6 hours of IAA treatment, we observe an average 40% (30% replicate 1 and 50% replicate 2) decrease in Pol I levels on rDNA genes across replicates as averaged across annotated regions () or as a heatmap binned by 10bp with and without IAA-treatment (Figure S2A), despite no changes in the Pol I subunit RPA1 protein levels (). This trend in Pol I occupancy confirms previous in vitro studies showing that TBP is not strictly required for Pol I recruitment [Citation7].
Figure 2. TBP depletion slightly impairs the binding of Pol I on rDNA genes.
To measure Pol I transcriptional activity on rDNAs, we analysed two independent data sets performed on mAID-TBP cells under control and TBP-depleted conditions. The first is spike-in normalized native elongating transcript sequencing (NET-seq) [Citation8], a technique that captures nascent RNA from elongating RNA polymerases at single nucleotide resolution [Citation34]. This assay used custom-designed biotinylated oligos that were complementary to the most abundant set of snRNAs, snoRNAs, and some rRNAs specific to the assay for depletion prior to sequencing. The second is data from chromatin-associated RNA-seq (chrRNA-seq) with ERCC spike-in controls, an orthogonal approach that captures newly transcribed chromatin-associated RNA through biochemical fractionation, performed on C64 mESCs in control and TBP-depleted conditions [Citation10]. This assay used the Illumina Ribo-Zero Plus rRNA Depletion kit to remove abundant mature rRNAs prior to sequencing. Both data sets were normalized to their respective spike-in controls and mapped to the custom mm10 rDNA genome (, Figure S3A). The differences in profiles between the data sets are likely due to the differing mature RNA depletion methods used in each assay. Although the Ribo-Zero kit is more effective at depleting the 18S signal in the chrRNA-seq compared to the custom designed biotinylated oligos in the NET-seq, these regions still contain abundant reads for quantitative analysis (, boxed regions). To quantify the signal, we first averaged the normalized NET-seq and chrRNA-seq reads across the spacer and maturely-retained rDNA regions and plotted the logged values (, Figure S3B). We also quantified NET-seq and chrRNA-seq read counts for annotated Pol I rRNAs obtained from the UCSC genome browser (https://genome.ucsc.edu/) [Citation35] and displayed the logged counts as a scatter plot (). In both analyses, we observed no significant changes in rRNA reads upon TBP depletion, which contrasts strikingly to the observed ~ 90% decrease in Pol III binding and activity after similar levels of TBP depletion [Citation8].
Figure 3. TBP depletion does not affect global transcription of rRnas, but may affect the kinetics of transcription.
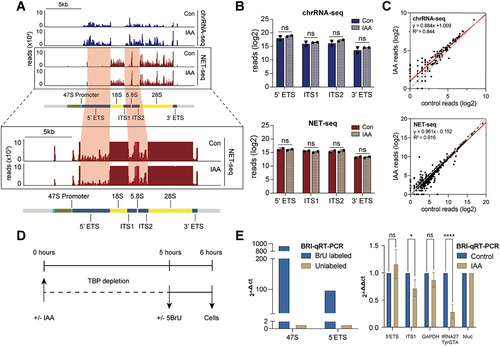
To directly measure changes in new transcription, we pulse-labelled newly transcribed RNA using 5’-bromo-uridine (5-BrU), and performed immunoprecipitation (IP) against BrU followed by quantitative reverse transcribed PCR analysis (BRI-qRT-PCR) in two biological replicates (), using in vitro labelled and transcribed NanoLuc Luciferase (NanoLuc) RNAs for spike in normalization. The assay showed strong specificity when IP with anti-BrU was performed on labelled versus unlabelled samples (), and when anti-BrU signal is compared to anti-IgG IP of labelled samples (Figure S3C right panel). To detect changes in newly transcribed rRNAs when TBP is depleted, we quantified spike-in normalized BrU incorporation at various targets. First, Gapdh BrU-labelled RNA levels remained unchanged, whereas the tRNA gene, TyrGTA, was severely impaired, confirming previous studies on the role of TBP in Pol II and III transcription, respectively [Citation8]. Next, TBP depletion resulted in no significant changes in the levels of the 5’ETS region, but a significant ~ 30% decrease in ITS1 region (). Normalization to Gapdh levels showed a similar trend (Figure S3C left panel). The difference between 5’ETS and ITS1 suggests that TBP depletion may affect the kinetics of Pol I transcription. Nevertheless, despite the 30–40% decrease in Pol I occupancy, the NET-seq, chrRNA-seq and BRI-qRT-PCR analyses indicate that TBP depletion minimally affects Pol I transcription of rRNAs in mESCs, in stark contrast to its effects on Pol III transcription.
Mitotic binding of TBP on rDNA promotes efficient transcriptional reactivation
Similar to Pol II, Pol I transcription is globally inhibited during mitosis [Citation36,Citation37]. Given that TBP had been shown to maintain stable binding at Pol II promoters during mitosis, which is required for efficient reactivation of Pol II genes [Citation10], we sought to examine the role of TBP in Pol I transcription following mitosis. We first reanalysed previously published TBP ChIP-seq data in C64 asynchronous and mitotic cells. After normalizing by RPKM and realignment to the rDNA genome, we observed a much stronger binding of TBP to the rDNA genome in mitotic versus asynchronous cells (). In contrast, the global average of TBP binding for Pol II genes has been shown to be slightly decreased during mitosis compared to asynchronous cells [Citation10], consistent with our re-analysis on Gapdh and Myc (Figure S4A). These results suggest that TBP may bookmark rDNA genes more strongly than Pol II genes.
Figure 4. TBP bookmarks rDNA genes during mitosis for efficient reactivation of rDNA transcription.
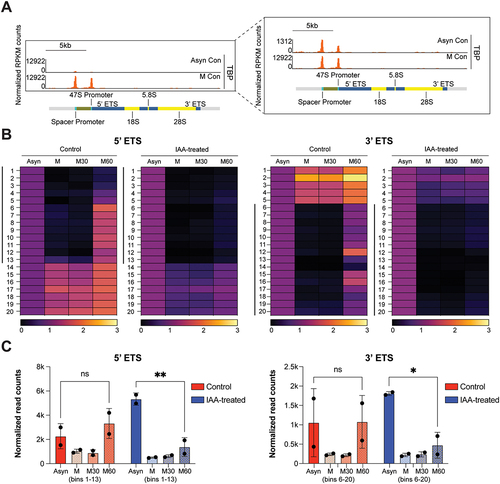
How does mitotic TBP binding affect reactivation of rDNA genes following mitosis? To address this question, we reanalysed previously published chrRNA-seq data of asynchronous (Asyn), mitotic (M), and 30 (M30) and 60 (M60) mins after release from mitotic arrest in both control and IAA-treated conditions with two biological repeats (Figure S4B–C) [Citation8]. To quantify the signal, we divided each annotated rDNA loci into equal bins and displayed the chrRNA-seq data as a heatmap. We observed that the intergenic regions (5’ETS, ITS1, ITS2, 3’ETS, TTF1) displayed the greatest decrease in chrRNA levels in mitosis, followed by reactivation 60 mins after mitotic release (Figure S4D). Focusing on these intergenic regions, we normalized the length of each region, segmented each region into 20 bins and displayed the RPKM normalized chrRNA-seq data per bin as a heatmap or quantified and averaged as a bar plot (). We observed a major loss of chrRNA signal in certain bins for the 5’ETS (bins 1–13) and 3’ ETS (6–20) during mitosis, which then regained levels in 60 mins after mitotic release, demonstrating efficient mitotic arrest and release (). However, other regions displayed maintained or increased chrRNA levels during mitosis (, bins 14–20 in 5’ETS and bins 1–5 in 3’ETS, Figure S4C–D). Given that Pol I has been shown to be inactivated during mitosis, the lack of decrease in chrRNA signal in these regions during mitosis is likely indicative of contamination from highly abundant rRNAs.
We then examined the IAA-treated conditions in asynchronous, mitotic and 30 and 60 min after release from mitotic arrest. We observed a similar trend to control conditions, where chrRNA levels decreased during mitosis and remained low 30 mins after mitotic release (Figure S4C). However, in the M60 IAA samples, we observed a distinct lack of transcription reactivation in certain regions compared to M60 control samples (Figure S4C), which is further highlighted in the intergenic regions (Figure S4D). The lack of reactivation following TBP depletion is more apparent in the heatmaps of intergenic regions, separated into 20-bins or quantified and averaged as a bar plot (). The bins that experienced a near complete loss of signal for the 5’ETS and 3’ETS during mitosis in control samples (bins 1–13 and 6–20, respectively), experienced a delay in reactivation 60 mins after mitotic release compared to control, suggesting a specific role for TBP in Pol I transcription reactivation following mitosis (). Collectively, our results suggest that although TBP is not required for general Pol I transcription of rRNAs, its bookmarking function may facilitate efficient reactivation of Pol I transcription after cell division.
Discussion
In this study, we induced rapid depletion of TBP via the mAID system and examined the role of TBP in Pol I transcription in mESCs. We report that TRF2 only weakly interacts with the Spacer Promoter of rDNAs and that TBP remains strongly bound to the rDNA promoters, similar to its binding at RNA Pol II promoters. We also report that, though Pol I occupancy is somewhat decreased upon TBP deletion, nascent rRNA production largely remains unaffected. Surprisingly, we find that mitotic TBP binding promotes efficient Pol I reactivation after mitosis.
Despite sharing only ~40% amino acid conservation to the core domain of TBP, TRF2 is predicted to also fold into a similar saddle-shaped structure (AlphaFold P62340) that is characteristic of TBP [Citation26,Citation38]. Historically, TRF2 has been shown to govern its own exclusive subset of Pol II genes when expressed in tandem with TBP, and in certain species it can activate transcription for TATA-less Pol II promoters [Citation12,Citation29]. In mESCs, TRF2 has the ability to bind onto mRNA promoters in tandem with TBP, regardless of the presence of a TATA-box [Citation8]. Our results showing that TRF2 only weakly interacts with the Spacer Promoter suggest that, unlike the diversity in Pol II pre-initiation complexes that accommodates paralogs of distinct subunits, the Pol I machinery has maintained high conservation by maintaining its strong preference for TBP.
Combined with previous studies, we show that in mESCs, Pol I and Pol II transcription are largely unaffected by a significant decrease in TBP levels, but that Pol III transcription of tRNA genes is highly dependent on the presence of TBP. Furthermore, the near complete inhibition of Pol III in mESCs [Citation8], despite similarly incomplete TBP depletion, serves as stark contrast to its minor effect observed here for Pol I transcription. Through sequence and structural analyses, Pol I is believed to be more divergent from Pol II and Pol III initiation mechanisms [Citation39–42]. It is therefore intriguing to speculate why Pol I would be more similar to Pol II in their TBP-independent transcription compared to Pol III. In the case of Pol II, we previously showed that TFIID, consisting of 13 TAF subunits, forms in the absence of TBP, suggesting that the TAFs have compensatory roles in mammalian transcription [Citation8]. In Pol I initiation, TBP is also in a complex with five Pol I-specific TAFs [Citation19–21], whereas in Pol III initiation, TBP is in complex with only two other factors that do not share homology to TAFs [Citation42]. Perhaps the increased number of TAFs in Pol I and II initiation complexes provide additional redundancies, allowing for looser requirements for TBP in these systems.
Our findings that TBP is not strictly required for general Pol I transcription, but plays a role in efficient reactivation after mitosis, are highly reminiscent of recent studies on the role of TBP in Pol II transcription. The role of TBP during mitosis is intriguing. Previous studies have shown that TBP is somewhat unique among TFs for having a long residence time on DNA, on the order of minutes, in mammalian cells [Citation10,Citation43,Citation44] and in yeast, whereas most other TFs bind on the order of seconds [Citation44,Citation45]. Perhaps such stable binding allows for TBP to overcome a transcriptionally repressive mitotic environment as the cells exit mitosis, providing a stable platform to assemble the initiation machinery in the critical transition period. Once the environment has fully transitioned into a more permissive state during G1, the advantage that TBP provides may no longer be necessary. In this way, the role of mammalian TBP in Pol I transcription may be highly context-dependent.
Materials and Methods
Key resources table
Cell Culture
For all experiments, the mouse ES cell line C64, B8, or B8HA was used. Cell lines were generated as previously stated [Citation8,Citation10]. ES cells were cultured on 0.1% gelatin-coated plates in ESC media KnockOut DMEM (Corning) with 15% FBS (HyClone), 0.1 mM MEM non-essential amino acids (Gibco), 2 mM GlutaMAX (Gibco), 0.1 mM 2-mercaptoethanol (Sigma-Aldrich) and 1000 units/ml of ESGRO (Chem-icon). ES cells were fed daily, cultured at 37°C in a 5% CO2 incubator, and passaged every two days by trypsinization. For endogenously-tagged mAID-TBP C64 and B8 cells, TBP degradation was performed by addition of indole-3-acetic acid (IAA) at 500 μM final concentration to a confluent plate of cells for 6 hours.
Western blot antibodies
Primary antibodies: α-TBP 1:3000 (Abcam ab51841), α-Tubulin 1:7000 (Abcam ab6046), and α-RPA1 (sc -48,385). Secondary antibodies: IRDye 800CW Goat anti-mouse (Licor 926–32210), IRDye 800CW Goat anti-rabbit (Licor 925–32211), IRDye 680RD Goat anti-mouse (Licor 926–68070), or IRDye 680RD Goat anti-rabbit (Cedarlane 926–68701).
Processing and alignment of NET-seq reads
NET-seq data was processed as previously described [Citation8], but with the following modifications. Reads were trimmed and aligned to the custom mm10-rDNA genome [Citation32] using STAR (v.2.7.3a). Read counts across the rRNAs were generated from Drosophila spike-in normalized bam files using bedtools and analysed with GraphPad Prism [Citation46]. The list of annotated Pol I rRNAs was obtained from the UCSC genome table browser with the following settings: clade: mammal, genome: mouse, assembly: mm10, group: all tables, database: mm10, table: rmsk, filter: repClass does match rRNA.
Processing and alignment of chrRNA-seq reads
ChrRNA-seq data was processed as previously described [Citation10], but with the following modifications. Reads were trimmed and aligned to the custom mm10-rDNA genome [Citation32] using Tophat2. Bigwig files for IGV gene tracks were ERCC spike-in normalized and generated using DeepTools [Citation47]. Read counts across the rRNAs were generated from normalized bam files using bedtools and analysed with GraphPad Prism [Citation46]. Heatmaps were generated using the DeepTools suite by scaling the regions and binding each region by 100bp.
Processing and alignment of ChIP-seq reads
TBP ChIP-seq data was processed as described [Citation10], but with the following modifications. Reads were aligned to the custom mm10-rDNA genome [Citation32] using Bowtie2. Bigwig files for IGV gene tracks were RPKM normalized and generated using DeepTools [Citation47]. Replicates were merged using BigWigMerge.
CUT&Tag protocol
CUT&Tag was done as previously described [Citation8], using the RNA Pol I antibody (sc -48,385).
Processing and alignment of CUT&Tag reads
TBP, TRF2-HA and Pol I CUT&Tag data was processed as described [Citation8], but with the following modifications. Reads were aligned to the custom mm10-rDNA genome [Citation32] using bowtie2 alignment. Bigwig files for IGV tracks were RPKM normalized using the entire custom mm10-rDNA genomic regions and generated using DeepTools [Citation47]. Replicates were merged using BigWigMerge. Heatmaps were generated using the DeepTools suite. RPKM read count matrices were generated using DeepTools suite where RPKM normalized bigwig files were sorted into 10bp bins and rDNA loci (promoters and genes) were stretched to the same size using the scale-region command. RPKM counts were then averaged for each replicate and analysed using GraphPad Prism.
In vitro transcription of the NanoLuc Luciferase (Nluc) spike-in product
The Nluc plasmid was kindly provided to us from Dr. Eric Jan and was already linearized using BbsI digestion. In vitro transcription was performed using 2.5 µg of Nluc plasmid, 12.5 μL rNTP, with 5-Bromouridine 5′-triphosphate sodium (BrUTP) substituted for uridine 5’-triphosphate in he rNTP mix, 5 μL 10× T7buffer (B9012S), 1.25 μL RNase inhibitor (M0314S), 0.75 μL T7 polymerase (gift from Dr. Eric Jan), 1 μL YIPP phosphatase (gift from Dr. Eric Jan), and DEPC water up to 50 μL. The RNA sample was then isolated using the Monarch® RNA Cleanup Kit (T2040L) and concentration was measured by DeNovix Nanodrop.
BRI-qRT-PCR
Protocol for BRI-qRT-PCR was adapted from BRIC-seq published by Imamachi et al. (Methods Volume 67, Issue 1 A genome-wide approach for determining RNA stability in mammalian cells). Briefly, 150,000 ES cells were plated and cultured on 0.1% gelatin-coated plates in ESC media KnockOut DMEM (Corning) with 15% FBS (HyClone), 0.1 mM MEM non-essential amino acids (Gibco), 2 mM GlutaMAX (Gibco), 0.1 mM 2-mercaptoethanol (Sigma-Aldrich) and 1000 units/ml of ESGRO (Chem-icon), and grown on a 6-well plate until 80% confluency. Cells were then treated with either indole-3-acetic acid (IAA) at 500 μM final concentration or the vehicle control DMSO for up to 6 hours and BrU labelled at a final concentration of 1 mM for the last hour of the 6 hours treatment. Cells were then collected and 1 µg of the Nluc spike-in was added in before TRIzol extraction followed by measurement of concentration and quality via DeNovix Nanodrop. Protein G dynabeads conjugated with anti-Bromodeoxyuridine antibody were prepared exactly as stated in the protocol. BrU labelled samples were then heated at 80°C for 2 minutes followed by immediate cooling in an iced-water bath. BrU samples were then incubated with conjugated beads at 4°C as stated in the protocol, but for 3 hours and washed 6X with ice-cold BSA/Triton/PBS. Samples were then resuspended in 90 µL 10 mM Tris – HCl at pH 7.4 and 6.25 mM EDTA and isolated via TRIzol® LS Reagent, following the manufacturer’s protocol and resuspended in 25 µL of DEPC-treated water. The entire sample was DNase treated using Promega RQ1 RNase-Free DNase kit (M6101), with scaled up volume and then reverse transcribed using the New England BioLabs LunaScript® RT SuperMix Kit (E3010), following the manufacturer’s protocol. qPCR was then performed using Luna® Universal qPCR Master Mix (M3003) using 1 µL of sample. Samples were run on the QuantStudioTM 3 Real-Time PCR System. Primers used in qPCR are listed in Table S1.
Author contribution
Conceptualization: JZJK, TFN, SST
Methodology: JZJK, TFN
Investigation: JZJK, TFN
Visualization: JZJK, TFN
Acquisition: JZJK, SST
Project administration:
Supervision: SST
Writing – original draft: JZJK, TFN, SST
Writing – review and editing: JZJK, TFN, SST
Data and materials availability
All sequencing data have been deposited in Gene Expression Omnibus. All other data sets are available in the manuscript or in the supplementary materials. GEO IDs are in the Key Resources Table.
Supplemental Material
Download TIFF Image (29.7 MB)Supplemental Material
Download TIFF Image (15.1 MB)Supplemental Material
Download TIFF Image (11.1 MB)Supplemental Material
Download TIFF Image (18.9 MB)Acknowledgements
We thank R. Vander Werff and T. Stach (BRC-seq, UBC) for Illumina sequencing and S. Flibotte (LSI Bioinformatics facility, UBC) for implementation of NET-seq analyses. This work was supported by Life Sciences Institute Cores (LSI Imaging and ubcFLOW Core), supported by the UBC GREx Biological Resilience Initiative. S.S.T is a Canada Research Chair Tier 2 in Mechanisms of Gene Regulation, and is supported by the Michael Smith Foundation for Health Research. We thank Daniel Andrews, Michelle Tong and Dr. Eric Jan for providing the Nluc plasmid and T7 RNA Polymerase and consulting us on how to perform in vitro transcription.
Disclosure statement
No potential conflict of interest was reported by the author(s).
Data availability statement
The data that support the findings of this study are openly available in Gene Expression Omnibus reference number GSE237001.
Supplementary material
Supplemental data for this article can be accessed online at https://doi.org/10.1080/15476286.2024.2375097
Additional information
Funding
References
- Roeder RG. 50+ years of eukaryotic transcription: an expanding universe of factors and mechanisms. Nat Struct Mol Biol. 2019;26(9):783–791. doi: 10.1038/s41594-019-0287-x
- Cormack BP, Struhl K. The TATA-binding protein is required for transcription by all three nuclear RNA polymerases in yeast cells. Cell. 1992;69(4):685–696. doi: 10.1016/0092-8674(92)90232-2
- Vannini A, Cramer P. Conservation between the RNA Polymerase I, II, and III transcription initiation machineries. Molecular Cell. 2012;45(4):439–446. doi: 10.1016/j.molcel.2012.01.023
- Petrenko N, Jin Y, Dong L, et al. Requirements for RNA polymerase II preinitiation complex formation in vivo. Elife. 2019. doi: 10.7554/eLife.43654
- Petrenko N, Jin Y, Wong KH, et al. Evidence that mediator is essential for Pol II transcription, but is not a required component of the preinitiation complex in vivo. Elife. 2017;6:e28447. doi: 10.7554/eLife.28447
- White RJ, Rigby PWJ, Jackson SP. The TATA-binding protein is a general transcription factor for RNA polymerase III. J Cell Sci. 1992;1992(Supplement_16):1–7. doi: 10.1242/jcs.1992.Supplement_16.1
- Steffan JS, Keys DA, Dodd JA, et al. The role of TBP in rDNA transcription by RNA polymerase I in Saccharomyces cerevisiae: TBP is required for upstream activation factor-dependent recruitment of core factor. Genes Dev. 1996;10(20):2551–2563. doi: 10.1101/gad.10.20.2551
- Kwan JZ, Nguyen TF, Uzozie AC, et al. RNA Polymerase II transcription independent of TBP in murine embryonic stem cells. Elife. 2023;12:e83810. doi: 10.7554/eLife.83810
- Santana JF, Collins GS, Parida M, et al. Differential dependencies of human RNA polymerase II promoters on TBP, TAF1, TFIIB and XPB. Nucleic Acids Res. 2022;50(16):9127–9148. doi: 10.1093/nar/gkac678
- Teves SS, An L, Bhargava-Shah A, et al. A stable mode of bookmarking by TBP recruits RNA polymerase II to mitotic chromosomes. Elife. 2018;7:e35621. doi: 10.7554/eLife.35621
- Akhtar W, Veenstra GJC. TBP2 is a substitute for TBP in Xenopus oocyte transcription. BMC Biol. 2009;7(1):45. doi: 10.1186/1741-7007-7-45
- Kedmi A, Zehavi Y, Glick Y, et al. Drosophila TRF2 is a preferential core promoter regulator. Genes Dev. 2014;28(19):2163–2174. doi: 10.1101/gad.245670.114
- Holmes MC, Tjian R. Promoter-selective properties of the TBP-related factor TRF1. Science. 2000;288(5467):867–870. doi: 10.1126/science.288.5467.867
- Rabenstein MD, Zhou S, Lis JT, et al. TATA box-binding protein (TBP)-related factor 2 (TRF2), a third member of the TBP family. PNAS. 1999;96(9):4791–4796. doi: 10.1073/pnas.96.9.4791
- Gazdag E, Rajkovic A, Torres-Padilla ME, et al. Analysis of TATA-binding protein 2 (TBP2) and TBP expression suggests different roles for the two proteins in regulation of gene expression during oogenesis and early mouse development. Reproduction. 2007;134(1):51–62. doi: 10.1530/REP-06-0337
- Palazzo AF, Lee ES. Non-coding RNA: what is functional and what is junk? Front Genet. 2015;6. doi: 10.3389/fgene.2015.00002
- Panov KI, Friedrich JK, Russell J, et al. UBF activates RNA polymerase I transcription by stimulating promoter escape. Embo J. 2006;25(14):3310–3322. doi: 10.1038/sj.emboj.7601221
- Jantzen H-M, Admon A, Bell SP, et al. Nucleolar transcription factor hUBF contains a DNA-binding motif with homology to HMG proteins. Nature. 1990;344(6269):830–836. doi: 10.1038/344830a0
- Tuan JC, Zhai W, Comai L. Recruitment of TATA-Binding protein–TAFI complex SL1 to the human ribosomal DNA Promoter is mediated by the carboxy-terminal activation domain of upstream binding factor (UBF) and Is regulated by UBF phosphorylation. Mol Cell Biol. 1999;19(4):2872–2879. doi: 10.1128/MCB.19.4.2872
- Learned RM, Cordes S, Tjian R. Purification and characterization of a transcription factor that confers promoter specificity to human RNA polymerase I. Mol Cell Biol. 1985;5(6):1358–1369. doi: 10.1128/MCB.5.6.1358
- Clos J, Buttgereit D, Grummt I. A purified transcription factor (TIF-IB) binds to essential sequences of the mouse rDNA promoter. Proc Natl Acad Sci U S A. 1986;83(3):604–608. doi: 10.1073/pnas.83.3.604
- Moorefield B, Greene EA, Reeder RH. RNA polymerase I transcription factor Rrn3 is functionally conserved between yeast and human. In: Proceedings of the National Academy of Sciences; 2000. 97. p. 4724–4729.
- Peyroche G, Milkereit P, Bischler N, et al. The recruitment of RNA polymerase I on rDNA is mediated by the interaction of the A43 subunit with Rrn3. Embo J. 2000;19(20):5473–5482. doi: 10.1093/emboj/19.20.5473
- Goodrich JA, Tjian R. TBP-TAF complexes: selectivity factors for eukaryotic transcription. Curr Opinion Cell Biol. 1994;6(3):403–409. doi: 10.1016/0955-0674(94)90033-7
- Aprikian P, Moorefield B, Reeder RH. TATA binding protein can stimulate core-directed transcription by yeast RNA polymerase I. Mol Cell Biol. 2000;20(14):5269–5275. doi: 10.1128/MCB.20.14.5269-5275.2000
- Akhtar W, Veenstra GJC. TBP-related factors: a paradigm of diversity in transcription initiation. Cell Biosci. 2011;1(1):23. doi: 10.1186/2045-3701-1-23
- Martianov I, Velt A, Davidson G, et al. TRF2 is recruited to the pre-initiation complex as a testis-specific subunit of TFIIA/ALF to promote haploid cell gene expression. Sci Rep. 2016;6(1):32069. doi: 10.1038/srep32069
- Persengiev SP, Zhu X, Dixit BL, et al. TRF3, a TATA-box-binding protein-related factor, is vertebrate-specific and widely expressed. Proc Natl Acad Sci U S A. 2003;100(25):14887–14891. doi: 10.1073/pnas.2036440100
- Isogai Y, Keles S, Prestel M, et al. Transcription of histone gene cluster by differential core-promoter factors. Genes Dev. 2007;21(22):2936–2949. doi: 10.1101/gad.1608807
- Holland AJ, Fachinetti D, Han JS, et al. Inducible, reversible system for the rapid and complete degradation of proteins in mammalian cells. Proc Natl Acad Sci U S A. 2012;109(49):E3350–3357. doi: 10.1073/pnas.1216880109
- Kaya-Okur HS, Wu SJ, Codomo CA, et al. CUT&Tag for efficient epigenomic profiling of small samples and single cells. Nat Commun. 2019;10(1). doi: 10.1038/s41467-019-09982-5
- George SS, Pimkin M, Paralkar VR. Construction and validation of customized genomes for human and mouse ribosomal DNA mapping. J Biol Chem. 2023;299(6):104766. doi: 10.1016/j.jbc.2023.104766
- Richard G-F, Kerrest A, Dujon B. Comparative genomics and molecular dynamics of DNA repeats in eukaryotes. Microbiol Mol Biol Rev. 2008;72(4):686–727. doi: 10.1128/MMBR.00011-08
- Mayer A, Churchman LS. Genome-wide profiling of RNA polymerase transcription at nucleotide resolution in human cells with native elongating transcript sequencing. Nat Protoc. 2016;11(4):813–833. doi: 10.1038/nprot.2016.047
- Nassar LR, Barber GP, Benet-Pagès A, et al. The UCSC genome browser database: 2023 update. Nucleic Acids Res. 2023;51(D1):D1188–D1195. doi: 10.1093/nar/gkac1072
- Klein J, Grummt I. Cell cycle-dependent regulation of RNA polymerase I transcription: the nucleolar transcription factor UBF is inactive in mitosis and early G1. Proc Natl Acad Sci USA. 1999;96(11):6096–6101. doi: 10.1073/pnas.96.11.6096
- Fu Y, Liu Y, Wen T, et al. Real-time imaging of RNA polymerase I activity in living human cells. J Cell Bio. 2022;222(1):e202202110. doi: 10.1083/jcb.202202110
- Nikolov DB, Hu S-H, Lin J, et al. Crystal structure of TFIID TATA-box binding protein. Nature. 1992;360(6399):40–46. doi: 10.1038/360040a0
- Khatter H, Vorländer MK, Müller CW. RNA polymerase I and III: similar yet unique. Curr Opin Struct Biol. 2017;47:88–94. doi: 10.1016/j.sbi.2017.05.008
- Lane WJ, Darst SA. Molecular evolution of multisubunit RNA polymerases: sequence analysis. J Mol Biol. 2010;395(4):671–685. doi: 10.1016/j.jmb.2009.10.062
- Werner M, Thuriaux P, Soutourina J. Structure–function analysis of RNA polymerases I and III. Curr Opin Struct Biol. 2009;19(6):740–745. doi: 10.1016/j.sbi.2009.10.005
- Han Y, Yan C, Fishbain S, et al. Structural visualization of RNA polymerase III transcription machineries. Cell Discov. 2018;4(1):40. doi: 10.1038/s41421-018-0044-z
- Zaidi HA, Auble DT, Bekiranov S. RNA synthesis is associated with multiple TBP-chromatin binding events. Sci Rep. 2017;7(1):39631. doi: 10.1038/srep39631
- Chen D, Hinkley CS, Henry RW, et al. TBP dynamics in living human cells: constitutive association of TBP with mitotic chromosomes. Mol Biol Cell. 2002;13(1):276–284. doi: 10.1091/mbc.01-10-0523
- Zhang Z, English BP, Grimm JB, et al. Rapid dynamics of general transcription factor TFIIB binding during preinitiation complex assembly revealed by single-molecule analysis. Genes Dev. 2016;30(18):2106–2118. doi: 10.1101/gad.285395.116
- Quinlan AR, Hall IM. BEDTools: a flexible suite of utilities for comparing genomic features. Bioinformatics. 2010;26(6):841–842. doi: 10.1093/bioinformatics/btq033
- Ramírez F, Ryan DP, Grüning B, et al. deepTools2: a next generation web server for deep-sequencing data analysis. Nucleic Acids Res. 2016;44(W1):W160–165. doi: 10.1093/nar/gkw257